1. Introduction
The comprehensive transportation hub often brings together multiple subway lines and is an important node for intra-city transfer; it is also an important station for high-speed railway and intercity railway lines, and an important window for urban inflow and outflow. Once the passenger flow of any mode of transportation increases significantly in a short period of time, these integrated transportation hubs are the congestion points of the entire transportation network, and there are also greater security risks. With the construction of urban rail transit, its traffic network is more complex and the passenger flow characteristics change more obviously, which poses new challenges to the planning, layout and use of passenger transport hubs. However, at the same time of development, the shortcomings of early urban traffic planning and design are gradually exposed. The internal transportation hubs of many cities have problems such as large differences in utilization, partial oversaturation, and insufficient utilization. To improve the service level, alleviate traffic congestion, and reasonably plan the location and utilization of transportation hubs, it is very important to carry out multi-modal comprehensive passenger flow forecasting for important comprehensive transportation hubs. It is helpful for the operation managers of different rail transit modes to better grasp the passenger flow trend, understand the characteristics of passenger flow changes, and achieve accurate passenger transport resources.
At present, most scholars pay attention to the passenger flow prediction of single transportation mode such as subway, bus and taxi. Or only consider the passenger flow forecast within the city, ignoring the inflow and outflow of population between cities. Because, considering a variety of modes of transportation, analysis of different modes of transportation travel rules and find internal contact is extremely difficult. First, different rail transit modes often belong to different operators, and their operation plans and operation methods are not uniform. It is difficult for researchers to obtain data from all parties at the same time. In addition, it is not easy to find the same rules under different operation management. Secondly, in general, the passenger demand of the subway in the hub station will not fluctuate greatly, but the passenger flow of the trunk railway and the intercity railway will be affected by many factors, thus showing an unstable state. Based on the above reasons, it is challenging to carry out rail transit passenger flow forecasting analysis under the background of multi-network integration.
Deep learning is an emerging prediction method, which shows good applicability in extracting nonlinear characteristics between data. The rail transit mode of multi-network integration is essentially a time series problem, and deep learning has significant advantages in processing passenger flow data with time series characteristics. However, the general deep learning algorithm is only used to process a kind of time series feature data, which has certain limitations in the multi task parallel training. Multi task learning model provides the possibility for processing multiple time series characteristic data and parallel training of the model. Combining multi task learning mechanism with deep learning, a passenger flow fusion prediction model for different rail transit modes is established. Through parallel training and parameter sharing and interaction, the passenger flow fusion prediction on trunk railways, intercity railways, subways and other networks is realized.
In this paper, we introduce multi attention to improve the convolution transformer framework, which can more effectively obtain the characteristics of time series data and predict passenger flow more accurately. At the same time, in order to obtain the correlation of passenger flow of trunk railway, intercity railway and subway and solve problems of overfitting, gradient disappearance and gradient explosion in the training process, we introduce the structure of residual network. Based on the above ideas, we built the multi-task learning framework of the improved Transformer. This research mainly has the following three aspects of results:
A multi-task learning framework is built to forecast trunk railway, intercity railway and subway passenger flow of rail transit under the multi-network integration. And the passenger flow characteristics of various rail transportation modes in large transport hubs are considered and analyzed comprehensively.
Under the Transformer framework, we simultaneously introduce the convolutional layer and multi head attention mechanism to improve and optimize, that is, the improved Transformer multi task learning framework, which trains and processes the trunk railway, intercity railway and subway data as different tasks.
The effectiveness and robustness of the improved Transformer model are tested and analyzed with the real data sets of Guangzhou Passenger Transport Hubs in China which have the most complex passenger flow. Compared with the classical prediction methods, the results show that the prediction method proposed in this study has higher accuracy and generalization.
The other chapters are as follows. Previous related research is in the second part. In the third part, we explain and define the specific problems studied, and introduce the structure and optimization process of the Res-Transformer model in detail. In the fourth part, we use the real data sets of China’s two major transportation hubs to verify the proposed model and compare the indicators with some existing models. The fifth part is the conclusions and shortcomings of this study.
2. Literature Review
2.1. Traditional Prediction Model
The passenger flow forecasting methods based on statistics are weighted historical average autoregressive model, time series passenger flow forecasting model, Kalman filter method and so on. ARIMA (Autoregressive Integrated Moving Average model) is the most classical time series prediction method, and also one of the most commonly used methods in engineering practice [
1]. It forecasts the trend of passenger flow data based on linear estimation. Kalman filter method is also commonly used in passenger flow forecast. The prediction accuracy can be greatly improved by modifying model parameters through prediction error, data deviation and nonparametric regression [
2]. However, this method cannot predict the change of passenger flow trend. When the passenger flow changes greatly, the prediction accuracy will be reduced. In order to solve the prediction error caused by nonlinear change characteristics of data, machine learning methods (such as SVM (Support Vector Machine)) have also been introduced into the prediction field. Compared with traditional statistics-based prediction models, their nonlinear fitting ability is better [
3].
The traditional prediction model based on statistics is applied more in highway field. The characteristics of rail transit are very different from those of highways. As rail transit such as subways increasingly enters the lives of passengers, more and more prediction models are applied to rail transit passenger flow prediction. The most widely used is machine learning models. Omrani (2015) et al. [
4] proposed and verified the prediction effectiveness of four machine learning methods by taking the travel mode of passengers in Luxembourg as an example. Tan (2019) et al. [
5] used machine learning methods to predict and analyze bus passenger flow. Liu (2020) et al. [
6] divided the adjacent bus stations into the same area, and regarded the bus passenger demand as a prediction whole. Improve the accuracy of regional passenger demand forecast by using the classification ability of support vector machine. Liu (2020) et al. [
7] proposed an MSP (Multi Sites Prediction) model to predict the subway passenger flow. This method simultaneously extracts Spatiotemporal-Correlation of multiple stations and predicts through a machine learning model combining SVM and RBF (Radial Basis Function). Machine learning methods are widely used in the research and application of passenger demand forecasting in the field of rail transit. However, the machine learning model is limited to regional prediction or prediction of several stations. When it is necessary to predict the traffic network with wider coverage and more stations, deep learning is more suitable.
Deep learning performs better at processing huge and complex data, which has a good application effect in the practice of forecasting mask based on large-scale data sets. Deep learning adopts the idea of human neuron computing. Artificial Neural Network is the foundation of deep learning. Zhang et al. (2017) [
8] proved that the Long short-term memory (LSTM) model is more accurate than BP (Back Propagation) neural network and SVM in the prediction of time series data. Liu et al. (2017) [
9] applied the Convolutional Neural Networks (CNN) to predict passenger flow of bus system. Similarly, based on the CNN, Mazzeo et al. (2020) [
10] used four convolutional blocks instead of the head layer to enhance the authenticity of the subway passenger flow density map, thereby improving the accuracy of prediction. Huang et al. (2022) [
11] used the deep learning model of periodic ST-GCN (Spatial Temporal Graph Convolutional Networks) to predict the bus stations passenger density. Wang et al. (2022) [
12] added the Spatiotemporal-Correlation and feature fusion of the stations in the prediction area, and proposed a time graph attention convolutional neural network model (TGACN) to improve forecast accuracy.
Many scholars also combine multiple deep learning models when predicting passenger flow in order to obtain better prediction results. Liu et al. (2017) [
13] added three features (time, scene, passenger flow) into the DNN (Deep Neural Networks) model to forecast BRT (Bus Rapid Transit) passenger flow, and established the Sparse Auto Encoder (SAE)-DNN model. Zhu et al. (2019) [
14] have considered the passenger flow characteristics and the correlation of influencing factors to predict the subway passenger flow, and use deep belief network (DBN) to capture these factors to improve the prediction accuracy. Xiong et al. (2019) [
15] combined the advantages of LSTM in dealing with the long-short-term relationship and the advantages of CNN in extracting passenger flow characteristics to predict subway passenger flow. A multi-graph Spatiotemporal CNN was established by Xuan Yang et al. (2021) [
16], which increased the Spatiotemporal correlation analysis of line network, station characteristics and data trends. Zhang et al. (2020) [
17] incorporated the Spatiotemporal characteristics of passenger stations into the deep learning model when predicting subway inflow and outflow passenger flow. The newly proposed hybrid model was tested on real data sets, and the prediction results were more accurate. Hsu (2020) [
18] combined convolutional autoencoder and YOLOv3 architecture for deep learning to obtain real-time information on passenger density on buses. Zhang et al. (2020) [
19] built a multi-graph GCN network with three times dimensions, and obtained the characteristics of different flow directions of inbound and outbound stations and the spatial and temporal characteristics of adjacent stations through convolutional neural network (3D CNN). Zhang et al. (2022) [
20] used a deep learning model that combines GCN with an optimized Transformer in their analysis of passenger flow forecasting specifically for holidays. It can be seen that deep learning models show their powerful data analysis and processing capabilities. However, many other factors will affect passenger flow in real life. The learning model based on single task cannot consider multiple factors at the same time.
2.2. Multi Task Learning Prediction Model
Multi-task learning can handle multiple different tasks at the same time. Faced with the complex network and external factors, some scholars began to apply multi-task learning to rail transit passenger flow forecasting. Huang et al. (2014) [
21] incorporated multi-task learning (MTL) into deep architectures, using a multi-task regression layer over DBN for supervised prediction. Zhong et al. (2017) [
22] constructed a MTL model that comprehensively considers various factors such as weather, emergencies, and line network structure. Mena-Yedra et al. (2018) [
23] obtained the spatio-temporal correlation in passenger flow data through MTL method, and continuously input real-time latest data through online learning to continuously optimize the prediction results. Kuang et al. (2019) [
24] build a MTL model to predict the departure and arrival needs of taxi passengers respectively. Zhang et al. (2020) [
25] constructed a multi-task learning model called MTL-GRU (Gated Recurrent Unit) that can more accurately predict traffic flow and speed. Jia et al. (2020) [
26] established an ADST-Ne-MTL model to deal with the external factors with space-time correlation, such as passenger flow data and weather data, respectively, to improve the adaptability and accuracy of urban subway passenger flow prediction. Zhang et al. (2020) [
27] proposed a MTL model based on CNN to predict taxi passenger demand. Zhang et al. (2020) [
28] used MTL method to forecast the passenger demand of transportation hubs and corridors. Luo et al. (2021) [
29] established an MTL-SPFP model, which can effectively forecast bus passenger density and on different stations and different lines. Luo et al. (2021) [
30] divided cities into different regions, and used multi-task learning methods to predict real-time taxi demand in each region, thus providing guidance for vehicle scheduling. Yang et al. (2022) [
31] applied MTL model to the comprehensive prediction of passenger flow of various modes of transportation in a certain area. Although all of the above studies use MTL model to predict traffic flow or passenger flow, most of them only focus on single mode of transportation or in multiple modes of transportation within the city, ignoring the inflow and outflow between cities. However, the passenger flow congestion points within the city are often hub nodes, which are comprehensive hubs of multi-level rail transit, with both inflow and outflow populations. Therefore, in this paper, we regard the three traffic modes (subway, intercity railway, trunk railway) inside and outside the city as different tasks, and propose a new model based on MTL to forecast rail transit passenger flow under the background of multi-network integration.
Different from the existing research, the model introduces convolution layer and multi-head attention mechanism to improve and optimize the Transformer multi-task learning framework, trains and processes the data of trunk railway, intercity railway and subway as different tasks, and takes into account the correlation of passenger flow of trunk railway, intercity railway and subway in the prediction. At the same time, a new residual network structure is introduced to solve the problems of over-fitting, gradient disappearance and gradient explosion in the training process.
3. The Model
3.1. Problem Description
This paper mainly predicts the passenger flow of trunk railway, intercity railway and subway based on historical passenger arrival and departure data. In each region, the data set is composed of three modes of transportation. According to the different service time of the three modes of transportation, a fixed time period covering the three modes of transportation is selected, and the time granularity is selected to obtain the corresponding time series.
The parameter G represents the passenger flow of trunk railway, C represents the passenger flow of intercity railway, and S represents the passenger flow of subway. In practice, the operation time of the subway is from 6:00 to 23:00 every day, so we will not consider other times temporarily. To observes the change trend of passenger flow, we comprehensively consider characteristics of the operation schedule of the three passenger transport modes and choose 0.5 h as the time step. Therefore, the passenger flow of trunk railway, intercity railway and subway can be expressed as the following sequence:
where
represents the time slots of trunk railway, intercity railway and subway
, and H represents the historical time series.
We use
to represent the mapping function of passenger flow. The mapping relationship between historical and future passenger flow data of three rail transit modes is as follows. We build the MTL model mainly to train the model through historical time series data. Then the function
is obtained.
With the above simplification, the input matrix is
, and the output vector is
. Equation (4) can be changed into the following as:
3.2. Prediction Model Based on MTL
We use Self Attention structure to replace the RNN (Recurrent Neural Network) network structure commonly used in NLP (Natural Language Processing) tasks. Compared with RNN network structure, its biggest advantage is that it can be parallel computing. In the process of processing multi-tasks, Transformer’s mechanism can provide fast processing for two-way multi-channel traffic flow analysis. The overall model is shown in
Figure 1.
In the traditional model, there are two parts, this is, encoder and decoder. If the Transformer model is regarded as a black box, in the task, one task is used as input, and then another task is used as output, namely encoder and decoder.
When the input of the neural network is multiple vectors of different sizes, and there may be certain relationships between different vectors, but these relationships cannot be fully utilized during training, resulting in poor model training results. For this reason, we introduce the self-attention mechanism into the model. Uses parameters Q, K and V related query, key and value vector to calculate the time correlation between passenger volume data of different transport modes. Suppose that the historical time step is H, and the inflows are from the above flow patterns, then the input can be recorded as X∈R3×H. Matrices W_Q∈RH×dQ, W_V∈RH×dv, _K∈RH×dK, are generated parameters Q, K and V. The expression of the self-attention mechanism is shown in Equation (6).
In the above equation, represents the scaling point product, and Softmax (∙) is the activation function.
Soft (QKT/)∈R3×3 represents the score matrix of passenger volume data of three transportation modes, which expresses the relationship between historical passenger flow data of each mode and future passenger flow data.
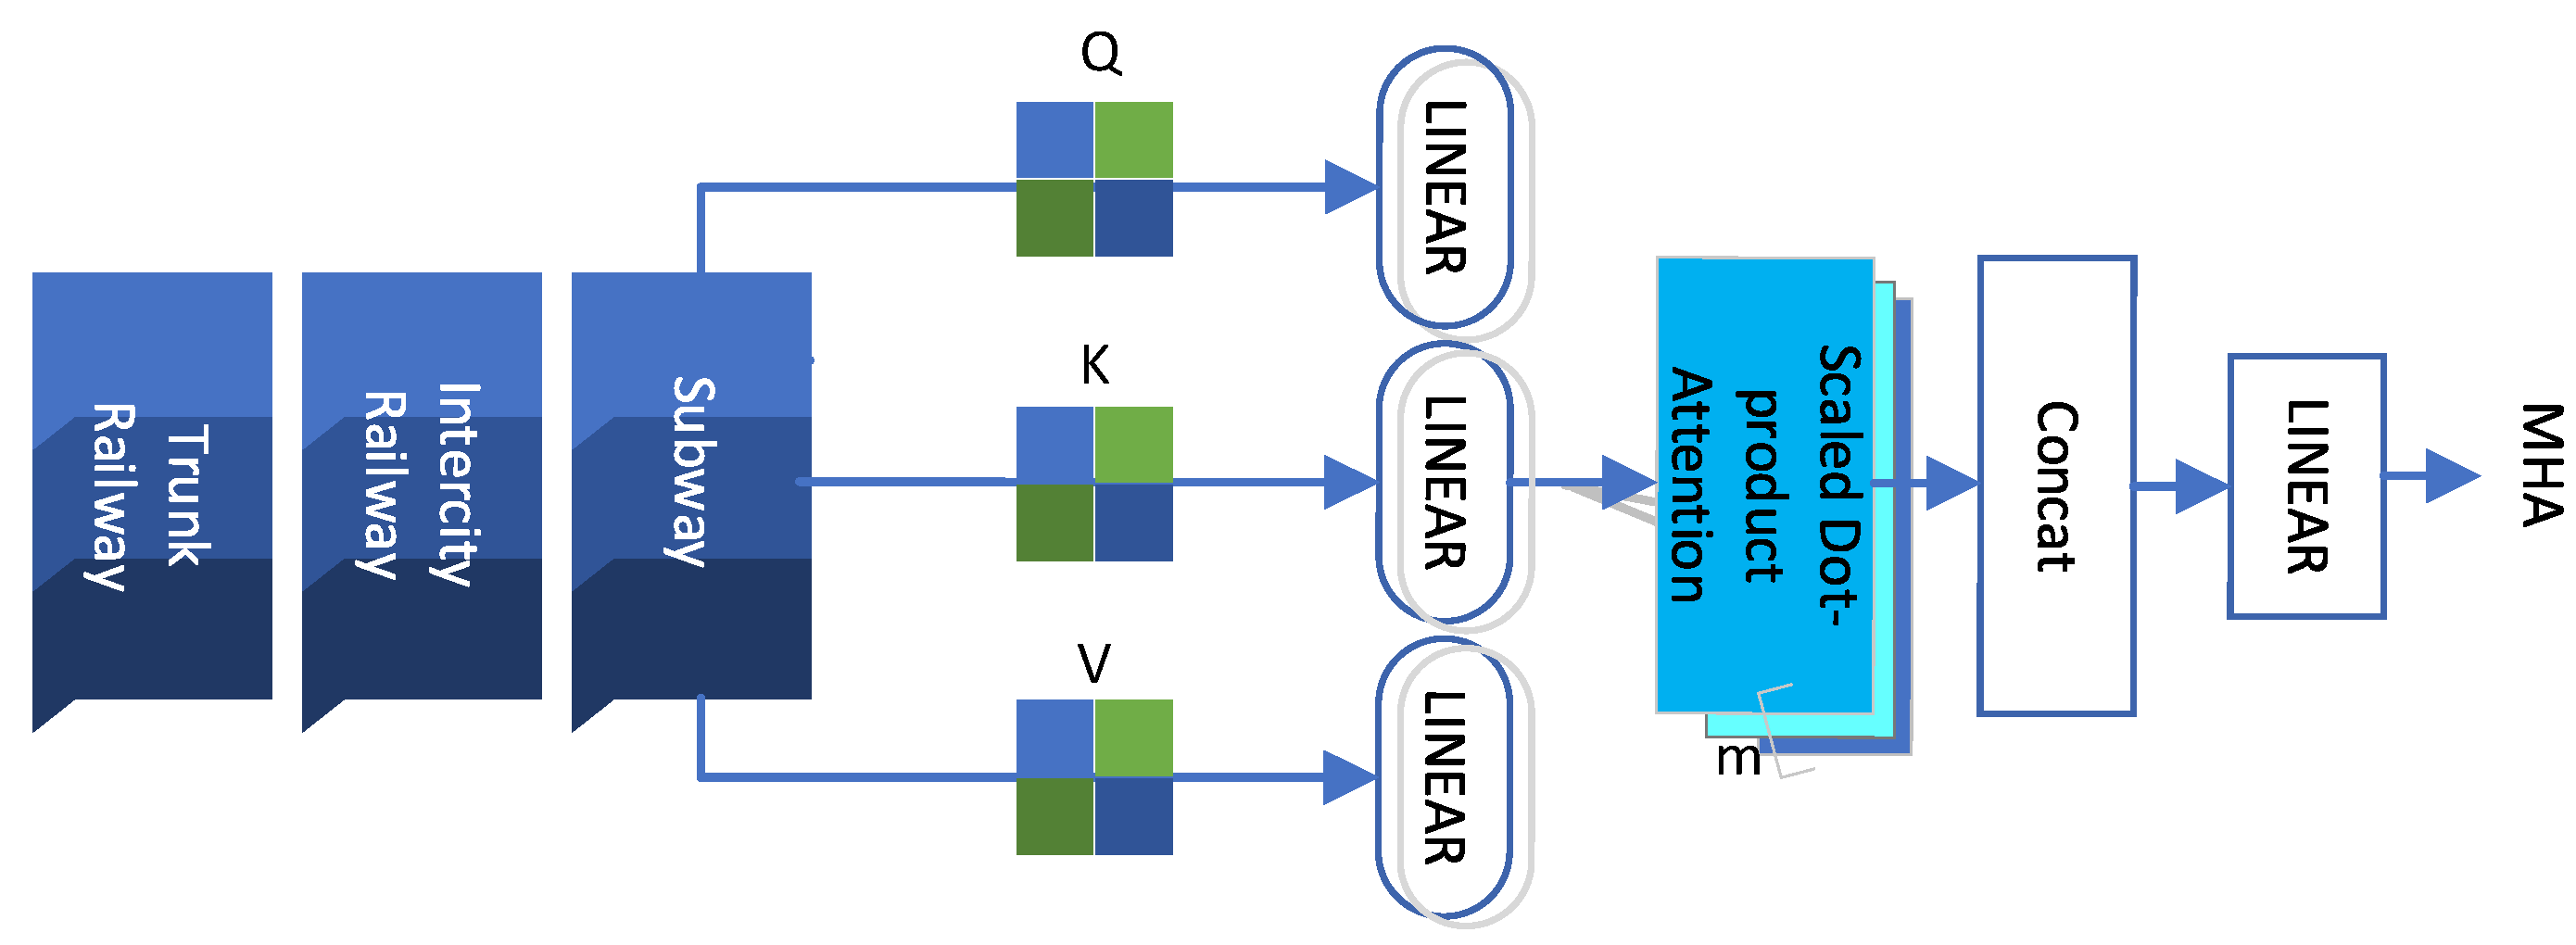
To adapt to the characteristics of simultaneous prediction tasks of multiple traffic modes, we integrate multiple self-attention mechanisms, as shown in
Figure 2. The mechanism first executes the self-attention for M times (i.e., M layers) in parallel, and then concatenates different self-attention layers. In order to obtain the time matrix of historical passenger volume data, we input the results into the unified linear layer.
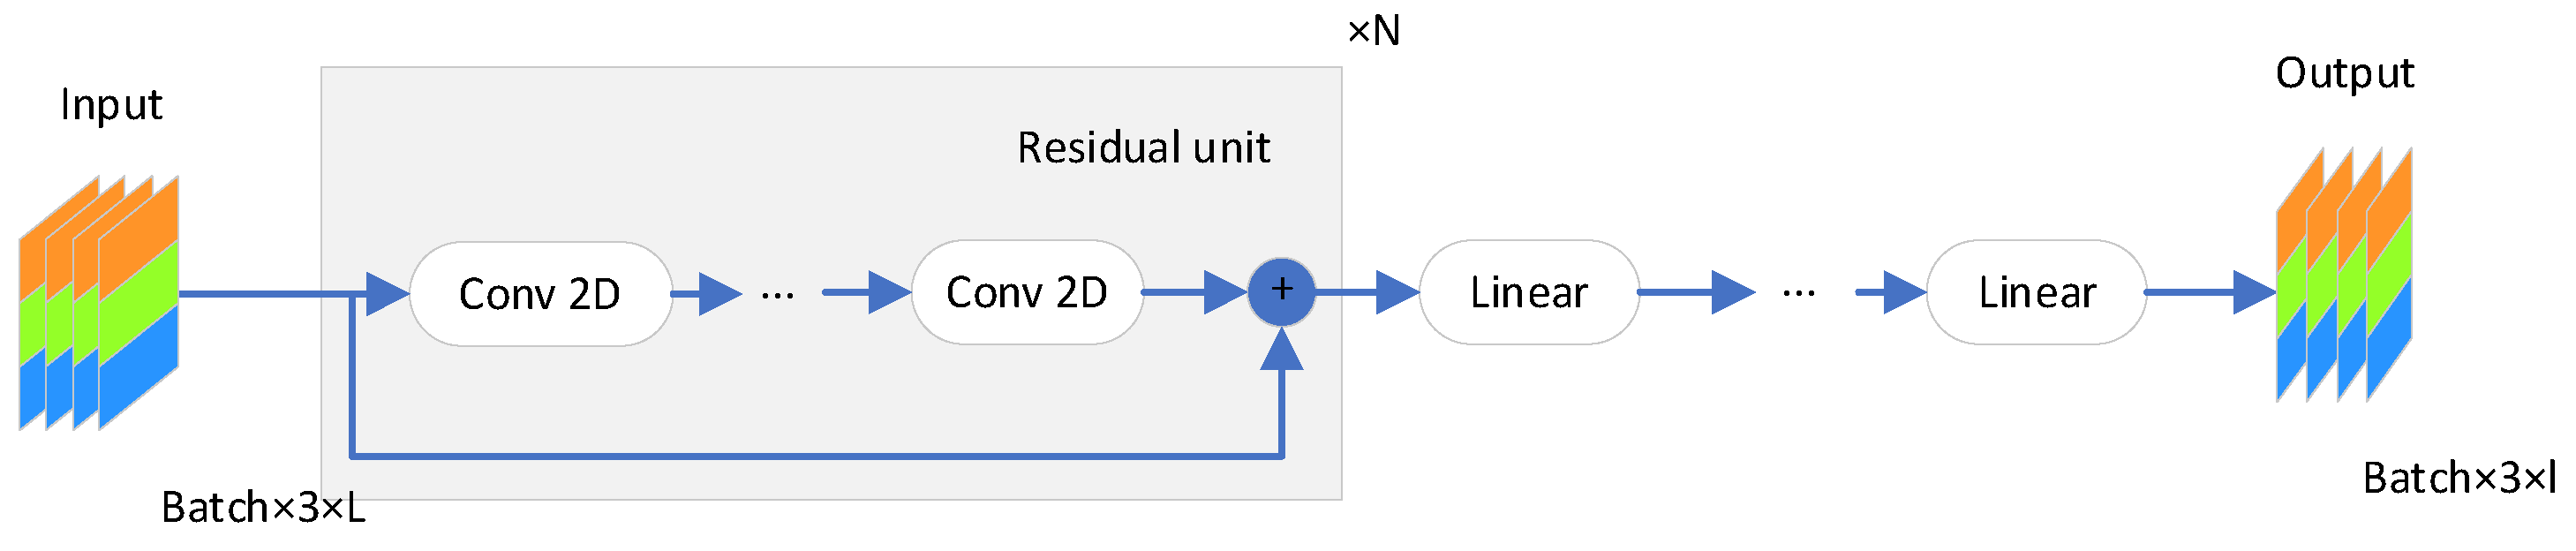
In order to solve the problems of gradient vanishing, gradient explosion and over fitting in artificial intelligence algorithms, residual networks are widely used. The specific structure of residual network is shown in
Figure 3. In order for the model to better capture valuable data, the residual network superimposes the two-dimensional convolutional layer with the value of the quick link. In the scenario of rail transit passenger volume prediction in which multiple transportation modes are integrated, two-dimensional convolution layer is used to get the time series correlation of different transportation modes passenger volume. In this study, the importance of quick bridge is that the superposition of the output and original input of two-dimensional convolution layer through quick bridge can more fully capture the correlation between rail transit passenger traffic volume of various transportation modes, and improve the training efficiency of the model.
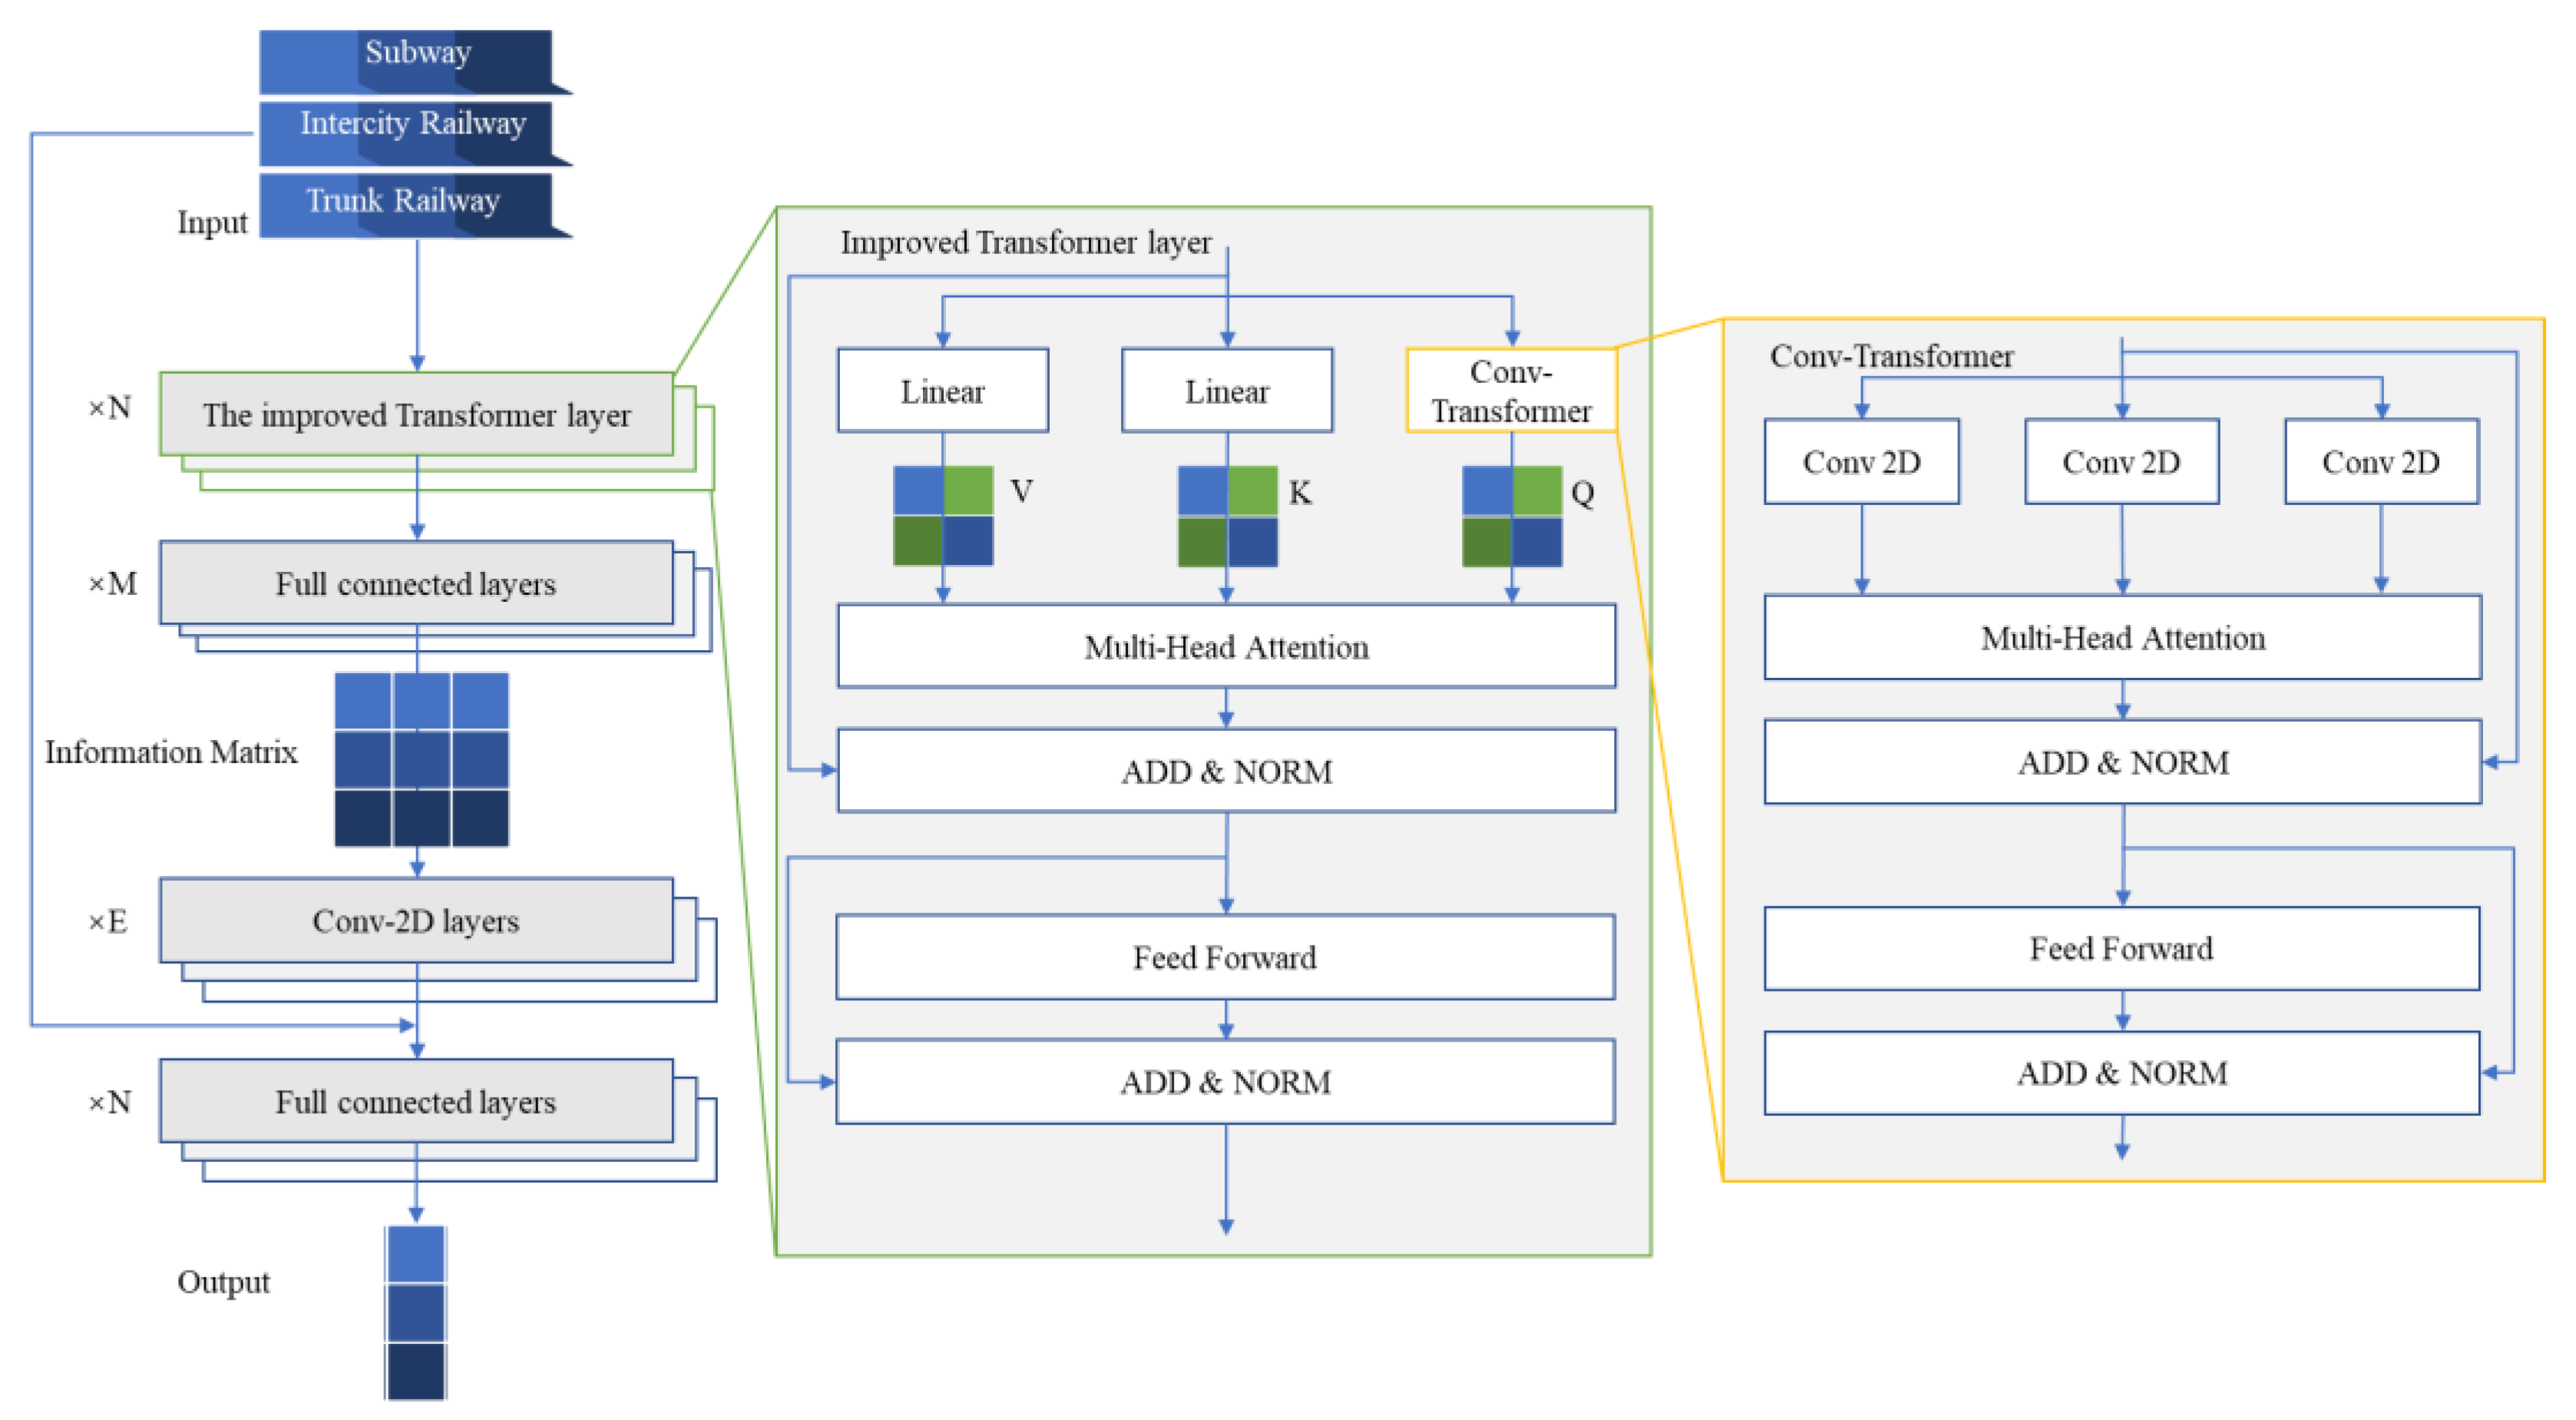
In this article, we only use and modify the encoder to construct the improved Transformer. The improved Transformer in
Figure 4 include two major parts, namely the adjustment level and quick bridge.
Transformer can select the sticky time formed in the process of data stream processing in the improved Transformer model, explicitly capture the dependence between the current element and all elements and improve the accuracy of time series prediction. Therefore, using Convolutional Self-Attention (CSA), Q and K can be calculated by convolution layer instead of leading layer. Therefore, an improved Transformer layer is proposed, as shown in
Figure 5.
In order to calculate Q, we use the traditional Transformer structure to replace the linear layer with a convolutional layer to get The Convolutional Transformer. Because the convolution layer can fully calculate the explicit correlation between different rail transit passenger volumes, it is more suitable than the linear layer for the passenger flow prediction of multi network fusion rail transit mode.
We input the calculated query vector, key vector and value vector to multiple attention layers respectively. Compared with the single-head layer, multiple Attentions can be calculated simultaneously, and finally the combined result is obtained. If there are multiple adjusted Transformers, the output adjusted Transformer will be an information matrix, which has the correlation parameter of different rail transit modes. Each matrix module represents the impact of a rail transit pattern on the predicted passenger volume under the task target, and then input the information into the convolutional layer for further calculation.
Since each matrix block in the information matrix has its own meaning, the position of the matrix block plays a crucial role in the passenger volume prediction, which is suitable for using the convolution layer to further obtain the characteristics between the matrix blocks. After the convolution layer processing, the output value is superposed with the original input value to form a quick bridge. The results are input into the linear layer, and the processed information matrix is integrated to obtain the multi network fusion rail transit passenger volume forecast value.
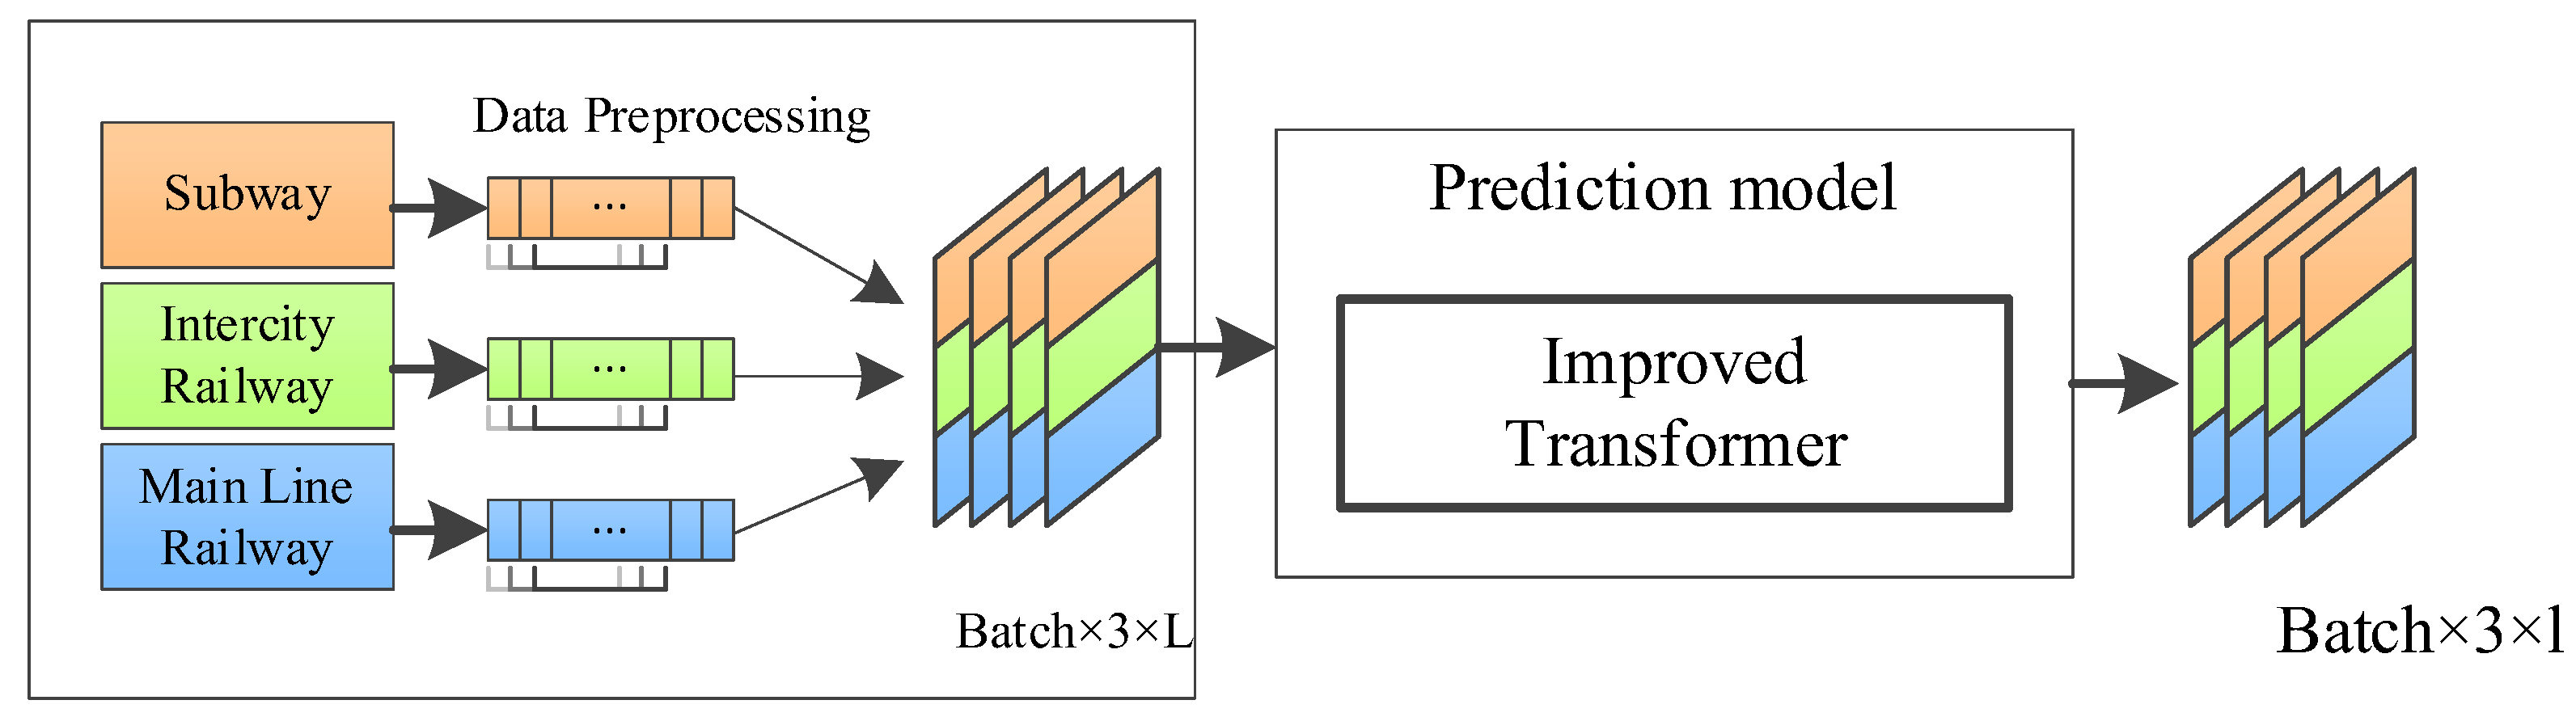
The framework overview is shown in
Figure 5. First, we preprocess the data, including target area division, passenger traffic volume data extraction of various rail transit modes, missing data moving average completion and other processing processes. We use the rolling time window to generate the input information matrix 𝑃∈𝑅
batch×3×H. Secondly, we input the historical passenger traffic volume 𝑋
𝑡−1 into the improved Transformer to forecast the passenger volume 𝑌
𝑡 of trunk railway, intercity railway and subway for the next time slot
t.
4. Case Study
In this section, we first introduce the data sets used in the study. Secondly, the parameter setting, and data source preprocessing are given. The improved Transformer is then compared with several baseline models, namely HA (Historical Average), SVR (Support Vector Regression), GRU(Gated Recurrent Unit), FC-LSTM(Fully-Connected LSTM), STGCN(Spatiotemporal Graph Convolutional Network), DCRNN(Diffusion Convolutional Recurrent Neural Network). In addition, we also analyzed the experimental results, and finally used ablation experiments to verify the effectiveness of each part of the proposed model.
4.1. Data Source
Guangzhou South Railway Station and Guangzhou Railway Station are important transportation hubs for the integration of the four networks. At the trunk railway level, Guangzhou South Railway Station is mainly based on the Beijing-Guangzhou high-speed railway, Guiguang, Nanguang and Shenmao railways, and undertakes westward and southward and part of the north and northwestward motor train operations; guangzhou Station undertakes the Beijing-Guangzhou Railway, Guiguang Railway, Guiguang, Nanguang, Shenmao, Guangshan, Guangshen I II line, Ganshen High-speed Railway, Guangzhan High-speed Railway [
32]. In terms of intercity railway and regional railway, Guangzhou South Railway Station undertakes the functions of Guangzhou-Zhuhai intercity EMU, Guangzhou-Shenzhen-Hong Kong high-speed railway and other EMUs; guangzhou station undertakes the Guangqing intercity and Guangfozhao intercity. At the rail transit level, Guangzhou South Railway Station undertakes multiple lines such as Line 2, Line 7, Line 22, and Foshan Line 2; guangzhou station undertakes many lines such as Line 2, Line 5, Line 11 and Line 14. This article selects these two important transportation hubs as the research object, has certain representativeness.
This paper takes Guangzhou South Railway Station and Guangzhou Railway Station as the research area, namely Guangzhou South Railway Station (GZN) and Guangzhou Railway Station (GZ), which represent the important comprehensive transportation hub stations in the suburbs and downtown respectively. In each region, the data set consists of three traffic modes, namely subway, intercity and railway. The data set is selected from 1 January 2019 to 30 June 2019 (about six months). Due to the different service time of the three modes of transportation, we select the inflow data of the time period (6:00 to 23:00) in which the three modes of transportation operate together, and set the time granularity to be 30 min, so the day can be divided into 34 time series [
33].
Subway passenger flow data set. This paper collects AFC (Automatic Fare Collection System) data of Guangzhou, which contains records of 322 subway stations. Through the processing of AFC data, we obtained the subway data set of GZN station and GZ station, which contains a working day inflow sequence with a time granularity of 30 min.
Intercity passenger flow data set. This paper collects AFC data of intercity train gates at GZN station and GZ station. The data contains passenger travel records, each containing entry time, entry station name, exit time and exit station name. We select data where entry time and exit time are both within inter-city service hours and calculate the inflow sequence for the selected subway station. The inflow sequence of the selected subway entrance is summarized and calculated as the total inflow sequence of the selected area.
Trunk railway passenger flow data set. In this paper, the railway electronic ticket checking system is used to extract the inflow data of the trunk railway of two selected hub stations, namely the data of GZN station and GZ station. The method of processing the intercity passenger flow data set is also used to process the data, and the inflow sequence of the trunk railway passenger flow is obtained.
The above data are derived from the daily operation data of metro, intercity railway, and trunk railway in the real world. The subway passenger flow data comes from the above data are derived from the daily operation data of metro, intercity railway and trunk railway in the real world. The ticket check records of the subway entrance and exit gate, including the detailed origin, destination, entrance and exit time, time length, and ticket price information. The passenger flow data of inter-city trains and trunk railways come from the railway electronic ticket checking system, which can accurately obtain the passenger flow information of always getting on and off, for easy processing and analysis.
4.2. Parameter Settings
The metrics used in the experiment include mean absolute percentage error (MAPE), mean absolute error (MAE), and root mean square error (RMSE). MAE and RMSE measure the absolute size of the deviation between the real value and the predicted value; MAPE measures the relative size of deviation (i.e., percentage). MAE and MAPE are not easily affected by extreme values; RMSE uses the square of the error, which will amplify the prediction error, so it is more sensitive to outlier data, and can highlight the error value with greater impact. The above three indicators are the key indicators to evaluate the accuracy of the prediction model from different perspectives.
Model training divides all data sets into training set, validation set and test set according to the ratio of 6:1:3. The length of historical data is selected as 12, and the length of predicted data is set to 1. The batch size is set to 16, the Encoder block and the Decoder block are set to 6 layers and 6 layers respectively, and the feedforward neural network dimension is set to 256. The data is trained at a time interval of 5 min. The loss function uses the mean absolute error MAE. The optimizer is selected as ADAM, and the learning rate is 0.001.
4.3. Data Source Preprocessing
In order to improve the number of training times and training accuracy, we divide the obtained subway, intercity and national railway data into intervals, and grab the space-time interval with a 5-min interval to construct the data set GZRail. The GZRail set contains three subsets: IPF (Intercity passenger flow data set), SPF (Subway passenger flow data set), RPF (Railway (high-speed rail data set)). GZRail data can be directly obtained, METR-LA data can be grabbed from the Internet, and the two data sets are obtained at the same time interval.
4.4. Baseline Model
The improved Transformer model proposed in this paper is compared with the following six baseline models, as follows:
- (1)
HA (Historical Average): Historical average method is a classical time series method, which uses the average of historical data as input to predict future data [
34].
- (2)
SVR (Support Vector Regression): SVR is a time series model that uses the relationship between historical data and future data to predict future data [
35].
- (3)
GRU (Gated Recurrent Unit): GRU is a learning algorithm based on recurrent neural network, which has a sequence-to-sequence structure and is usually used for time series analysis [
36].
- (4)
FC-LSTM (Fully-Connected LSTM): The structure is an encoder-decoder framework that can extract long-term-short-term dependencies of time features. It is a classic RNN that learns time series and predicts through fully connected neural networks. In this paper, the hidden layer is set to be 2 layers, the hidden units are 32 and 64 respectively, the learning rate is 0.001, the batch size is 64, and the loss function is MAE [
37].
- (5)
STGCN (Spatiotemporal Graph Convolutional Network): STGCN is a landmark traffic flow prediction method. It uses GCN to extract traffic network features and predict future traffic flow data [
38].
- (6)
DCRNN (Diffusion Convolutional Recurrent Neural Network): DCRNN is proposed for spatio-temporal prediction problems, capturing spatial and temporal dependencies through diffusion convolution and sequence-to-sequence learning frameworks [
39].
4.5. Analysis and Comparison of Forecast Results
This chapter validates the proposed the improved Transformer model with pre-processed data sets GZRai and METR-LA and compares it with the above six baseline models using single-step prediction.
4.5.1. METR-LA Dataset Results Analysis
The metrics used in the experiment are mean absolute percentage error (MAPE), mean absolute error (MAE), and root mean square error (RMSE). The results are shown in
Table 1.
By comparing the model indicators, the improved Transformer model proposed in this chapter has achieved good results, indicating that the model extracts the temporal features of traffic data through GRU, and fuses the global spatial features and local spatial features in the decoder to fully exploit the spatial and temporal characteristics of traffic data. Through the learning of local hidden spatial features by decoder, the model can better grasp the dynamic changes of time and space. From
Table 1, it can be seen that in the 5-min traffic prediction effect, The improved Transformer in this chapter reduces MAPE by 1.178, MAE by 0.178, RMSE by 0.633 compared with other well-predicted models on the data set METR-LA. Compared with other baseline models, the improved Transformer model proposed in this chapter has the best prediction effect in 5 min, which proves the effectiveness of the model.
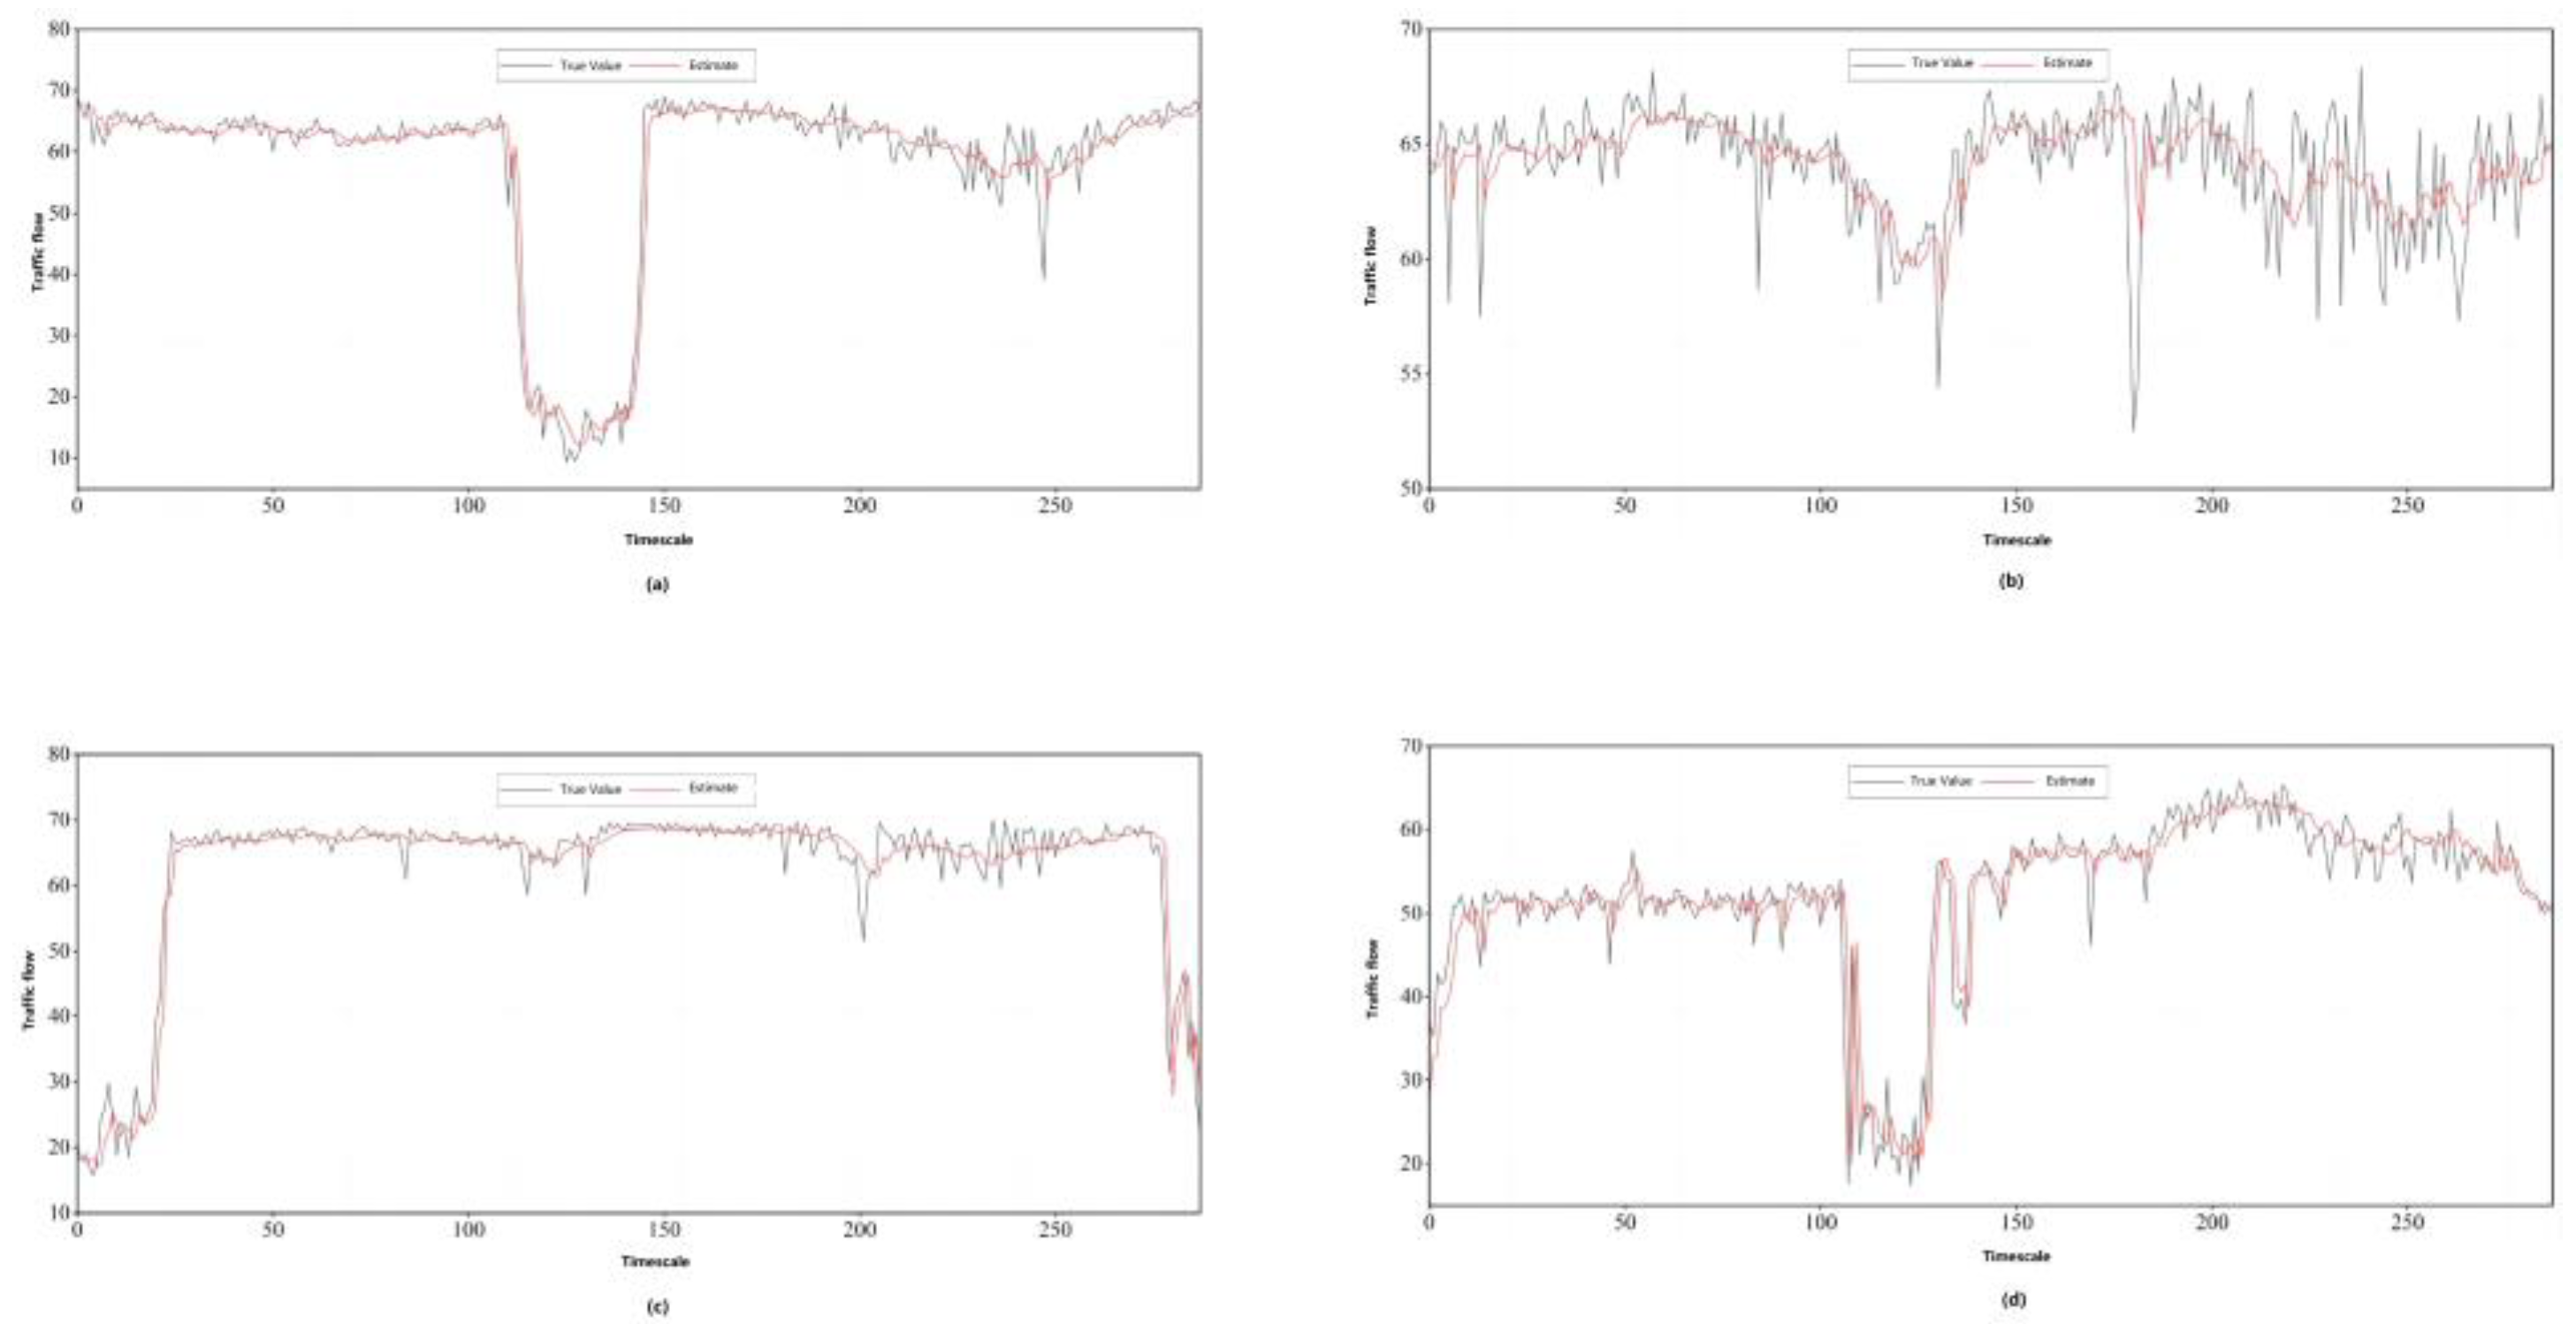
Figure 6 is a comparison of data prediction for a 4-day monitoring point on the data set METR-LA. where the abscissa represents the time of day, 288-time intervals, 5 min each; the ordinate is the time interval flow.
The improved Transformer model can better predict the time series change of traffic flow, and the curve fluctuation is relatively small and the performance is smoother. As shown in
Figure 6c, between 1:30 and 22:00 on the same day ‘s rail transit, the model predictions are smoother and the error between the curves is smaller. As shown in
Figure 6d, the peak period of rail transit on the same day is around 12:00, and the fluctuation range during the peak period is small, and the predicted value is slightly lower than the actual value. In summary, the improved Transformer model has achieved good prediction results on the METR-LA dataset.
4.5.2. GZRai Dataset Results Analysis
The metrics used in the experiment are MAPE, MAE, RMSE. The results are shown in
Table 2.
From
Table 2, we can see that in the 5-min traffic prediction effect, the improved Transformer in this chapter decreased the MAPE by −1.079, 0.793,0.546, MAE decreased by 1.349, 0.084, 0.092, RMSE decreased by 1.181, −1.074,0.719 on the datasets GZRai-IPF, GZRai-SPF, GZRai-RPF compared with other models with better prediction. Compared with other baseline models, the improved Transformer model proposed in this chapter shows obvious superiority in the prediction effect of 5 min.
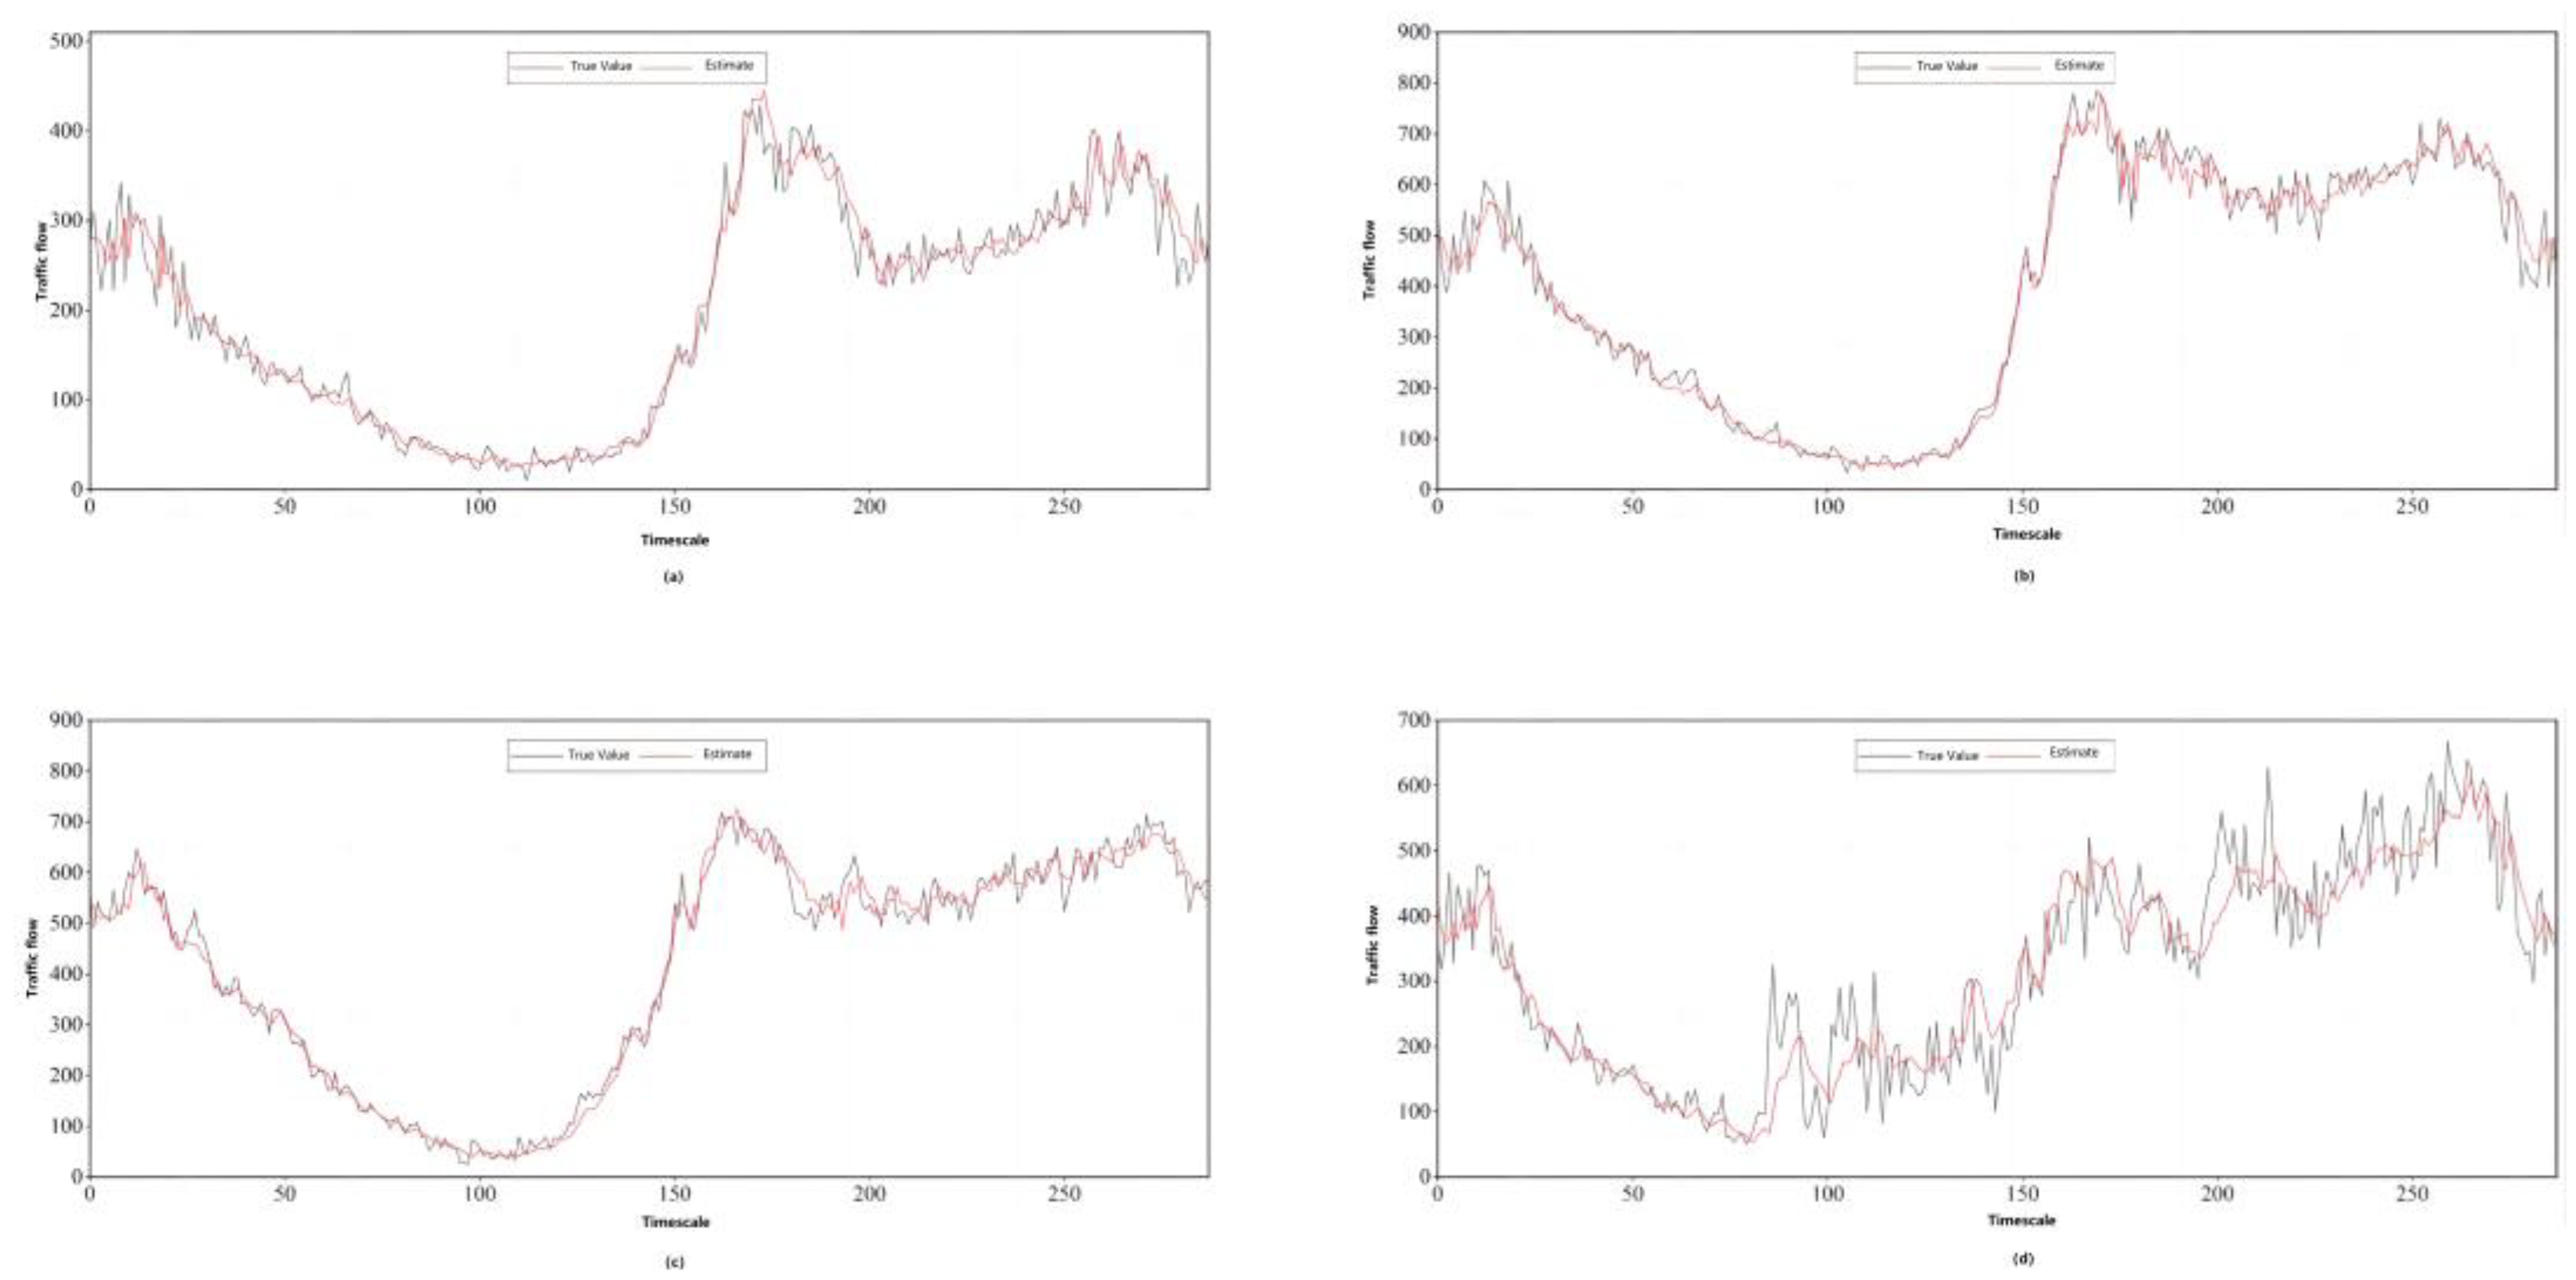
Figure 7 is a comparison of data prediction for a 4-day monitoring point on the data set GZRai. where the abscissa represents the time of day, 288-time intervals, 5 min each; the ordinate is the time interval traffic flow. On the whole, the improved Transformer can better predict the time series change of traffic flow on the GZRai dataset, and the curve fluctuation is relatively small and the performance is relatively smooth. As shown in
Figure 7a, the peak period of the interval is from 13:30 to 14:30 on the same day. During the peak period, the curve fluctuates less and the predicted value is slightly higher than the actual value. Overall, the improved Transformer performs well on the GZRai dataset.
In general, the improved Transformer model has better performance in capturing the spatial-temporal characteristics of traffic flow and their correlations by comparing with other baseline models on two datasets, and is more suitable for the current actual rail traffic flow prediction.
4.6. Ablation Study
In order to further verify the effectiveness of the proposed model, this chapter designs ablation experiments. The first ablation experiment is to use only the global encoder (Encoder) to verify and remove the decoder (Decoder) portion in the improved Transformer structure. The second ablation experiment is to verify only the local decoder. In the model structure, the global encoder is removed, and there is no established multi-head attention layer with the encoder in the decoder. The third ablation experiment was to remove the temporal feature extraction module (Temporal). The verification results are shown in
Table 3.
It can be seen from
Table 3 that the improved Transformer model is compared with the three model structure variants on the METR-LA and GZRai datasets. On the two data sets, the model only uses the Encoder structure to compare the model only uses the Decoder structure. The model only uses the Decoder structure to show better results, and the model removes the time embedding module GRU, so that the model cannot effectively extract the time characteristics of spatio-temporal data, and the prediction effect is not ideal. It shows that the improved Transformer model can effectively capture the spatial and temporal characteristics of traffic data in traffic flow prediction. Especially in spatial characteristics, it can better capture the spatial correlation of traffic data and achieve better results in short-term prediction.
This chapter uses the proposed the improved Transformer model for short-term traffic flow prediction. The multi-head attention mechanism in the Transformer structure is used to extract the dynamic spatial features of traffic data. Among them, by extracting the global spatial features in the encoder, the hidden spatial features are extracted by the adjacency matrix in the Mask multi-head attention module of the decoder, and finally the spatial features are fused by multi-head attention in the decoder. At the beginning of the model, the time feature is extracted by gated recursive unit (GRU). Then use location coding to help the model better understand the location of nodes. Finally, the learned spatio-temporal features are aggregated in the feedforward neural network for traffic flow prediction.
5. Conclusions
This paper constructs a multi-task learning model (the improved Transformer). The improved Transformer combines the optimized Transformer layer with the residual network to accurately predict the passenger flow of each rail transit mode in the multi-network integration environment of large-scale integrated transportation hub. The model introduces convolution layer and multi-head attention mechanism to improve and optimize the Transformer multi-task learning framework, trains and processes the data of trunk railway, intercity railway, and subway as different tasks, and considers the correlation of passenger flow of trunk railway, intercity railway, and subway in the prediction. At the same time, a new residual network structure is introduced to solve the problems of over-fitting, gradient disappearance, and gradient explosion in the training process. This result can be used for the combined forecast of passenger flow of multiple transportation modes in complex passenger transport hubs. It is helpful for traffic managers to allocate passenger transport resources more accurately to improve the intermodal transport service mode. This study can be used not only for passenger flow prediction of various rail transit, but also for passenger flow prediction of different modes of transportation such as civil aviation, highway, water transport, railway, etc. in the future. The main findings are as follows:
The improved Transformer has significant advantages in obtaining passenger flow correlation and time characteristics between different modes of transportation (subway, intercity and high-speed rail). The characteristics of each rail transit mode can be extracted and integrated in the Conv Transformer layer;
By comparing the performance indicators of the improved Transformer and the baseline model, DCRNN performs poorly in the case of multiple modes of transportation while the model based on Transformer and CNN-2D has a better prediction effect on the passenger inflow of the integrated transportation hub under multi-network integration;
By using the passenger flow data of two large integrated transport hubs in Guangzhou, China, and comparing with other existing models, the results show that the improved Transformer has higher prediction accuracy and stronger stability. Both GZN and GZ datasets show that the improved Transformer has the highest prediction accuracy (Average prediction accuracy of passenger flow of three traffic modes) 88.569%, and others methods HA, FC-LSTM and STGCN are 81.579%, 82.230% and 81.761%, respectively.
In the real-world application, the method proposed in this study can predict the passenger flow in the future by establishing the data interface of the electronic passenger ticket system with the subway, intercity railway and national railway, and through the transportation management department with authority to call the historical passenger flow data input training prediction model. However, in order to maintain the prediction accuracy, it is also necessary to develop corresponding online learning mode.
However, there are still some limitations and shortcomings in this study. First of all, we only consider the rail transit mode (subway, intercity train, trunk railway), but in addition, the transportation hub also integrates some other modes of transportation. Secondly, this study only considers the node passenger flow of two integrated transport hubs, and does not consider the corridor passenger flow between transport hubs. In addition, urban characteristics (such as whether it is a tourist city) will affect the passenger flow of intercity trains and trunk railways, but we do not consider this feature. Thirdly, the proposed model needs to process the data of intercity railway, trunk railway and subway at the same time. The finer the predicted time granularity, the longer the algorithm runs. This study did not improve the lightweight of the model. Therefore, in the next research, the above deficiencies can be improved.


