Article

Spatial Distribution of Freshippo Villages under the Digitalization of New Retail in China

School of Urban Design, Wuhan University, Wuhan 430072, China
*
Author to whom correspondence should be addressed.
Sustainability 2023, 15(4), 3292; https://doi.org/10.3390/su15043292
Submission received: 20 January 2023 / Revised: 8 February 2023 / Accepted: 8 February 2023 / Published: 10 February 2023
(This article belongs to the Section Sustainable Urban and Rural Development)

Abstract

:
Freshippo villages (Hema villages) that develop a typical digital agricultural economy with new retail are distributed in most provinces of China, and the rules of their spatial distribution are important for systemically carrying out current sustainable digital agriculture practices. This paper conducts a study of the spatial distribution of Freshippo villages mainly based on Freshippo data and kernel density estimation, and the results show that Freshippo villages have a spatial cross-regional distribution and form three latitudinal and two longitudinal distribution belts. In particular, there is one main latitudinal distribution belt named the 30° N latitudinal belt and two main longitudinal distribution belts named the eastern coastal longitudinal belt and the longitudinal belt of the Heihe–Tengchong Line. Regionally, several spatial cores formed in the Yangtze River Delta, Shandong, Hubei, and Sichuan. We used linear regression and official provincial statistics to analyze the important relevant factors. Freshippo stores show the highest gradient/y-intercept of 0.2133 and correlation coefficient 0.4599, and all gradient/y-intercepts and correlation coefficients of grain crops are less than those of fruits and vegetables, which reveals that the agricultural product and market are two important factors. In addition, we discuss the spatial effect on agricultural villages under the digitalization of new retail. As the first study of the spatial distribution of Freshippo villages, our paper provides a significant case for the economic geography of digital agriculture.

1. Introduction

1.1. Freshippo Villages under the Digitalization of New Retail

As a necessary industry for humanity, agriculture has existed in China since the Neolithic Age [1]. After having a peasant economy for several thousand years [2,3,4], China began to transition to agricultural modernization [5,6,7]. Modern agriculture is oriented toward a market economy and needs some advanced agricultural technologies, tools, and management systems [7], where the division of labor is based upon specialized forms ranging from typical agricultural production to trading. There are three major ways to develop agricultural modernization: the agricultural model of large-scale farms, represented by the United States [8]; the modern peasant economy model, represented by Japan [9]; and modern facility agriculture, developed in Israel and the Netherlands. Under public land ownership, agricultural modernization in China is based on a household contract responsibility system and agricultural cooperatives [6]. Farmers can use large agricultural machinery, organize production, and connect marketized organizations spontaneously. The entire chain from products to commodities has gradually commercialized, and socialized services have entered agricultural development. As a result, the comprehensive mechanization rate of agricultural cultivation and harvest reached 70%, and the rate of contribution of science and technology is more than 60% [7]. However, there is still an obvious limitation in product quality and regional supply and demand [7]. In addition, faster urbanization has had a negative effect on rural development in recent years. China gradually reached the Lewis turning point, where there are not enough traditional farmers in rural areas, especially the young labor force [10].
Digitalization based on digital technology such as artificial intelligence (AI) and Internet of Things (IoT) is a new modernization method [7], and digital elements are starting to play an important role in every respect. Combining the online–offline mechanism, digitalization in retail results in an era of a fourth generation of retail, named new retail [6]. New retail has stronger adaptability with respect to meeting many diverse consumption needs, reducing costs, and improving efficiency, which drives the reorganization of people, goods, and places. Furthermore, new retail achieves the integration of production and consumption, which promotes the development of "new agriculture" in the upstream range of the supply chain [6]. Under the new retail environment, new agriculture uses emerging digitalization to guide a series of processes and selects and transforms agricultural products based on people and places. Combining some original digital agriculture, the new retail economy of agriculture is creating a new type of digital agriculture economy that affects the organization of physical agricultural spaces [7].
In a peasant economy, agricultural space in rural areas takes the farmland of peasant households as a unit. However, with the development of agricultural modernization, many farmlands in China have increasingly been directly used by some new organizations, such as agricultural cooperatives (agricultural co-op) [11]. Therefore, unlike in traditional agriculture, the unit expands to a regional level, comprising one or more villages, for example. There are some professional and specifical models based on a unit of villages. For example, “Taobao village” is a typical and famous representative of a digital rural economy driven by electronic commerce (e-commerce), and some Taobao villages are agriculture-related and have a gathering of farmers [7,12,13]. With the gradual development of digitalization, more professional digital agriculture villages have emerged [14,15,16,17]. There are several typical specific models, such as NetEase Inc. (only selling pork) [18], Pinduoduo Inc. (making more in a digital economy), and some new Taobao villages [19,20]. In particular, the model of Freshippo villages (Hema villages) implemented by Freshippo Inc. is a relatively comprehensive digital model [6]. Freshippo (Chinese Pinyin “Hema”) is the nickname of Freshippo Inc. under Alibaba Inc. As a representative example of new retail and digital agricultural productive services, the company mainly concentrates on the retail of fresh foods [6,7]. Freshippo villages are typical villages that provide high-quality fresh agricultural products for Freshippo based on orders, which promotes the refinement, standardization, and digital transformation of agricultural products [7]. These villages maintain the digital and systemic supply of agricultural production and are spread all over most provinces in China, and this provides a typical case to systemically and completely study the spatial distribution of a digital agricultural economy. By conducting research on spatial distributions, we can recognize their degree of development and their characteristics. Therefore, the first main goal of our study in this paper is to find the spatial distribution rules of Freshippo villages in China, including global distribution belts and regional cores. We also want to discover if the product and market are the main factors of a digital agricultural economy. In addition, we discuss the spatial effect on agricultural villages under the digitalization of new retail so as to provide a significant case for the economic geography of digital agriculture.

1.2. Literature on the Spatial Distribution of Villages in China

China has a wide range of regions, and the development of its digital agricultural economy needs spatial development processes. The spatial distribution of villages in rural areas includes past, current, and future planning or predicting the spatial distribution of agricultural land, population, climate, industry, and related rural nature and society based on the unit of villages [21,22].
Before the appearance of the non-agricultural economy, the agricultural economy was mostly equivalent to rural economies in rural areas. In the period of the People’s Republic, except for the famous Heihe–Tengchong Line (Hu Line) [21], regional spatial distributions from provinces to counties were studied by Hu and other researchers [22]. After the founding of P.R. China, agriculture was still the main type of industry. Due to the necessary improvement in agricultural production, the government started to focus more on China’s natural economic geography [22]. In the last century, except for some studies on natural factors such as climate, water, and soil, with the support of the national government, researchers carried out many studies on economic geography and agricultural regional planning [23]. Reforms and the opening up of China motivated geographic research to include studies on both nature and humans, and practical experience and theoretical innovation were both important. Although urbanization as a main trend brought about rural industrialization, rural and agricultural geography were equivalently studied and discussed, such as the spatial distribution of agricultural types and rural farmland loss [24,25]. Researchers also started to use new technologies and tools such as ArcGIS in agricultural estimation and prediction [22].
Focusing on agriculture, research studies on the spatial distribution of agricultural land and driving forces have become increasingly popular [26]. According to the spatial distribution, we can recognize the main output regions and vulnerable regions. Rural habitats affected by land and farmers are also a hotspot, and research studies include hollowed villages, traditional villages, housing points, and their clustering and classification [27]. In addition, in-depth studies on the spatial relationships of two particular aspects have also gradually appeared [28]. With the accumulation of data, progressive technology, and advanced methods, it is possible to study the history of the spatial distribution of agricultural land and villages [29,30]. With the increasing problems that come with large cities, China started to focus on rural and urban development at the same time [31,32]. Therefore, the spatial distribution of rural and urban integration became important [33]. In 2020, China transitioned out of poverty, and spatial evolution transitioned toward rural prosperity [34]. For example, rural revitalization strategies motivated researchers to carry out geospatial studies of agricultural economies and rural land use in theory, such as examining farmland, settlements, and land ownership [35]. With agricultural and rural modernization, many new types and models of agricultural and rural development appeared, which resulted in the formation of special villages such as industrial villages, tourism villages, and cultural villages [6]. Among them, Taobao villages, as a typical special village, have obvious cross-regional features due to the development of an initial digital rural economy with e-commerce [7,20]. The study of Taobao villages starts a new road toward the spatial distribution of a digital rural economy [20,36]. With gradually developing digitalization, Freshippo villages—as a new type of sustainable rural space—play an increasingly important role in the rural revitalization of China, which can develop typical industrial integration [7,37,38]. Therefore, we use Freshippo villages as an example to study the new spatial distribution rules of villages.

1.3. Structure and Highlights

The paper is divided into five sections. In Section 1, Freshippo villages under the digitalization of new retail are introduced. Section 2 presents the experimental data and method. Section 3 shows the result and analysis of the spatial distribution of Freshippo villages. In Section 4, the spatial effect on agricultural villages under the digitalization of new retail is discussed. Finally, Section 5 describes the conclusions and future works. The highlights of this paper are threefold:
  • We find several important distribution zones of typical digital agricultural economies in China.
  • We propose that products and markets are still factors of a digital agricultural economy.
  • We discuss the spatial effect on agricultural villages under the digitalization of new retail from spatial distributions and factors.

2. Materials and Methods

In order to effectively study the spatial distribution of Freshippo villages, we collected useful raw information and constructed a database, and we selected several suitable methods. The novelty of our analysis is our method of deconstructing the spatial distribution of Freshippo villages by using quantitative methods.

2.1. Materials

The first Freshippo village was established in July 2019 [2,3]. In the second half of 2019, we tracked and collected relevant reports and news from the official accounts of Weibo and Weixin of Freshippo villages [6]. Using social survey methods, we went to Freshippo stores and met some Freshippo employees to obtain official information about Freshippo villages, such as the number and names of Freshippo villages. Then, we went to some Freshippo villages to conduct field investigations and collected first-hand raw information required for our study, including names and addresses (province, city, and town). Based on the accumulation of official information, we built a database of more than 126 Freshippo villages by 10 June 2022, including the normal Freshippo villages certified by Freshippo and digital bases jointly built by Freshippo and other enterprises, such as strawberry and rice bases [6,7]. There is a difference between the number of Freshippo villages in our database and the number listed in some previous reports because our statistical numbers do not include potential Freshippo villages and original Freshippo bases without digital development. Information on several typical villages is shown in Table 1.
We obtained longitudinal and latitudinal geographic coordinates, created tables, and imported software based on the database’s establishment. On 1st October 2022, we obtained the details of 330 Freshippo stores using the official data, and these details include the province, city, name, and address. As for the statistics on China’s provinces, we collected official data published by the central government [39]. These data include annual grain output, grain yield per unit area, fruit yield, and vegetable yield in 2021 [40].
The desktop computer we operated was configured with an Intel Core i3 4610 CPU, 8 GB of RAM, and an NVIDIA Geforce GTX 1050 GPU. We used version 10.2 ArcGIS software and Microsoft Excel 2021 to carry out our study.

2.2. Methods

2.2.1. Kernel Density Estimation

Kernel density estimation (KDE) is a typical method to estimate unknown density [41]. As an optimization of a naive estimator, KDE can fit each point or polyline on a smooth conical surface by using kernel functions [42]. The kernel is a symmetric, shift-invariant, and positive definite probability density function, such as a Gaussian kernel [43]. Thus, KDE can calculate the quantity value per unit area to cluster spatial points [42]:
f ( x ) = 1 n h n i = 1 n k ( x x i h n )
where n equals the total number of data, hn is the bandwidth named the search radius, and the function k(·) is the kernel. As a classic method, KDE has been extensively applied in many research studies [26,30,34]. In our study, KDE—as a spatial estimation method—is used to analyze the spatial clustering of Freshippo villages.
As shown in Table 1, we initially obtained the longitude and latitude of each location’s points by conducting a geographical coordinate analysis of Baidu maps. Using Excel’s Conversion Tools function in the Arctoolbox of ArcGIS and the function of “Show x and y” via the association of longitudes or latitudes, respectively, we then created a layer of Freshippo stores and a layer of Freshippo villages, imported the geographic longitude (x) and latitude (y) in Excel into ArcGIS, and generated a layer with the data type of XY event sources, where the X field is x, the Y field is y, the geographic coordinate datum is D_Krasovsky_1940, the prime meridian is Greenwich, and the angle unit is the degree. Then, we could utilize kernel density clustering in the toolbox to conduct visual analyses.

2.2.2. Linear Regression Analysis

Regression analysis is a statistical analysis method for determining the quantitative relationship between two or more variables in the same position, and it focuses on the study of variable dependence [44] so that one variable can be used to predict another variable. Linear regression based on the linear combination of n independent variables, X = [x1, x2, …, xn−1, xn], models dependent variable Y and uses independent observations to estimate the coefficient. Linear regression analysis is mainly used to moderately quantify agricultural economies based on the location, area, scale, and other data. In this paper, we applied linear regression in factor analyses and comparisons.

3. Results

In this section, we first analyze the regional and global features of the spatial distribution of Freshippo villages. Then, we further conduct a statistical analysis of correlations between Freshippo villages to identify the importance of agricultural products and Freshippo stores.

3.1. Spatial Distribution of Freshippo Villages

Figure 1 shows the spatial distribution of Freshippo villages. We can observe that the vast majority of 126 Freshippo villages are located east of 100° E, and all villages are in the south of 45° N in China; thus, the number of Freshippo villages in the east is greater than that in the west, while there are more Freshippo villages in the south than in the north. However, there is a small gap in numbers between the east and the west in general. On the whole, there are more Freshippo villages located in the south.
The spatial distribution of Freshippo villages is the same as the spatial distribution of populations [21]. The reason may be that the south district (south of the Huai River and Qin Mountain) has rich agricultural species, while the terrain in the east is lower in altitude than that in the west [45]. Then, the spatial distribution of these Freshippo villages was clustered by the KDE, where n = 126, hn = 2.0, clustering pixel = 0.1, and clustering class = 20.

3.1.1. Regional Features

The kernel density concentration degree developed into a single core spatial distribution for the Yangtze River Delta and three sub-core spatial distributions for Sichuan province, Shandong province, and Hubei province.
  • The Yangtze River Delta has dozens of Freshippo villages, and their clustering is prominent. As a unique polarized single core, local regional density values can reach 4.5, which is significantly higher than the density of other regions and nearly three times the overall average density. In addition to bamboo shoots produced in Zhejiang, other agricultural products supplied by Southern Freshippo villages mostly comprised daily fresh fruits and vegetables, such as strawberries, watermelons, leafy vegetables, etc. In addition, Freshippo stores began in Shanghai, and most Freshippo stores are gathered here, which can attract the local construction of Freshippo villages.
  • Shandong and Hubei are important clustering areas of Freshippo villages. The density in Shandong increased to 1.5, where a cluster of administrative Freshippo villages is emergent in Zibo. This is because the construction of Freshippo cities in Zibo is driven by local governments based on prior natural Freshippo villages. Hubei has a cluster of natural Freshippo villages in Wuhan and surrounding areas with a density of more than 1.5. The Freshippo village named “Qiangxin fruit-Baiquan” made a significant contribution during the epidemic in 2020, which was awarded by the United Nations. Sichuan has a major clustering area of Freshippo villages in the west, and its regional density is up to 2; the first Freshippo village, named Bake, was constructed here, and many agricultural plateaus were developed here.
  • There are also some areas that have several non-clustered Freshippo villages, such as the southwest region. In addition, many single points are scattered in some provinces. Increased multi-cores and points with respect to Freshippo villages result in more diverse spatial distributions and richer spatial levels. On the one hand, this shows that Freshippo villages exhibit a spatial generalization development trend; on the other hand, it shows that the industrial agglomeration effect is normalized.

3.1.2. Global Features

On the whole, the spatial distribution structure of three latitudinal belts and two longitudinal belts is very obvious.
  • From the latitude, it can be observed that the concentration of Freshippo villages in the middle latitude belt is more significant, and it is connected from east Shanghai to west Sichuan. The other two less significant latitude belts include the 40° N latitudinal belt from east Liaoning to west Xinjiang and a lower-latitude belt from Guangdong to Yunnan. The two longitude belts include the eastern coastal distribution belt and the longitudinal belt of the Heihe–Tengchong Line from Shanxi to Yunnan. The structures of one latitude belt and two longitude belts make up the main spatial distribution framework, including the eastern coastal distribution belt, the longitudinal belt of the Heihe–Tengchong Line, and the 30° N latitudinal belt along the Yangtze River. They are all near the boundary line of two climate areas, so they can be named cross-climate areas or the area of climate boundary [46].
  • Spatial distributions tend to mesh locally, forming a polygon with these distribution belts as the edge. The spatial structure—from a point to a belt and then to the emergence of a network distribution—shows that the spatial distribution of the digital agricultural economy in rural areas entered a formation period with respect to national networks. The spatial distribution generally met the Heihe–Tengchong Line, with the exception of a breakthrough in Sichuan [21]. In addition, the spatial distribution also conformed to the south–north distribution with the Boxing line, where there are a similar number of villages [47].

3.2. Statistical Analysis of the Correlation between Freshippo Villages

In the last subsection, we analyzed the spatial distribution of Freshippo villages, and we observed that Freshippo villages have obvious spatial characteristics. This subsection continues to use quantitative methods to analyze the important relevant factors of Freshippo villages using the relevant statistics of provinces. In a market-oriented economy, the choice of agricultural products forms the basis of Freshippo villages. Under the same production cost, transportation cost is the main concern of enterprises. Therefore, agricultural products and markets are the main considerations. One obvious feature of Freshippo is the sale of fresh agricultural products, which requires freshness and consumption. This is because only high-quality agricultural products with high added value can support the initial digital agricultural economy [7]. Therefore, all Freshippo stores are located in large cities, and fresh fruits and vegetables are the main products. However, some provinces only have a large city with Freshippo stores, while some provinces only have Freshippo villages. In order to verify the applicability of the main considerations, linear regression analysis was used to calculate whether the output of products and the number of markets correlated with the number of Freshippo villages by province. Based on statistics, we examined the number of Freshippo villages in 24 relevant provinces and cities. All reported parameters and results are rounded to four decimal places.

3.2.1. Correlation of Freshippo Villages and Agricultural Products

First of all, we analyzed the correlation between the number of Freshippo villages and agricultural products. According to the characteristics of agricultural products produced by Freshippo villages, the characteristics are divided into three aspects—grain crops, vegetables, and fruits—and their relationship with the provincial statistics of the quantity of Freshippo villages is measured.
  • Grain crops
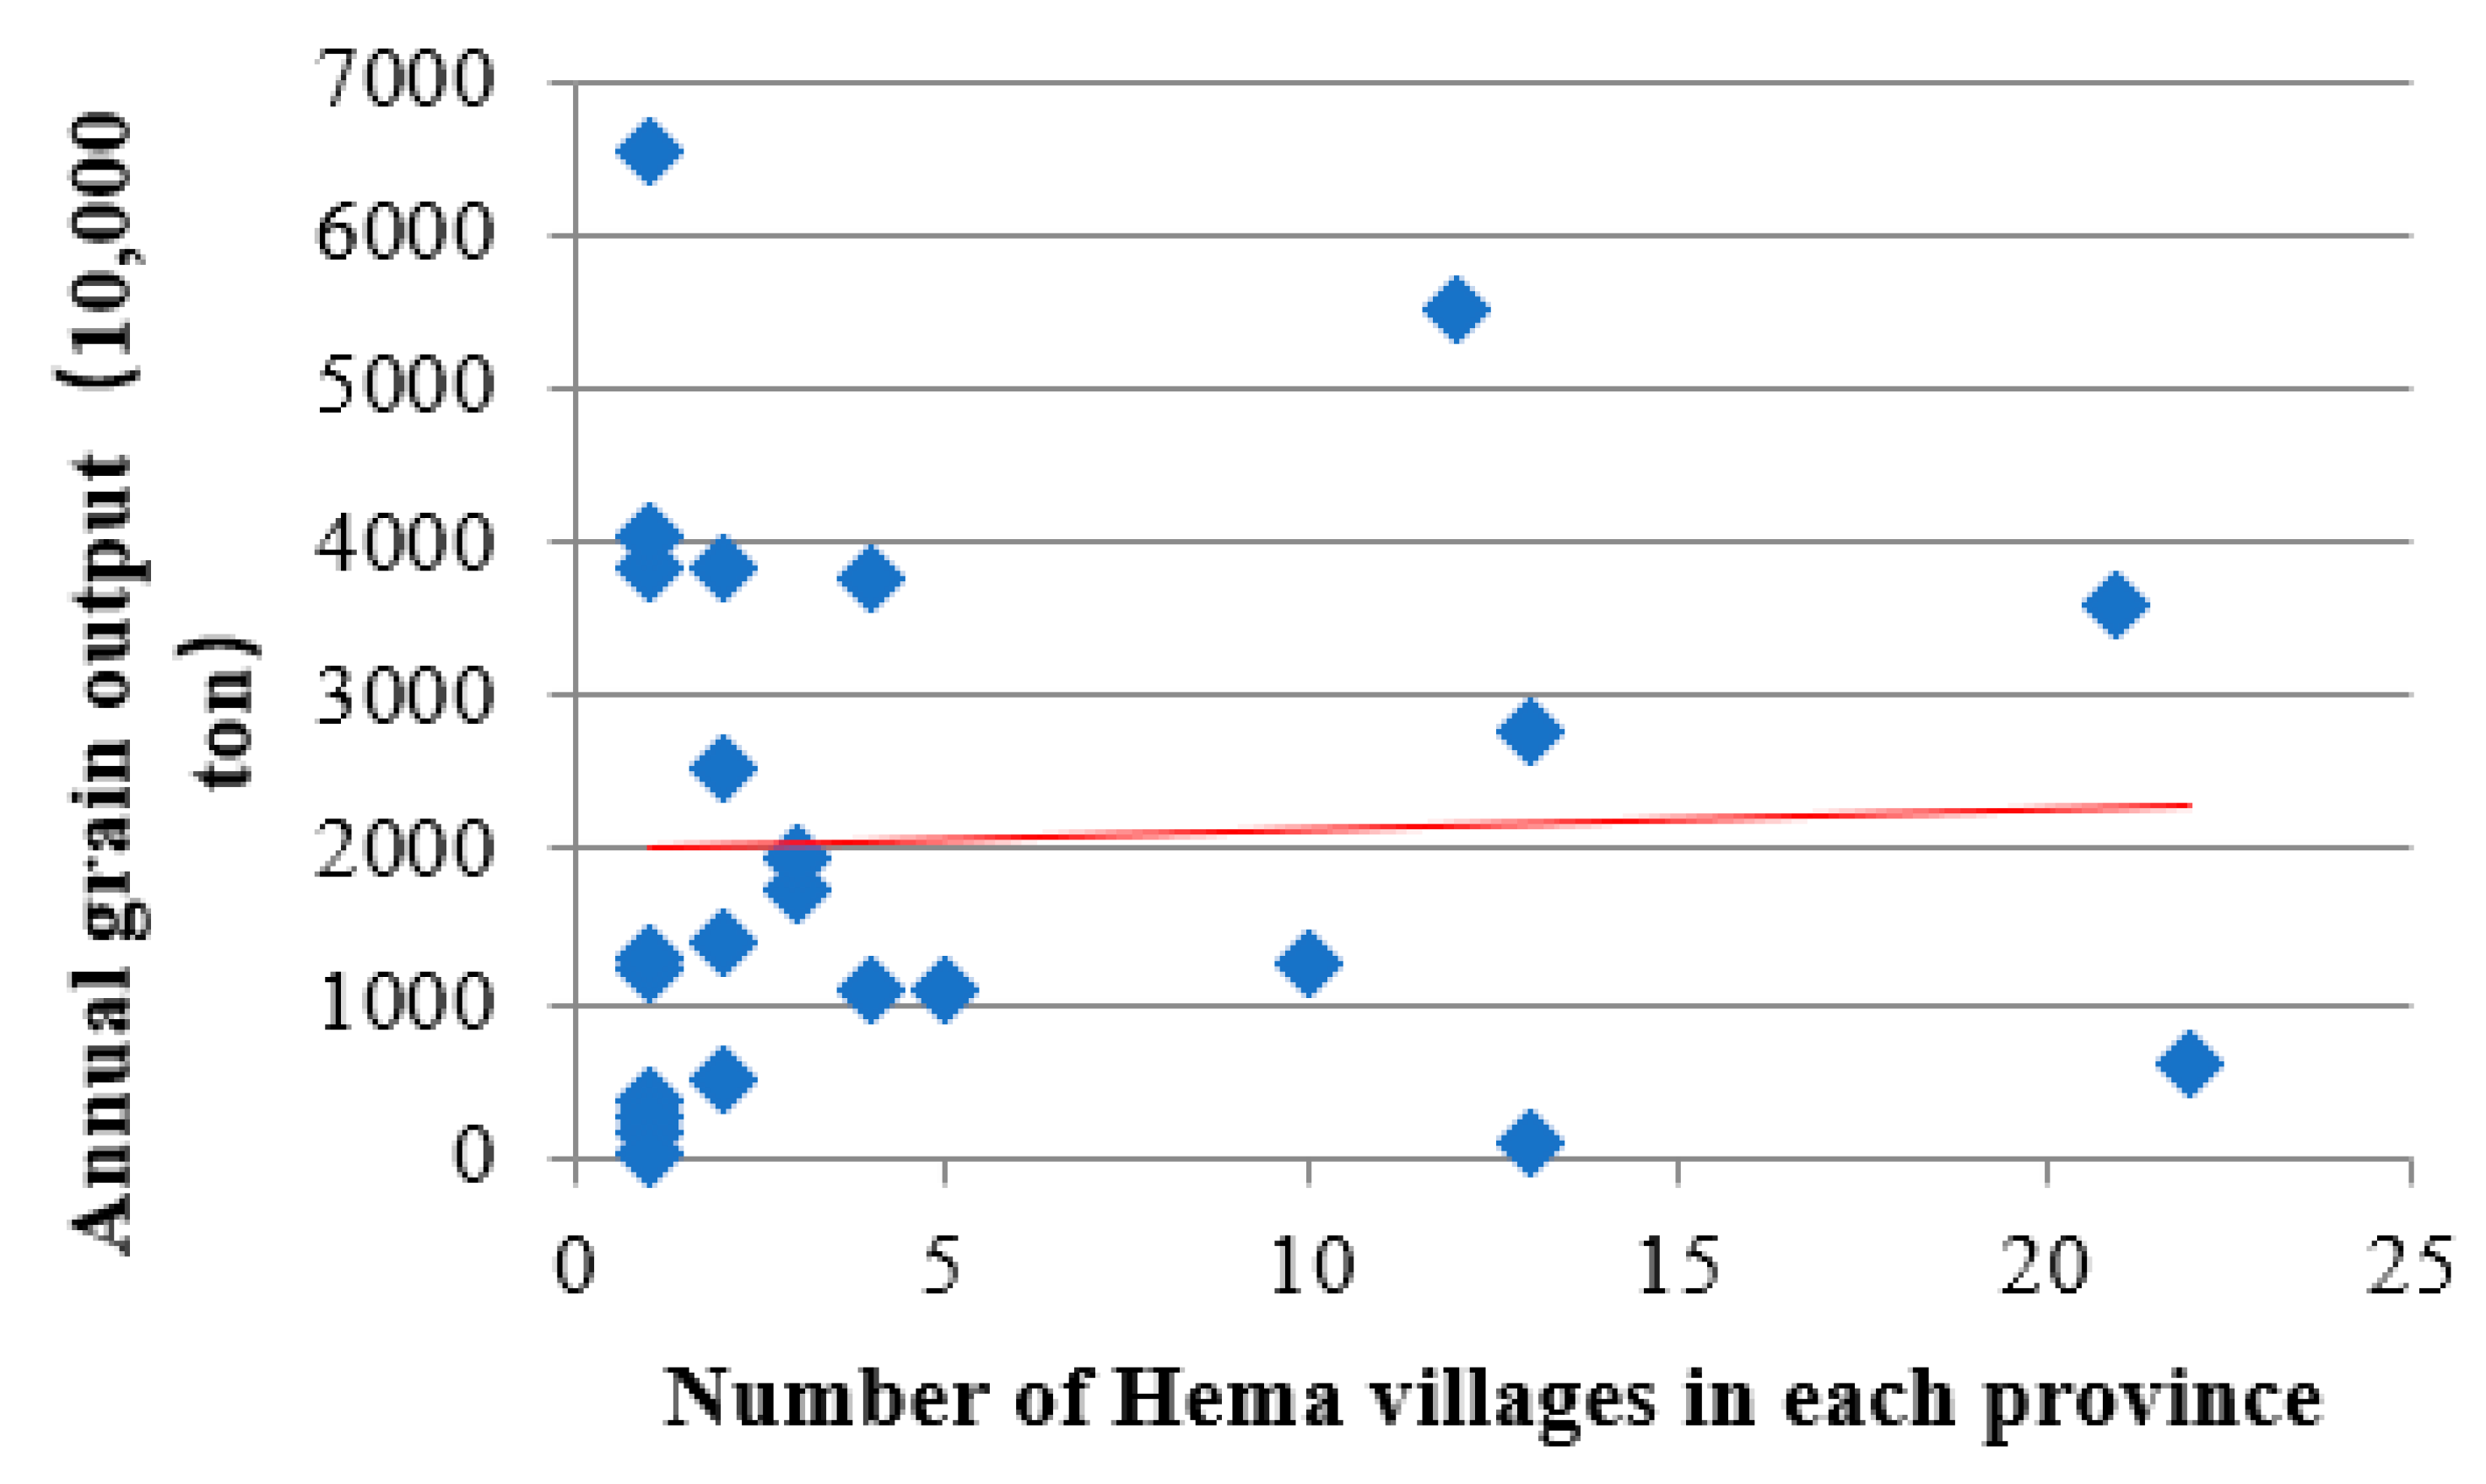
Based on the data on the grain output of each province in 2021 and the number of Freshippo villages in each province, a regression equation was finally obtained via linear regression equation analysis:
y = 1984.2397 + 14.2083 x
where x is the number of Freshippo villages in each province and y is the grain output of each province in 2021 with a unit of 10,000 tons. Figure 2 shows the visualized result.
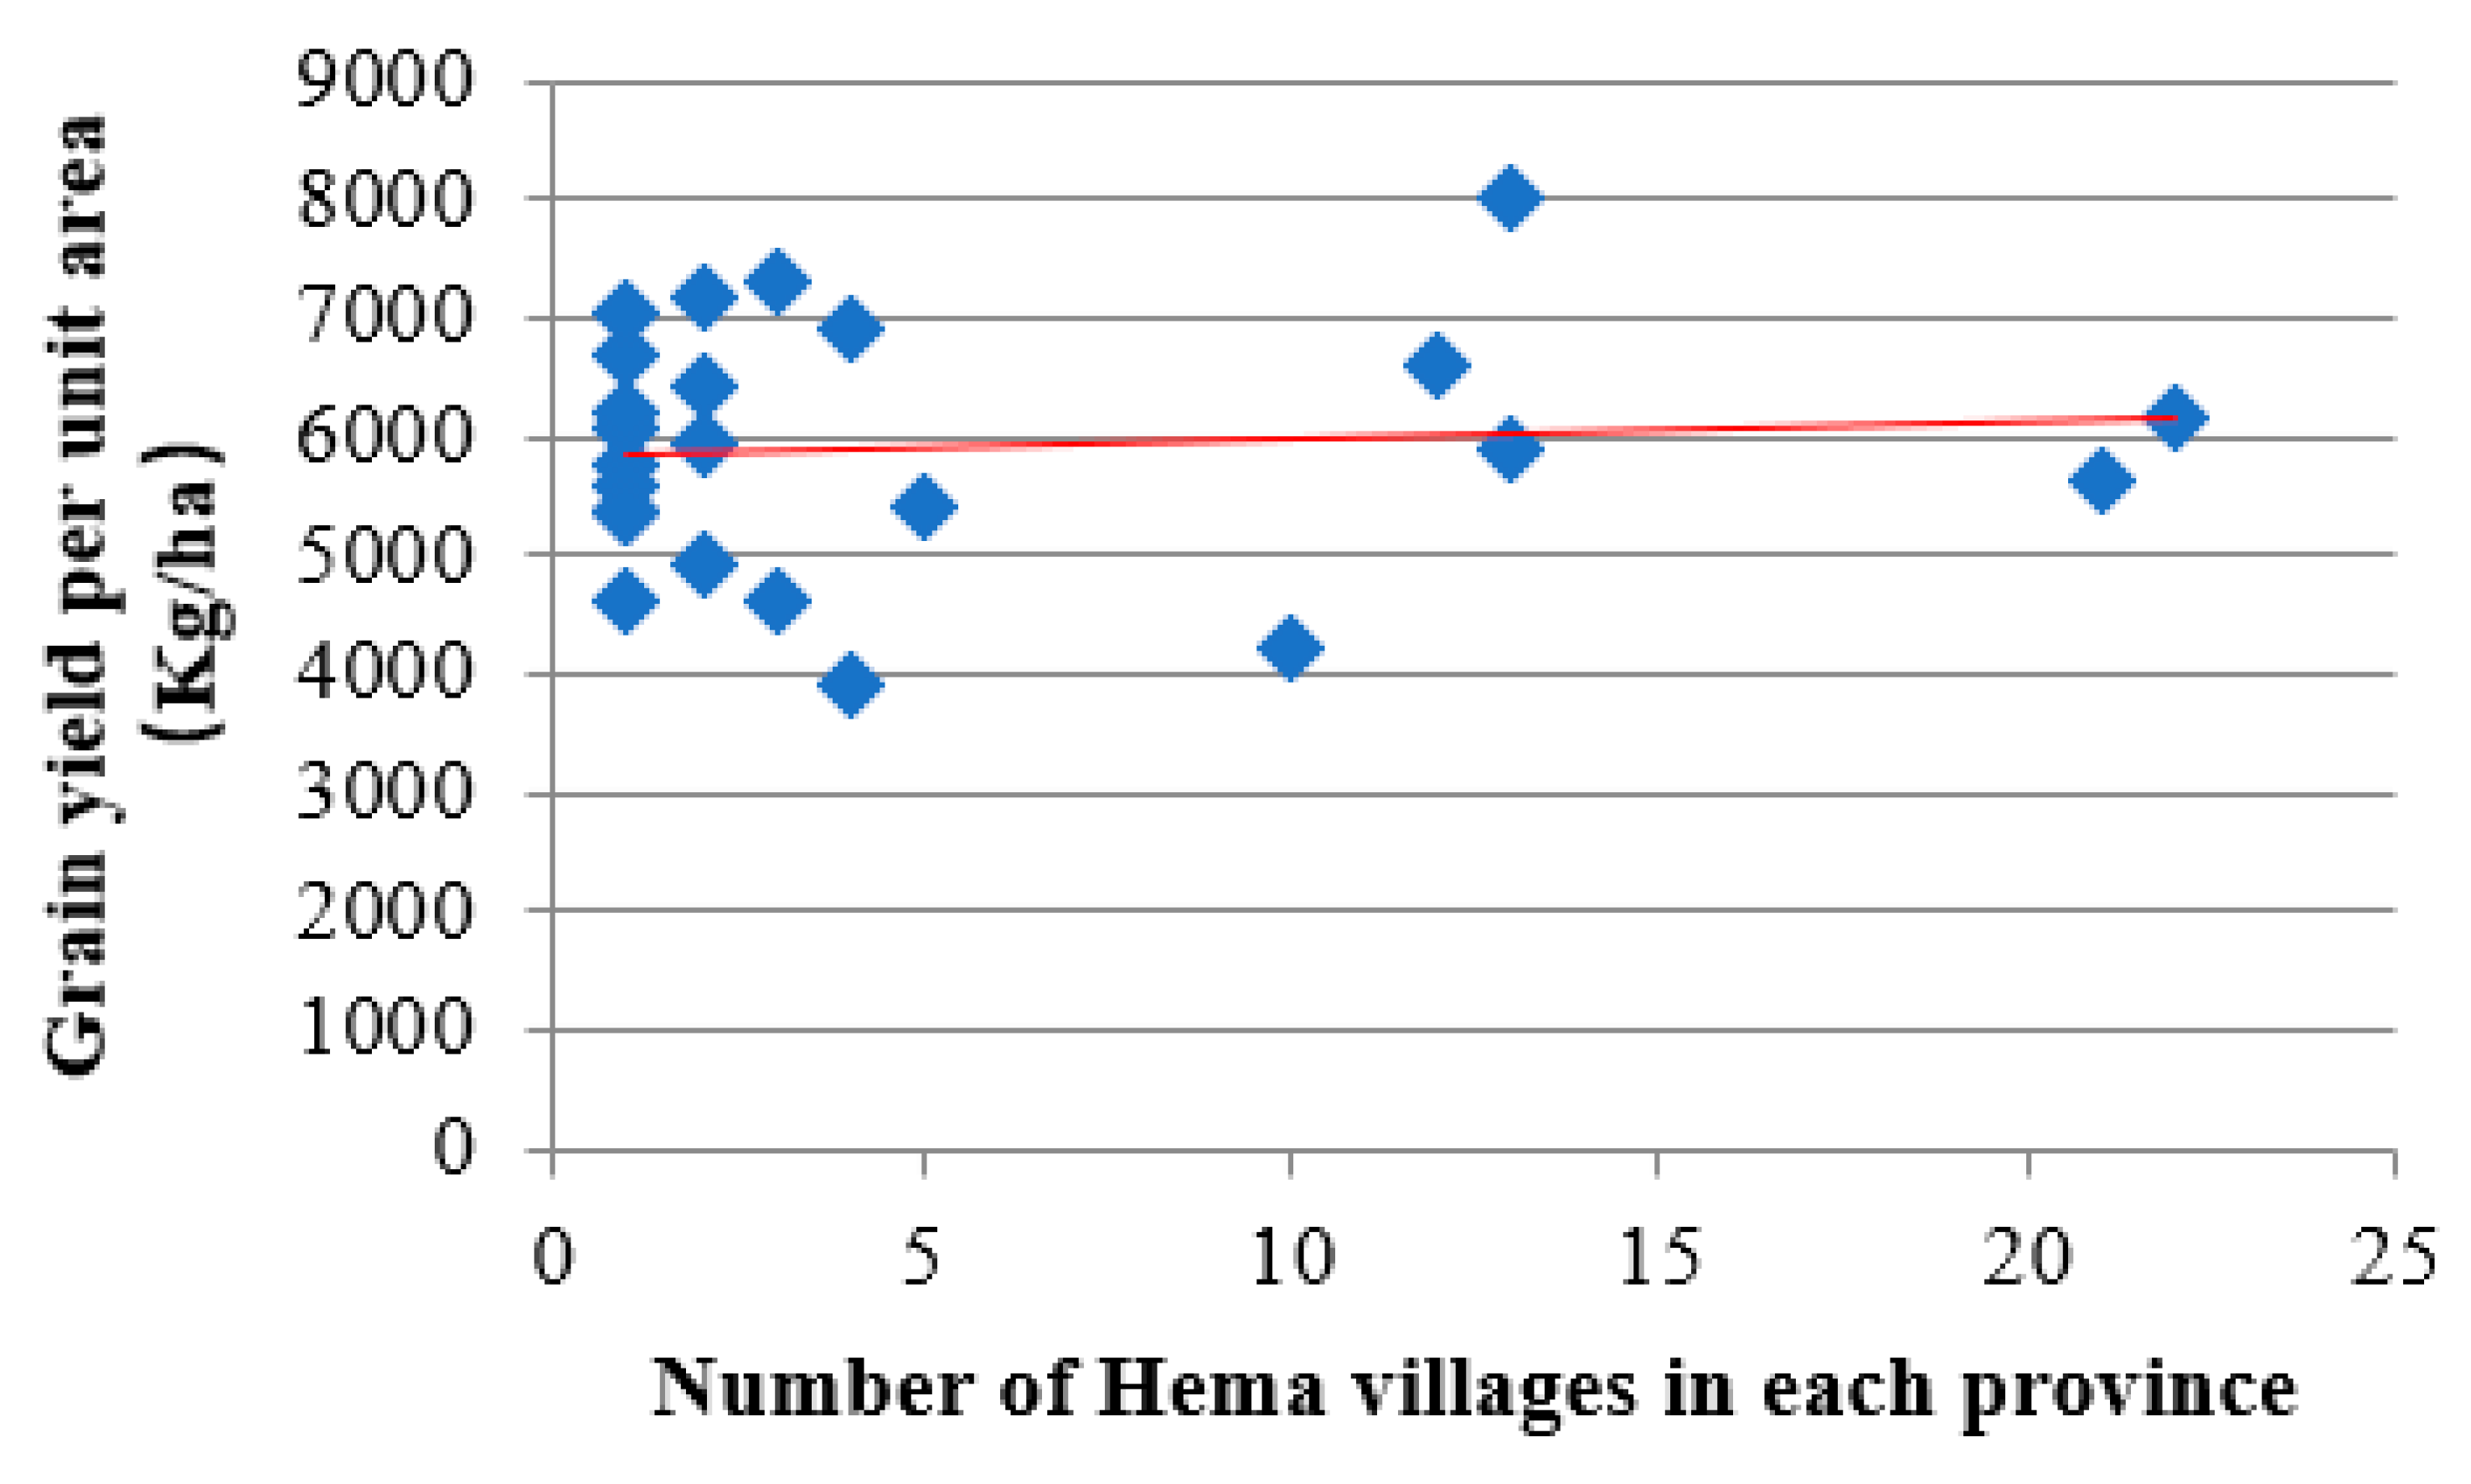
Based on the data of grain yield per unit area of each province in 2021 and the number of Freshippo villages in each province, the regression equation was finally obtained:
y = 5834.2235 + 14.4625 x
where x represents the number of Freshippo villages in each province, and y is the grain yield per unit area of each province in 2021 with a unit of kg/ha. The visualized result is shown in Figure 3. Combining Formulas (2) and (3), it was observed that the number of Freshippo villages had little correlation with grain yield.
2.
Fruits and vegetables
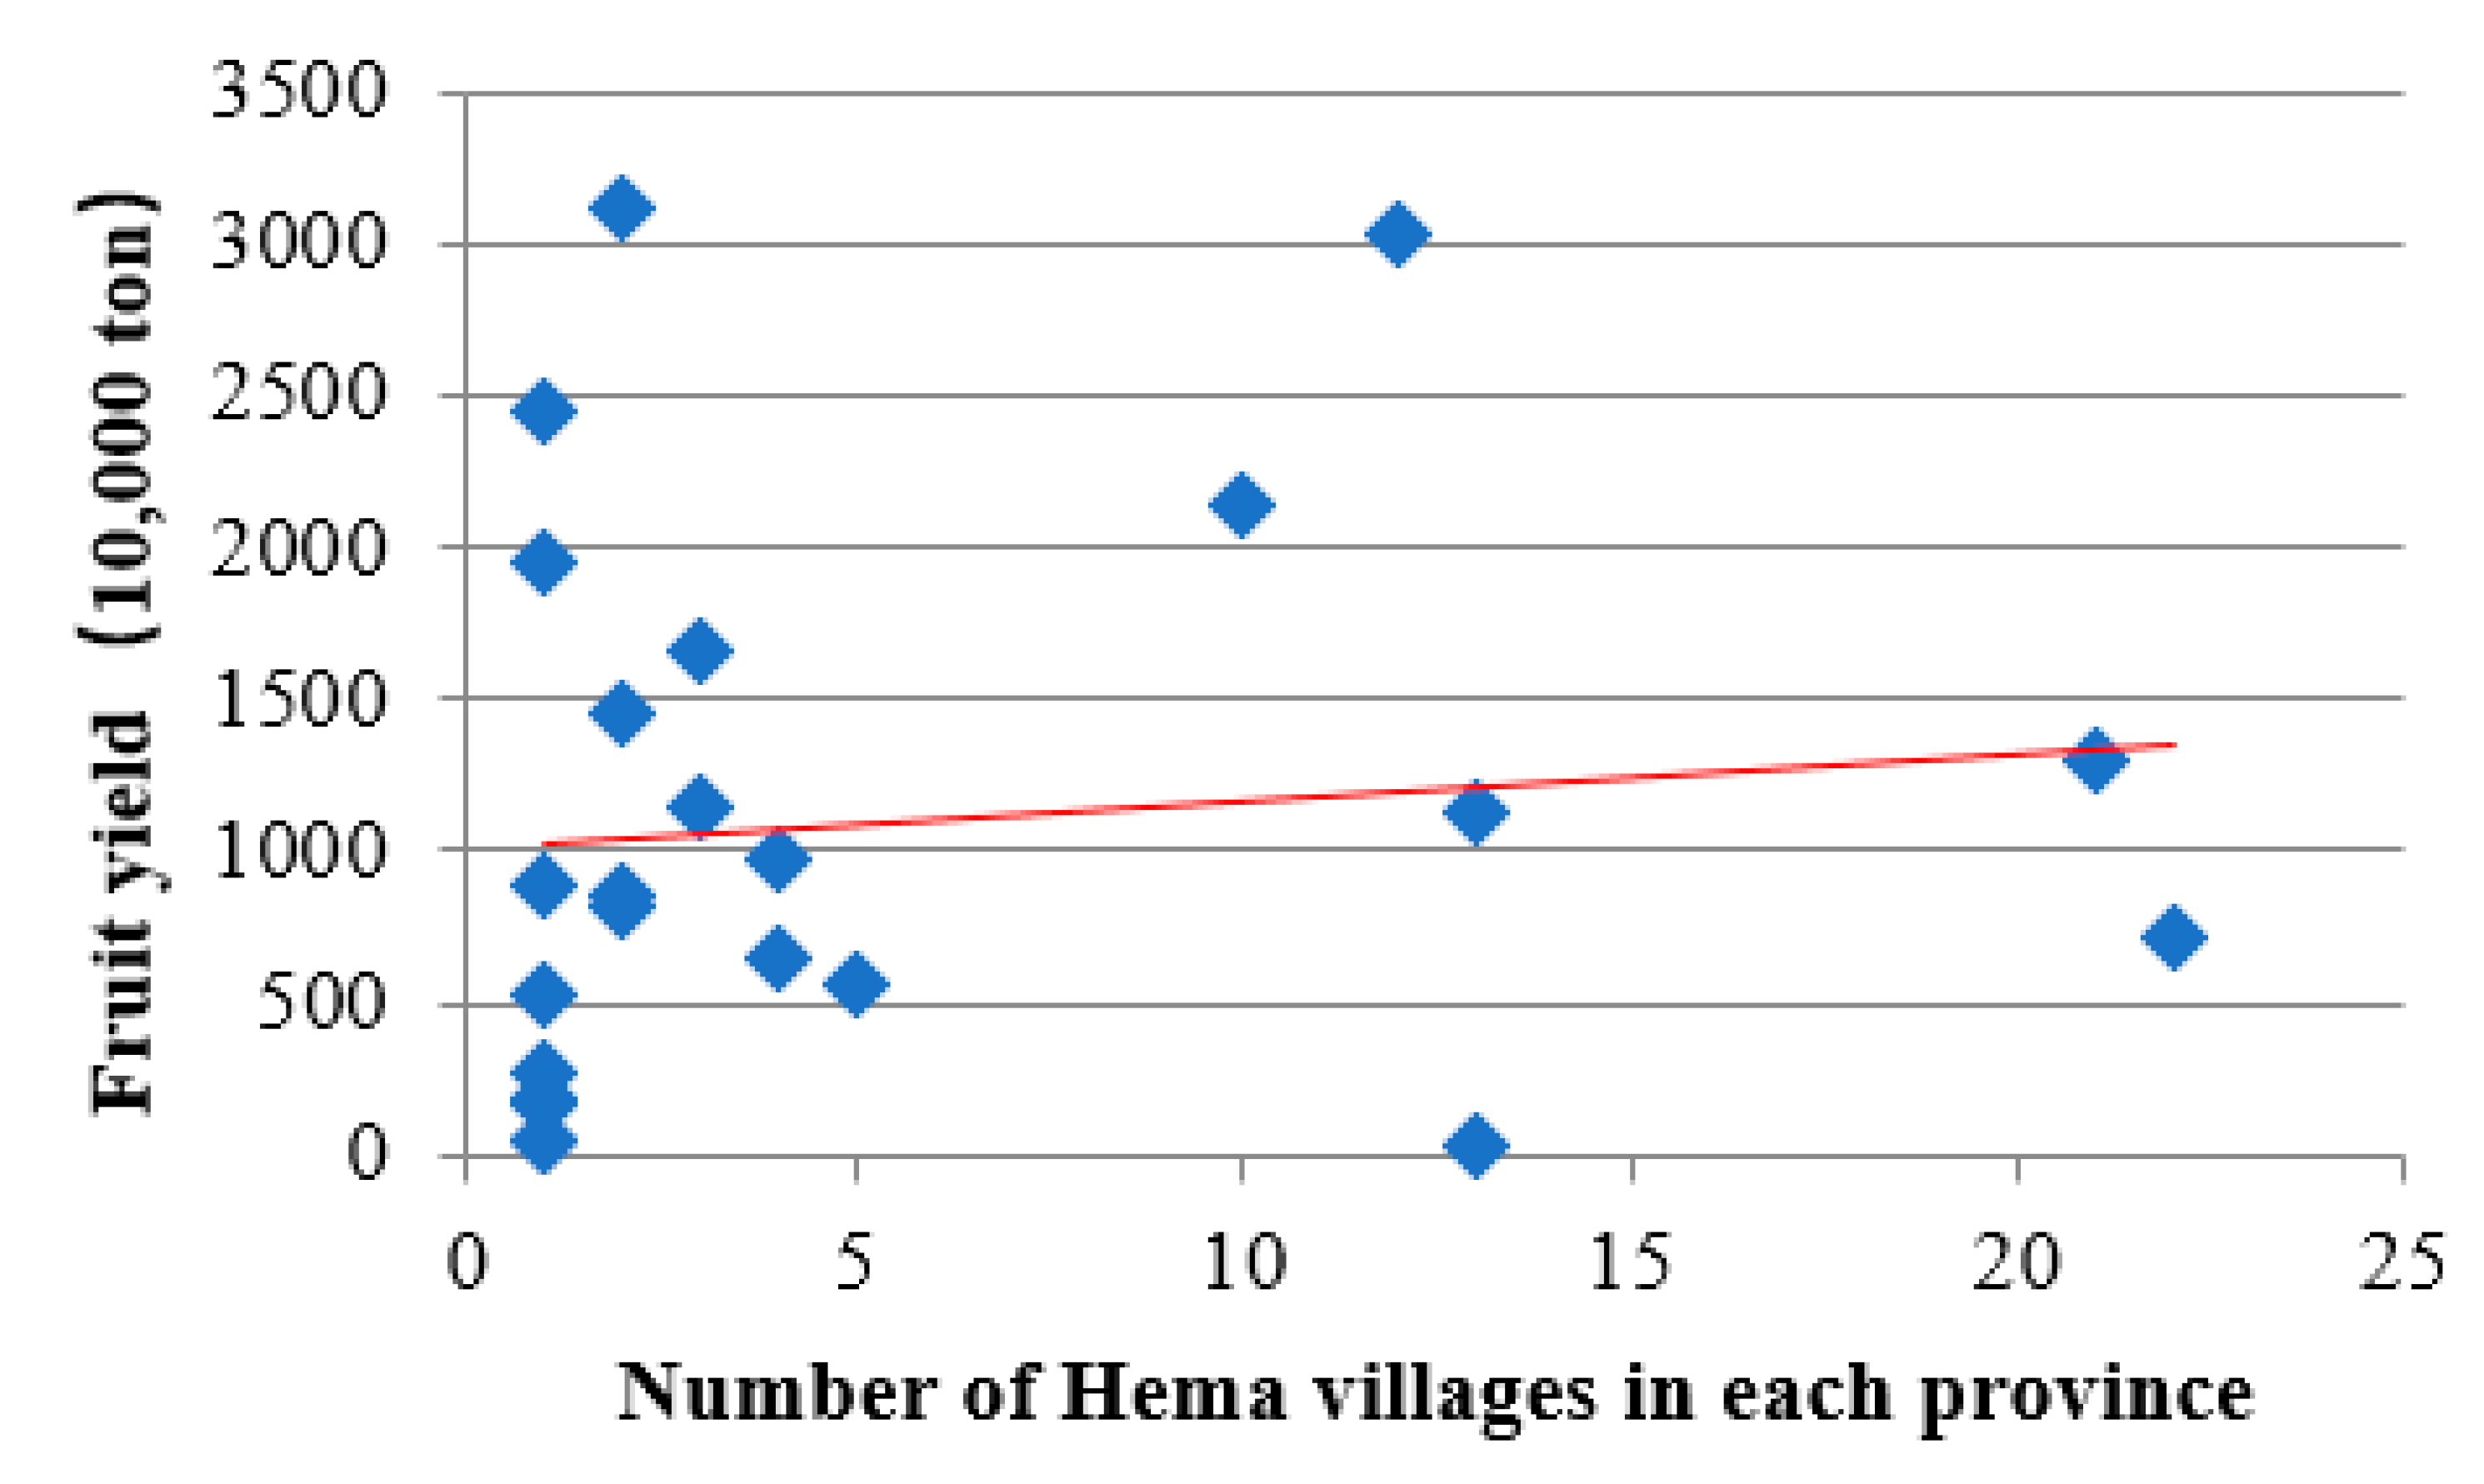
Then, based on the fruit yield data of each province in 2021 and the number of Freshippo villages in each province, a regression equation was finally obtained via linear regression equation analysis:
y = 1005.5583 + 15.3991 x
where x is the number of Freshippo villages in each province, and y is the grain yield per unit area of each province in 2021 with a unit of 10,000 tons. Figure 4 shows the visualized result.
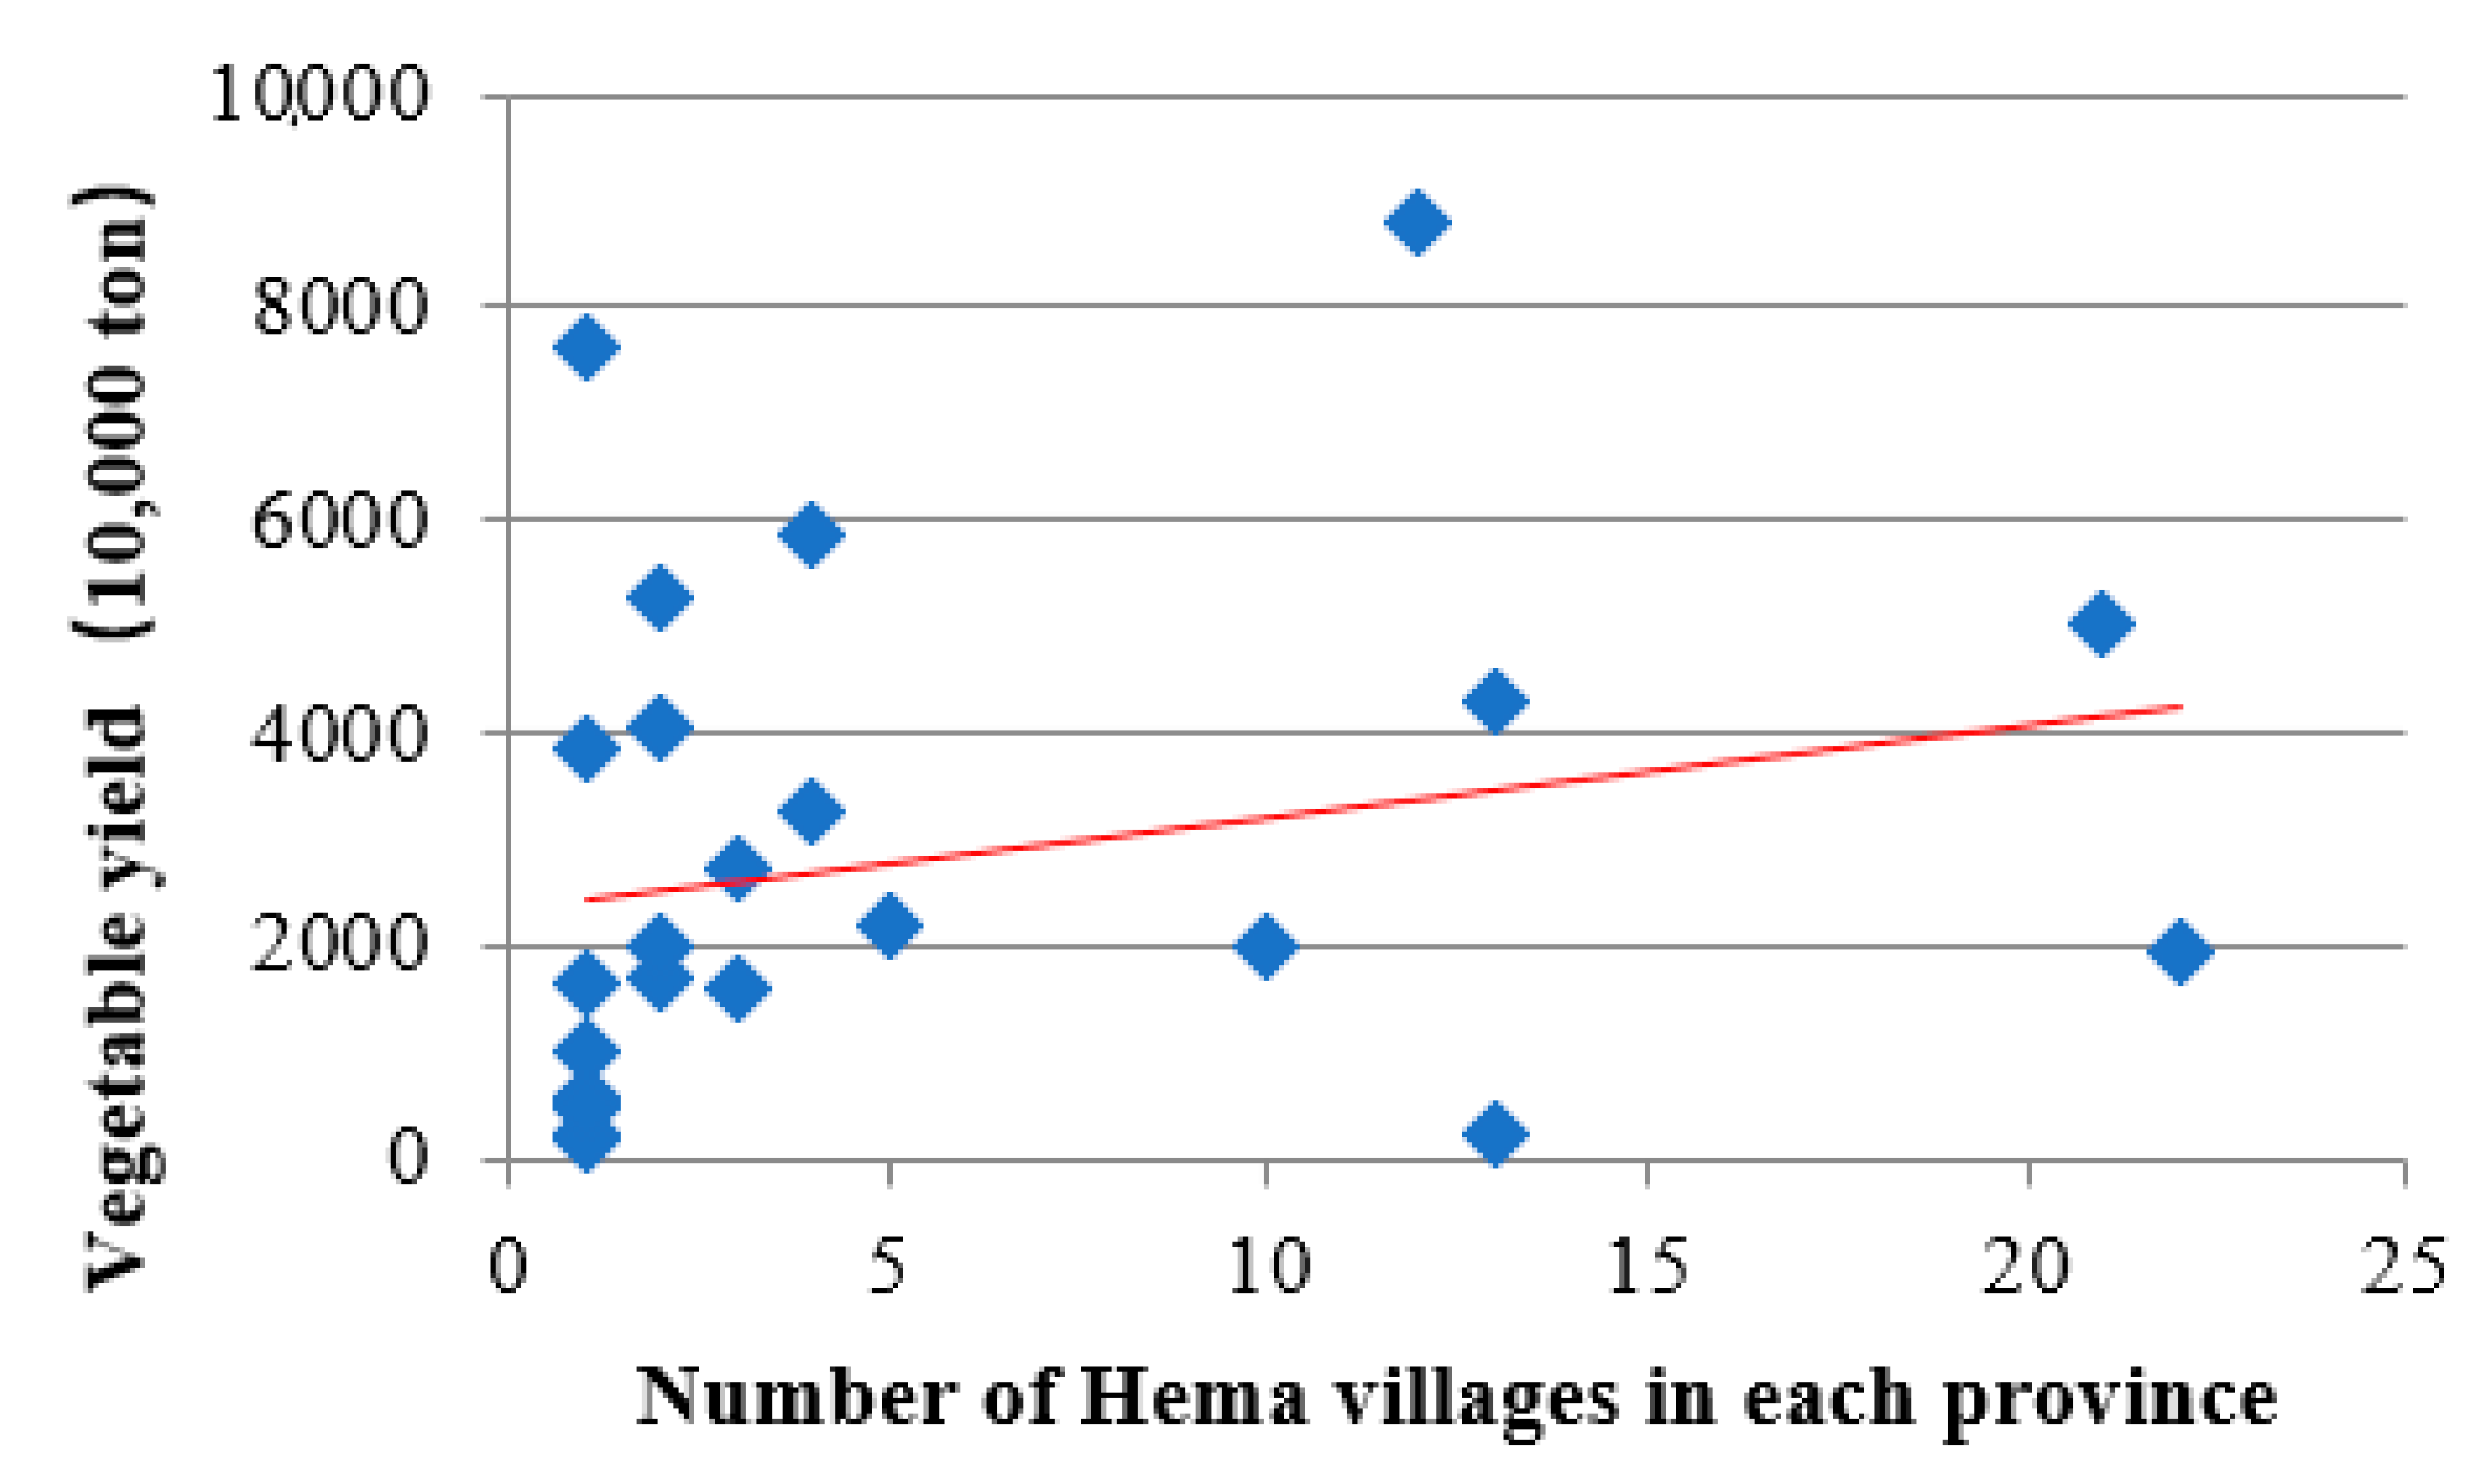
Then, based on the vegetable yield data of each province in 2021 and the number of Freshippo villages in each province, the regression equation was finally obtained via linear regression equation analysis:
y = 2342.5298 + 86.1542 x
where x is the number of Freshippo villages in each province, and y is the vegetable yield of each province in 2021 with a unit of 10,000 tons. Figure 5 shows the visualized result.
Combining statistical analysis Formulas (4) and (5), it was observed that the number of Freshippo villages has an obvious positive correlation with the annual output of vegetables and fruits, especially vegetables, which is in line with the objective fact that Freshippo villages output vegetables, fruits, and other fresh agricultural products as their main crops.

3.2.2. Correlation between Freshippo Villages and Freshippo Stores

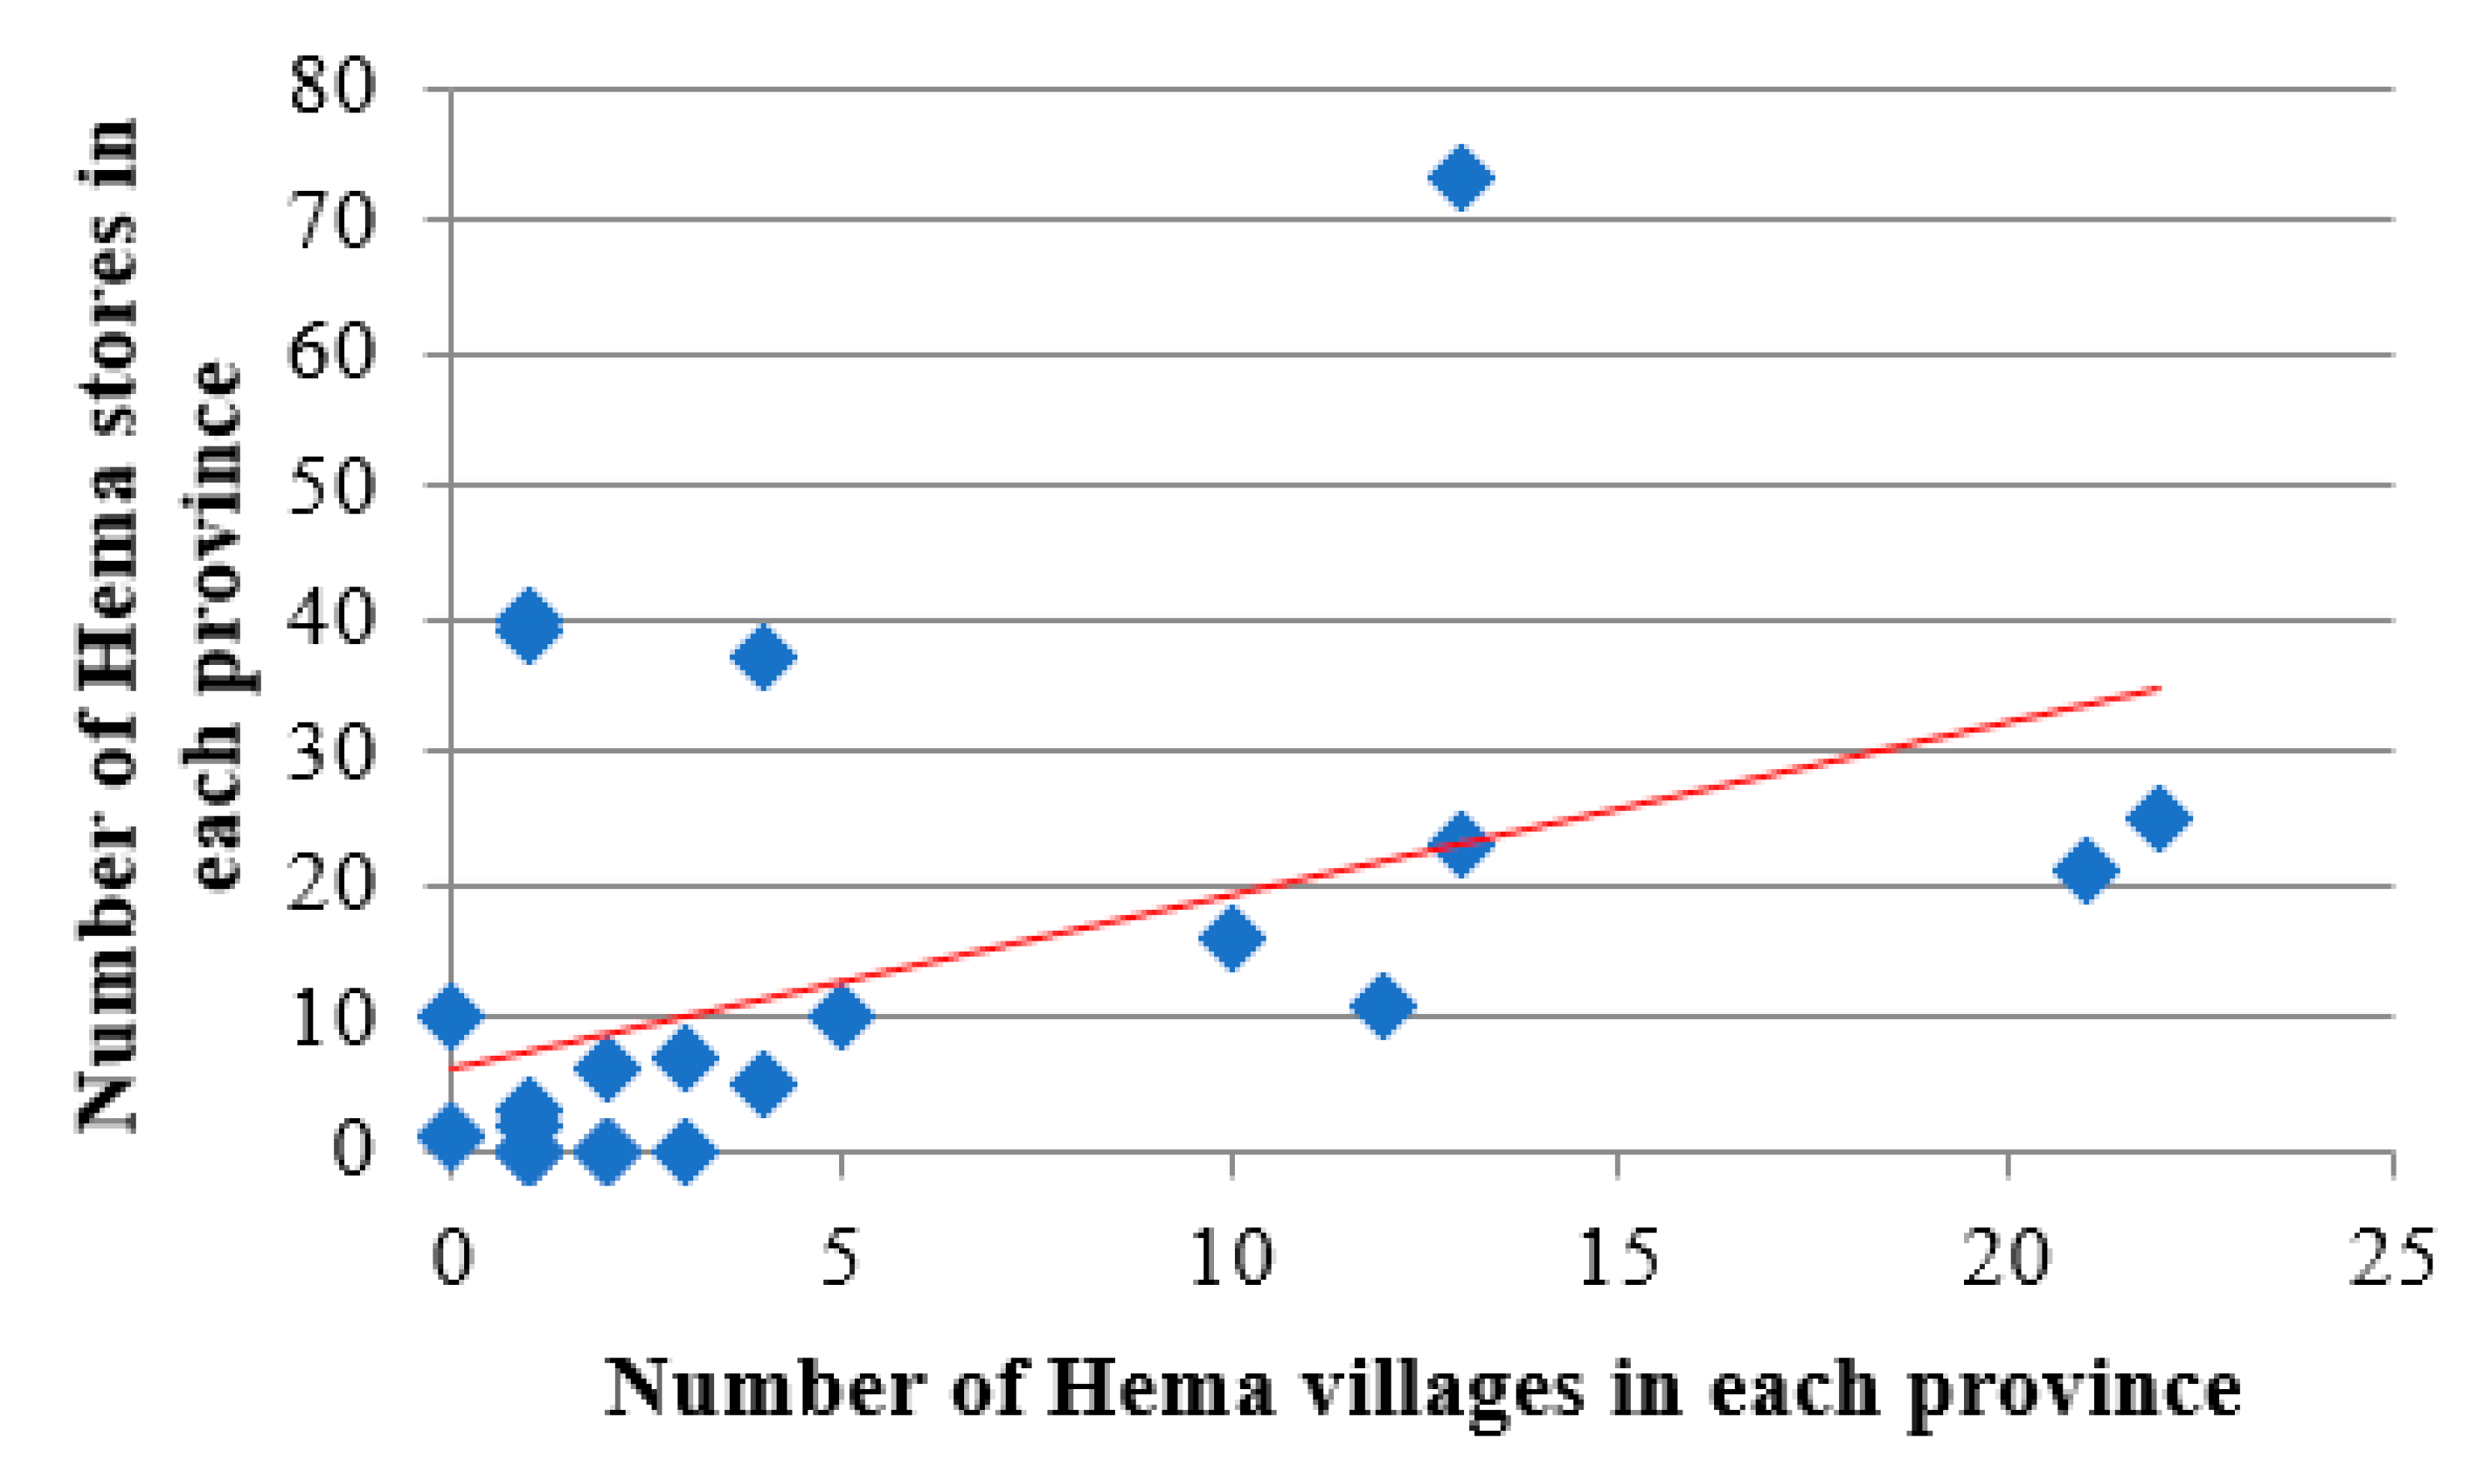
Then, we analyzed the market based on the nearest neighbor’s location, because some production areas are dependent on the markets. According to the statistics, there are three more provinces with Freshippo stores than with Freshippo villages. Thus, the number of Freshippo villages in these provinces was set to 0. Based on the number of Freshippo stores and the number of Freshippo villages in each province, a regression equation was finally obtained via linear regression equation analysis:
y = 6.1015 + 1.3012 x
where x is the number of Freshippo villages in each province, and y is the number of Freshippo stores in the same province. Figure 6 shows the visualized result.
From Formula (6), we know that the number of Freshippo villages and the number of Freshippo stores have a very significant positive correlation. It should be noted that there is a situation where Freshippo villages are closer to the market stores in non-provinces, but the analysis’s results are still significantly positive, which further explains the importance of the market.

3.2.3. Comparative Analysis of the Correlations of Freshippo Villages

Linear regressive analyses can show the positive correlation of one factor, but all five formulas above from (2) to (6) have different y-intercepts. Different y-intercepts result in different bases, and they have an effect on the comparison of different factors. Therefore, only the gradient is insufficient for our ratiocination about products and the market. In order to perform quantitative comparisons, we use a ratio gradient/y-intercept to show the function of the per-axis unit. Furthermore, we calculate several indexes such as the Pearson product-moment correlation coefficient (PPMCC), the P value under a two-tail two-sample equivariance T-test, and the R squared for each factor of 27 provinces.
Table 2 shows a comparison of the indexes between different correlations of Freshippo villages, where P values are less than 0.05 in all. Although some numbers of these indexes are not large, Freshippo stores have the highest gradient/y-intercept, PPMCC, and R squared, which indicates a higher response variation of Freshippo stores. In addition, all gradient/y-intercepts, PPMCC, and R squared of grain crops are lower than those of fruits and vegetables. The multiple advantages of fruits and vegetables are in line with the sale of fruit- and vegetable-oriented fresh agricultural products in Freshippo stores. In addition, our implemented multiple linear regression result y = 3.6065 + 0.162x1 − 0.0004x2 − 0.0004x3 + 0.0001x4 + 0.0009x5 also shows the higher gradients of Freshippo stores, fruit, and vegetables with significant differences, where x1, x2, x3, x4, x5 represent the numbers of Freshippo stores, grain output, grain yield per unit area, fruits yield, and vegetable yield, respectively. Multiple regression assesses the multivariate nature of interactions between the regressors and the variable of interest. Via the above comprehensive analyses, it can be concluded that agricultural products and the market are the two important factors for the location of Freshippo villages.

4. Discussion

In the last section, we analyzed the spatial distribution characteristics of Freshippo villages in China by using the KDE method and performed further statistical analysis on the correlation of Freshippo villages using the linear regression method. KDE suitably quantitated the spatial clustering status of Freshippo villages based on the spatial unit and geographic distance, and these assisted in finding spatial distribution patterns such as cores and belts. The linear regression method successfully analyzed the correlations of several important factors based on provincial statistics, where the ratio of parameters was constructed to conduct a comparative analysis of these correlations. Based on methodological experiments, we observed that the Yangtze River Delta, Shandong, Hubei, and Sichuan are the spatial clustering areas of Freshippo villages. Three main spatial distribution belts with respect to Freshippo villages formed: the eastern coastal distribution belt, the distribution belt of the Heihe–Tengchong Line, and the 30° N distribution belt along the Yangtze River. Agricultural products and markets are still two important factors. According to the above experimental results, there remains a topic relating to spatial distribution and factors worthy of discussion: what is the spatial effect on agricultural villages under the digitalization of new retail?
From regional features, the highest number of spatial cores of Freshippo villages can be observed within the main agricultural production regions, such as Shandong, Hubei, Sichuan, and Shanxi. The findings match those observed in earlier studies [26], which shows the importance of agricultural geographic locations. However, some spatial cores of Freshippo villages are not located in the core areas of the main production regions, such as the cores in Sichuan and Hubei. A possible explanation for the local shift might be that Freshippo villages have new agriculture methods and increased digitalization [6]. For example, some Freshippo villages in Sichuan developed new plateau agriculture and planted new crops. The Yangtze River Delta exhibited greater digitalization; thus, Shanghai as a modern super-large city makes up one center of the spatial core [7].
From global features, Freshippo villages have similarities in line with the distribution of all villages in China [26], which reflects the distribution of populations. Therefore, the Heihe–Tengchong Line as an important boundary is still suitable for Freshippo villages with digital agriculture [21]. All three main spatial belts are located to the east of this line, which is in accordance with recent studies indicating that the eastern area always contained the main farmlands of China within the last 1000 years [30]; moreover, agricultural digitalization in the east of China is better than that in the west [7,16]. Contrary to expectations, this study found that the gap between the east and the west is currently small and that the east and the west both have a distribution belt that exhibits developments only within the last 4 years; this shows the inclusiveness of digitalization across geographic distances [7].
Compared with other types of villages, Freshippo villages show several distribution features. Firstly, the distribution of Freshippo villages is cross-regional, which is different from traditional models, such as those with geographical names, e.g., the South Jiangsu model [2]. Modern agriculture requires the participate of the geographical location of all elements. In a digital agricultural economy, the geographical response distance between markets is shortened due to different geographical locations with respect to agricultural production [6]. There is a digital space of flows that contains the integrated development of original warehouses, people, goods, funds, and information; thus, the development of a cross-regional agricultural economy has gradually taken shape. As argued in [7], this shape not only promotes the development of new agriculture but also forms a new development space for a digital agricultural economy, which reconstructs the geographical spatial distribution pattern of new modern agricultural economies. This is the reason for using a cross-regional economic model.
Compared with similar cross-regional models such as Taobao villages, Freshippo villages currently exhibit a wider distribution, and Taobao villages mostly cluster in the east of China [36]. The digitalization of new retail can expand the space of flows and improve agricultural supply–demand modernization [7]. Many Freshippo villages converge at 30° N, although there is also an eastern coastal distribution belt. In this case, 30° N is one main traditional agricultural belt in China, and there are also some super-large cities, such as Shanghai, Nanjing, Wuhan, Chengdu, and Chongqing. Thus, nearby agricultural products and markets drive the main 30° N distribution belt as a cross-climate area. At the west end of the 30° N distribution belt, the cross-regional model makes a breakthrough with respect to the Heihe–Tengchong Line by developing new plateau agriculture based on the digitalization of precise agriculture [14]. Therefore, digitalization opens up a new virtual–real integrated geographical space with respect to agricultural development, which expands the meaning of economic geography and gives the areas of climate boundary a new spatial meaning.
By focusing on the correlation analysis, Freshippo stores, fruits, and vegetables that are more related to Freshippo villages all have a higher ratio of gradient/y-intercept and PPCMM than grain, exhibiting 0.2133 and 0.4599, 0.0153 and 0.2190, and 0.0367 and 0.1222, respectively. The statistical results just met our estimation, which is that agriculture products and markets are two important factors with respect to the rural location in a digital agricultural economy [7]. For example, there are many farmlands in the northeast of China, but only some Freshippo villages are located there. This is because there are no Freshippo stores, and grain is the main agricultural product. Surely, this current status can change with the improvement in agricultural digitalization [48]. Shanghai does not have many crop yields; due to Shanghai being a modern city exhibiting high consumption, it has a few more than 80 Freshippo stores at most. Shandong does not have many gathered Freshippo stores, and its agricultural products mostly come from traditional farmlands. Thus, agriculture products and markets can be complementary. It is somewhat surprising that Guangdong has only several Freshippo villages, as this province has a climate that propagates rich species and many Freshippo stores. We speculate that this might be due to the fact that as a high-modernization region, there are many other digital industrial villages, tourism villages, and cultural villages, such as the Zhujiang model [6] and Taobao villages [20,36], and these have an effect on agriculture. Thus, a digital agriculture economy is also affected by other industries, and this has no substantial effect on our study in terms of agriculture itself.
By 1 January 2023, Freshippo—founded in 2016—had been in development for six years. Based on corporate lifecycles [49], Freshippo as a 6-year-old company is probably still at the end of its development stage. Therefore, we can use linear regression since Freshippo villages have developed for 4 years and have had sufficient time to spread across the country and even extend globally. Surely, digitalization can increase the development speed of platform enterprises [7]. As the president of Freshippo said, Freshippo has passed its initial development period, including the exploration period of new retail from 2016 to 2018 and the three years used for improving its retail model and optimizing its business model from 2019 to 2021; the year 2022 therefore belongs to the mature period of Freshippo. An enterprise can expand at a slower pace during its mature period [49]. However, Freshippo still maintains rapid growth and wants to construct 1000 Freshippo villages in the coming years. With fewer than 150 Freshippo villages, Freshippo is currently far away from this goal. As a project with heavy assets, the reusability and shareability of digitalization can create the conditions for agricultural sustainability [37,38], which can relieve the shortage of labor [25,28,33,34] and even avoid the Lewis point [10] and establish common prosperity [50]. Thus, for the time to come, the relationship between the number of Freshippo villages by province and the province’s attributes will also exhibit a positive correlation, and Freshippo villages will soon usher in a period of accelerated development. Surely, there may be an inverted U curve after mature development [51]. However, the development of digitalization in every province is quick, and China typically concentrates on the development of digitalization. The importance of the market is now increasingly obvious, and market-oriented supplies based on digitalization can create a new digital supply–demand connection [6,7]. Since digitization at a local level is a global priority, this case study has a multiplier effect that can slow or even eliminate the inverted U.
There are also two major limitations of our study. The study is firstly limited by the limited information obtained from Freshippo villages, which only makes this study an initial study. If there are sufficient data with details such as income, farmer, and farmland, we will investigate these details further. The other concern about the findings is their simple research methodology, but they are appropriate for the first study of the spatial distribution of Freshippo villages. Surely, more complex methods can produce more effective or in-depth results. Thus, we want to conduct a comprehensive study by using our advanced algorithms [43,52] in future works after completing a new round of investigation.

5. Conclusions

In this first study, “Spatial distribution of Freshippo villages under the digitalization of new retail in China”, our paper provides a significant case for examining the economic geography of digital agriculture. After conducting a systemic analysis and carrying out a discussion, the following can be concluded with respect to Freshippo villages in China.
  • Freshippo villages have regional clustering features, where spatial cores are mainly shown in several spatial clustering areas by using the KDE method: Yangtze River Delta, Shandong, Hubei, and Sichuan. Located within the main agricultural production regions, these spatial cores indicate the importance of agricultural geographical locations. In addition, new agriculture and increased digitalization result in a local shift in spatial cores.
  • Freshippo villages are mainly located in the south and form three main distribution belts in cross-climate areas: the eastern coastal distribution belt, the distribution belt of the Heihe–Tengchong Line, and the 30° N distribution belt along the Yangtze River. In line with the distribution of all villages, the Heihe–Tengchong Line as an important boundary is still suitable for Freshippo villages that apply digital agriculture. The current small gap between the east and the west exhibits digitalization inclusiveness by passing through geographic distances.
  • The cross-regional distribution of Freshippo villages forms a new development space with respect to the digital agricultural economy and reconstructs a geographical spatial distribution pattern of the new modern agricultural economy. The important reason for a cross-regional economic model is the shortened geographical response distance. The digitalization of new retail improves agricultural supply–demand modernization and currently results in a wider distribution, which opens up a new virtual–real integrated geographical space, expands the meaning of economic geography, and gives new spatial meanings to the areas of climate boundaries.
  • The further provincial statistical analysis of the correlation of Freshippo villages based on the linear regression method shows a higher ratio of gradient/y-intercepts and a higher correlation coefficient with respect to Freshippo stores, fruits, and vegetables than when compared with grain, which indicates that agricultural products and markets are still two important factors of a digital agricultural economy. The complementary agriculture product and market are effective cases for observing the importance of agriculture products and markets in a digital agricultural economy. In addition, the presence of many other digital industrial villages may affect the spatial distribution of digital agriculture in high-modernization regions.
  • Based on corporate lifecycles, an enterprise can expand at a slower pace during its mature period. However, as a project of heavy assets, the reusability and shareability of digitalization result in sustainable agriculture, which can relieve the shortage of labor and even avoid the Lewis point. There may be an inverted U model after a period of mature development. However, market-oriented supplies based on digitalization can create a new digital supply–demand connection, where the multiplier effect at the local level—as a global priority—can slow or even eliminate the inverted U.
  • Due to limited information and methods, this paper—as an initial study of the spatial distribution of Freshippo villages—only shows an overall distribution and analyzes several main factors. In the future, based on this study, we will continue to explore comprehensive spatial–temporal distributions and development paths of each local region in detail and provide theoretical and empirical support for future sustainable developments.

Author Contributions

Conceptualization, G.W.; methodology, G.C.; software, X.P.; validation, G.W. and G.C.; formal analysis, G.C.; investigation, X.P.; resources, G.W.; data curation, G.C.; writing—original draft preparation, X.P.; writing—review and editing, G.W. and G.C.; visualization, X.P.; supervision, G.W.; project administration, G.C.; funding acquisition, G.W. All authors have read and agreed to the published version of the manuscript.

Funding

This research was partly funded by the National Natural Science Foundation of China, grant number 51878516.

Institutional Review Board Statement

Not applicable.

Informed Consent Statement

Not applicable.

Data Availability Statement

The authors have no data to share.

Acknowledgments

The authors would like to firstly thank editors and reviewers for this manuscript. They would also like to thank Freshippo Inc. and Freshippo villages for their information and members of Urbaneuron lab for their discussions. In addition, they would like to thank Ershen Zhang for designing images and selecting methods, Pengliang Hu for assisting in the study, and Haijuan Zhao and Qing Chen for supporting the study. In particular, they would like to thank Yaping Huang, Jinfu Chen, Zhigang Li, Jingnan Huang, and Qiang Niu for their constructive suggestions.

Conflicts of Interest

The authors declare no known conflict of interest.

References

  1. An, Z. Prehistoric agriculture in China. Acta Archaeol. Sin. 1988, 4, 369–381+503–504. [Google Scholar]
  2. Fei, H. Peasant Life in China; Routledge: London, UK, 1939. [Google Scholar]
  3. Chen, H.S. The Present Agrarian Problems in China; China Institute of Pacific Relations: Shanghai, China, 1933. [Google Scholar]
  4. Chen, H.S. Landlord and Peasant in China: A Study of the Agrarian Crisis in South China; International Publishers: New York, NY, USA, 1936. [Google Scholar]
  5. Luo, B. Small Household Operation, Function Transformation, Strategy options: How can small household incorporate into the modern agricultural development pattern? Issues Agric. Econ. 2020, 1, 29–47. [Google Scholar]
  6. Chen, G.; Wang, G. Research on the Economic Mode of Hema Villages under the New Retail in China. Issues Agric. Econ. 2020, 7, 14–24. [Google Scholar]
  7. Chen, G.; Wang, G. Perspective of Hema Villages from the Space of Flows: A Developmental Reconstruction of Modernization of Agriculture and Rural Areas Driven by Digital Agricultural Economy. Issues Agric. Econ. 2023, 1, 88–107. [Google Scholar] [CrossRef]
  8. Mark, P. Community-supported agriculture in the United States: Social, ecological, and economic benefits to farming. J. Agrar. Change 2019, 19, 162–180. [Google Scholar]
  9. Hayami, Y.; Saburo, Y. The Agricultural Development of Japan: A Century’s Perspective; Columbia University Press: New York, NY, USA, 1991. [Google Scholar]
  10. Lewis, W.A. Economic Development with unlimited supply of labor. Manch. Sch. 1954, 22, 139–191. [Google Scholar] [CrossRef]
  11. He, X. Reflections on the scale of agricultural operation in China. Issues Agric. Econ. 2016, 37, 4–15. [Google Scholar]
  12. Wei, Y.D.; Lin, J.; Zhang, L. E-Commerce, Taobao villages and regional development in China. Geogr. Rev. 2020, 110, 380–405. [Google Scholar] [CrossRef]
  13. Lin, G.; Xie, X.; Lv, Z. Taobao practices, everyday life and emerging hybrid rurality in contemporary China. J. Rural. Stud. 2016, 47, 514–523. [Google Scholar] [CrossRef]
  14. Ingram, J.; Maye, D.; Bailye, C.; Barnes, A.; Bear, C.; Bell, M.; Cutress, D.; Davies, L.; de Boon, A.; Dinnie, L.; et al. What are the priority research questions for digital agriculture? Land Use Policy 2022, 114, 105962. [Google Scholar] [CrossRef]
  15. Shen, S.; Basist, A.; Howard, A. Structure of a digital agriculture system and agricultural risks due to climate changes. Agric. Agric. Sci. Procedia 2010, 1, 42–51. [Google Scholar] [CrossRef]
  16. Jiang, S.; Zhou, J.; Qiu, S. Digital Agriculture and Urbanization: Mechanism and Empirical Research. Technol. Forecast. Soc. Change 2022, 180, 121724. [Google Scholar] [CrossRef]
  17. Sultana, S.; Akter, S.; Kyriazis, E.; Wamba, S.F. Architecting and Developing Big Data-Driven Innovation (DDI) in the Digital Economy. J. Glob. Inf. Manag. 2021, 29, 165–187. [Google Scholar] [CrossRef]
  18. Wang, X.H.; Zhao, B.; Wang, X. Digital Agriculture Mode Innovation Study: Based on the Case of Netease Wei Yang Pig. Issues Agric. Econ. 2020, 41, 115–130. [Google Scholar]
  19. Martindale, L. From Land Consolidation and Food Safety to Taobao Villages and Alternative Food Networks: Four Components of China’s Dynamic Agri-Rural Innovation System. J. Rural. Stud. 2021, 82, 404–416. [Google Scholar] [CrossRef]
  20. Liu, M.; Zhang, Q.; Gao, S.; Huang, J. The spatial aggregation of rural e-commerce in China: An empirical investigation into Taobao Villages. J. Rural. Stud. 2020, 80, 403–417. [Google Scholar] [CrossRef]
  21. Hu, H.Y. The Distribution of Population in China, With Statistics and Maps. Acta Geogr. Sin. 1935, 2, 33–74. [Google Scholar]
  22. Yishao, S. Development of Rural Geography: Retrospect and Prospect. Acta Geogr. Sin. 1992, 47, 80–88. [Google Scholar]
  23. Sun, J.; Deng, J.; Li, M.; Sun, P.; Cao, W.; Fang, W.; Liang, R.; Li, W.; Hu, X. Economic geography of Southern Hebei. Acta Geogr. Sin. 1954, 20, 149–178. [Google Scholar]
  24. Wu, C.C. Promoting Areal Specialization of Agriculture through Developing Areal Predominance. Acta Geogr. Sin. 1981, 36, 349–357. [Google Scholar]
  25. Zhang, X.; Zhao, C.; Dong, J.; Ge, Q. Spatio-temporal pattern of cropland abandonment in China from 1992 to 2017: A Meta-analysis. Acta Geogr. Sin. 2019, 74, 411–420. [Google Scholar]
  26. Wang, X.; Li, X. China’s agricultural land use change and its underlying drivers: A literature review. J. Geogr. Sci. 2021, 31, 1222–1242. [Google Scholar] [CrossRef]
  27. Liu, Y. Potential of land consolidation of hollowed villages under different urbanization scenarios in China. J. Geogr. Sci. 2013, 23, 503–512. [Google Scholar] [CrossRef]
  28. Liu, Y.; Li, Y. Spatio-temporal Coupling Relationship between Farmland and Agricultural Labor Changes at County Level in China. Acta Geogr. Sin. 2010, 65, 1602–1612. [Google Scholar]
  29. Gao, X.; Cheng, W.; Wang, N.; Liu, Q.; Ma, T.; Chen, Y.; Zhou, C. Spatio-temporal distribution and transformation of cropland in geomorphologic regions of China during 1990–2015. J. Geogr. Sci. 2019, 29, 180–196. [Google Scholar] [CrossRef]
  30. He, F.; Yang, F.; Zhao, C.; Li, S.; Li, M. Spatially explicit reconstruction of cropland cover for China over the past millennium. Sci. China Earth Sci. 2023, 66, 111–128. [Google Scholar] [CrossRef]
  31. Liu, Y. Research on the urban-rural integration and rural revitalization in the new era in China. Acta Geogr. Sin. 2018, 73, 637–650. [Google Scholar]
  32. Fang, C. On integrated urban and rural development. J. Geogr. Sci. 2022, 32, 1411–1426. [Google Scholar] [CrossRef]
  33. Song, Z.; Li, X.; Zheng, X. Evolution and mechanism of social-economic space in the rural-urban transition zones. Acta Geogr. Sin. 2021, 76, 2909–2928. [Google Scholar]
  34. Liu, Y.; Liu, J.; Zhou, Y. Spatio-temporal patterns of rural poverty in China and targeted poverty alleviation strategies. J. Rural. Stud. 2017, 52, 66–75. [Google Scholar] [CrossRef]
  35. Liu, Y.; Zang, Y.; Yang, Y. China’s rural revitalization and development: Theory, technology and management. J. Geogr. Sci. 2020, 30, 1923–1942. [Google Scholar] [CrossRef]
  36. Zeng, Y.; Cai, J.; Guo, H. Research on China’s Taobao Village: A Literature Review. Issues Agric. Econ. 2020, 3, 102–111. [Google Scholar] [CrossRef]
  37. Nugraha, A.; Prayitno, G.; Rahmawati, R.; Auliah, A. Farmers’ social capital in supporting sustainable agriculture: The case of Pujon Kidul tourism village, Indonesia. Civ. Environ. Sci. J. 2022, 5, 235–249. [Google Scholar] [CrossRef]
  38. Prayitno, G.; Hayat, A.; Efendi, A.; Tarno, H.; Fikriyah; Fauziah, S.H. Structural Model of Social Capital and Quality of Life of Farmers in Supporting Sustainable Agriculture (Evidence: Sedayulawas Village, Lamongan Regency-Indonesia). Sustainability 2022, 14, 12487. [Google Scholar] [CrossRef]
  39. National Bureau of Statistics of China. China Statistical Yearbook; China Statistic Publishing House: Beijing, China, 2022; Available online: https://data.cnki.net/v3/Trade/yearbook/single/N2022110021?zcode=Z033 (accessed on 1 January 2023).
  40. National Bureau of Statistics of China. Announcement on the Data of Grain Output in 2021. Available online: http://www.stats.gov.cn/xxgk/sjfb/zxfb2020/202112/t20211206_1825071.html (accessed on 1 January 2022).
  41. Rosenblatt, M. Remarks on some nonparametric estimators of a density function. Ann. Math. Stat. 1956, 27, 832–837. [Google Scholar] [CrossRef]
  42. Silverman, B.W. Density Estimation for Statistics and Data Analysis; Chapman and Hall: London, UK, 1986. [Google Scholar] [CrossRef]
  43. Chen, G.; Wang, G. A Supervised Learning Algorithm for Spiking Neurons Using Spike Train Kernel Based on a Unit of Pair-Spike. IEEE Access 2020, 8, 53427–53442. [Google Scholar] [CrossRef]
  44. George, A.F.S.; Alan, J.L. Linear Regression Analysis; John Wiley & Sons, Inc.: Hoboken, NJ, USA, 2003. [Google Scholar]
  45. Wang, N.; Cheng, W.; Wang, B.; Liu, Q.; Zhou, C. Geomorphological regionalization theory system and division methodology of China. J. Geogr. Sci. 2020, 30, 212–232. [Google Scholar] [CrossRef]
  46. Thomas, C.D. Climate, climate change and range boundaries. Divers. Distrib. 2010, 16, 488–495. [Google Scholar] [CrossRef]
  47. Fang, C. Bole-Taipei Line: The important function and basic conception as a line for regional balanced development. Acta Geogr. Sin. 2020, 75, 211–225. [Google Scholar]
  48. Li, X.; Lyu, X. Judgment of China’s Food Security Situation at the Present Stage: Pay Equal Attention to Quantity and Quality. Issues Agric. Econ. 2021, 11, 31–44. [Google Scholar] [CrossRef]
  49. Adizes, I.K. Corporate Lifecycles: How and Why Corporations Grow and Die and What to Do About It; Prentice Hall: Hoboken, NJ, USA, 1989. [Google Scholar]
  50. Huang, J. Facilitating Farmer’s Income Growth and Common Prosperity through Accelerating Rural Economic Transformation. Issues Agric. Econ. 2022, 7, 4–15. [Google Scholar] [CrossRef]
  51. Kuznets, S. Economic Growth and Income Inequality. Am. Econ. Rev. 1955, 65, 1–28. [Google Scholar]
  52. Chen, G.J.; Lin, X.H.; Wang, G.E.; Wang, X.W. A Direct Computation Method of Supervised Learning for Spiking Neurons. Acta Electron. Sin. 2021, 49, 331–337. [Google Scholar]
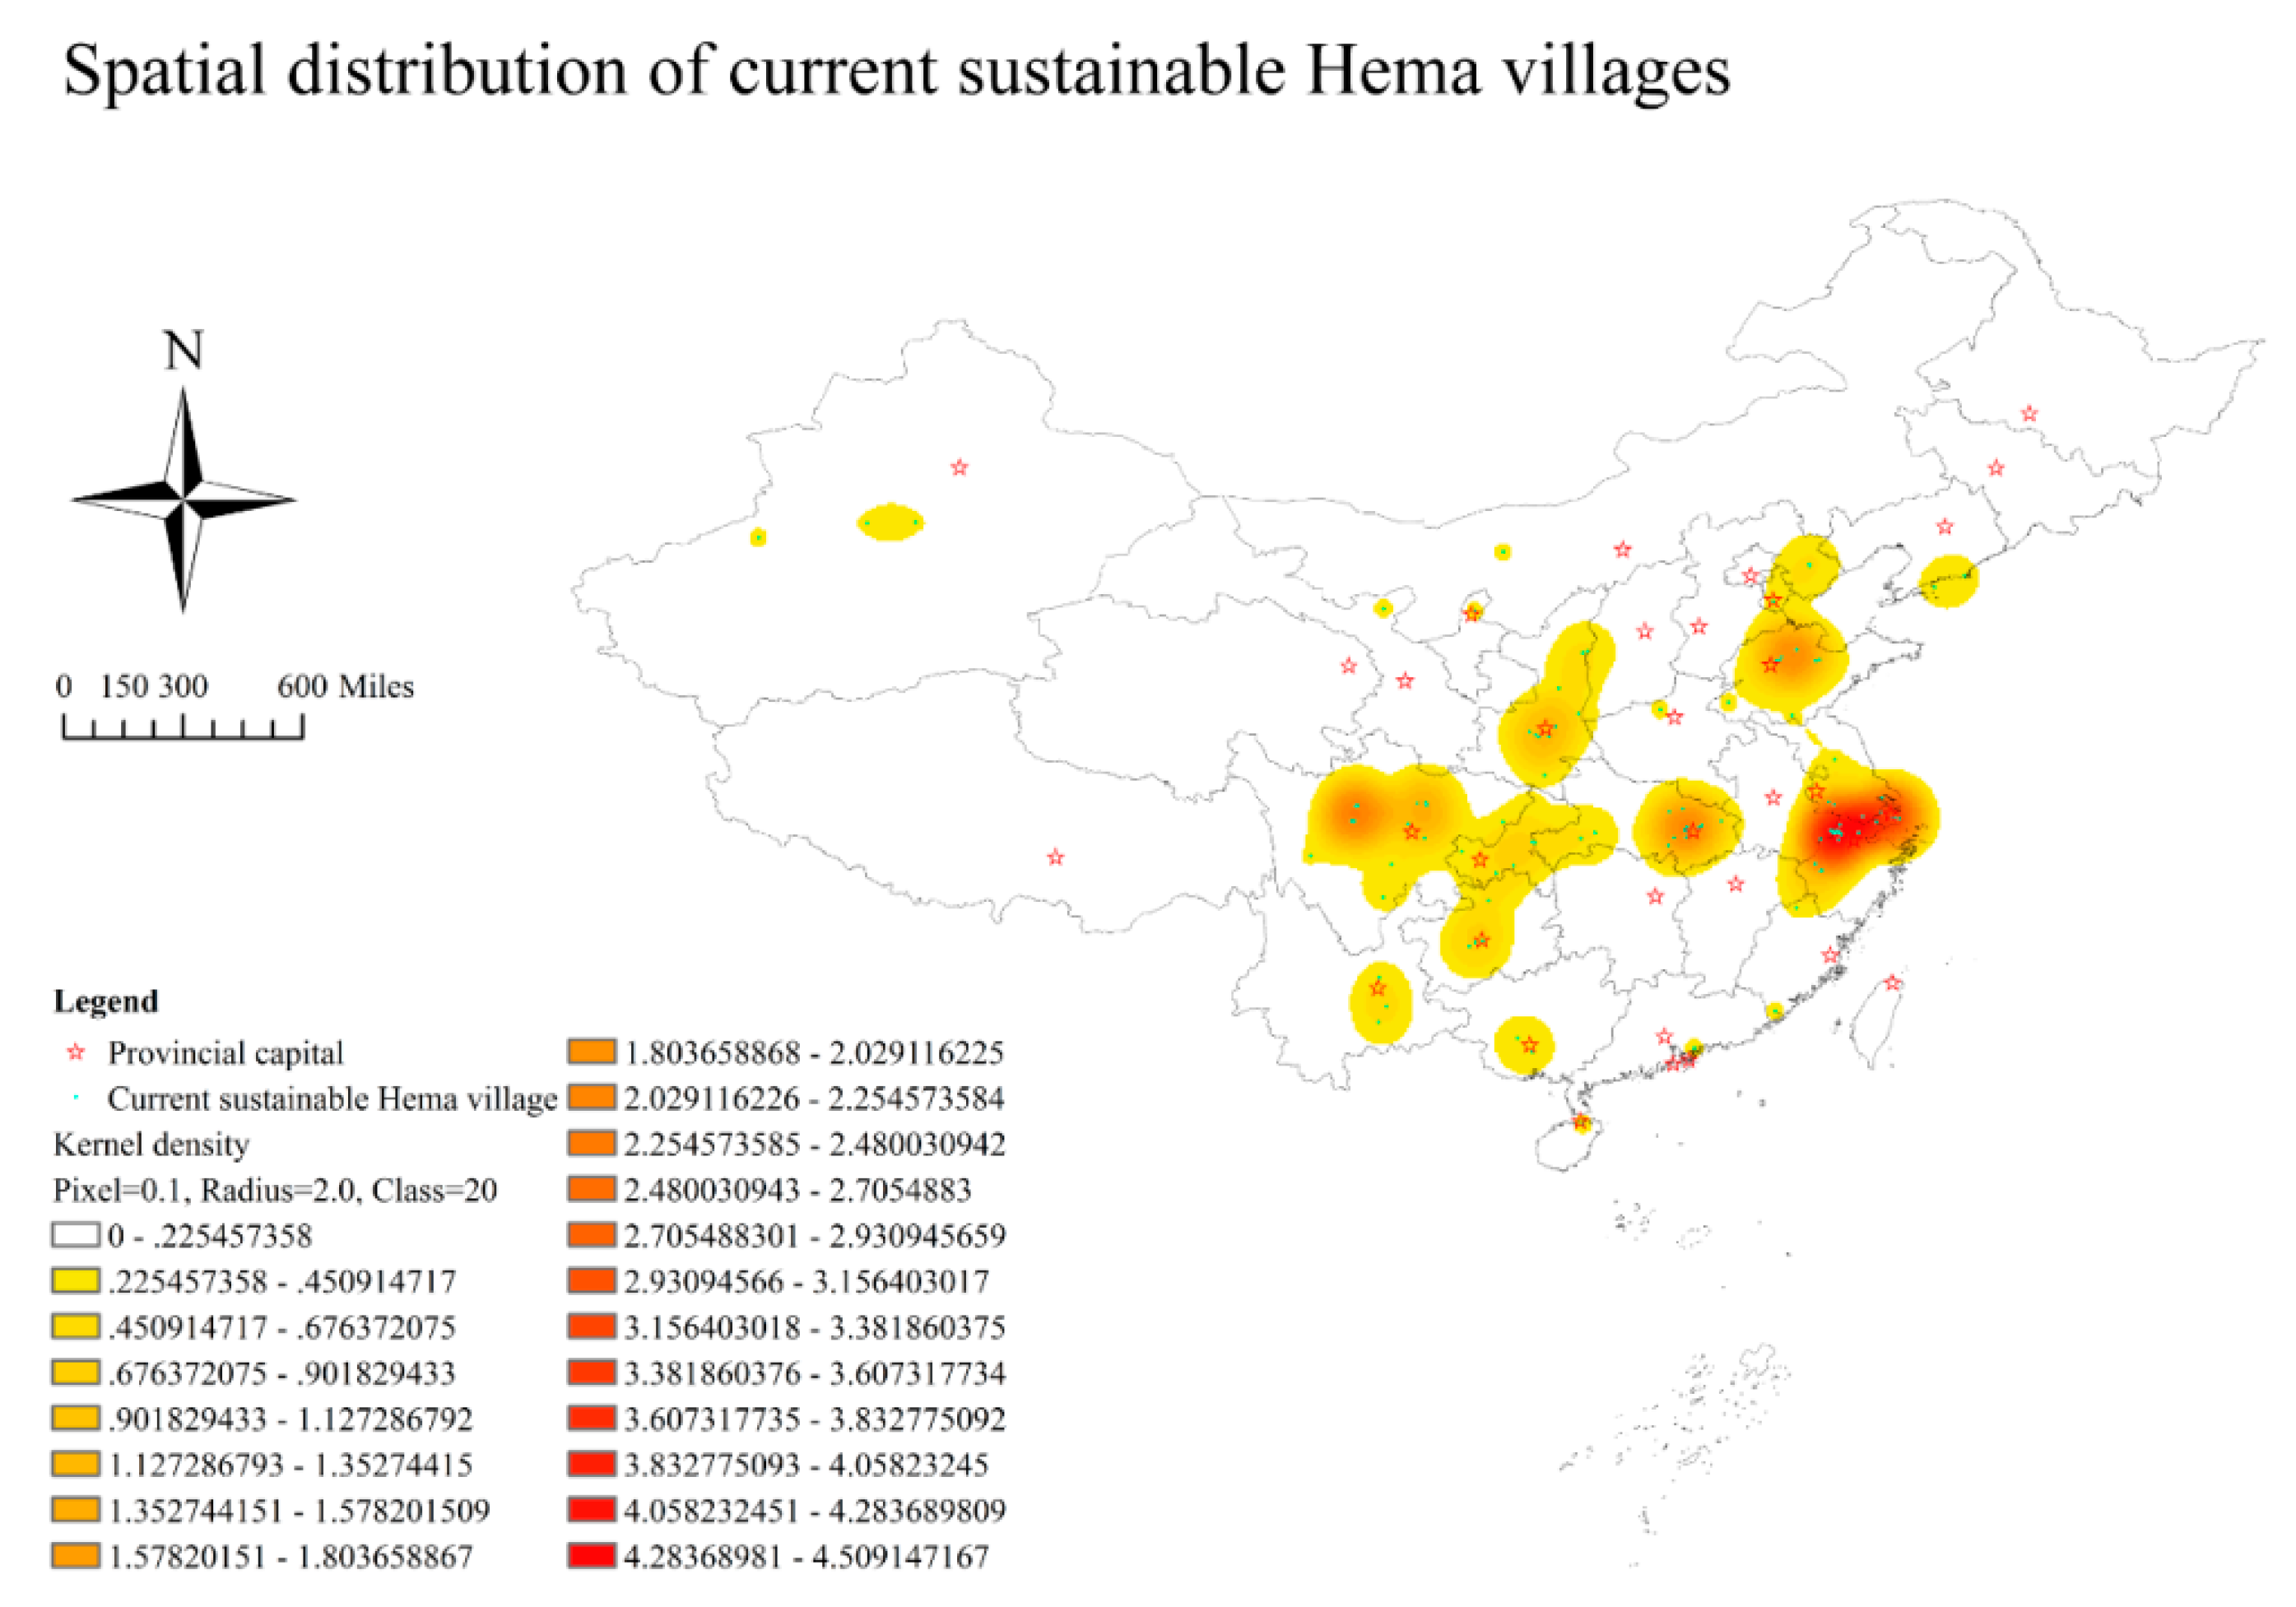
Figure 1. The spatial distribution of Freshippo villages in China.
Sustainability 15 03292 g001
Figure 2. The visualization of provincial regression analysis of Freshippo villages and grain output.
Sustainability 15 03292 g002
Figure 3. The visualization of provincial regression analysis of grain yield per unit area and Freshippo villages.
Sustainability 15 03292 g003
Figure 4. The visualization of provincial regression analysis of fruit yield and Freshippo villages.
Sustainability 15 03292 g004
Figure 5. The visualization of the provincial regression analysis of vegetable yield and Freshippo villages.
Sustainability 15 03292 g005
Figure 6. The visualization of provincial regression analysis of Freshippo stores and Freshippo villages.
Sustainability 15 03292 g006
Table 1. Information on typical Freshippo villages.
VillageLongitude/(°E)Latitude/(°N)TownCountyCityProvince
Bake101.98987230.950581MoerduoshanDanbaGanziSichuan
Pengjiazhuang114.08218830.719516BaiquanDongxihuWuhanHubei
Changda121.57500731.035705HangtouPudongShanghaiShanghai
Table 2. The comparison of the gradient/y-intercept and several indexes between different correlations of Freshippo villages.
NameGrain OutputGrain Unit Output 1FruitsVegetablesFreshippo Stores
Gradient14.208314.462515.399186.15421.3012
y-intercept1984.23975834.22351005.55832342.52986.1015
Ratio0.00720.00250.01530.03670.2133
PPMCC−0.00580.08230.12220.21900.4599
p value3.6113 × 10−81.0432 × 10−353.8405 × 10−84.19342 × 10−80.0416
R squared0.00720.00250.01530.03670.2115
1 Grain unit output means the grain yield per unit area.
Disclaimer/Publisher’s Note: The statements, opinions and data contained in all publications are solely those of the individual author(s) and contributor(s) and not of MDPI and/or the editor(s). MDPI and/or the editor(s) disclaim responsibility for any injury to people or property resulting from any ideas, methods, instructions or products referred to in the content.