


Defining Psychological Factors of Cycling in Tehran City


Abstract
1. Introduction
2. Literature Review
2.1. Socio-Economic Characteristics
2.2. Trip Characteristics
2.3. Built/Natural Environment
2.4. Work Conditions
2.5. Latent Variables
3. Methodology
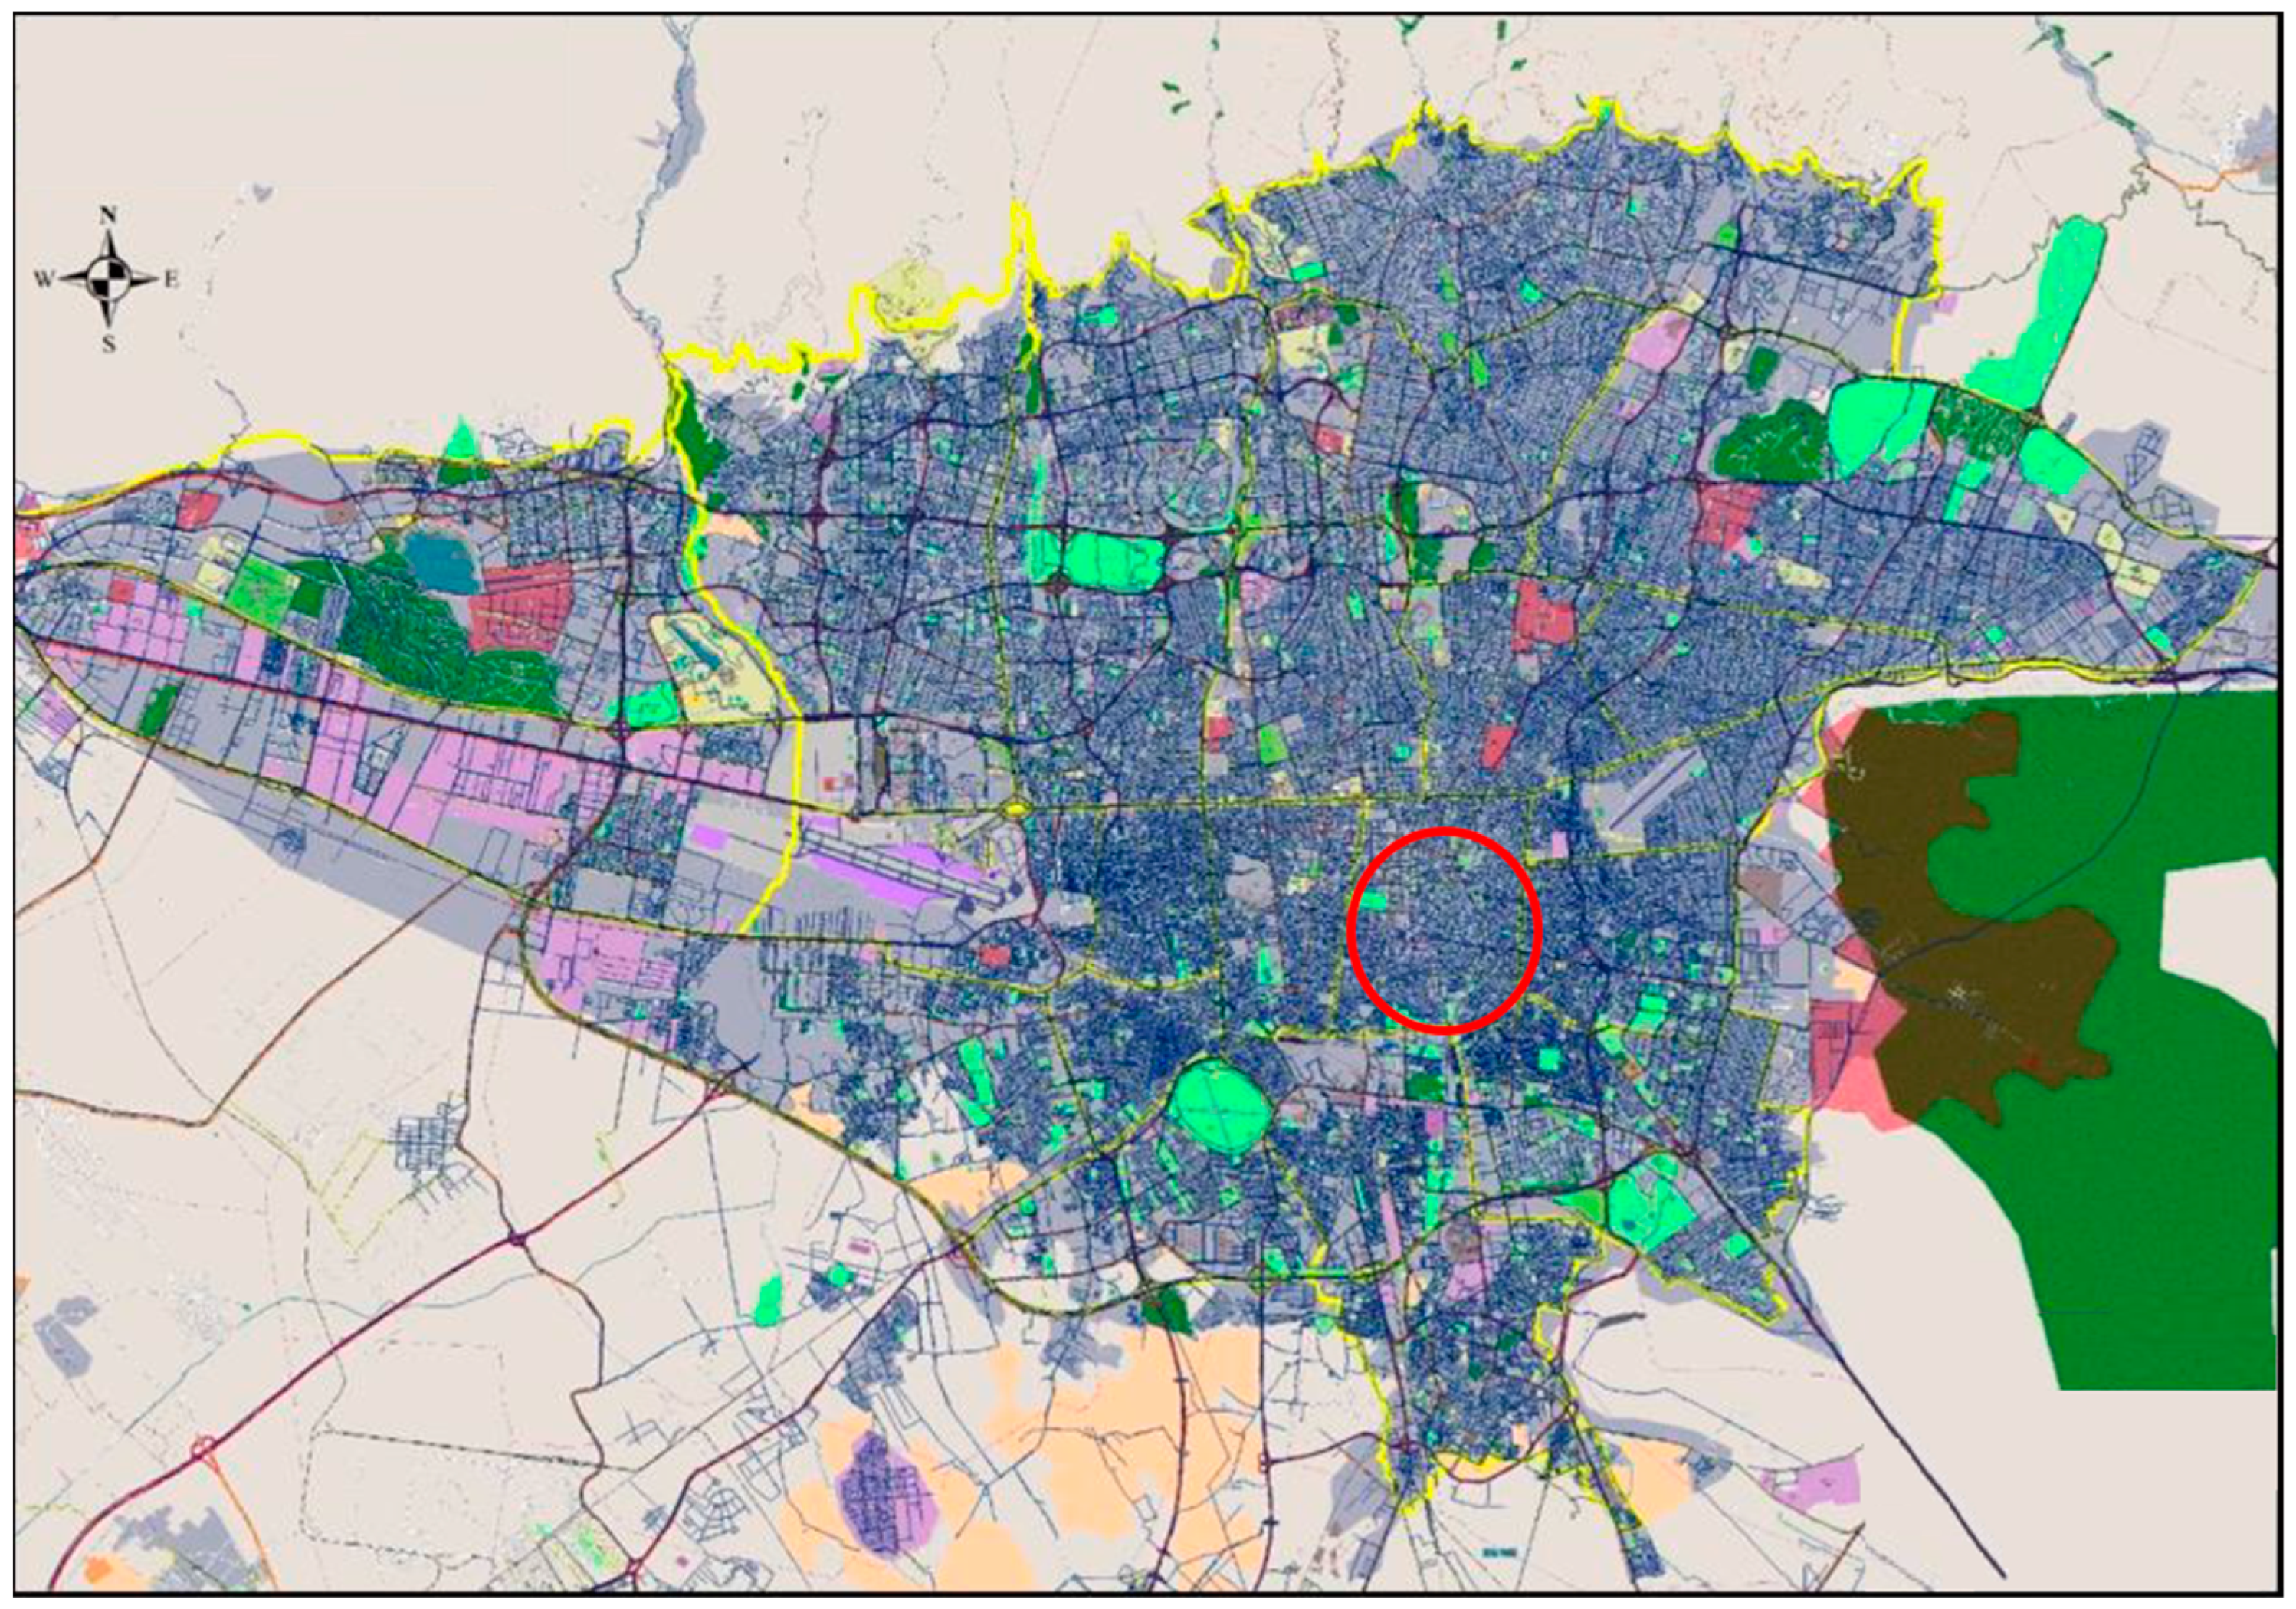
3.1. Area of Study
3.2. The Survey
4. Analysis
4.1. Individual Characteristics (Objective Variables)
4.2. Latent Variables (Subjective Variables)
5. Result
5.1. Confirmatory Factor Analysis
5.2. Correlation of Variables
5.3. Examining Fit Indices
6. Discussion
7. Conclusions
7.1. Policy Implications
- Increasing the safety of cycling routes, especially in areas where the demand for cycling by women is higher. It gradually creates a positive mentality among the people of the society, which ultimately increases the attractiveness of this mode of transportation. On the other hand, it is likely that the family’s prohibition on cycling stems from a lack of awareness of societal security, and enhancing security and safety can make the family happy with the cycling of its children or spouse. The main body responsible for developing cycling infrastructure is the deputy transportation department of Tehran Municipality. Its main beneficiary is the only company providing shared bicycles (BDOOD company) that can help Tehran Municipality in investing for developing the infrastructure.
- Allocation of government subsidies to buy or apply discounts to the users of shared bicycles, which will reduce traffic and air pollution. The body responsible for this issue is the transportation deputy of Tehran Municipality.
- Developing behavior and acculturalization of bicycle use in society via advertisements and using it by the senior transportation managers of the countries. All decisions that are made in the field of transportation of Tehran city are made by the deputy transportation department of Tehran Municipality which cooperates with the Deputy of Social and Cultural Affairs of Tehran Municipality in the field of cultural and behavioral development.
7.2. Limitations
- The information received from the variables in Table 1 is for comparing with 2018 census data to estimate the representativeness of the data collected by the surveys [73,74]. Except for the gender of the individuals, the correct data of other variables from this census were not available. The age of respondents to the questionnaire was not correctly answered in the online survey, which was deleted due to incomplete information. However, obtained data can be used in other research.
- We were limited of face-to-face questionnaire because of the COVID-19 pandemic and that is why we had online surveys as well.
- There was no accurate data about income, car ownership, and other variables (except gender) in Table 1 about the individuals.
Author Contributions
Funding
Institutional Review Board Statement
Informed Consent Statement
Data Availability Statement
Conflicts of Interest
References
- Rodrigues, P.F.; Alvim-Ferraz, M.C.M.; Martins, F.G.; Saldiva, P.; Sá, T.H.; Sousa, S.I.V. Health economic assessment of a shift to active transport. Environ. Pollut. 2020, 258, 113745. [Google Scholar] [CrossRef]
- Giles-Corti, B.; Foster, S.; Shilton, T.; Falconer, R. The co-benefits for health of investing in active transportation. New South Wales Public Health Bull. 2010, 21, 122–127. [Google Scholar] [CrossRef]
- Buehler, R.; Pucher, J.; Merom, D.; Bauman, A. Active travel in Germany and the U.S. Contributions of daily walking and cycling to physical activity. Am. J. Prev. Med. 2011, 41, 241–250. [Google Scholar] [CrossRef]
- Heinen, E.; Maat, K.; Van Wee, B. The effect of work-related factors on the bicycle commute mode choice in the Netherlands. Transportation 2012, 40, 23–43. [Google Scholar] [CrossRef]
- Hunt, J.D.; Abraham, J.E. Influences on bicycle use. Transportation 2007, 34, 453–470. [Google Scholar] [CrossRef]
- Akar, G.; Fischer, N.; Namgung, M. Bicycling Choice and Gender Case Study: The Ohio State University. Int. J. Sustain. Transp. 2013, 7, 347–365. [Google Scholar] [CrossRef]
- Liu, J.; Wang, B.; Xiao, L. Non-linear associations between built environment and active travel for working and shopping: An extreme gradient boosting approach. J. Transp. Geogr. 2021, 92, 103034. [Google Scholar] [CrossRef]
- Muñoz, B.; Monzon, A.; Daziano, R.A. The Increasing Role of Latent Variables in Modelling Bicycle Mode Choice. Transp. Rev. 2016, 36, 737–771. [Google Scholar] [CrossRef]
- Borsboom, D. Latent Variable Theory. Meas. Interdiscip. Res. Perspect. 2008, 6, 25–53. [Google Scholar] [CrossRef]
- Sun, Y.; Mobasheri, A.; Hu, X.; Wang, W. Investigating Impacts of Environmental Factors on the Cycling Behavior of Bicycle-Sharing Users. Sustainability 2017, 9, 1060. [Google Scholar] [CrossRef]
- Noland, R.B.; Kunreuther, H. Short-run and long-run policies for increasing bicycle transportation for daily commuter trips. Transp. Policy 1995, 2, 67–69. [Google Scholar] [CrossRef]
- Wardman, M.; Page, M. Cycling and Urban Commuting: Results of Behavioral Mode and Rout Choice Models; University of Leeds, Institute for Transport Policies: Leeds, UK, 2000; Available online: https://eprints.whiterose.ac.uk/2074/ (accessed on 27 January 2021).
- Cervero, R.; Duncan, M. Walking, Bicycling, and Urban Landscapes: Evidence From the San Francisco Bay Area. Am. J. Public Health 2003, 93, 1478–1483. [Google Scholar] [CrossRef] [PubMed]
- Rodríguez, D.A.; Joo, J. The relationship between non-motorized mode choice and the local physical environment. Transp. Res. Part D Transp. Environ. 2004, 9, 151–173. [Google Scholar] [CrossRef]
- Frank, L.; Bradley, M.; Kavage, S.; Chapman, J.; Lawton, T.K. Urban form, travel time, and cost relationships with tour complexity and mode choice. Transportation 2007, 35, 37–54. [Google Scholar] [CrossRef]
- Roorda, M.J.; Passmore, D. Including Minor Modes of Transport in a Tour-Based Mode Choice Model with Household Interactions. J. Transp. Eng. 2009, 12, 935–945. [Google Scholar] [CrossRef]
- Akar, G.; Clifton, K.J. Influence of Individual Perceptions and Bicycle Infrastructure on Decision to Bike. Transp. Res. Rec. J. Transp. Res. Board 2009, 2140, 165–172. [Google Scholar] [CrossRef]
- Handy, S.L.; Xing, Y.; Buehler, T.J. Factors associated with bicycle ownership and use: A study of six small U.S. cities. Transportation 2010, 37, 967–985. [Google Scholar] [CrossRef]
- Acheampong, R.A.; Siiba, A. Examining the determinants of utility bicycling using a socio-ecological framework: An exploratory study of the Tamale Metropolis in Northern Ghana. J. Transp. Geogr. 2018, 69, 1–10. [Google Scholar] [CrossRef]
- de Bruijn, G.-J.; Kremers, S.P.; Schaalma, H.; van Mechelen, W.; Brug, J. Determinants of adolescent bicycle use for transportation and snacking behavior. Prev. Med. 2005, 40, 658–667. [Google Scholar] [CrossRef]
- Maldonado-Hinarejos, R.; Sivakumar, A.; Polak, J.W. Exploring the role of individual attitudes and perceptions in predicting the demand for cycling: A hybrid choice modelling approach. Transportation 2014, 41, 1287–1304. [Google Scholar] [CrossRef]
- Taylor, D.; Mahmassani, H. Analysis of Stated Preferences for Intermodal Bicycle-Transit Interfaces. Transp. Res. Rec. J. Transp. Res. Board 1996, 1556. [Google Scholar] [CrossRef]
- Parkin, J.; Wardman, M.; Page, M. Estimation of the determinants of bicycle mode share for the journey to work using census data. Transportation 2007, 35, 93–109. [Google Scholar] [CrossRef]
- Plaut, P.O. Non-motorized commuting in the US. Transp. Res. Part D Transp. Environ. 2005, 10, 347–356. [Google Scholar] [CrossRef]
- Hopkinson, P.; Wardman, M. Evaluating the demand for new cycle facilities. Transp. Policy 1996, 3, 241–249. [Google Scholar] [CrossRef]
- Mendiate, C.J.; Soria-lara, J.A.; Monzon, A. Identifying clusters of cycling commuters and travel patterns: The case of Quelimane, Mozambique. Int. J. Sustain. Transp. 2020, 14, 710–721. [Google Scholar] [CrossRef]
- Vandenbulcke, G.; Dujardin, C.; Thomas, I.; Geus, B.d.; Degraeuwe, B.; Meeusen, R.; Panis, L.I. Cycle commuting in Belgium: Spatial determinants and ‘re-cycling’ strategies. Transp. Res. Part A Policy Pract. 2011, 45, 118–137. [Google Scholar] [CrossRef]
- Zahran, S.; Brody, S.D.; Maghelal, P.; Prelog, A.; Lacy, M. Cycling and walking: Explaining the spatial distribution of healthy modes of transportation in the United States. Transp. Res. Part D Transp. Environ. 2008, 13, 462–470. [Google Scholar] [CrossRef]
- Emond, C.R.; Handy, S.L. Factors associated with bicycling to high school: Insights from Davis, CA. J. Transp. Geogr. 2012, 20, 71–79. [Google Scholar] [CrossRef]
- Ryley, T. Estimating Cycling Demand for the Journey to Work or Study in West Edinburgh, Scotland. Transp. Res. Rec. J. Transp. Res. Board 2006, 1982, 187–193. [Google Scholar] [CrossRef]
- Rose, G.; Marfurt, H. Travel behaviour change impacts of a major ride to work day event. Transp. Res. Part A Policy Pract. 2007, 41, 351–364. [Google Scholar] [CrossRef]
- Lee, I.; Park, H.; Sohn, K. Increasing the number of bicycle commuters. Proc. Inst. Civ. Eng.-Transp. 2012, 165, 63–72. [Google Scholar] [CrossRef]
- Buehler, R. Determinants of bicycle commuting in the Washington, DC region: The role of bicycle parking, cyclist showers, and free car parking at work. Transp. Res. Part D Transp. Environ. 2012, 17, 525–531. [Google Scholar] [CrossRef]
- Börjesson, M.; Eliasson, J. The value of time and external benefits in bicycle appraisal. Transp. Res. Part A Policy Pract. 2012, 46, 673–683. [Google Scholar] [CrossRef]
- Wardman, M.; Hatfield, R.; Page, M. The UK national cycling strategy: Can improved facilities meet the targets? Transp. Policy 1997, 4, 123–133. [Google Scholar] [CrossRef]
- Katz, R. Forecasting Demand For Bicycle Facilities. 2001. Available online: https://trid.trb.org/view/718453 (accessed on 20 January 2021).
- Hamre, A.; Buehler, R. Commuter Mode Choice and Free Car Parking, Public Transportation Benefits, Showers/Lockers, and Bike Parking at Work: Evidence from the Washington, DC Region. J. Public Transp. 2014, 17, 67–91. [Google Scholar] [CrossRef]
- dell’Olio, L.; Ibeas, A.; Moura, J.L. Implementing bike-sharing systems. Proc. Inst. Civ. Eng. Munic. Eng. 2011, 164, 89–101. [Google Scholar] [CrossRef]
- Rietveld, P.; Daniel, V. Determinants of bicycle use: Do municipal policies matter? Transp. Res. Part A Policy Pract. 2004, 38, 531–550. [Google Scholar] [CrossRef]
- Winters, M.; Brauer, M.; Setton, E.M.; Teschke, K. Built environment influences on healthy transportation choices: Bicycling versus driving. J. Urban Health Bull. N. Y. Acad. Med. 2010, 87, 969–993. [Google Scholar] [CrossRef]
- Gehrke, S.R.; Clifton, K.J. Operationalizing Land Use Diversity at Varying Geographic Scales and Its Connection to Mode Choice. Transp. Res. Rec. J. Transp. Res. Board 2014, 2453, 128–136. [Google Scholar] [CrossRef]
- Xing, Y.; Handy, S.L.; Mokhtarian, P.L. Factors associated with proportions and miles of bicycling for transportation and recreation in six small US cities. Transp. Res. Part D Transp. Environ. 2010, 15, 73–81. [Google Scholar] [CrossRef]
- Baltes, M.R. Factors Influencing Nondiscretionary Work Trips by Bicycle Determined from 1990 U.S. Census Metropolitan Statistical Area Data. Transp. Res. Rec. J. Transp. Res. Board 1996, 1538, 96–101. [Google Scholar] [CrossRef]
- Goetzke, F.; Rave, T. Bicycle Use in Germany: Explaining Differences between Municipalities with Social Network Effects. Urban Stud. 2010, 48, 427–437. [Google Scholar] [CrossRef] [PubMed]
- Ma, L.; Dill, J. Associations between the objective and perceived built environment and bicycling for transportation. J. Transp. Health 2015, 2, 248–255. [Google Scholar] [CrossRef]
- dell’Olio, L.; Ibeas, A.; Bordagaray, M.; Ortúzar, J.d.D. Modeling the Effects of Pro Bicycle Infrastructure and Policies Toward Sustainable Urban Mobility. J. Urban Plan. Dev. 2014, 140, 04014001. [Google Scholar] [CrossRef]
- Schoner, J.E.; Levinson, D.M. The missing link: Bicycle infrastructure networks and ridership in 74 US cities. Transportation 2014, 41, 1187–1204. [Google Scholar] [CrossRef]
- Moudon, A.V.; Lee, C.; Cheadle, A.D.; Collier, C.W.; Johnson, D.; Schmid, T.L.; Weather, R.D. Cycling and the built environment, a US perspective. Transp. Res. Part D Transp. Environ. 2005, 10, 245–261. [Google Scholar] [CrossRef]
- Buehler, R.; Pucher, J. Cycling to work in 90 large American cities: New evidence on the role of bike paths and lanes. Transportation 2011, 39, 409–432. [Google Scholar] [CrossRef]
- Fernández-Heredia, Á.; Jara-Díaz, S.; Monzón, A. Modelling bicycle use intention: The role of perceptions. Transportation 2014, 43, 1–23. [Google Scholar] [CrossRef]
- Engbers, L.H.; Hendriksen, I.J. Characteristics of a population of commuter cyclists in the Netherlands: Perceived barriers and facilitators in the personal, social and physical environment. Int. J. Behav. Nutr. Phys. Act. 2010, 7, 89. [Google Scholar] [CrossRef]
- Mahdi Rashidi, S.S.; Nadran, A. Do People Desire to Cycle More During the COVID-19 Pandemic? Investigating the Role of Behavioural Characteristics through a Structural Model. Open Civ. Eng. J. 2022, 16, e187414952207220. [Google Scholar] [CrossRef]
- Titze, S.; Stronegger, W.J.; Janschitz, S.; Oja, P. Association of built-environment, social-environment and personal factors with bicycling as a mode of transportation among Austrian city dwellers. Prev. Med. 2008, 47, 252–259. [Google Scholar] [CrossRef] [PubMed]
- Titze, S.; Stronegger, W.J.; Janschitz, S.; Oja, P. Environmental, social, and personal correlates of cycling for transportation in a student population. J. Phys. Act. Health 2007, 4, 66–79. [Google Scholar] [CrossRef] [PubMed]
- Panter, J.R.; Jones, A.P.; van Sluijs, E.M.; Griffin, S.J. Attitudes, social support and environmental perceptions as predictors of active commuting behaviour in school children. J. Epidemiol. Community Health 2010, 64, 41–48. [Google Scholar] [CrossRef]
- de Geus, B.; De Bourdeaudhuij, I.; Jannes, C.; Meeusen, R. Psychosocial and environmental factors associated with cycling for transport among a working population. Health Educ. Res. 2008, 23, 697–708. [Google Scholar] [CrossRef] [PubMed]
- Bigazzi, A.; Ausri, F.; Peddie, L.; Fitch, D.; Puterman, E. Physiological markers of traffic-related stress during active travel. Transp. Res. Part F Traffic Psychol. Behav. 2022, 84, 223–238. [Google Scholar] [CrossRef]
- LaJeunesse, S.; Ryus, P.; Kumfer, W.; Kothuri, S.; Nordback, K. Measuring Pedestrian Level of Stress in Urban Environments: Naturalistic Walking Pilot Study. Transp. Res. Rec. 2021, 2675, 109–119. [Google Scholar] [CrossRef]
- Tehran Active Transportation Studies, Transportation and Traffic Organization of Tehran. Available online: https//:traffic.tehran.ir (accessed on 20 January 2021).
- Cochran, W.G. Sampling Techniques; John Wiley & Sons: New York, NY, USA, 2007. [Google Scholar]
- George, D.; Mallery, P. SPSS for Windows Step by Step: A Simple Guide and Reference, 17.0 Update, 10th ed.; Allyn & Bacon: Boston, MA, USA, 2010. [Google Scholar]
- Wright, K. An Introduction to Cronbach’s α: It’s the GLM (Again)! In Proceedings of the Annual Meeting of Southwest Educational. Available online: https://www.researchgate.net/publication/267210978_An_Introduction_to_Cronbach’s_a_It’s_the_GLM_Again (accessed on 29 February 2013).
- Bassett, D.R.; Pucher, J.; Buehler, R.; Thompson, D.L.; Crouter, S.E. Walking, Cycling, and Obesity Rates in Europe, North America, and Australia. J. Phys. Act. Health 2008, 5, 795–814. [Google Scholar] [CrossRef]
- Semenescu, A.; Coca, D. Why people fail to bike the talk: Car dependence as a barrier to cycling. Transp. Res. Part F Traffic Psychol. Behav. 2022, 88, 208–222. [Google Scholar] [CrossRef]
- Werneke, J.; Dozza, M.; Karlsson, M. Safety–critical events in everyday cycling—Interviews with bicyclists and video annotation of safety–critical events in a naturalistic cycling study. Transp. Res. Part F Traffic Psychol. Behav. 2015, 35, 199–212. [Google Scholar] [CrossRef]
- Wood, J.M.; Black, A.A.; Tyrrell, R.A. Increasing the conspicuity of cyclists at night by using bicycle lights and clothing to highlight their biological motion to oncoming drivers. Transp. Res. Part F Traffic Psychol. Behav. 2022, 90, 326–332. [Google Scholar] [CrossRef]
- Heeremans, O.; Rubie, E.; King, M.; Oviedo-Trespalacios, O. Group cycling safety behaviours: A systematic review. Transp. Res. Part F Traffic Psychol. Behav. 2022, 91, 26–44. [Google Scholar] [CrossRef]
- Raza, W.; Forsberg, B.; Johansson, C.; Sommar, J.N. Air pollution as a risk factor in health impact assessments of a travel mode shift towards cycling. Glob. Health Action 2018, 11, 1429081. [Google Scholar] [CrossRef]
- Gelb, J.; Apparicio, P. Cyclists’ exposure to atmospheric and noise pollution: A systematic literature review. Transp. Rev. 2021, 41, 742–765. [Google Scholar] [CrossRef]
- Liu, C.; Tapani, A.; Kristoffersson, I.; Rydergren, C.; Jonsson, D. Appraisal of cycling infrastructure investments using a transport model with focus on cycling. Case Stud. Transp. Policy 2021, 9, 125–136. [Google Scholar] [CrossRef]
- Spotswood, F.; Chatterton, T.; Tapp, A.; Williams, D. Analysing cycling as a social practice: An empirical grounding for behaviour change. Transp. Res. Part F Traffic Psychol. Behav. 2015, 29, 22–33. [Google Scholar] [CrossRef]
- Hatamzadeh, Y.; Habibian, M.; Khodaii, A. Measuring walking behaviour in commuting to work: Investigating the role of subjective, environmental and socioeconomic factors in a structural model. Int. J. Urban Sci. 2020, 24, 173–188. [Google Scholar] [CrossRef]
- Hatamzadeh, Y.; Habibian, M.; Khodaii, A. Walking behavior across genders in school trips, a case study of Rasht, Iran. J. Transp. Health 2017, 5, 42–54. [Google Scholar] [CrossRef]
- Nunnally, J.C.; Bernstein, I.H. Psychometric Theoryi, 3rd ed.; McGraw-Hill: New York, NY, USA, 1994. [Google Scholar]


| Reference Number | Socio-Economic | Trip | Built/Natural | Work Condition | Latent | |||||||||||||||||||||||||||
|---|---|---|---|---|---|---|---|---|---|---|---|---|---|---|---|---|---|---|---|---|---|---|---|---|---|---|---|---|---|---|---|---|
| Age | Gender | Student | Ability to Bath | Cycling to Work | Obesity | Income | Education | Travel Time | Travel Distance | Cost | Recreational/Social | Density | Air\Noise Pollution | Bus Stop | Infrastructure | Season | Population Density | Slope | Traffic Light | Wind | Accessibility Density | Employment Status | Convenience | Dependent to Car | Social Norms | Cycling at Night | Bicycle Security | Perception of Safety | Family Relationship | Cycling Alone | Cycling Ability | |
| 4 | ✓ | ✓ | ||||||||||||||||||||||||||||||
| 5 | ✓ | ✓ | ||||||||||||||||||||||||||||||
| 6 | ✓ | ✓ | ✓ | |||||||||||||||||||||||||||||
| 7 | ✓ | ✓ | ||||||||||||||||||||||||||||||
| 11 | ✓ | ✓ | ||||||||||||||||||||||||||||||
| 12 | ✓ | ✓ | ✓ | |||||||||||||||||||||||||||||
| 13 | ✓ | ✓ | ✓ | |||||||||||||||||||||||||||||
| 14 | ✓ | |||||||||||||||||||||||||||||||
| 15 | ✓ | |||||||||||||||||||||||||||||||
| 16 | ✓ | |||||||||||||||||||||||||||||||
| 17 | ✓ | ✓ | ✓ | |||||||||||||||||||||||||||||
| 18 | ✓ | |||||||||||||||||||||||||||||||
| 19 | ✓ | |||||||||||||||||||||||||||||||
| 20 | ✓ | |||||||||||||||||||||||||||||||
| 21 | ✓ | |||||||||||||||||||||||||||||||
| 22 | ✓ | ✓ | ||||||||||||||||||||||||||||||
| 23 | ✓ | |||||||||||||||||||||||||||||||
| 24 | ✓ | ✓ | ||||||||||||||||||||||||||||||
| 25 | ✓ | |||||||||||||||||||||||||||||||
| 26 | ✓ | ✓ | ✓ | |||||||||||||||||||||||||||||
| 27 | ✓ | ✓ | ||||||||||||||||||||||||||||||
| 28 | ✓ | |||||||||||||||||||||||||||||||
| 29 | ✓ | |||||||||||||||||||||||||||||||
| 30 | ✓ | ✓ | ✓ | |||||||||||||||||||||||||||||
| 31 | ✓ | ✓ | ✓ | |||||||||||||||||||||||||||||
| 32 | ✓ | ✓ | ||||||||||||||||||||||||||||||
| 33 | ✓ | ✓ | ||||||||||||||||||||||||||||||
| 34 | ✓ | |||||||||||||||||||||||||||||||
| 35 | ✓ | |||||||||||||||||||||||||||||||
| 36 | ✓ | ✓ | ✓ | ✓ | ||||||||||||||||||||||||||||
| 37 | ✓ | ✓ | ||||||||||||||||||||||||||||||
| 38 | ✓ | ✓ | ||||||||||||||||||||||||||||||
| 39 | ✓ | |||||||||||||||||||||||||||||||
| 40 | ✓ | ✓ | ✓ | |||||||||||||||||||||||||||||
| 41 | ✓ | |||||||||||||||||||||||||||||||
| 42 | ✓ | ✓ | ||||||||||||||||||||||||||||||
| 43 | ✓ | |||||||||||||||||||||||||||||||
| 44 | ✓ | |||||||||||||||||||||||||||||||
| 45 | ✓ | |||||||||||||||||||||||||||||||
| 46 | ✓ | |||||||||||||||||||||||||||||||
| 47 | ✓ | |||||||||||||||||||||||||||||||
| 48 | ✓ | ✓ | ||||||||||||||||||||||||||||||
| 49 | ✓ | |||||||||||||||||||||||||||||||
| 50 | ✓ | |||||||||||||||||||||||||||||||
| 51 | ✓ | |||||||||||||||||||||||||||||||
| 54 | ✓ | |||||||||||||||||||||||||||||||
| 55 | ✓ | |||||||||||||||||||||||||||||||
| 56 | ✓ | |||||||||||||||||||||||||||||||
| 57 | ✓ | |||||||||||||||||||||||||||||||
| 58 | ✓ | |||||||||||||||||||||||||||||||
| 60 | ✓ | |||||||||||||||||||||||||||||||
| 64 | ✓ | |||||||||||||||||||||||||||||||
| 65 | ✓ | |||||||||||||||||||||||||||||||
| 66 | ✓ | |||||||||||||||||||||||||||||||
| 67 | ✓ | |||||||||||||||||||||||||||||||
| 68 | ✓ | |||||||||||||||||||||||||||||||
| 69 | ✓ | ✓ | ||||||||||||||||||||||||||||||
| 70 | ✓ | ✓ | ||||||||||||||||||||||||||||||
| Number | Percent (%) | ||
|---|---|---|---|
| Gender | Male | 189 | 45.2 |
| Female | 156 | 54.8 | |
| Marital status | Single | 176 | 51 |
| Married | 169 | 49 | |
| Employment status | Employed | 149 | 43.2 |
| Student | 74 | 21.4 | |
| Workingstudent | 79 | 22.9 | |
| Unemployed | 43 | 12.5 | |
| Education | Under-diploma | 39 | 11.3 |
| Diploma | 68 | 19.7 | |
| Bachelor | 98 | 28.5 | |
| Master | 114 | 33 | |
| PhD | 26 | 7.5 | |
| Income | No income | 15 | 4.3 |
| Less than 75$ | 53 | 15.4 | |
| 75–200$ | 128 | 37.1 | |
| 200–300$ | 112 | 32.5 | |
| More than 300$ | 37 | 10.7 | |
| Car ownership | Do not have | 116 | 33.6 |
| Having 1 car | 72 | 20.9 | |
| Having 2 car | 98 | 28.4 | |
| 3 cars or more | 59 | 17.1 | |
| Purpose of trip | Work | 70 | 20.3 |
| Education | 63 | 18.3 | |
| Leisure | 59 | 17.1 | |
| Socializing | 78 | 22.6 | |
| Shopping and weekend | 75 | 21.7 | |
| BMI | Less than 20 | 28 | 8.1 |
| 20–25 | 126 | 36.5 | |
| 25–30 | 124 | 35.9 | |
| More than 30 | 67 | 19.5 | |
| Main Factor | Standard Deviation | Average | Skewness | Kurtosis | Definition |
|---|---|---|---|---|---|
| Cycling | 2.55 | 0.79 | 0.085 | −0.227 | Cycling behavior |
| Cost | 2.19 | 0.81 | 0.595 | −0.037 | The cost of cycling |
| Built/natural environment | 3.52 | 0.98 | −0.813 | 0.134 | Variables such as air/noise pollution that affect cycling rate |
| Will | 3.59 | 0.88 | −0.65 | 0.456 | Influence of will on desire for cycling |
| Dignity | 3.4 | 0.87 | −0.518 | 0.061 | Influence of dignity on desire for cycling |
| Limit by family | 3.53 | 1.10 | −0.605 | −0.409 | How the restrictions imposed by the family affect the cycling of family members |
| Unpleasant feeling | 2.45 | 1.11 | 0.667 | −0.137 | How your feelings influence on cycling rate |
| Safety at night | 2.37 | 0.92 | 0.488 | −0.438 | Influence of safety issues on cycling rate |
| Main Factor | Item | F.L | AVE | C.R | Cronbach’s a |
|---|---|---|---|---|---|
| Cycling | Travel time by bicycle per trip | 0.53 | 0.34 | 0.71 | 0.61 |
| The distance you cycle | 0.64 | ||||
| Cost | The cost of cycling (buying a personal bike) is one of my main reasons for not using a bike. | 0.66 | 0.52 | 0.73 | 0.68 |
| The cost of cycling (the cost of using a shared bike) is one of my main reasons for not using a bike | 0.78 | ||||
| Built/natural environment | In secluded places, I am more interested in cycling | 0.81 | 0.53 | 0.79 | 0.77 |
| I also use a bicycle on days when the weather is polluted | 0.78 | ||||
| I also use a bicycle in places where there is a lot of noise pollution | 0.58 | ||||
| Will | If there is something I don’t like, I will still deal with it | 0.52 | 0.44 | 0.72 | 0.68 |
| If I want to understand something, I will definitely try to understand it | 0.78 | ||||
| If I start something, I will definitely finish it | 0.67 | ||||
| Dignity | I always appear outside the house in formal clothes | 0.82 | 0.47 | 0.81 | 0.8 |
| I never leave the house in sports clothes, even to exercise | 0.79 | ||||
| I think cycling is for those who don’t have a car | 0.83 | ||||
| I think that cycling is reserved for the wealthy classes of society with lower job stress | 0.43 | ||||
| I think cycling is for those who are in their teens or younger | 0.44 | ||||
| Limit by family | My family does not pay me to buy a bicycle | 0.89 | 0.77 | 0.91 | 0.91 |
| I feel that my family is upset about my cycling | 0.87 | ||||
| I feel that my family will not allow me to ride a bicycle | 0.87 | ||||
| Unpleasant feeling | Other people pay more attention to me when I ride a bike (in a bad way) | 0.85 | 0.84 | 0.95 | 0.96 |
| While cycling, other people make fun of my clothing | 0.92 | ||||
| When cycling, other people object to my clothing | 0.97 | ||||
| While cycling, other people make fun of me because of my gender | 0.93 | ||||
| Safety at night | Accidents are more likely to occur while cycling at night | 0.89 | 0.61 | 0.92 | 89/0 |
| There is a higher chance of harassment while cycling at night | 0.96 | ||||
| There are few police at night in the city | 0.93 | ||||
| More thefts occur from cyclists at night | 0.54 | ||||
| I have more anxiety while cycling at night. | 0.46 |
| Variables | Cycling | Cost | Built/Natural Environment | Will | Dignity | Limit by Family | Unpleasant Feeling | Safety at Night |
|---|---|---|---|---|---|---|---|---|
| Cycling | 0.58 | |||||||
| Cost | −0.34 ** | 0.72 | ||||||
| Built/natural environment | −0.49 ** | 0.21 ** | 0.73 | |||||
| Will | 0.57 ** | −0.23 ** | −0.31 ** | 0.66 | ||||
| Dignity | −0.45 ** | 0.06 | 0.27 ** | 0.18 ** | 0.66 | |||
| Limit by family | −0.39 ** | 0.33 ** | 0.45 ** | −0.30 ** | 0.31 ** | 0.88 | ||
| Unpleasant feeling | −0.19 ** | 0.24 ** | 0.05 | 0.08 | 0.33 ** | 0.48 ** | 0.92 | |
| Safety at night | −0.25 ** | 0.07 | 0.25 ** | 0.07 | 0.24 ** | 0.37 ** | 0.16 ** | 0.78 |
| Interpretation | Result | Range Acceptable | Indicator |
|---|---|---|---|
| Acceptable fit | 0.91 | >0.90 | GFI (index goodness-of-fit) |
| Acceptable fit | 0.072 | <0.80 (Smaller than 0.80) | RMSEA (root mean square error of approximation) |
| Acceptable fit | 0.93 | >0.90 (Greater than 0.90) | CFI (fit index comparative) |
| Acceptable fit | 0.92 | >0.90 (Greater than 0.90) | NFI (fit index Normed) |
| Acceptable fit | 0.89 | >0.90 (Greater than 0.90) | IFI (fit index Incremental) |
| Acceptable fit | 0.71 | >0.50 (Greater than 0.50) | AGFI (goodness-of-fit index Adjusted) |
| Acceptable fit | 0.56 | >0.50 (Greater than 0.50) | PGFI (goodness-of-fit index Parsimonious) |
| Acceptable fit | 2.56 | 5 ≥ Indicator ≥ 1 (between 1–5) | chi-square/DF (Chi-square ratio on the degree of freedom) |
| Type of Relationship | Standardized Beta | Un−Standardized Beta | Standard Error | T Value | p Value | ||
|---|---|---|---|---|---|---|---|
| Cycling | ← | Built/natural environment | −0.53 | −0.31 | 0.045 | 6.82 | <0.001 |
| Cycling | ← | Cost | −0.25 | −0.2 | 0.066 | 2.98 | 0.003 |
| Cycling | ← | Will | 0.71 | 0.49 | 0.067 | 7.33 | <0.001 |
| cycling | ← | Dignity | −0.23 | −0.21 | 0.063 | 3.41 | <0.001 |
| Cycling | ← | Limit by family | −0.34 | −0.18 | 0.034 | 5.35 | <0.001 |
| Cycling | ← | Unpleasant feeling | −0.19 | −0.1 | 0.029 | 3.35 | <0.001 |
| Cycling | ← | Safety at night | −0.26 | −0.29 | 0.073 | 3.93 | <0.001 |
Disclaimer/Publisher’s Note: The statements, opinions and data contained in all publications are solely those of the individual author(s) and contributor(s) and not of MDPI and/or the editor(s). MDPI and/or the editor(s) disclaim responsibility for any injury to people or property resulting from any ideas, methods, instructions or products referred to in the content. |
© 2023 by the authors. Licensee MDPI, Basel, Switzerland. This article is an open access article distributed under the terms and conditions of the Creative Commons Attribution (CC BY) license (https://creativecommons.org/licenses/by/4.0/).
Share and Cite
Rashidi, M.; Seyedhosseini, S.-M.; Naderan, A. Defining Psychological Factors of Cycling in Tehran City. Sustainability 2023, 15, 3264. https://doi.org/10.3390/su15043264
Rashidi M, Seyedhosseini S-M, Naderan A. Defining Psychological Factors of Cycling in Tehran City. Sustainability. 2023; 15(4):3264. https://doi.org/10.3390/su15043264
Chicago/Turabian StyleRashidi, Mahdi, Seyed-Mohammad Seyedhosseini, and Ali Naderan. 2023. "Defining Psychological Factors of Cycling in Tehran City" Sustainability 15, no. 4: 3264. https://doi.org/10.3390/su15043264
APA StyleRashidi, M., Seyedhosseini, S.-M., & Naderan, A. (2023). Defining Psychological Factors of Cycling in Tehran City. Sustainability, 15(4), 3264. https://doi.org/10.3390/su15043264