Article

An Analysis of Three Decades of Increasing Carbon Emissions: The Weight of the P Factor

1
Institute for Globally Distributed Open Research and Education (IGDORE), 35195 Växjö, Sweden
2
Department of Philosophy, Colorado State University, Fort Collins, CO 80525, USA
3
Department of Social Studies, Linnaeus University, 35195 Växjö, Sweden
4
Center for Data Intensive Sciences and Applications, Linnaeus University, 35195 Växjö, Sweden
*
Author to whom correspondence should be addressed.
Sustainability 2023, 15(4), 3245; https://doi.org/10.3390/su15043245
Submission received: 10 January 2023 / Revised: 6 February 2023 / Accepted: 8 February 2023 / Published: 10 February 2023

Abstract

:
A dominant narrative in the climate change debate is that addressing population is not relevant for mitigation because population is only growing in the poorest countries, whose contribution to global carbon emissions is negligible, while the largest contribution comes from rich countries where the population no longer grows. We conducted an analysis of 30 years of emission data for all world countries showing that this narrative is misleading. Splitting the countries into four income groups according to the World Bank’s standard classification, we found that: (i) population is growing in all four groups; (ii) low-income countries’ contribution to emissions increase is indeed limited; (iii) the largest contribution to global carbon emissions comes from the upper-middle group; (iv) population growth is the main driver of emissions increase in all income groups except the upper-middle one; (v) the successful reduction in per capita emissions that occurred in high-income countries was nullified by the parallel increase in population in the same group. Our analysis suggests that climate change mitigation strategies should address population along with per capita consumption and technological innovation, in a comprehensive approach to the problem.

1. Introduction

The Rio de Janeiro Earth summit took place more than 30 years ago, in June 1992. It was the first global conference of the United Nations (UN) to explicitly discuss climate change, and it laid the foundations for all subsequent work undertaken under the United Nations Framework Convention on Climate Change (UNFCCC) umbrella, such as the Kyoto Protocol and the Paris Agreement. Thereafter, the reports by the Intergovernmental Panel on Climate Change (IPCC), scientists, environmentalists and other activists have reported that we urgently need to reduce our greenhouse gas emissions and, more generally, our global environmental impact [1,2,3].
The total environmental impact is given by the product of population and per capita impact: I = P × I p c , which actually is the original form of the well-known I P A T equation (Impact = Population × Affluence × Technology) and all its variants [4,5]. This equation suggests that population size is a multiplier, which could potentially reduce or nullify any environmental gain that can be obtained through a reduction in consumption or technological improvements [6,7]. This is also confirmed by IPCC Assessment Reports, which have repeatedly identified both population growth and economic growth as the main drivers of climate change [2]. With the global population recently reaching 8 billion and projected to grow for the rest of the century (median projection in [8]), the question of whether such unprecedented numbers are sustainable has re-emerged in the scientific literature [9,10,11].
Nevertheless, when considering carbon emissions, it is a common idea that population plays a lesser role than other drivers, such as technology or affluence [12,13]. An argument supporting this view is that population is mainly increasing in poor countries, whose contribution to global carbon emissions is negligible [14].
Albeit dominant, this idea surprisingly lacks the support of solid data and is in conflict with several lines of evidence. For example, population growth is not limited to poor countries [8]. If we divide the world’s countries into four income-based groups according to the common and accepted economic classification from the World Bank—low, lower-middle, upper-middle and high-income countries—we see that population is growing in all four groups, albeit at different rates [15]. The existence of individual countries where population is stable or declining does not change the overall trend. Depending on the group, the main causes and rate of population growth vary but, regardless of the causes, this growth affects total emissions and preliminary analyses indicate that its contribution is not negligible [9,16]. For instance, the high-income group has reduced its per capita emissions in the last three decades but failed to reduce total emissions, suggesting a driving role for population growth. At the global level, per capita emissions did not grow in the last decade and are currently at about the same level as per capita emissions in the 1970s. In spite of this, today’s total emissions are more than 150% of total emissions in the 1970s [17].
This suggests that a careful analysis of existing data is needed to better investigate this issue, address current research gaps and shed light on the weight of the population (P) factor as it influences climate change. In our work, we quantitatively assess the contributions of population growth and per capita emission changes to the total emission increase from 1992 to 2019. Since per capita emissions represent the aggregation of A and T in the I P A T equation, this analysis allows us to compare population growth with the combined effect of affluence and technology. While more complex analyses have been performed for the world as a whole (e.g., based on the Kaya identity, such as in [2]), such a simple comparison has never been drawn before in a systematic way for all world countries and for a significant period of time. The main goal of this paper is to fill this knowledge gap based on existing empirical evidence. To highlight the role of economic differences, we divide the world’s countries, according to the standard economic classification, into four income-based groups [18] and perform our analyses both at the global and group levels. This differs from IPCC reports and other works, where countries are grouped according to geographical areas, even if this criterion groups together countries with large economic differences (e.g., North and South Korea in Eastern Asia, Yemen and Saudi Arabia in the Middle East, Congo and Botswana in Sub-Saharan Africa). Our income-based division hence represents a novelty and an added value of this work.

2. Methods

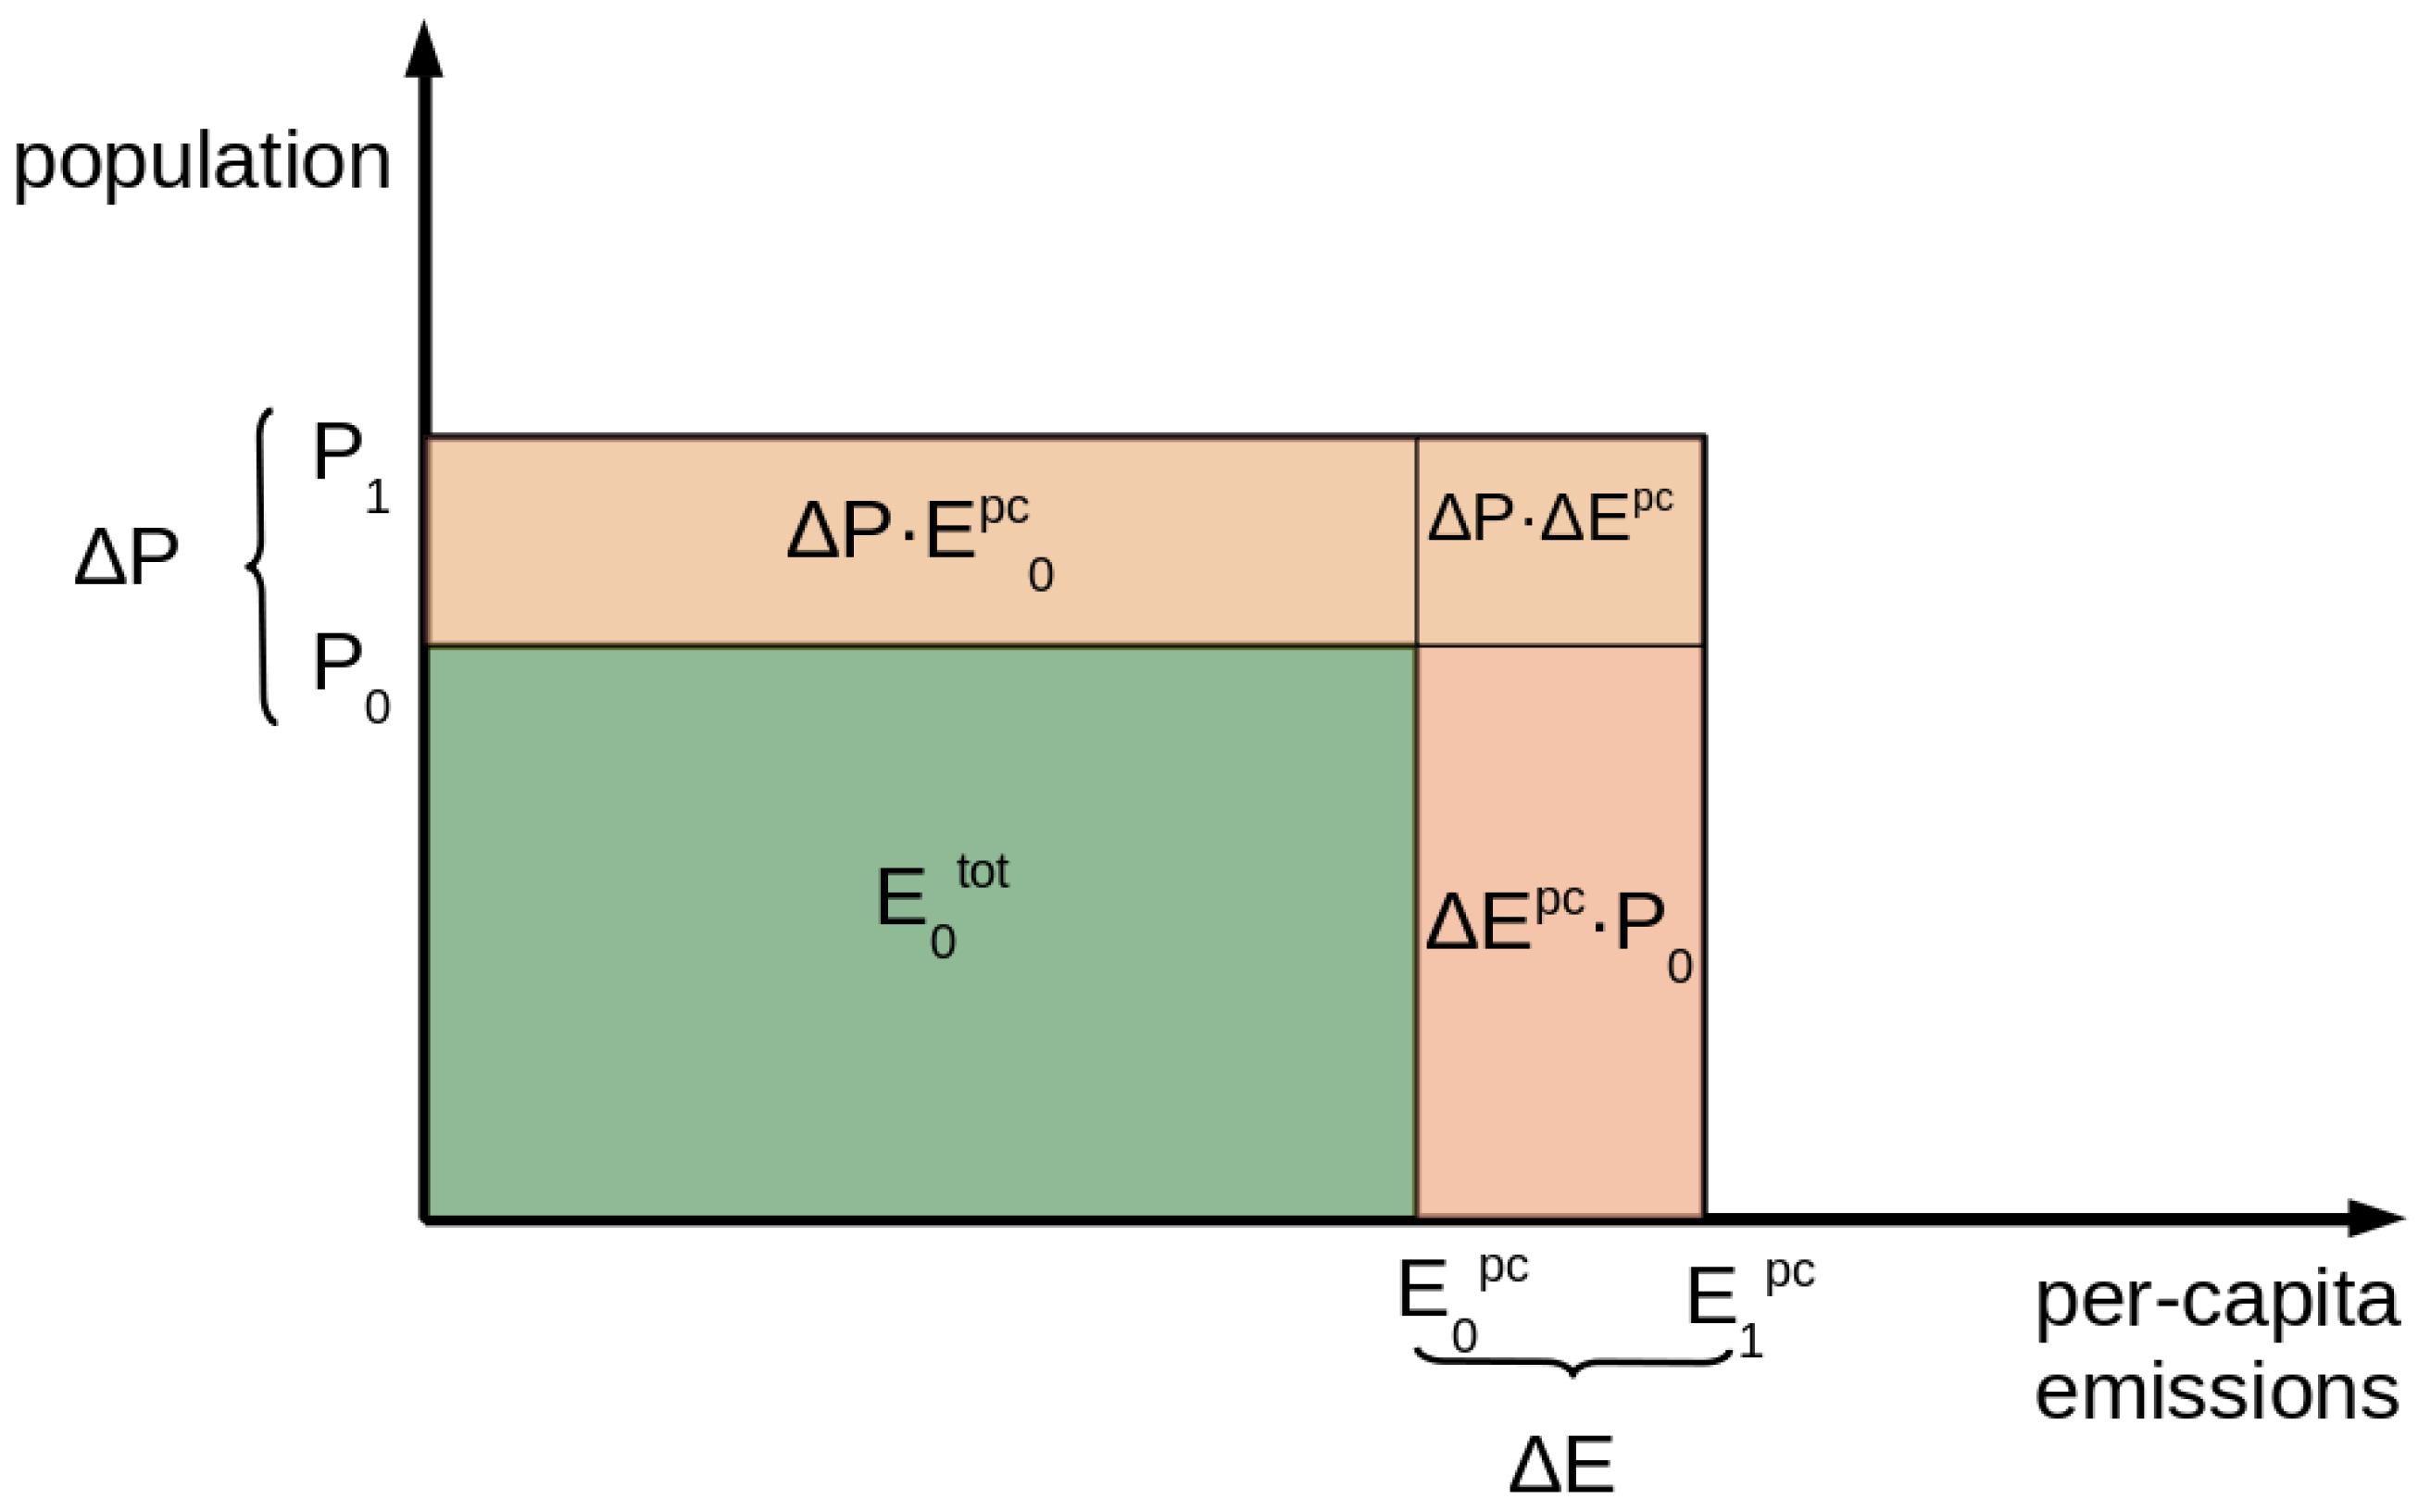
2.1. Theory and calculations

Total carbon emissions can be expressed as the product of population and per capita emissions:
E t o t = P × E p c
The latter factor represents the per capita impact and is often split into two sub-factors, affluence A and technology T, according to the well known I P A T equation, first introduced by Holdren and Ehrlich in the early 1970s [4,19]. One of the main criticisms against this equation concerns precisely the split into affluence and technology, as these two factors are interdependent and hence cannot be properly split [2,20,21,22]. Moreover, there is not a clear unit to express technology. A further possible criticism is that there is not a unique way to split the per capita impact: depending on the aspect one wants to emphasize, different sub-factors can be identified, which is reflected by the many variants of the I P A T equation proposed over time, such as EPAT, ImPACT, STIRPAT and the Kaya identity, often used by climate scientists [2,5,19]. However, all these variants are reducible to the basic Equation (1), which is the equation we chose to use in this work. This choice allows us to avoid controversial decompositions and, at the same time, to compare the effect of population growth with the combined effect of affluence and technology.
Since the two factors E p c and P have different units, their contributions to the product E t o t cannot be directly compared. However, when focusing on the variation of a product, it is possible to establish if changes in one of the factors affected the outcome more than the other. For instance, if the area of a rectangle increased, while the base remained constant or decreased, then it is clear that increased height determined the increase in total area. In IPCC reports, the percent changes of different emissions factors are usually compared. Since IPCC uses the Kaya identity to decompose total emissions, such factors are population, per capita Gross Domestic Product (GDP), energy intensity and carbon intensity [5]. Here, we do not limit our analysis to a comparison of percent changes, but also use a simple geometrical formula (Equation (2)) that allows us to estimate relative contributions of population growth and per capita emission change to overall emission variation.
The variation in total emissions Δ E t o t can be split into three terms:
Δ E t o t = Δ P · E 0 p c + Δ E p c · P 0 + Δ E p c · Δ P
where E 0 p c and P 0 indicate respectively the per capita emissions and the population at the initial year of the period, 1992. Clearly, the first term of the sum in Equation (2) represents the population contribution, i.e., the variation that would have occurred if only the population had varied while the E p c had remained constant. Likewise, the second term represents the per capita emission contribution, namely, the variation that would have occurred if only the per capita impact had changed. Finally, the third term represents the contribution of the interaction of both (see Figure 1).

2.2. The Dataset

The data source for our analysis is the World Bank Open Data repository [15]. Table 1 shows the different variables downloaded. We set 2019 as the last year for our data since it is the last one with consolidated emissions data for most world countries from official sources, such as the International Energy Agency (IEA) and UNFCCC. These data are available with a 3-year lag. Newer data (currently updated up to 2021) present more uncertain estimates and do not include as many countries [23]. In addition, 2020 is a clear outlier in the emissions trend due to the COVID pandemic.
We divided the world’s countries into four income-based groups according to the World Bank’s common division [18], currently favored within international economic development analysis: high-income (H), upper-middle (UM), lower-middle (LM) and low-income countries (L). For the division, we used the per capita Gross National Income (GNI) thresholds indicated by the World Bank for 2019. Therefore, the resulting groups are consistent with the classification valid in 2019, which may slightly differ from the current division or from the classification in other years. The map in Figure 2 shows the four income-based groups.
We then applied the formula in Equation (2) to the different groups and to the world as a whole to estimate the contribution to carbon emission variation from 1992 to 2019 of per capita emission change ( Δ E p c · P 0 ), population growth ( Δ P · E 0 p c ) and the interaction of the two ( Δ E p c · Δ P ).

3. Results

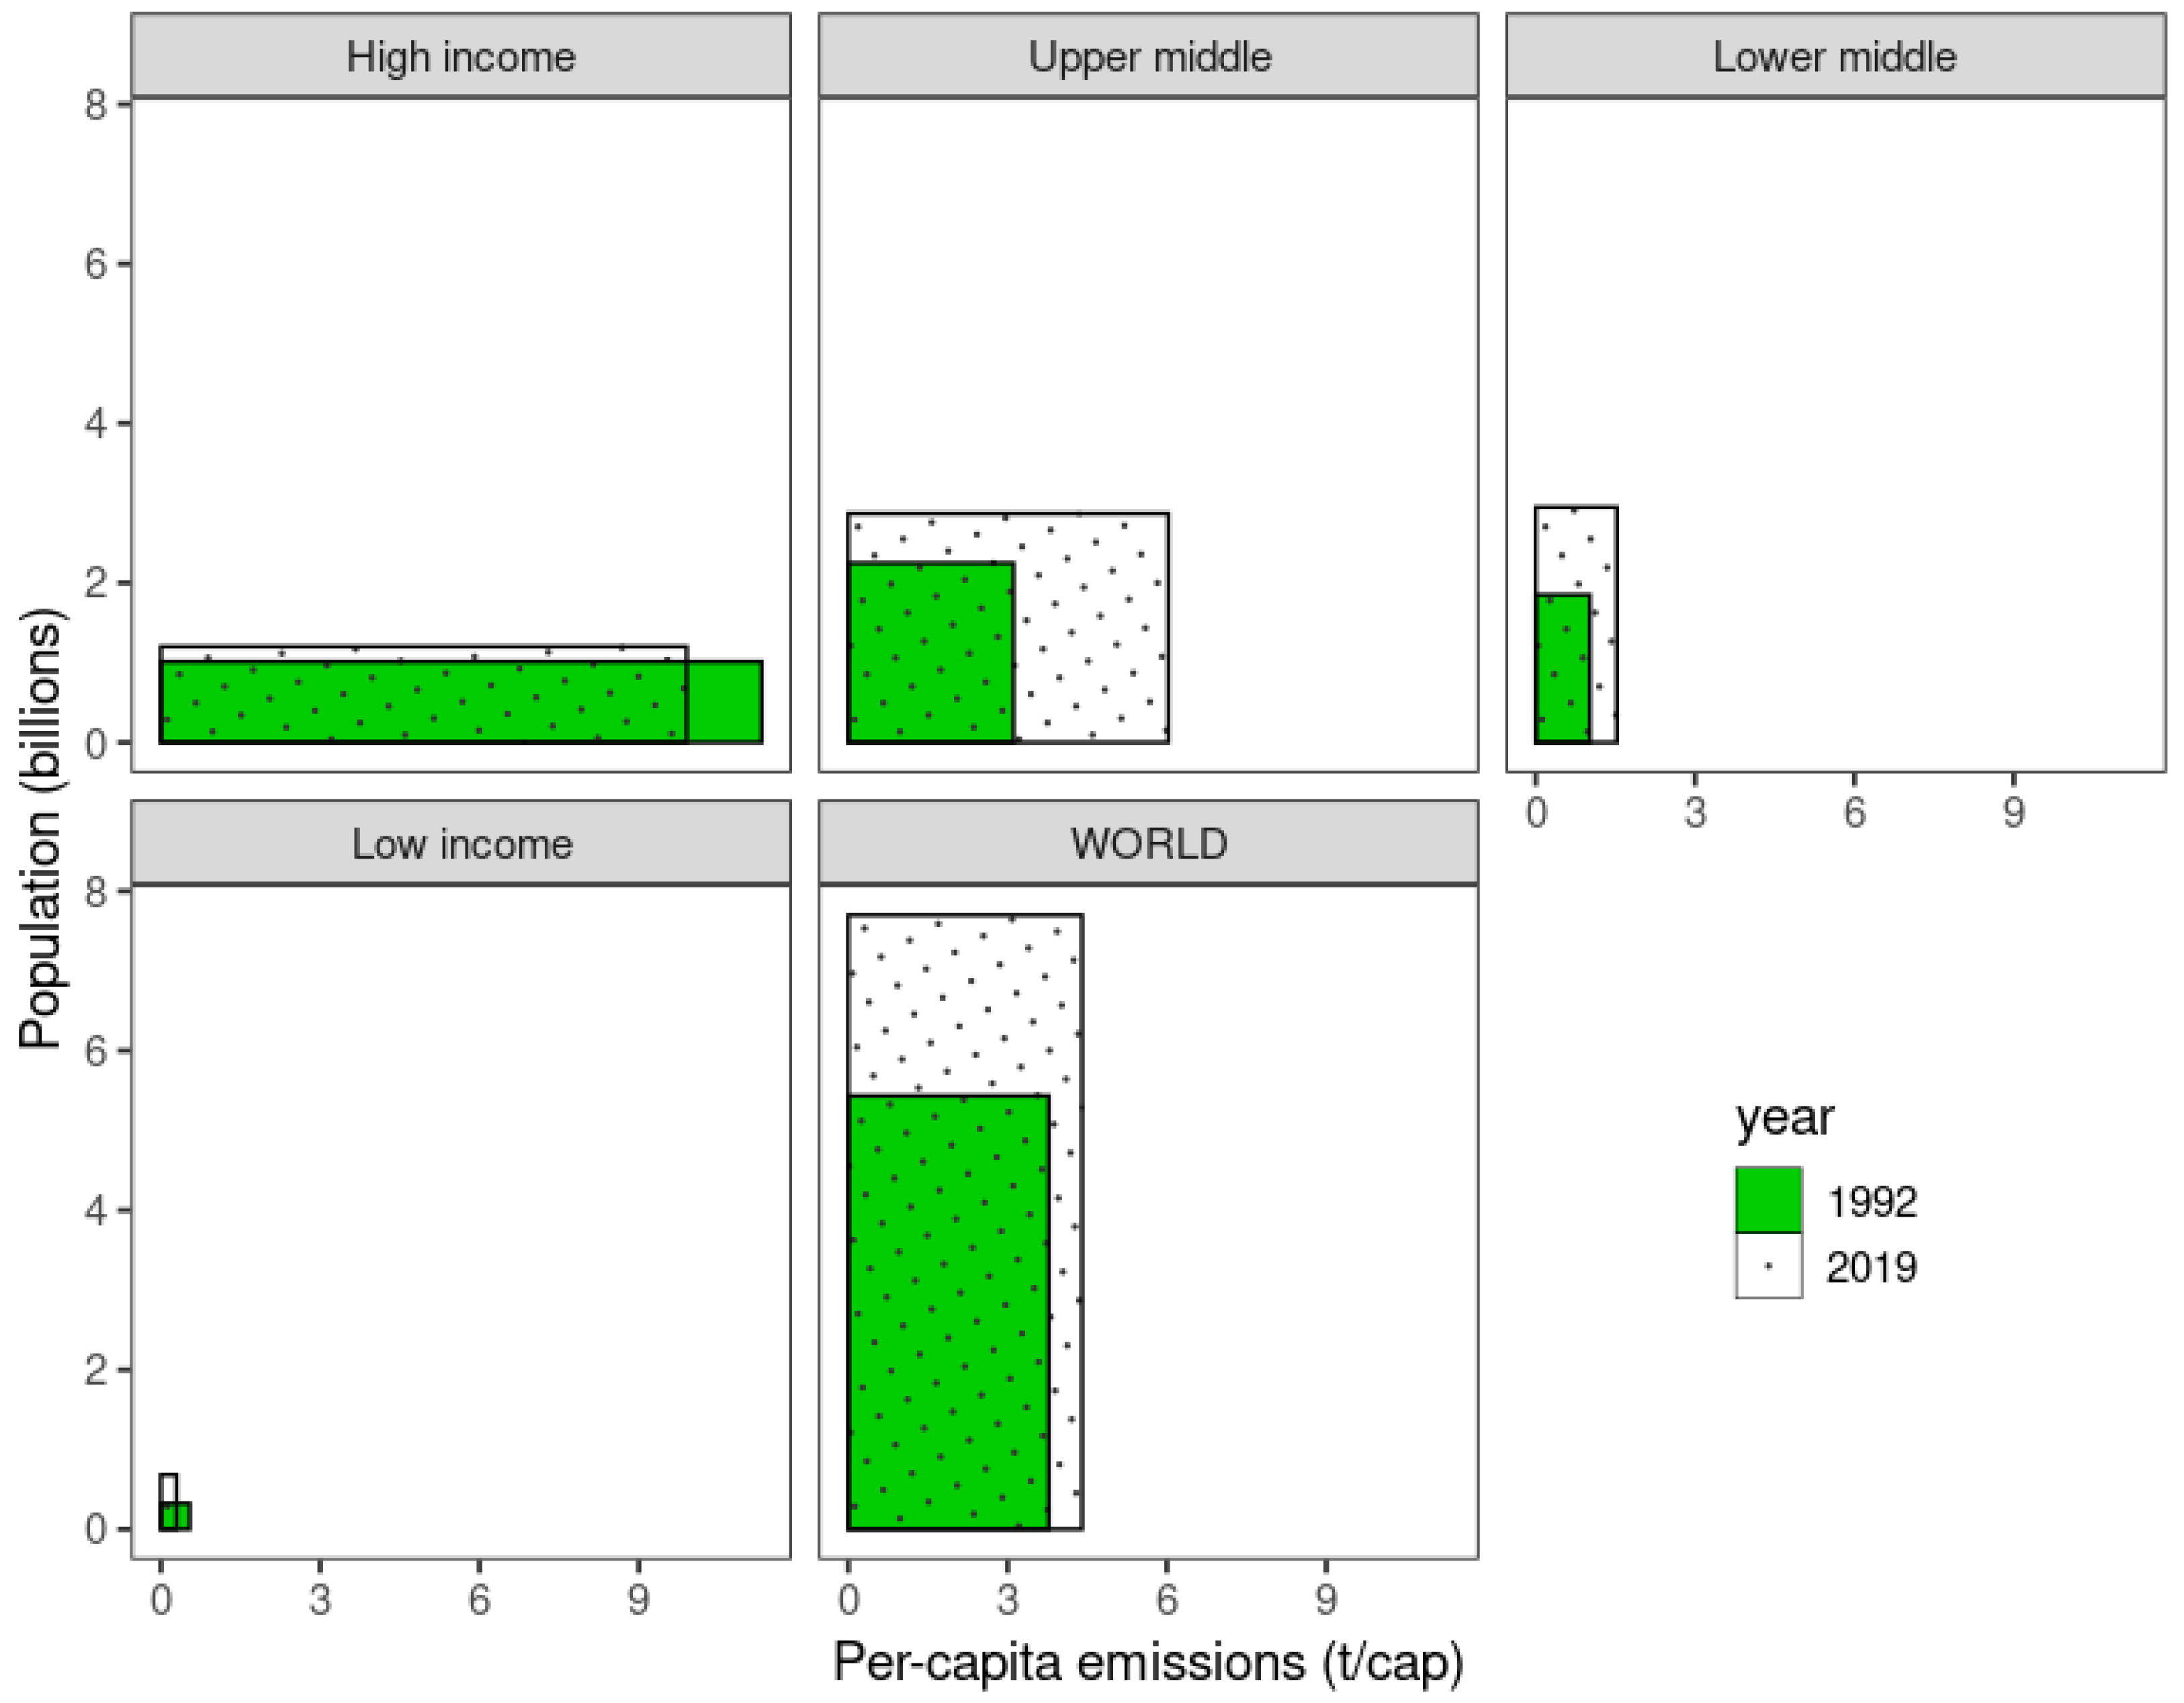
3.1. Population Variation in Country Groups

The population grew during the observed period and is still growing in all four income-based groups. The increases ranged from 18.5% in the H group to 110.2% in the L group.
The causes of growth are different—in the H group, demographic momentum and immigration prevail as fertility rates are usually below the replacement rate (2.1 children per woman). However, there are five interesting exceptions: Kuwait, Israel, Oman, Panama and Saudi Arabia. In the LM and L groups, fertility rates are usually above replacement rate, indicating that the prevalent causes for demographic growth are demographic momentum and high fertility. Even in this case, there are exceptions: Bangladesh, Bhutan, Moldova, Nepal, El Salvador, Sri Lanka, Ukraine and Vietnam in the LM group and North Korea in the L group all have fertility rates below replacement. In the UM group, the situation is mixed: 29 of 56 countries have lower-than-replacement fertility, 24 have higher-than-replacement fertility (three data points are missing). Notably, all African countries in the UM group have high fertility, including three countries with fertility rates > 3 and one with a fertility rate > 4 children per woman.

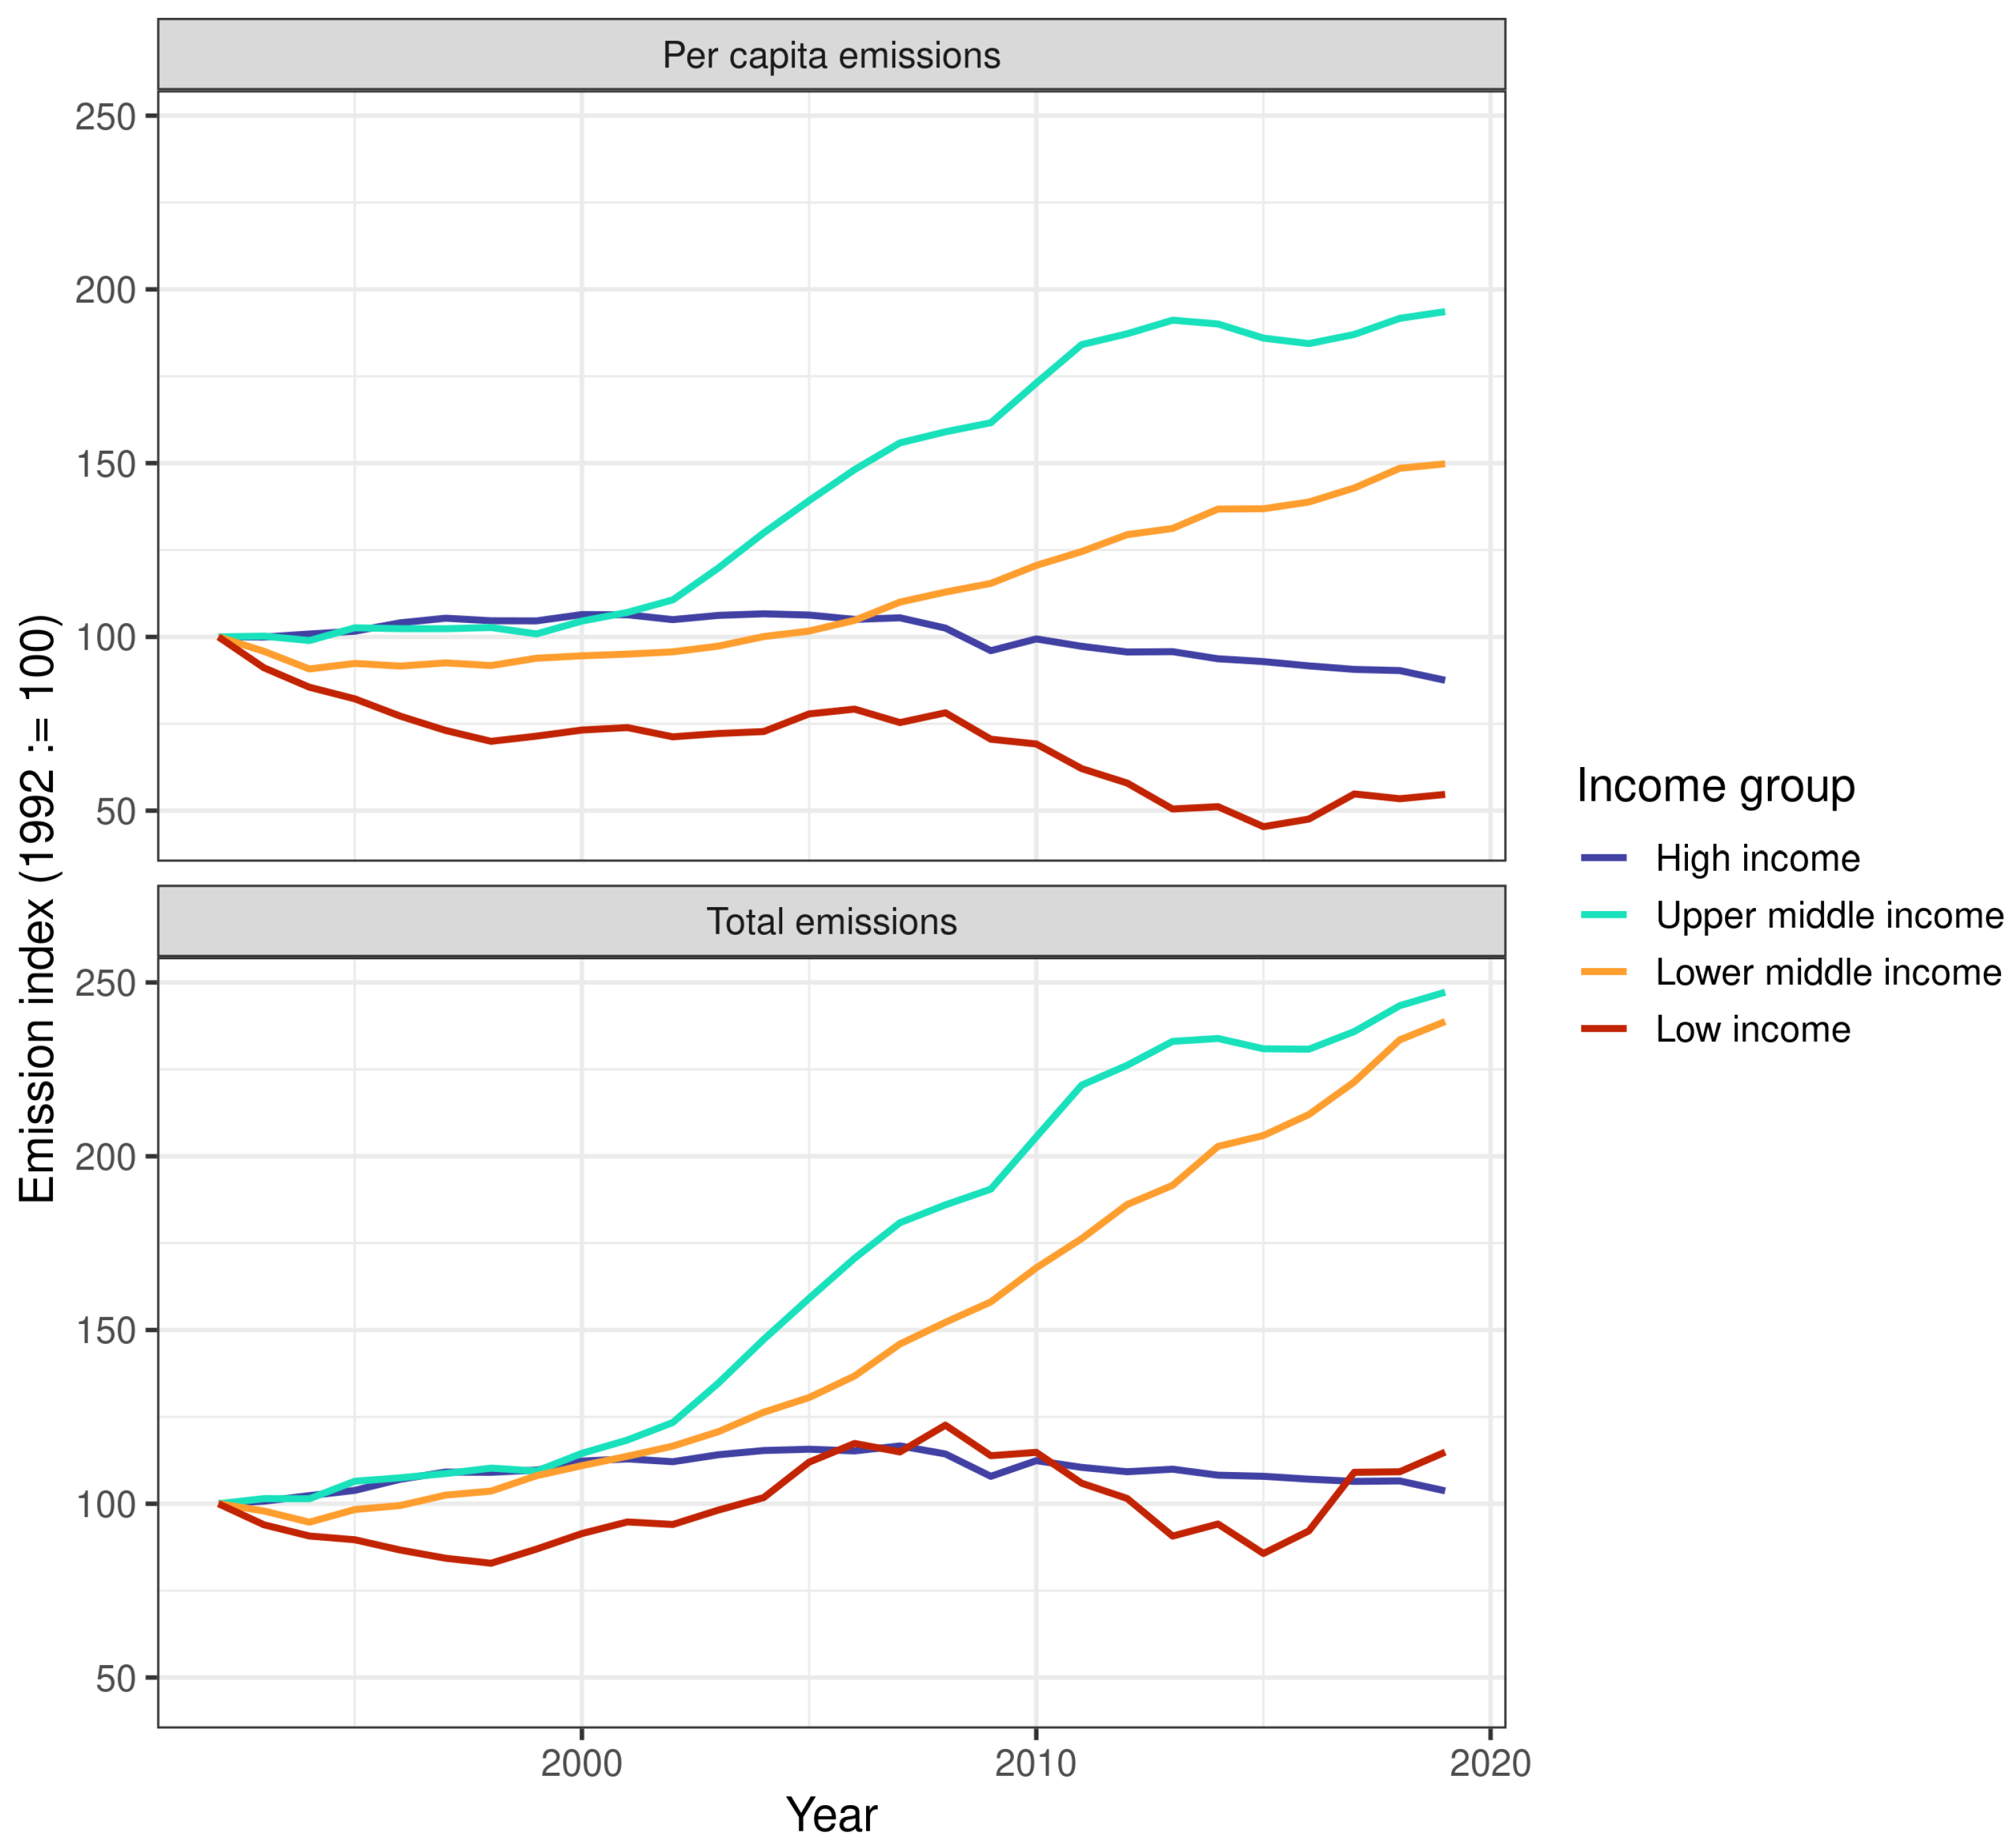
3.2. Emissions in Country Groups

Currently, per capita carbon emissions are the highest in the H group, followed by UM, LM and L. Total emissions are the highest in the UM group, which is responsible for 51.0% of total global emissions, followed by the H group with 35.1% and the LM group with 13.3%. The contribution from the L group is a negligible 0.6% (see Table 2).
Looking at the changes between 1992 and 2019, the middle groups—UM and LM—increased their emissions the most, both total and per capita (Figure 3). The H group decreased its per capita emissions (from 11.3 to 9.9 t/capita), but failed to reduce its total emissions. The L group followed a similar trend but with values for both per capita and total emissions much smaller than the ones in the H group.
Notably, the majority of countries in the H group (40 over 59, i.e., 67.8% of the countries included in this group) decreased their per capita emissions, while 19 increased them, among which are Canada, Chile and most of the oil-exporting countries of the Arabian Gulf. Only 27 countries (i.e., 45.8% of the group countries) instead decreased their total emissions.

3.3. Factor Contributions

Using Equation (2), we estimated the contribution to carbon emission variation from 1992 to 2019 of per capita emissions E, population P and their interaction. The resulting contributions for all country groups and for the world as a whole are shown in Table 3.
Per capita emissions increase is the main driver for the rise of total emissions only in the UM group, accounting for 63.6% of the total increase, while population growth prevails in all the other groups and at the global level.
In the H group, per capita emissions decreased (see Figure 3), while total emissions increased. This means that population growth is not only responsible for the increase in total emissions, but also for the missed decrease that could have happened in these last three decades thanks to the reduction in per capita emissions. This explains why the contribution of population growth in this group exceeds 100%, accounting for 498.8% of the total emissions increase in this group, while the contribution of the per capita emission change is negative.
In the LM group, the situation seems mixed, with similar contributions from both population increase and per capita emissions increase.
At the global level, both population growth and per capita emissions increase contributed to the total increase in carbon emissions. However, population growth was the main driver, directly accounting for 64.0% of the global increase, with per capita emissions increases directly accounting for only 25.4%.
Figure 4 summarizes the variations between 1992 and 2019 in total and per capita carbon emissions and in population, for the four income groups and for the world as a whole, using a visualization similar to the one introduced in Figure 1.

4. Discussion

A common narrative in climate change debates is that a small fraction of the world—the rich countries alone—emits more than all the rest of the world put together, and that population grows only in poor countries, whose contribution to global emissions is negligible [14,24]. Thus, in order to mitigate climate change, we should only focus on cutting per capita emissions, while population growth does not play an important role. As shown in this analysis, such a narrative does not fit the data.
It is true that the contribution of the world’s poorest countries is negligible, but these countries represent a small fraction of the global population (8.8%), while the fraction of the global population living in rich countries is almost double (15.6%). The large majority belongs to the middle groups (37.3% to the upper-middle and 38.3% to the lower-middle group), whose contributions to global emissions are not negligible. Indeed, the contribution of the upper-middle group is the highest of all the groups (51.0% of total carbon emissions), while the contribution of the lower-middle group is smaller (13.3%) but significant and rapidly increasing. Looking at the variations over our time period, the middle groups are the only ones that dramatically increased both per capita and total emissions, while rich countries decreased their per capita emissions (still the highest of all the groups), but failed to reduce their total emissions, which increased, although to a lesser extent than in the middle groups.
The most misleading part of the dominant narrative concerns population. Demographic growth is not limited to poor countries: population keeps growing both at the global level and in all the country groups, albeit at different rates and for different reasons [8]. Fertility is high not only in the low-income group, but also in the large majority of countries in the lower-middle group, in about half of the countries in the upper-middle group (24 over 56), and in a few countries of the high-income group. Population growth in the high-income countries is not only responsible for the increase in their total emissions, but it is also responsible for the missed decrease that could have happened during the last three decades thanks to the reduction in per capita emissions [25]. In all the other groups, population growth is a significant driver of total emission increases and, at the global level, it is the main driver, directly accounting for 64% of the global increase.
This last result may seem to contradict well-known IPCC analyses arguing that population growth—although a major driver of greenhouse gas (GHG) emissions in itself—plays a lesser role than gross GDP increase in explaining the emission trends since the 1990s [2]. The different decomposition of total carbon emissions made by IPCC researchers explains this discrepancy. The Kaya identity they used further decomposes the E p c factor (per capita emissions) into three sub-factors: per capita GDP (GDP/population), energy intensity of GDP (energy/GDP) and CO 2 intensity of energy (CO 2 emissions/energy) (Box 5.1 in [26]). Since the energy intensity of GDP and the CO 2 intensity of energy both decreased in the period under consideration, this decomposition increases the isolated effect of GDP. However, the IPCC itself recognizes that the underlying assumption is that these sub-factors are independent, which they are not, making this decomposition questionable. Precisely for this reason, we chose to avoid controversial decompositions and directly compared population with the combined effect of per capita GDP, energy intensity and carbon intensity of energy, namely, the combined affect of affluence and technology (see Section 2.1).
A limit of our analysis is that we started from country-level data and hence ignored within-country differences in incomes, which recent research suggests play an important role in GHG emissions [27]. We see this interesting finding as complementary to our analysis. It is true that within-country differences in income may be even larger than between-country ones and may explain a large share of the variation in GHG emissions. However, within-country differences in fertility between income groups are often smaller than between-country ones [28,29], which suggests that adopting a between-country perspective has added value when addressing the question of the relative contribution to emissions of population vs. income, especially when trying to identify trends on larger temporal and spatial scales.
Future research may involve a similar analysis using carbon footprint data [30] instead of direct emissions. Being consumption-based, carbon footprint takes into account the effects of international trade and investments, which have been proposed to be significant drivers of emissions, especially in rapidly developing, middle-income countries [31]. This means that part of the emissions growth in this group is actually driven by increased consumption in other countries, mainly high-income ones [32]. Taking a carbon footprint perspective would “internalize” this effect by attributing the emissions of goods and services to countries where they are consumed instead of produced.
Before concluding, it is worth introducing two considerations concerning low-income countries. Their direct emissions are negligible, but there are other factors besides carbon emissions contributing to climate change, such as deforestation. Deforestation rates in those countries are dramatically high and represent a danger not only for climate change, but also for biodiversity loss, especially deforestation of rain forests [33,34]. A main driver of deforestation in poor countries is the expansion of subsistence agriculture [35,36], which is directly linked to population growth [37,38]. Therefore, the population factor is relevant in poor countries as well, albeit for different reasons.
Moreover, the idea that population growth in poor countries is not worrisome because their carbon emissions are negligible implicitly assumes that these countries will remain poor in the future. This assumption is questionable (even) from an ethical point of view, because escaping poverty should be a goal for those countries, supported by the international community, as with the UN’s Sustainable Development Goals (SDG 1) [6,39]. However, if the low-income countries succeeded in reaching an adequate level of human development, their emissions and, in general, their ecological footprint would significantly increase [7]. Population growth would make their emissions even higher and thus should not be neglected [40]. In fact, addressing population growth now with voluntary family planning programs would help poor countries improve their economic and social conditions, resulting in a double benefit, for both people and the environment [41,42,43,44].

5. Conclusions

Our analysis highlighted how the P factor played a major role in increased carbon emissions in the last 30 years. This holds for all income groups, with the partial exception of the upper-middle one, where the rise in per capita emissions was the main driver of the total emissions increase. While our analysis confirms some of the current narratives about the relation between population growth and climate change—e.g., the negligible contribution to climate change of the poorest countries—it does not support the widespread belief that increased affluence is the main driver of increased carbon emissions at the global level.
Although this factor has played an important role, neglecting population growth leads to a skewed and misleading vision of reality. This not only holds for lower-middle and low-income countries, but also for high-income ones, where even the relatively low population growth of the last 30 years was sufficient to nullify the effect of the reduction in per capita emissions and the efforts of many countries to promote technological change and “green growth” [45]. Developed nations with stable or declining populations should hence quit fighting these trends and instead embrace them [46]. Just as a little population growth in rich countries can drive big emissions increases, population decreases in rich countries could have big emission-related benefits going forward.
According to our work, an exclusive focus on per capita emission reductions risks being insufficient to solve climate change. In line with other recent studies [47,48], our analysis suggests the need for a more integrated approach [49] taking into account all major drivers of greenhouse gas emissions, including population growth.

Author Contributions

Conceptualization, L.T. and P.C.; methodology, L.T.; software, L.T. and G.B.; formal analysis, L.T. and G.B.; data curation, G.B.; writing—original draft preparation, L.T. and P.C.; writing—review and editing, P.C., G.B. and L.T.; visualization, L.T. and G.B. All authors have read and agreed to the published version of the manuscript.

Funding

This research received no external funding.

Institutional Review Board Statement

Not applicable.

Informed Consent Statement

Not applicable.

Data Availability Statement

Restrictions apply to the availability of these data. Data were obtained from the World Bank Open Database and are available at https://data.worldbank.org/ accessed on 28 December 2022 (details in Section 2.2).

Acknowledgments

Lucia Tamburino would like to thank Daniele Ferro for the long conversations, as always a source of inspiration and interesting insights.

Conflicts of Interest

The authors declare no conflict of interest.

References

  1. Ripple, W.J.; Wolf, C.; Newsome, T.M.; Gregg, J.W.; Lenton, T.M.; Palomo, I.; Eikelboom, J.A.; Law, B.E.; Huq, S.; Duffy, P.B.; et al. World scientists’ warning of a climate emergency 2021. BioScience 2021, 71, 894–898. [Google Scholar] [CrossRef]
  2. IPCC. Climate Change 2022: Mitigation of Climate Change. Working Group III Contribution to the IPCC Sixth Assessment Report. Available online: https://www.ipcc.ch/report/ar6/wg3/ (accessed on 29 December 2022).
  3. Steffen, W.; Rockström, J.; Richardson, K.; Lenton, T.M.; Folke, C.; Liverman, D.; Summerhayes, C.P.; Barnosky, A.D.; Cornell, S.E.; Crucifix, M.; et al. Trajectories of the Earth System in the Anthropocene. Proc. Natl. Acad. Sci. USA 2018, 115, 8252–8259. [Google Scholar] [CrossRef] [PubMed]
  4. Holdren, J.P.; Ehrlich, P.R. One-Dimensional Ecology Revisited A Rejoinder. Bull. At. Sci. 1972, 28, 42–45. [Google Scholar] [CrossRef]
  5. Chertow, M.R. The IPAT equation and its variants. J. Ind. Ecol. 2001, 4, 13–29. [Google Scholar] [CrossRef]
  6. Dodson, J.C.; Dérer, P.; Cafaro, P.; Götmark, F. Population growth and climate change: Addressing the overlooked threat multiplier. Sci. Total Environ. 2020, 748, 141346. [Google Scholar] [CrossRef]
  7. Tamburino, L.; Bravo, G. Reconciling a positive ecological balance with human development: A quantitative assessment. Ecol. Indic. 2021, 129, 107973. [Google Scholar] [CrossRef]
  8. United Nations. World Population Prospects; Technical Report; UN, Department of Economic and Social Affairs, Population Division: New York, NY, USA, 2022.
  9. Bongaarts, J.; O’Neill, B.C. Global warming policy: Is population left out in the cold? Science 2018, 361, 650–652. [Google Scholar] [CrossRef]
  10. Washington, H.; Lowe, I.; Kopnina, H. Why Do Society and Academia Ignore the ‘Scientists Warning to Humanity’ On Population? J. Futur. Stud. 2020, 25, 93–106. [Google Scholar]
  11. Cafaro, P. Climate ethics and population policy: A review of recent philosophical work. Wiley Interdiscip. Rev. Clim. Chang. 2022, 13, e748. [Google Scholar] [CrossRef]
  12. Wiedmann, T.; Lenzen, M.; Keyßer, L.T.; Steinberger, J.K. Scientists’ warning on affluence. Nat. Commun. 2020, 11, 3107. [Google Scholar] [CrossRef]
  13. Nielsen, K.S.; Nicholas, K.A.; Creutzig, F.; Dietz, T.; Stern, P.C. The role of high-socioeconomic-status people in locking in or rapidly reducing energy-driven greenhouse gas emissions. Nat. Energy 2021, 6, 1011–1016. [Google Scholar] [CrossRef]
  14. Gore, T. Extreme Carbon Inequality: Why the Paris Climate Deal Must Put the Poorest, Lowest Emitting and Most Vulnerable People First; Technical Report; Oxfam International: Nairobi, Kenya, 2015. [Google Scholar]
  15. World Bank. Dataset. Available online: https://data.worldbank.org/ (accessed on 28 December 2022).
  16. Weber, H.; Sciubba, J.D. The Effect of Population Growth on the Environment: Evidence from European Regions. Eur. J. Popul. 2018, 35, 379–402. [Google Scholar] [CrossRef] [PubMed]
  17. Friedlingstein, P.; O’Sullivan, M.; Jones, M.W.; Andrew, R.M.; Gregor, L.; Hauck, J.; Quéré, C.L.; Luijkx, I.T.; Olsen, A.; Peters, G.P.; et al. Global Carbon Budget 2022. Earth Syst. Sci. Data 2022, 14, 4811–4900. [Google Scholar] [CrossRef]
  18. World Bank. The World by Income and Region. Available online: https://datatopics.worldbank.org/world-development-indicators/the-world-by-income-and-region.html (accessed on 28 December 2022).
  19. York, R.; Rosa, E.A.; Dietz, T. STIRPAT, IPAT and ImPACT: Analytic Tools for Unpacking the Driving Forces of Environmental Impacts. Ecol. Econ. 2003, 46, 351–365. [Google Scholar] [CrossRef]
  20. Alcott, B. Impact caps: Why population, affluence and technology strategies should be abandoned. J. Clean. Prod. 2010, 18, 552–560. [Google Scholar] [CrossRef]
  21. Cleveland, C.J.; Ruth, M. Indicators of dematerialization and the materials intensity of use. J. Ind. Ecol. 1998, 2, 15–50. [Google Scholar] [CrossRef]
  22. Herring, H.; Roy, R. Technological innovation, energy efficient design and the rebound effect. Technovation 2007, 27, 194–203. [Google Scholar] [CrossRef]
  23. Climate Watch. Data Sources for CO2 Emissions. Available online: https://www.climatewatchdata.org/about/faq/ghg (accessed on 2 January 2023).
  24. Fletcher, R.; Breitling, J.; Puleo, V. Barbarian hordes: The overpopulation scapegoat in international development discourse. Third World Q. 2014, 35, 1195–1215. [Google Scholar] [CrossRef]
  25. Kuhlemann, K. Any size population will do?: The fallacy of aiming for stabilization of human numbers. Ecol. Citiz. 2018, 1, 181–189. [Google Scholar]
  26. Blanco, G.; Gerlagh, R.; Suh, S.; Barrett, J.; de Coninck, H.C.; Morejon, C.F.D.; Mathur, R.; Nakicenovic, N.A.; Ofosu Ahenkora, J.P.; Pathak, H.; et al. Drivers, Trends and Mitigation. In Climate Change 2014: Mitigation of Climate Change. Contribution of Working Group III to the Fifth Assessment Report of the Intergovernmental Panel on Climate Change; Cambridge University Press: Cambridge, UK, 2014. [Google Scholar]
  27. Chancel, L. Global carbon inequality over 1990–2019. Nat. Sustain. 2022, 5, 931–938. [Google Scholar] [CrossRef]
  28. Day, C. Skill Composition, Fertility, and Economic Growth. Rev. Income Wealth 2013, 61, 164–178. [Google Scholar] [CrossRef]
  29. Balbo, N.; Billari, F.C.; Mills, M. Fertility in Advanced Societies: A Review of Research. Eur. J. Popul. 2012, 29, 1–38. [Google Scholar] [CrossRef] [Green Version]
  30. Wiedmann, T.; Minx, J. A definition of ‘carbon footprint’. Ecol. Econ. Res. Trends 2008, 1, 1–11. [Google Scholar]
  31. Aichele, R.; Felbermayr, G. Kyoto and the carbon footprint of nations. J. Environ. Econ. Manag. 2012, 63, 336–354. [Google Scholar] [CrossRef]
  32. Arto, I.; Dietzenbacher, E. Drivers of the Growth in Global Greenhouse Gas Emissions. Environ. Sci. Technol. 2014, 48, 5388–5394. [Google Scholar] [CrossRef]
  33. Díaz, S.; Settele, J.; Brondízio, E.S.; Ngo, H.T.; Agard, J.; Arneth, A.; Balvanera, P.; Brauman, K.A.; Butchart, S.H.; Chan, K.M.; et al. Pervasive human-driven decline of life on Earth points to the need for transformative change. Science 2019, 366, eaax3100. [Google Scholar] [CrossRef]
  34. Díaz, S.M.; Settele, J.; Brondízio, E.; Ngo, H.; Guèze, M.; Agard, J.; Arneth, A.; Balvanera, P.; Brauman, K.; Butchart, S.; et al. The Global Assessment Report on Biodiversity and Ecosystem Services: Summary for Policy Makers; Technical Report; Intergovernmental Science-Policy Platform on Biodiversity and Ecosystem Services: Bonn, Germany, 2019. [Google Scholar]
  35. FAO. The Future of Food and Agriculture–Trends and Challenges; Annual Report; FAO: Rome, Italy, 2017. [Google Scholar]
  36. Laurance, W.F.; Sayer, J.; Cassman, K.G. Agricultural expansion and its impacts on tropical nature. Trends Ecol. Evol. 2014, 29, 107–116. [Google Scholar] [CrossRef]
  37. Crist, E.; Mora, C.; Engelman, R. The interaction of human population, food production, and biodiversity protection. Science 2017, 356, 260–264. [Google Scholar] [CrossRef]
  38. López-Carr, D.; Burgdorfer, J. Deforestation drivers: Population, migration, and tropical land use. Environ. Sci. Policy Sustain. Dev. 2013, 55, 3–11. [Google Scholar] [CrossRef] [PubMed]
  39. Heyward, C. A growing problem? Dealing with population increases in climate justice. Ethical Perspect. 2012, 19, 703–732. [Google Scholar]
  40. Hickey, C.; Rieder, T.N.; Earl, J. Population engineering and the fight against climate change. Soc. Theory Pract. 2016, 42, 845–870. [Google Scholar] [CrossRef]
  41. Sohn, E. Strengthening society with contraception. Nature 2020, 588, S162–S164. [Google Scholar] [CrossRef] [PubMed]
  42. Sedgh, G.; Ashoford, L.S.; Hussain, R. Unmet Need for Contraception in Developing Countries: Examine Women’s Reasons for Not Using a Method; Technical Report; The Guttmacher Institute: New York, NY, USA, 2016. [Google Scholar]
  43. Bongaarts, J.; Hardee, K. Trends in contraceptive prevalence in Sub-Saharan Africa: The roles of family planning programs and education. Afr. J. Reprod. Health 2019, 23, 96–105. [Google Scholar] [CrossRef]
  44. Cottingham, J.; Germain, A.; Hunt, P. Use of human rights to meet the unmet need for family planning. Lancet 2012, 380, 172–180. [Google Scholar] [CrossRef]
  45. Hao, L.N.; Umar, M.; Khan, Z.; Ali, W. Green growth and low carbon emission in G7 countries: How critical the network of environmental taxes, renewable energy and human capital is? Sci. Total Environ. 2021, 752, 141853. [Google Scholar] [CrossRef] [PubMed]
  46. Götmark, F.; Cafaro, P.; O’Sullivan, J. Aging human populations: Good for us, good for the earth. Trends Ecol. Evol. 2018, 33, 851–862. [Google Scholar] [CrossRef] [PubMed]
  47. Seibert, M.K.; Rees, W.E. Through the eye of a needle: An eco-heterodox perspective on the renewable energy transition. Energies 2021, 14, 4508. [Google Scholar] [CrossRef]
  48. Rees, W.E. The human eco-predicament: Overshoot and the population conundrum. Vienna Yearb. Popul. Res. 2023, 21, 1–19. [Google Scholar] [CrossRef]
  49. Sachs, J.D.; Schmidt-Traub, G.; Mazzucato, M.; Messner, D.; Nakicenovic, N.; Rockström, J. Six Transformations to achieve the Sustainable Development Goals. Nat. Sustain. 2019, 2, 805–814. [Google Scholar] [CrossRef]
Figure 1. Total emissions at the initial time ( E 0 t o t ) are represented by the green rectangle; total emissions at the final time ( E 1 t o t ) are represented by the big rectangle given by the green and the pink sections together. The pink sections represent the variation Δ E t o t .
Sustainability 15 03245 g001
Figure 2. World countries according to the World Bank’s division into four income-based groups as of 2019: low-income (<1035 current US$ average GNI/capita), lower-middle-income (1036–4045), higher-middle-income (4046–12,535) and high-income (>12,535).
Sustainability 15 03245 g002
Figure 3. Changes in total and per capita carbon emissions from 1992 to 2019 by income group. All values have been set to equal 100 in the initial year, so percentages of initial values are shown.
Sustainability 15 03245 g003
Figure 4. The x-axis graphs per capita carbon emissions in tons/capita; the y-axis graphs population in billions of people. Rectangle areas hence represent the total carbon emissions in 1992 (green rectangles) and 2019 (transparent dotted rectangles).
Sustainability 15 03245 g004
Table 1. Overview of the main variables included in the dataset. All data were downloaded from the World Bank repository [15] on 28 December 2022.
VariableWB CodeDescription
GNI per capitaNY.GNP.PCAP.PP.KDGNI per capita, PPP (constant 2017 international $)
GNI totalNY.GNP.MKTP.KDGNI (constant 2015 US$)
PopulationSP.POP.TOTLPopulation, total
SurfaceAG.SRF.TOTL.K2Surface area (km 2 )
Fertility rateSP.DYN.TFRT.INFertility rate, total (births per woman)
CO 2 emissionsEN.ATM.CO2E.KTCO 2 emissions, total (kt)
CO 2 per capita CO 2 emissions, per capita (t)Computed as (EN.ATM.CO2E.KT × 1000)/SP.POP.TOTL
Table 2. Carbon emissions in 2019 by national income group.
GroupPer Capita EmissionsTotal Emissions% of Global Population% of Global Emissions
High-income9.9 t/capita11.88 Gt15.6%35.1%
Upper-middle6.0 t/capita17.29 Gt37.3%51.0%
Lower-middle1.5 t/capita4.51 Gt38.3%13.3%
Low-income0.3 t/capita0.2 Gt8.8%0.6%
Table 3. Contribution of population change ( Δ P · E 0 p c ), per capita emissions change ( Δ E p c · P 0 ) and the interaction of the two ( Δ E p c · Δ P ) to the total emission variation ( Δ E t o t ) from 1992 to 2019. For each country group, contributions are shown in CO 2 millions of tons (Mt) and as percentages of the total variation.
Contribution → Population Δ P · E 0 pc Per Capita Emissions Δ E pc · P 0 Interaction Δ E pc · Δ P Total Variation Δ E tot
Group ↓CO 2 MtCO 2 MtCO 2 MtCO 2 Mt
High-income2120 (498.8%)−1430 (−336.5%)−265 (−62.3%)425 (100%)
Upper-middle1938 (18.8%)6544 (63.6%)1814 (17.6%)10,296 (100%)
Lower-middle1119 (42.7%)941 (35.9%)558 (21.3%)2619 (100%)
Low-income194 (740.8%)−80 (−305.0%)−88 (−335.8%)26 (100%)
World8551 (64.0%)3398 (25.4%)1416 (10.6%)13,366 (100%)
Disclaimer/Publisher’s Note: The statements, opinions and data contained in all publications are solely those of the individual author(s) and contributor(s) and not of MDPI and/or the editor(s). MDPI and/or the editor(s) disclaim responsibility for any injury to people or property resulting from any ideas, methods, instructions or products referred to in the content.

