Abstract
The implementation of the relevant management system makes the road-parking behavior standardized, while increasing the difficulty of temporary parking of operational vehicles such as taxis. Therefore, in order to improve the relevant management measures and promote the sustainable development of the taxi industry, it is necessary to survey the demand for taxi parking and study the layout of taxi stops. To process the GPS data of the taxis, and to extract the loading and unloading positions of the passengers from the spatial trajectory data, big data analysis technology is used. Compared with the data obtained using traditional survey means, the spatial trajectory data reflects the situation of the whole system, which can make the analysis more accurate. K-means cluster analysis was used to determine community demand. Finally, the immune optimization model was used to determine the optimal taxi stand location. The problem of taxi stand location at the level of urban network from two dimensions of quantity and spatial distribution is solved in this paper. The location of 10 taxi stands can not only meet the parking needs of regional taxis, but also reasonably allocate urban resources and promote sustainable development. This study also has a certain reference value for relevant management departments.
1. Introduction
Taxis are convenient for residents to travel, but also increase the burden of road traffic [1]. In recent years, a number of management measures have been implemented to alleviate traffic congestion caused by taxis and other operating vehicles randomly parking on the side of the road to load and unload passengers. The implementation of management measures has alleviated the urban congestion caused by road parking to some extent, but also increased the difficulty of taxi operation. The taxi station can provide a relatively fixed parking space to reduce the impact of taxi stops on dynamic traffic [2]. Taking the parking needs of taxis into account, it is particularly important to set up taxi stations to make the temporary parking behavior within the road legal and compliant, which is very important to promote the sustainable development of the taxi industry.
If the number of temporary stops is too small, it is difficult to cover the parking demand. In contrast, if the layout is too dense, it will prompt frequent parking behavior, which is bound to form obstacles to the rear car, resulting in short-term traffic congestion, affecting the efficiency of traffic flow while increasing energy consumption. Moreover, the excessive layout of temporary stops is also a waste of resources. The excessive placement of taxi stations is also a waste of resources and goes against the concept of sustainable development of the city. The rational layout of taxi stations is closely related to the utilization of urban resources, energy consumption and the development of the urban taxi industry.
Jin Lei [3] pointed out that the main reason for the unreasonable design of the station and the low usage rate is that the taxi running rules around the station are ignored. Therefore, this study is different from the previous ones, which use simulation technology and take traffic efficiency as the main optimization objective to study taxi station scale, size and the platform type. This study uses taxi GPS data to find the spatial distribution of parking demand from the level of urban road network, and then studies the reasonable layout of the stations. The purpose of this paper is to meet the demand for taxi stops, and to promote the rational allocation of urban resources and sustainable development of the city. It attempts to answer two questions: (1) What is a reasonable number of taxi stations? (2) How to design a reasonable taxi station layout?
The rest of this paper is organized as follows. A literature review of the relevant work on the layout of taxi stands is present in Section 2. Section 3 presents the data used in this study. The methods and the model used in this paper are described in Section 4 and Section 5. Section 6 analyzes the results and discusses the findings. The final section summarizes the contributions and implications of this study.
2. Literature Review
In recent years, GPS track data has been widely used in urban traffic research. McGowan [4] pointed out in his research that GPS data has better accuracy and reliability than traditional survey data. Sample information extracted from a large amount of GPS data is an objective reflection of the subject of the sample, and the results of data analysis also have a certain universality [5]. Taxi GPS data is also widely used in the analysis of travel behavior analysis [6,7,8]. In addition to the study of travel behavior, taxi GPS data is also very important for spatial location analysis and location research. Using cluster analysis to study taxi operation data, Lee et al. [9] calculated areas with large taxi-travel demand, provided operation suggestions for taxis, and reduced the empty driving rate of taxis. Ocalir et al. [10] used GIS to analyze spatial data and studied the location of taxi stands. Dun Cao [11] predicted the demand of taxis using taxi trajectory data. The use of spatial trajectory data makes the acquisition of relevant research information more convenient. Scholars can quickly lock areas with a large demand for taxi parking according to GPS data.
It is obviously unreasonable to design taxi stops in places with high demand using only GPS data. In order to explore the rationality of the layout of taxi station, many scholars combined spatial trajectory data and applied basic theories, such as operations research, to study the optimization of taxi station location. Cooper [12] discussed the relationship between taxi operation and management mode, passenger travel demand and taxi stop, providing the optimal location of taxi station layout in the planning case from the theoretical level. According to the travel characteristics of airport taxis, Neufville et al. [13] designed the site selection of the stopping station with the minimum average waiting time as the goal by combining the phenomenon of passenger arrival and taxi queuing. Jin [3] made a targeted analysis of the taxi GPS data and obtained the taxi travel hot spots in different periods using NDE (nuclear density estimation method). He found the spatial rules of passenger travel demand and provided support for the study on the location of taxi stations. Wang [14] used taxi GPS track data to extract multi-class taxi stops and analyze taxi travel characteristics. Taking Chunxi Road Business District in Chengdu as an example, Wang [15] proposed a bi-level optimization model that minimizes construction cost and maximizes public satisfaction using a genetic algorithm and a bi-level optimization model, studying the site selection model of taxi stations in urban hot spots. Based on a genetic algorithm and queuing theory, Tian [16] proposed a research method to establish taxi stations in urban hot spots. Tong [17] mined the hot spots in the morning and evening peaks based on taxi track data, urban road network and POI information to provide a reference for station planning. Ye et al. [18] introduced fractal theory when studying the layout of taxi service station to evaluate the coordination between the layout of a taxi service station and urban spatial form, which made up for the lack of quantitative analysis in the previous study. On the basis of studying taxi station marking lines and affiliated facilities in Beijing and referring to successful experience in China and foreign countries, Ma et al. [19] proposed optimization suggestions for taxi stand setting standards, but they just discussed the form of taxi station. Niu [20] discussed the number and location of city taxi stations and established a model for the layout of taxi stations. Wu et al. [21] studied the operation efficiency of taxi stands and abstracted three typical taxi management modes for taxi pick-up and drop-off points. Considering the relationship between travel demand and land use, potential factors, taxi operation characteristics and other factors, Ye [22] established a land use-based taxi stand scale prediction model. However, the determination of many parameters in the model was obviously influenced by subjective factors, leading to more errors in the prediction results. According to different road conditions and corresponding traffic conditions, Zhang et al. [23] carried out a detailed analysis of the location and type of taxi stand.
The existing research focuses on the rational distribution of stops in local areas of cities, such as business districts and large transportation hubs. At the level of the urban transportation network, the analysis of reasonable location of taxi stations is less pronounced. In the study of site selection, GIS and other conventional geographic information systems become one of the main methods [24,25,26]. With the advent of the era of big data, extracting effective information from massive data is an important part of research. Wang Jin has made use of 5G to obtain a large amount of traffic network data and has conducted research [27]. K-means cluster analysis, genetic algorithm and other big data analysis methods are also gradually being used in the study of urban traffic problems [28,29,30]. In future research, it is necessary to make full use of big data to process data for rapid analysis, making up for the deficiency of traditional analysis methods.
This paper studies the spatial distribution of taxi stations at the city level. It is expected to complement the existing research. This research also combines big data analysis technology and methods to study issues, breaking through the traditional transportation field using GIS and other processing technologies, which can enrich relevant research methods and promote the cross-integration of disciplines. The immune optimization model was used for iterative calculations to obtain the optimal number of taxi stations. The location of the stations was accurately determined in combination with the demand distribution obtained using cluster analysis. Solving the layout of taxi stations in terms of both quality and spatial distribution is of great significance for the sustainable development of the taxi industry and the rational allocation of urban resources.
3. Data Preparation
3.1. Original Data
In this paper, Xiaoshan District, Hangzhou City, Zhejiang Province, is the main research object. Taxi GPS data in the study area is loaded into vector maps to analyze the travel trajectory of taxi vehicles and understand the spatial and temporal distribution of parking demand.
The GPS data were collected from the GPS-loaded taxis in 2020. The taxis reported real-time information, such as equipment status, operating status, geographic location, instantaneous speed and operational azimuth, at regular intervals. The original data were stored in the form of PDE’s oracle backup data. In order to facilitate data analysis and processing, the original data were converted into a csv format that Excel can read for statistical analysis.
This study analyzed the GPS positioning data of thousands of taxis to understand the running status of taxis in morning and evening peak hours. The volume of spatial data of switchboard reached hundreds of millions of pieces. Table 1 lists the types of information in spatial trajectory data.

Table 1.
The types of information in spatial trajectory data.
3.2. Data Processing
In accordance with the data requirements of the modelling, effective information should be extracted from the initial spatial data, such as the status of taxi operations and the spatial distribution of parking demand. The status of the rental car passenger was assessed by the “state” in the GPS data. While “1” indicates that the passenger is being transported, “0” indicates that the passenger is not transported. The change indicates that passengers are getting on and off. Figure 1 shows the main data-processing process. The main data-processing methods are SQL structured query statements and Java programming. The pick-up and drop-off location information is collected for K-means cluster analysis. The data-processing procedure is shown in Figure 1.
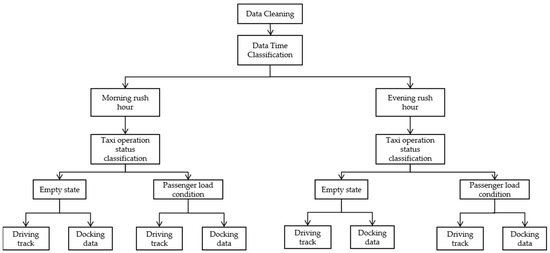
Figure 1.
Data-processing procedure.
After analyzing and processing the data, the route taken by taxis in the study area during the morning and evening peaks can be plotted, as shown in Figure 2 and Figure 3.
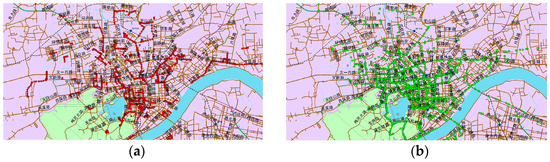
Figure 2.
Driving track in morning rush hour: (a) Unloading distribution of taxi in morning peak; (b) Morning peak passenger load condition.
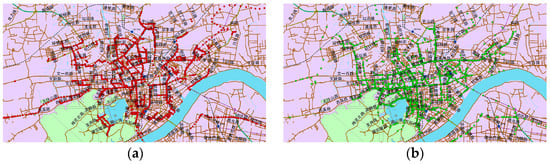
Figure 3.
Driving track in evening rush hour: (a) Unloading distribution of taxi in evening peak; (b) Evening peak passenger load condition.
4. Methodology
4.1. Research Framework
Based on huge taxi spatial trajectory data, this study uses SQL, JAVA and other data-processing technologies to judge the unloading state and passenger-load state of taxis in the morning and evening peak periods, and calculates the information of taxi disembarkation location. The K-means cluster analysis algorithm was used for iterative calculations to establish the demand cell. The immune optimization model was used to calculate the location, number and scale of docking stations in order to rationalize the layout of taxi stations, so as to give full play to the role of the stops to the maximum extent. The framework of the research is shown in Figure 4.
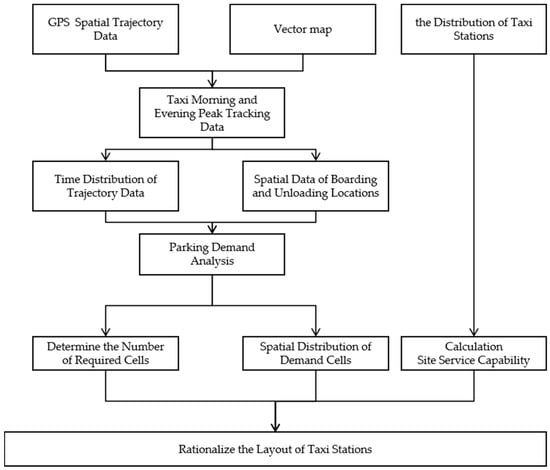
Figure 4.
Research framework.
The main techniques used in the research process are K-means cluster analysis and the immune optimization model. The basic introduction of the model is in Section 4.2 and Section 4.3.
4.2. K-means Cluster Analysis
The K-means clustering analysis algorithm was independently proposed by Steinways, Lloyd, Ball and Hall, and McQueen in different scientific research fields in the 1950s and 1960s [31]. Although it has been proposed for more than 50 years, it is still one of the most widely used partitioning algorithms [32]. While it does not guarantee accuracy, its simplicity and speed are very attractive in practice [33]. It can meet the need of fast locking demand center well in this study.
K-means clustering analysis principle. A set of dimension data points , including , is clustered into their recent center distance vector data, and the objective function value decreased.
Determining the clustering center is helpful to reduce the objective function value, because:
where the necessary and sufficient conditions for the equality to be true are:
K-means steps of cluster analysis. K-means clustering analysis algorithm is an iterative process, and the ultimate goal is to make all cases in the clustering domain reach the number of clustering. The square of the heart distance and are the smallest steps [34].
Step 1. Randomly select values as the initial clustering center in the dataset ;
Step 2. Calculate the Euclidean distance between each sample point and each cluster center in the dataset, and obtain the category number:
Step 3. Recalculate the clustering center:
Step 4. Repeat steps 2 and 3, until the maximum number of iterations stops.
The data-processing process using K-means cluster analysis is shown in Figure 5.
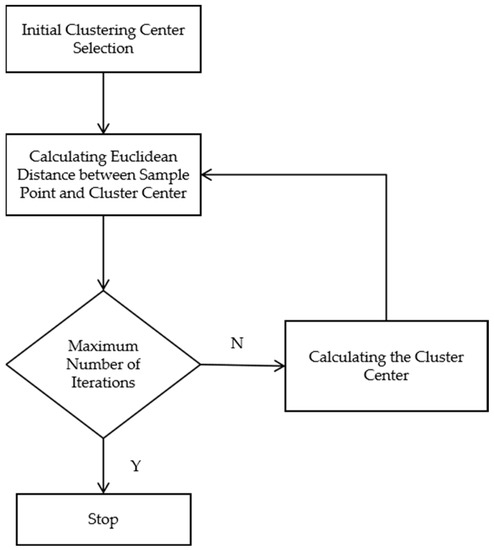
Figure 5.
The process of using K-means cluster analysis.
4.3. Immune Optimization Model
Immune optimization model is a type of intelligent search algorithm inspired by the biological immune system, which has the function of generating and monitoring. The immune optimization model is optimized using a genetic algorithm as the calculation template and referring to the operating rules of biological immune system [35,36]. In contrast, the algorithm has a good biometric recognition process and memory function of global search ability [37]. The main calculation process of the algorithm is shown in Figure 6.
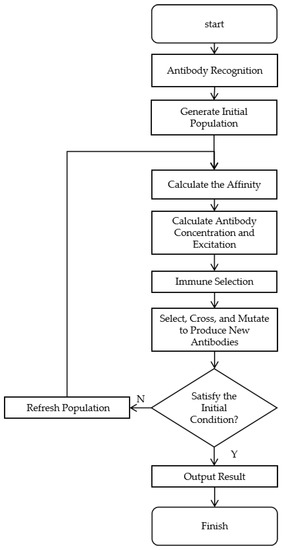
Figure 6.
The flowchart of immune optimization algorithm.
5. Model
5.1. Model Hypothesis
- (1)
- The size of the taxi stop is large enough to meet the demand point within the range of service radiation;
- (2)
- A demand point can only be served by a taxi station;
- (3)
- The cost of the demand point to the taxi stop is not considered.
5.2. Establishment of Immune Optimization Model
Based on the above hypotheses, in the case where the upper limit of the set distance is satisfied, the taxi stop is found at N demand points and serves other peripheral demand points. The objective function is that the sum of the demand and distance values of each demand point to the stop is the smallest:
where is a collection of points for all requirements; is the set of the selected taxi stations with the distance to demand point less than , , ; is the demand for the demand point; is the distance from the demand point to the closest stop; is a variable of 0 to 1, indicating the distribution of service demand between passengers and taxi stations. When it is 1, the demand of the demand point is provided by the stop ; otherwise ; is a variable from 0 to 1. When it is 1, point is selected as the stop; is the upper limit of the distance between the new stop and the demand point. Equation (6) guarantees that each demand point can only be served by one stop; Equation (7) ensures that the demand for the demand point can only be set as the point supply of the stop; Equation (8) specifies that the number of the selected taxi stations is ; Equation (9) indicates that variables and are 0 to 1; Equation (10) ensures that the demand point is within the service range of the taxi stop.
5.3. Diversity Evaluation of Solutions
Affinity between antigen and antibody. Affinity between an antigen and an antibody indicates the recognition degree of an antibody to an antigen. Affinity function is built for the taxi stop location according to the model.
In this equation, is objective function. The second term in the denominator indicates the penalty when the distance constraint is violated, and is a relatively large positive number.
Affinity between antibodies. The affinity between antibodies indicates the degree of similarity, which can be calculated using the R-bit continuous method proposed by Forrest et al.
where is the same number of bits in antibodies and ; is length of antibodies. Antibody concentration.
where N is the amount of antibodies; , and is a preset threshold value. The size of is selected to be appropriate, and its size is directly linked to the diversity of the solution and the speed of convergence [29], which is 0.5 in this study.
Expected reproductive probability. Expected reproductive probability of an individual is determined by the affinity between antigen and antibody and the antibody concentration .
where is a constant. The higher the individual fitness, the larger the expected reproductive probability. The greater the individual concentration, the lower the expected reproductive probability [30]. The strategy of elite retention not only promotes individuals with higher fitness, but also inhibits individuals with high concentration, thus ensuring individual diversity.
5.4. Immune Optimization Algorithm Steps
Step 1. Problem analysis. The characteristics of the problem and its solution are analyzed, and the appropriate expression of the solution is designed.
Step 2. The initial antibody is produced. antibodies are randomly generated and m antibodies are extracted from the memory to form an initial population, where is the number of individuals in the memory bank.
Step 3. The diversity of antibodies is evaluated. An individual’s evaluation in this algorithm is based on the expected reproductive rate .
Step 4. Form a parent group. The initial group is sorted in descending order of in step 3, and the first is taken as the parent group; the first is placed in the memory.
Step 5. Whether the constraint is met is determined, and the satisfaction ends; otherwise, proceed to the next step.
Step 6. The emergence of new groups. Based on the results of step 4, the antibody population is selected, crossed, and mutated to obtain a new population. The memory individuals are taken out from the memory to form a new generation group.
Step 7. Go to step 3.
6. Results and Discussions
Taking the running track data of taxi in Xiaoshan District of Hangzhou in the morning rush hour as an example, the reasonable layout of taxi stations is analyzed. Firstly, using SQL query statement, taking the period 7:30–8:30 as search conditions, the GPS data of the coarse car in the morning peak period is separated. Then, using the JAVA programming statement, extract the longitude and latitude information of taxi passenger pick-up and drop-off location. A total of 79,132 pieces of initial data were obtained. For the convenience of research, the expression of location spatial data in the original data is retained, and the spatial information is described by latitude and longitude.
After obtaining the spatial data of taxi passengers’ getting on and off, K-means clustering analysis method is used to conduct data analysis on the spatial data, so as to form a parking demand district, which is convenient to conduct reasonable site selection and set up taxi stations according to the demand distribution in the later stage in order to make effective use of resources and give full play to the maximum value of resources.
When performing cluster analysis, the initial cluster number was specified as 31. The initial clustering results are shown in Table 2, and the corresponding ANOVA error analysis was shown in Table 3.
Table 2.
Initial results of K-means cluster analysis.
Table 3.
ANOVA error analysis.
The error analysis shows that sign is 0 and less than 0.05, indicating that for the null hypothesis in which each group has the same mean value, the null hypothesis is rejected at the significance level of 0.05. The two groups are not equal and differ significantly, and the classification is valid.
According to the result of clustering analysis, it can be learned that 31 parking demand districts can be divided into 31 clustering centers according to the spatial data of disembarking and disembarking locations. The 31 clustering centers are possible sites for arranging taxi stations. Considering the reasonable allocation of urban resources and the service radius of taxi stations, taxi stations are set in all 31 clustering centers, which will result in an overlapping service scope and waste of resources. In addition, too many stops will induce a frequent parking behavior of taxis, leading to urban traffic block and further aggravating energy consumption of urban traffic, which is contrary to the concept of sustainable development. Therefore, it is necessary to further screen and analyze the clustering center and optimize the site selection, so as to promote the reasonable allocation of urban resources and maximize the utilization of resources.
Based on the results of cluster analysis, the immune optimization model was used to further optimize the location of taxi station. The algorithm was programmed using MATLAB. After many experiments, the parameters of the immune optimization algorithm were finally determined: population size is 25, the memory library capacity is 10, the number of iterations is 100, the crossover probability is 0.5, the mutation probability is 0.4, the diversity evaluation parameter is 0.95, the number of taxi stations is 10.
After a computer experiment, 31 clusters obtained from K-means clustering analysis were screened to 10. The changes of average fitness and optimal fitness of the population after 100 iterations are shown in Figure 7.
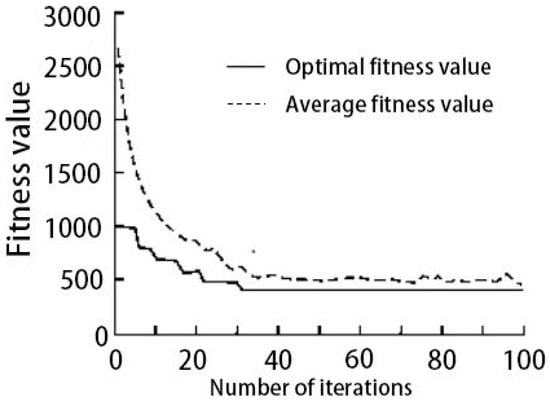
Figure 7.
Immune algorithm convergence curve.
The experimental results are shown below. Table 4 lists the longitude and latitude coordinates of 10 taxi stations and the demand for parking around them.
Table 4.
K-means cluster analysis results.
Figure 8 clearly shows the spatial distribution of the 10 taxi stations and demand generation points.
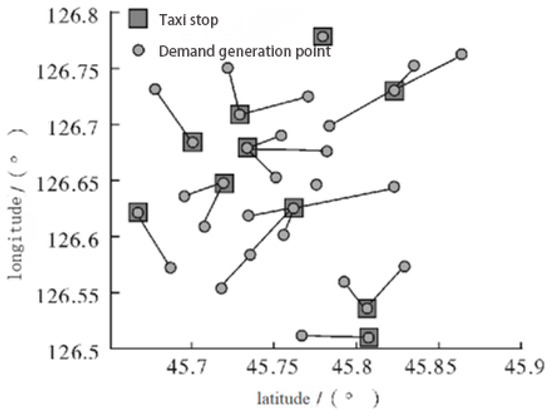
Figure 8.
Taxi stop location map.
From Table 4, we can clearly see the spatial location information of the final taxi station selection and the parking demand around the corresponding station. By comparing the final layout and location of taxi stations with the initial results of cluster analysis, it can be found that, based on the cluster analysis, the immune optimization model selects the location with relatively large parking demand as the taxi station location.
From the perspective of spatial distribution, the layout scheme optimized using the immune model can not only give priority to the areas with large parking demand for urban taxis, but also essentially cover the taxi-parking demand within the study area completely through the diffusion of taxi stations’ own service capacity. The scheme can realize the rationalization of spatial layout. In terms of the number of layout, compared with the initial value of 31, the layout of 10 taxi stations within the study area can greatly save urban resources and give full play to the maximum benefit of taxi stations, avoiding the phenomenon of idle stations. Therefore, it is reasonable to set 10 taxi stations within the study area.
7. Conclusions and Implications
7.1. Conclusions
Reasonable arrangement of taxi stations is one of the important measures to maintain the sustainable development of the taxi industry. A reasonable station layout can promote the efficient allocation of urban resources and avoid resource waste. Therefore, based on the huge urban taxi GPS positioning data and vector map, this paper discusses the spatial distribution of urban taxi-parking demand and puts forward suggestions on the layout of taxi stations. The main conclusions of this study are as follows.
- (1)
- After K-means cluster analysis and repeated iterative calculation of immune optimization model, the spatial data of parking demand distribution was analyzed, and 10 cluster center nodes were finally determined as site selection. The most capable stations can cover nearly 13,000 taxi stops around the area.
- (2)
- Ten taxi stations directly cover 83% of the area’s parking demands. The rest of the parking needs are relatively sporadic and can be borrowed from nearby stations.
- (3)
- Passengers are one of the main factors affecting site selection. In the process of research calculation, it can be found that the spatial distribution of the location of passengers differs. In addition, the service capacity of the taxi station has a certain degree of influence on the rationality of the layout.
- (4)
- The demand of clustering centers varies greatly within a certain range. Taxi stations should be placed in places with the greatest demand, and then radiated to clustering areas with small surrounding distances. Only in this way can taxi stations play a maximum role and reduce the waste of land resources caused by excessive planning, which is consistent with the concept of sustainable urban development.
7.2. Implications
The results of the analysis of taxi GPS data during the morning rush hour in Xiaoshan District of Hangzhou also further confirmed that the method is actually effective, and the research results provided some enlightenment for the government management and taxi operation departments.
- (1)
- First, the city should pay attention to the reasonable parking demand of taxis and other operating vehicles when conducting on-road parking management, so as to avoid the related management system impeding the healthy development of the industry.
- (2)
- Moreover, the rapid rise of the online car-hailing industry has put forward higher requirements for the rationalization of the layout of urban taxi stations. In future research, it is necessary to include the demand of online car booking into the research scope so that the research is closer to the reality.
- (3)
- In addition, taxi operation data can be fully utilized when calculating the layout data and location of the station in order to make the calculation more accurate and promote the effective utilization of urban resources. The collaboration between urban operating enterprises and management will enhance the sustainability of urban development.
- (4)
- Last but not least, the research results can be combined with the application program in the terminal to better guide the spatial distribution of taxi stops. While improving the service efficiency, it can also integrate the situation of the road network, give full play to the utility of resources, reduce the impact on road network traffic, and promote the green development of urban transportation.
Author Contributions
Methodology, W.L., A.T., O.A. and Y.T.; data curation, J.Z. and Q.W.; resources, P.K.S.; writing—original draft preparation, C.Z., O.A. and A.T.; writing—review and editing, W.L. and C.Z. All authors have read and agreed to the published version of the manuscript.
Funding
This study was sponsored by the National Natural Science Foundation of China (Grant No: 52002244). This work was funded by the Researchers Supporting Project Number (RSPD2023R681), King Saud University, Riyadh, Saudi Arabia.
Informed Consent Statement
Informed consent was obtained from all subjects involved in the study.
Data Availability Statement
Not applicable.
Conflicts of Interest
The authors declare no conflict of interest.
References
- Pan, Z.X. The influence and strategy of taxi traffic on urban traffic Science and Technology. Innov. Her. 2008, 21, 167. [Google Scholar]
- Chen, Y.G. Tap the potential of the road to reduce the impact of some buses and rental vehicles on the road traffic in the downtown area. J. Shanghai Public Secur. Coll. 2003, 3, 13–17. [Google Scholar]
- Jin, L. Study on Taxi Station Locating and Optimization with Travel Demand. Master’s Thesis, Harbin Institute of Technology, Harbin, China, 2014. [Google Scholar]
- McGowen, P.; McNally, M. Evaluating the potential to predict activity types from GPS and GIS data. In Proceedings of the Transportation Research Board 86th Annual Meeting, Washington, DC, USA, January 2007. [Google Scholar]
- Liu, L.; Andris, C.; Ratti, C. Uncovering cabdrivers’ behavior patterns from their digital traces. Comput. Environ. Urban Syst. 2010, 34, 541–548. [Google Scholar] [CrossRef]
- Schönfelder, S.; Axhausen, K.W.; Antille, N.; Bierlaire, M. Exploring the potentials of automatically collected GPS data for travel behaviour analysis: A Swedish data source. Arb. Verk.-Und Raumplan. 2002, 124, 1–27. [Google Scholar]
- Ganti, R.; Mohomed, I.; Raghavendra, R.; Ranganathan, A. Analysis of data from a taxi cab participatory sensor network. In International Conference on Mobile and Ubiquitous Systems: Computing, Networking, and Services; Springer: Berlin/Heidelberg, Germany, 2011. [Google Scholar]
- Lin, M.; Hsu, W.J. Mining GPS data for mobility patterns: A survey. Pervasive Mob. Comput. 2014, 12, 1–16. [Google Scholar] [CrossRef]
- Lee, J.; Shin, I.; Park, G.L. Analysis of the passenger pick-up pattern for taxi location recommendation. In Proceedings of the Fourth International Conference on Networked Computing and Advanced Information Management, Gyeongju, Republic of Korea, 2–4 September 2008. [Google Scholar]
- Ocalir, E.V.; Ercoskun, O.Y.; Tur, R. An integrated model of GIS and fuzzy logic (FMOTS) for location decisions of taxicab stands. Expert Syst. Appl. 2010, 37, 4892–4901. [Google Scholar] [CrossRef]
- Cao, D.; Zeng, K.; Wang, J.; Sharma, P.K.; Ma, X.; Liu, Y.; Zhou, S. BERT-Based Deep Spatial-Temporal Network for Taxi Demand Prediction. IEEE Trans. Intell. Transp. Syst. 2022, 23, 9442–9454. [Google Scholar] [CrossRef]
- Cooper, J.; Farrell, S.; Simpson, P. Identifying demand and optimal location for taxi ranks in a liberalized market. In Proceedings of the Transportation Research Board Meeting, Washington, DC, USA, 10–14 January 2010. [Google Scholar]
- Costa, D.D.; Neufville, R.D. Designing Efficient Taxi Pickup Operations at Airports. Transp. Res. Rec. J. Transp. Res. Board 2012, 2300, 91–99. [Google Scholar] [CrossRef]
- Wang, Y. Exploring the characteristic of urban taxi travel based on trajectory data. Master’s Thesis, Wuhan University, Wuhan, China, 2017. [Google Scholar]
- Wang, X.; Qu, Z.W.; Song, X.M.; Zhang, M.Y. Bi-objective location optimization model for taxi stands in urban hotspots. J. Harbin Inst. Technol. 2020, 52, 106–112. [Google Scholar]
- Tian, D. Taxi station planning and vehicle scheduling method based on OD data. Master’s Thesis, Hebei Normal University, Shijiazhuang, China, 2022. [Google Scholar]
- Tong, K.X. Study on the analysis of residents’ travel based on taxi trajectory data. Master’s Thesis, Shijiazhuang University, Shijiazhuang, China, 2020. [Google Scholar]
- Ye, Z.; He, M.G.; Liang, K.K. Quantitative analysis of coordination between taxi service station layout and urban form. J. Wuhan Univ. Technol. (Transp. Sci. Eng.) 2018, 42, 216–220+225. [Google Scholar]
- Ma, R.Q.; Shen, D.Y. Beijing taxi station status survey and optimization recommendations. Highw. Traffic Technol. Appl. Technol. Ed. 2014, 4, 294–296. [Google Scholar]
- Niu, Y.C. Study on the layout of taxi stops. Transp. World 2012, 10, 130–133. [Google Scholar]
- Wu, J.R.; Li, M.; Liang, L.J. Comprehensive Passenger Transportation Hub Taxi Pick-up Point Management Mode and Efficiency Analysis. Traffic Inf. Secur. 2012, 4, 18–23. [Google Scholar]
- Ye, H.F. Research on the prediction model of taxi stop scale based on land use. J. Wuhan Univ. Technol. (Transp. Sci. Eng.) 2013, 37, 1106–1109. [Google Scholar]
- Zhang, X.H.; Zhao, L.; Qi, K.F. Research on Setting Method of Urban Taxi Waiting Station. Transp. Transp. 2010, 7, 16–18. [Google Scholar]
- Şener, Ş.; Şener, E.; Nas, B.; Karagüzel, R. Combining AHP with GIS for landfill site selection: A case study in the Lake Beyehir- catchment area (Konya, Turkey). Waste Manag. 2010, 30, 2037–2046. [Google Scholar] [CrossRef]
- Anane, M.; Bouziri, L.; Limam, A.; Jellali, S. Ranking suitable sites for irrigation with reclaimed water in the Nabeul-Hammamet region (Tunisia) using GIS and AHP-multicriteria decision analysis. Resour. Conserv. Recycl. 2012, 65, 36–46. [Google Scholar] [CrossRef]
- Akıncı, H.; Özalp, A.Y.; Turgut, B. Agricultural land use suitability analysis using GIS and AHP technique. Comput. Electron. Agric. 2013, 97, 71–82. [Google Scholar] [CrossRef]
- Wang, J.; Han, H.; Li, H.; He, S.; Kumar Sharma, P.; Chen, L. Multiple Strategies Differential Privacy on Sparse Tensor Factorization for Network Traffic Analysis in 5G. IEEE Trans. Ind. Inform. 2022, 18, 1939–1948. [Google Scholar] [CrossRef]
- Sun, G.Z. Taxi travel demand forecasting in pick-up hotspots areas based on GPS Trajectory data. Master’s Thesis, Beijing Jiaotong University, Beijing, China, 2019. [Google Scholar]
- Su, C.H.; Zhu, X.F.; Mao, Z.Y. A class of Immune Optimization Algorithms and Applications. J. Southwest Jiaotong Univ. 2002, 37, 677–680. [Google Scholar]
- Yang, W.; Jiao, L.C.; Gong, M.G. Cloning selection algorithm for solving preference multi-objective optimization. J. Softw. 2010, 21, 14–33. [Google Scholar] [CrossRef]
- Macqueen, J. Some methods for classification and analysis of multivariate observations. Berkeley Symp. Math. Statist. Prob. 1967, 1967, 281–297. [Google Scholar]
- Anil, K.J. Data clustering: 50 years beyond K-Means. Pattern Recognit. Lett. 2010, 31, 651–666. [Google Scholar]
- Arthur, D.; Vassilvitskii, S. K-Means++: The Advantages of Careful Seeding. In Proceedings of the Eighteenth Annual ACM-SIAM Symposium on Discrete Algorithms, SODA 2007, New Orleans, LA, USA, 7–9 January 2007. [Google Scholar]
- Likas, A.; Vlassis, M.; Verbeek, J. The Global K-means Clustering Algorithm. Pattern Recognit. 2003, 36, 451–461. [Google Scholar] [CrossRef]
- Yang, Q.; Liu, X.X. Unconventional emergency risk identification model based on the immune system. J. Manag. Sci. China 2015, 18, 49–61. [Google Scholar]
- Pan, H. Logistics distribution center location based on model optimization and immune optimization algorithm. Electron. Des. Eng. 2019, 27, 78–81+86. [Google Scholar]
- Xiao, R.B. Artificial immune system: Principle, models, analysis and perspectives. Chin. J. Comp. 2002, 25, 1281–2129. [Google Scholar]
Disclaimer/Publisher’s Note: The statements, opinions and data contained in all publications are solely those of the individual author(s) and contributor(s) and not of MDPI and/or the editor(s). MDPI and/or the editor(s) disclaim responsibility for any injury to people or property resulting from any ideas, methods, instructions or products referred to in the content. |
© 2023 by the authors. Licensee MDPI, Basel, Switzerland. This article is an open access article distributed under the terms and conditions of the Creative Commons Attribution (CC BY) license (https://creativecommons.org/licenses/by/4.0/).