Abstract
In recent years, the performance of the construction industry has highlighted the increased need for better resource efficiency, improved productivity, less waste, and increased value through sustainable construction practices. The core concept of sustainable construction is to maximize value and minimize harm by achieving a balance between social, economic, technical, and environmental aspects, commonly known as the pillars of sustainability. The decision regarding which structural material to select for any construction project is traditionally made based on technical and economic considerations with little or no attention paid to social and environmental aspects. Furthermore, the majority of the available literature on the subject considered three sustainability pillars (i.e., environmental, social, and economic), ignoring the influence of technical aspects for overall sustainability assessment. Industry experts have also noted an unfulfilled need for a multi-criteria decision-making (MCDM) technique that can integrate all stakeholders’ (project owner, designer, and constructor) opinions into the selection process. Hence, this research developed a decision support system (DSS) involving MCDM techniques to aid in selecting the most sustainable structural material, considering the four pillars of sustainability in the integrated project delivery (IPD) framework. A hybrid MCDM method combining AHP, TOPSIS, and VIKOR in a fuzzy environment was used to develop the DSS. A hypothetical eight-story building was considered for a case study to validate the developed DSS. The result shows that user preferences highly govern the final ranking of the alternative options of structural materials. Timber was chosen as the most sustainable option once the stakeholders assigned balanced importance to all factors of sustainable construction practices. The developed DSS was designed to be generic, can be used by any group of industry practitioners, and is expected to enhance objectivity and consistency of the decision-making process as a step towards achieving sustainable construction.
1. Introduction
Over time, the construction industry’s development has been constantly questioned due to issues such as low productivity, high energy consumption, the generation of waste, and greenhouse gas emission. Buildings and their associated construction industries account for 36% of global energy use and 37% of energy-related carbon dioxide (CO2) and greenhouse gas emissions [1]. The Construction User’s Roundtable (2022) reported that the productivity of construction works has significantly reduced in the last 50 years compared to other sectors [2]. Another report showed that construction-related spending accounted for 13% of the world’s GDP, but its annual productivity growth increased by 1% over the past 20 years. It also presented that $1.6 trillion of additional value could be created through higher productivity, meeting half the world’s infrastructure needs [2]. During the ‘UN Climate Change Conference’, UK, 2021, all 26 of the participating nations of the COP (conference of the parties) collectively agreed to work to reduce greenhouse gas emissions to limit the rise of the global average temperature to 1.5 degrees Celsius [3]. Therefore, the construction industry desperately needs better resource efficiency, improved productivity, less waste, and increased value.
Sustainable construction aims to achieve ‘maximum value with minimum harm,’ ensuring the balance between economic, social, and environmental factors in a project, commonly known as the pillars of sustainability [4,5,6]. These pillars of sustainability were introduced by the World Summit on Social Development of the United Nations held in 2005 [7]. Sustainable construction is a holistic process that promotes harmony between nature, humanity, and the built environment by creating settlements that suit humans and support economic equality [8]. It applies sustainable development principles to a building life cycle from planning the construction and mining and preparing the raw materials to production, creating construction materials, usage, the destruction of construction, and the management of waste [8].
Structural elements of a building generally consist of beams, columns, tension members, and their connections [9]. The selection of the structural material in the case of building construction plays a vital role as it acts as the backbone of the structure and demands vast resources. In general, concrete, timber, steel, masonry, composite (timber–steel, timber–concrete, steel–concrete), etc., are used to construct multistory buildings. Reinforced concrete (RC) is the most commonly used structural material for building construction. However, ironically, concrete is one of the leading sources of environmental degradation and is harmful to the ecosystem and environment [10]. Structural steel (SS) may be used to replace concrete due to its numerous advantages, including strength and flexibility. Nevertheless, it requires a significant amount of energy during manufacturing and may be expensive in some situations [11]. Masonry is a time-tested alternative to concrete construction. However, burned bricks may emit significant levels of carbon during the manufacturing process, and masonry construction requires a substantial amount of cement [12]. As a building material, timber has a better energy-saving and carbon-reduction performance than other traditional materials. However, a lack of design standards and fire-resistance issues are commonly highlighted as impediments, inhibiting timber use as a structural material for multistory buildings, unlike masonry, concrete, or steel [13]. This phenomenon has led to a rethink regarding alternative building construction materials to achieve sustainability.
Making a sustainable decision is always critical as it combines several technical, social, economic, and environmental factors. From the literature review, it was identified that several studies have been carried out on the selection of building materials, sustainability indicators of materials, etc. The findings showed that construction industries select structural materials by considering the technical and economic aspects, and there was a lack of any sustainable decision-making system. Most of the previous research in this area either focused on technical or economic aspects only or considered three pillars of sustainable construction. From interviews with several industry experts, it was also identified that the decision regarding the selection of structural materials commonly considers technical and economic factors. There is no structured tool to integrate all stakeholders’ opinions or assess the overall aspects of sustainable construction in the selection process.
In particular, the objective of this research was to develop a decision support system that would integrate all stakeholders’ preferences into an IPD framework for selecting the most sustainable structural material from technical, economic, social, and environmental sustainability points of view. The activities associated with the fulfilment of the research objectives include the identification of structural materials used for multistory building construction through the literature review, industry practices, and expert opinion; sustainability analysis (technical, economic, social, and environmental aspects) of the structural materials in use with the help of the tools available (LCC, LCCA, etc.) and expert opinion; review of the selection process for structural materials from the perspective of sustainable construction practices; several interview sessions with industry experts, project owners, design teams, and constructors, conducted in addition to the literature review, to determine the details of existing practices; the development of sub-criteria for all of the pillars of sustainable construction, primarily through the literature review, and then validating and finalizing them with feedback from industry and academic experts; and development of the DSS using MCDM techniques to aid the selection of the most sustainable structural material for multistory building construction.
The remarkable contributions of this research comprise the integration of technical aspects with the commonly used three pillars (economic, social, and environmental) for sustainability assessment, including a case study; the application of two different MCDM methods (Fuzzy TOPSIS and Fuzzy VIKOR) to rank alternatives with Shannon’s entropy to handle qualitative and quantitative data, and trapezoidal membership functions to obtain more realistic results; and the development of a DSS application that shall assist decision makers in choosing evaluation criteria and assigning relative importance to those criteria in the combination of qualitative and quantitative methods in an IPD framework, not only to select the most sustainable structural material but also to solve a wide range of construction-related problems.
The rest of the paper is organized as follows: Section 2 provides a comprehensive picture of past research. Section 3 explains the data collection and analysis process used in this study. Section 4 presents a case study to validate the theoretical model. Section 5 discusses the details of the DSS desktop application software. Section 6 explains the sensitivity analysis to verify the appropriateness of model output. Section 7 and Section 8 present the discussions and conclusions to describe the usefulness and benefits of the study.
2. Related Literature and Past Research
A literature review of the proposed methodologies (structural materials commonly used for multistory building construction, multi-criteria decision-making, life cycle assessment and life cycle cost analysis, integrated project delivery, application of MCDM in construction, and the methods chosen for this research) have been discussed in this section to highlight their relevance in the construction literature. A brief discussion on the research gap was included to present the contributions of this research.
2.1. Structural Materials Commonly Used for Multistory Building Construction
The commonly used structural materials in building construction practices are steel, concrete, masonry, and timber [14]. Globally, concrete is the most utilized substance after water [15]. In terms of volume, twice as much concrete is used worldwide in construction as all other building materials combined, including timber, steel, aluminum, and plastic [14]. Approximately three tons of concrete are used per capita each year, globally, making it the most widely used material in construction [16]. Concrete manufacturing emits 2.8 billion tons of CO2 (carbon dioxide), accounting for 4–8% of global greenhouse gas emissions [10]. The construction of buildings accounts for over one-quarter of steel production each year. Approximately 1500 million tons of steel are produced annually, accounting for 9% of the world’s CO2 emissions from energy and processes [17]. Steel demand is expected to quadruple in the next 37 years [17]. Masonry is one of the preferred construction materials for low-to-medium-rise buildings due to its availability, cost-effectiveness, durability, and excellent weather resistance [18]. It also provides excellent thermal and sound insulation for the structures compared to other construction materials [19]. However, masonry has a low tensile strength and ductility (compared with concrete). Alternative construction systems such as reinforced masonry (RM), confined masonry (CM), post-tensioned masonry, and thin-layer mortared masonry have been introduced in the past to overcome these limitations [20]. Timber is considered one of the most eco-friendly building materials available and has been used as a basic construction material for millennia [21]. It is a renewable natural substance that will sequester carbon throughout its life if managed appropriately. Trees release oxygen and absorb CO2 (carbon dioxide) from the atmosphere, resulting in biomass and a reduction in CO2 levels. It is estimated that the average tree absorbs approximately 55 kg of CO2 and gives off 40 kg of oxygen when growing 2 kg of wood [22]. Therefore, during its growth period, a tree positively impacts the environment by reducing GHG [23]. The comparison of selected environmental parameters showed that wooden buildings consume 54% less embodied energy and generate 35% less SO2 (sulfur dioxide)-equivalent emissions (acidification potential). Additionally, the production of CO2 emissions (global warming potential) reaches a negative value; hence, emissions are reduced for wooden constructions versus emissions being increased by 156% in masonry constructions [24]. Timber construction systems have several advantages over steel, masonry, and concrete [25]. Timber has a higher ratio of load-carrying capacity to weight, and its lower weight reduces the soil load by 30 to 50%. However, knowledge regarding timber construction is still lacking, which can create skepticism and preconceptions about the features and costs of timber construction [25].
2.2. Multi-Criteria Decision-Making (MCDM)
Multi-criteria decision-making (MCDM) is fundamentally a systematic approach to solving problems of varying degrees of structure [26]. This strategy has emerged as a vital tool for addressing real-time solutions for problems of uncertainty, particularly for sustainable construction engineering and environmental sustainability [27]. It provides decision makers with an informed recommendation from a finite list of alternatives (also known as actions, objects, solutions, or candidates), while being evaluated from multiple viewpoints, called criteria (also known as attributes, features, or objectives) [28]. The MCDM technique generates alternative scenarios, establishes criteria, assesses alternatives, weighs the criteria, and ranks the alternatives [29]. Subjective (qualitative) methods and objective (quantitative) methods are the two types of weighing techniques. The subjective methods determine weights according to the preference or judgments of decision makers. On the other hand, objective techniques, such as the entropy method, multiple objective programming, etc., determine weights by solving mathematical models without considering the decision maker’s preferences [30]. MCDM methods range from a single approach (such as the analytic hierarchy process and fuzzy sets) to a combination of the methods, also known as the hybrid approach [31].
2.3. Life Cycle Assessment (LCA) and Life Cycle Cost Analysis (LCCA)
The term ‘life cycle assessment’ (LCA) refers to a broad technique for quantitatively evaluating a product’s material, energy inputs and outputs, and environmental impacts over its entire life cycle [32]. It considers all building stages’ and cradle-to-grave and life cycle contributions from manufacturing, construction, operation, maintenance, disposal, and end-of-life [33,34,35,36]. In the case of building construction, these different stages include the raw material extraction for the various assembly components of the building (i.e., limestone mining and calcination for cement), the manufacturing, transport to site, construction and installation, the building’s operational life, maintenance, and retrofitting, and at the end of its life, its demolition [37].
Life cycle cost analysis (LCCA) is a tool that helps the owner and stakeholders determine the most cost-effective solution [38]. Life cycle costing has been used in many studies to assist decision-making in building construction [39]. LCCA considers all costs associated with the life cycle building stages, including initial costs, operating costs, maintenance costs, and end-of-life costs, as well as any residual value (removal, resale, and salvage value) throughout the life period [39,40]. It performs economic assessments by comparing the relative cost-effectiveness of various building construction methods. The aim of LCCA on buildings is to estimate costs throughout their whole life cycle, which may then be utilized as input into a decision-making or evaluation process [41].
2.4. Integrated Project Delivery (IPD)
Integrated project delivery (IPD) is a relatively new project delivery method. IPD aims to improve efficiency and reduce risks and waste through the early involvement of stakeholders and a collaborative construction process [42]. In this method, all project stakeholders are involved from the beginning to align their goals and incentives through shared risk and rewards, which ultimately leads to the increased efficiency of this PDM. In IPD, all parties, including the owner, the designer, and the contractor, are bound together through a joint agreement [42]. Compared to other traditional project delivery methods, IPD contributes more towards sustainability by integrating all stakeholders from the initial stage of the project [43]. In the case of conventional PDMs, contractors and manufacturers are involved in the project after the project’s design phase. Thereby, traditional construction processes tend to incur more costs from rework resulting from miscoordination, quality issues, the inefficiency of project delivery times, poor performance, and client dissatisfaction with the product delivered [44].
2.5. Application of MCDM in Construction
Zhu et al. (2021) studied a total of 530 civil engineering construction articles published from 2000 to 2019 and analyzed the application of MCDM in construction [45]. They reported the use of 29 single methods and 94 hybrid methods. Among the single methods, the AHP (analytic hierarchy process), fuzzy theory, generic algorithm, data envelopment analysis, and analytical neural process were the top five. At the same time, fuzzy AHP, fuzzy TOPSIS (technique for order performance by similarity to an ideal solution), AHP–fuzzy TOPSIS, fuzzy ANP (analytic network process), ANP–DEMATEL (decision-making trial and evaluation laboratory), and fuzzy DEMATEL were the top hybrid methods used in construction. The two largest hybrid categories were hybrid methods that included fuzzy logic (used in 159 articles; 30.00 percent) and hybrid methods that included AHP (used in 104 papers; 19.62 percent) [45]. The search result in the ‘Scopus’ database with the keywords ‘mcdm’ and ‘construction’ for 2020–2022 showed that an additional 174 journal articles were published that comprised the use of both single and hybrid methods of MCDM. The fuzzy theory was used in 43 papers, out of which 9 papers utilized a single method and the other 34 used fuzzy theory in combination with TOPSIS, ANP, AHP, PROMETHEE (preference ranking organization method for enrichment evaluation), VIKOR (visekriterijumska optimizacija I kompromisno resenje), etc. AHP alone was used in five papers, and in combination with other methods, it was used in a further four articles. TOPSIS was also used in nine articles: Twice as a single method and in the remaining seven cases as a hybrid.
After a systematic literature review, Marcher et al. (2020) concluded an increasing interest of stakeholders toward the adoption of DSS for solving decision problems in the field of sustainable management and automation in construction [46]. Minhas and Potdar (2020) reported the increasing trend in the fusion of the MCDM in the construction industry and mentioned that AHP and fuzzy and quantitative decision models made up the major combinations [47]. Hashemi et al. (2021) utilized economic, social, and environmental pillars to select sustainability indicators for conducting sustainability assessments for highway construction projects. They used a novel triangular intuitionistic fuzzy decision-making approach for scoring and ranking the indicators [48]. Bektur (2021) used a hybrid fuzzy MCDM approach for a sustainable project portfolio selection problem. In addition to the economic factors, the author integrated social and environmental factors into the decision process. The evaluation criteria were primarily selected by the literature review and then finalized by the decision-making team’s opinion [49]. Marovic et al. (2021) applied AHP and PROMETHEE to selecting the optimal contractor. They chose selection criteria through an extensive literature review and used two groups of experts in collective decision-making [50]. Zhang et al. (2022) used DEMATAL–ANP to identify and analyze risk factors in green product certification. They used ANP for calculating the weight and DEMATAL to analyze causal relationships among the risk factors [51]. Lu and Wudhikarn (2022) used the MCDM method to develop an integrated model to identify intellectual capital performance indicators. In that study, the intangible key performance indicators were primarily selected by using the literature review and survey, and they were further validated using in-depth interviews with expert respondents [52]. Zoghi et al. (2022) applied fuzzy AHP and TOPSIS to select building materials in their study. In addition to economic and environmental criteria, they included deconstruction-related factors of materials to ensure environmentally friendly demolition of the buildings [53].
From the literature review, it was identified that numerous studies have been carried out on the selection of building materials, sustainability indicators of materials, sustainability analysis of green buildings, etc. However, none of these studies integrated the inputs of all stakeholders, i.e., owner, design team, and constructors, in the IPD framework from the project’s inception, in order to decide on the most preferred sustainable option. However, although several researchers argued that the technical pillar is an essential analytic element of sustainability assessment for civil infrastructure, there were hardly any studies that systematically integrated the technical pillar with economic, social, and environmental pillars to analyze the overall sustainability aspects. This research developed an MCDM model that will integrate all stakeholders’ preferences into an IPD framework to select the most sustainable structural material from technical, economic, social, and environmental sustainability points of view. Academia shall benefit from integrating technical aspects with the commonly used three pillars in a methodical approach. The industry shall benefit from the MCDM model, which will help to select the most sustainable alternative.
3. Material and Method
3.1. Sustainability Evaluation Criteria
There can be a variety of sustainability evaluation criteria (i.e., sub-criteria under four main criteria) for assessing the technical, economic, social, and environmental pillars of sustainable construction. From the literature review, it was observed that researchers have used different sets of evaluation criteria based on the type and nature of the construction projects. The selection of sub-criteria was also dependent on the user’s preferences. Therefore, to finalize the list of sub-criteria in selecting the most sustainable structural material, we sought the opinion of several industry experts and academic researchers. A summary of sub-criteria based on overall findings is shown in Table 1. However, this list is not applicable to all cases, and users can modify it according to the location and nature of the projects and the preferences of the stakeholders.

Table 1.
Summary of sustainability evaluation criteria (pertinent to this study).
3.2. MCDM Methods Chosen for This Research
As discussed, AHP and TOPSIS are currently the most widely used MCDM techniques in construction. With the exception of a few cases, these methods were combined with fuzzy theory to eliminate crisp values and introduce vagueness to handle uncertainties, imprecision, or a lack of information. Fuzzy AHP (FAHP) is one of the most powerful and extensively used tools to assign weightage to criteria in MCDM. Therefore, it was used in this research to assign weightage to the sixteen chosen criteria. Though the triangular membership function is most widely used in FAHP for its simplicity, the trapezoidal function is considered to handle uncertainties, imprecision, or a lack of information in a better way. Therefore, the trapezoidal membership function was used in this research. Fuzzy TOPSIS was chosen to rank the alternatives as it is a widely used, familiar, and easy tool for decision-making that has acceptance in both industry and academia. However, a relatively new and less familiar tool, fuzzy VIKOR, was used in parallel to rank the alternatives. Fuzzy VIKOR was used to compare the results with a different technique and validate its reliability. It is expected that a comparison of results through fuzzy TOPSIS and fuzzy VIKOR was likely to enhance the acceptance of fuzzy VIKOR in construction. This study generated a TOPSIS extension that integrated subjective and objective weights. In addition to the subjective weights determined by decision makers, this study derived subjective weights from objective values using Shannon’s entropy as a basis [73,74].
3.3. Research Framework and Hierarchy of the Decision Problem
This study considered four alternative options of structural materials (RC, SS, RM, and timber) and sixteen evaluation criteria, taking four from each pillar of sustainable construction, as mentioned in Table 1. The weightage of criteria was calculated using fuzzy AHP with a trapezoidal membership function. Fuzzy TOPSIS and fuzzy VIKOR were used to rank the alternatives using the weightage obtained through fuzzy AHP. Fuzzy TOPSIS was used to develop the DSS software out of two ranking methods. The details of the research framework are shown in Figure 1 and the hierarchy of the decision problem is shown in Figure 2.
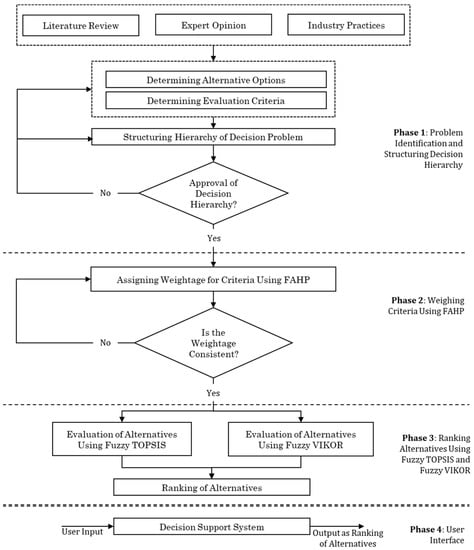
Figure 1.
Research framework.
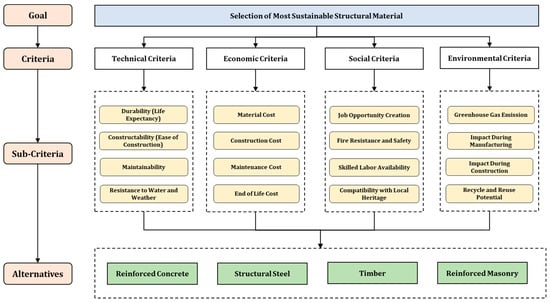
Figure 2.
Hierarchy of decision problem.
The first phase of this research identified the structural materials in use for multistory building construction and reviewed the selection process, followed by the industries from the perspective of sustainable construction practices. An extensive literature review was conducted in the initial stage, and later, a series of interviews and discussion sessions were conducted with industry and academic experts to learn about the selection process, preferences of structural materials, sustainability options considered, etc. In phases two and three, the most appropriate decision-making techniques for solving this problem were selected by studying different research papers. The data for quantitative sub-criteria were obtained through structural analysis, market survey, and the use of the Athena Impact Estimator for the Buildings software. The information for the qualitative sub-criteria was collected from industry and academic experts. They were also requested to assign weightage for each sub-criteria. Next, fuzzy AHP was used to calculate the weightage of all sub-criteria, and fuzzy TOPSIS and fuzzy VIKOR were used to rank the alternatives. The fourth phase of this research developed a decision support computer application to help determine the most sustainable option from several viable alternatives. Finally, the model was validated through a case study and expert opinion.
3.4. LCA and LCCA Calculations
For the life cycle effect evaluation, this study used the Athena Impact Estimator for Buildings, version 5.4. While other LCA tools are available for different parts of the world, the Athena Impact Estimator for Buildings is the only North American tool for whole-building life-cycle assessment based on the globally recognized LCA methodology [75,76]. This application offers a cradle-to-grave LCA of structures, which includes resource extraction, manufacture, construction, related transportation, maintenance, replacement impacts, building operation destruction, and disposal [75]. The LCA technique employed in these investigations was based on ISO 14044 [77].
3.5. Normalizing Objective Values into Subjective Inputs
In addition to the subjective weights determined by the decision makers, this study derived subjective weights from objective values using Shannon’s entropy as a basis [73,74].
Step 1: To determine objective weights using the entropy measure, the decision matrix needs to be normalized for each criterion (Cj, j = 1, 2…n; n = is the criteria number), to obtain the projection value Pij of each:
where m = number of alternatives.
Step 2: After normalizing the decision matrix, we can calculate the Shannon diversity index as
Step 3: Now, the following equation is used to find out the Shannon Equitability Index or the entropy to measure the evenness of the values in particular criteria. The entropy value is denoted as ej:
where m = the total number of alternatives considered in the decision-making process.
Step 4: Now, the degree of divergence can be calculated as dj = 1 − ej. The higher the value of dj, the higher the degree of divergence. Within the matrix, the criteria values containing a higher degree of divergence are considered for the range distribution of subjective values.
3.6. Fuzzy AHP
The AHP is one of the most widely used MCDM tools that can be used to analyze, measure, and synthesize decision problems [67]. There have been numerous applications of the AHP, including selecting among competing alternatives in multi-objective environments, allocating scarce resources, and forecasting [78]. For determining the relative priorities of different selection criteria and sub-categories, Fuzzy AHP uses fuzzy numbers as a pairwise comparison scale. This approach can adequately handle the inherent uncertainty and imprecision of human decision-making processes and offer an appropriate level of flexibility and robustness so that a decision maker can comprehend and understand a decision problem [54]. The steps of the calculations are explained as follows [79,80]:
Step 1: Generate a Comparison Matrix.
Details of pairwise comparison criteria are given in Table 2 and the equation that defines pairwise comparisons is given below:
where i, j = 1, 2, 3,… n.

Table 2.
Pairwise comparison of criteria.
Here, n denotes the number of criteria compared, wi is the weight for criterion i, and aij is the ratio of the weights of criteria i and j.
Step 2: Normalizing the Matrix.
After determining the comparison of its criteria in Table 2, the next thing is to normalize the matrix. This is carried out by dividing each cell by the summation of that column value. Here,
Step 3: Developing Criteria Weightage.
Criteria weightage is the average weightage of each row:
Step 4: Checking for Consistency.
Saaty listed the values in a set to compare the consistency index (CI) with a random generator (RI) value [81]. This value is variable with the matrix order n. The following equation is used to calculate the eigenvector:
Here, is the eigenvector. Now we have to find out the λ (lambda) value:
After obtaining the maximum lambda value, the value of the consistency index (CI) can be determined.
Here, CI is the consistency index and λmaks is the largest eigenvalue of the n-order matrix. It is acceptable to tolerate the inconsistency of each opinion if the CR of a matrix is smaller than 10% (0.1).
Step 5: Fuzzification.
The given weights need to be fuzzified based on Table 3 given below.

Table 3.
Importance index and fuzzy numbers.
Step 6: Fuzzified Normalized Weight and Global Ranking.
Finally, the normalized fuzzy weight is calculated as
Here,
3.7. Ranking of Alternatives with Fuzzy TOPSIS
TOPSIS is widely used for solving ranking problems in real situations [79]. The fundamental concept of TOPSIS is that the chosen alternative should be closest to the positive ideal solution (PIS) and the furthest away from the negative ideal solution (NIS) [82]. TOPSIS defines an index called similarity (or relative closeness) to the PIS and the remoteness from the NIS. Then, the method chooses an alternative that has maximum similarity to the PIS [83]. The classical TOPSIS method uses a precise weighting of the criteria and crisp values for rating the alternatives. Even though it is popular and simple in concept, the classical technique has often been criticized for its inability to adequately deal with the inherent uncertainty and imprecision involved in mapping the decision maker’s perception into crisp values [79]. In order to address the shortcoming of traditional TOPSIS, several fuzzy TOPSIS methods and applications have been developed in recent years that utilize linguistic variables expressed by fuzzy numbers to determine how to evaluate criteria and alternatives [82,84,85].
In this study, we presented a TOPSIS modification that considers both subjective and objective weights. The advantage of the developed approach is that it uses decision makers’ experience and tangible (numerical input) information from end users throughout the decision-making process. The steps of the calculations are explained below [80,86,87].
Step 1: Input Parameter (Preferences) from the Users.
In this step, a matrix is formed comprising the preferences given by the users (Table 4).

Table 4.
User preferences matrix.
Step 2: Set up Trapezoidal Fuzzy Number (TrFN) and Transform the User Input into the Fuzzy Decision Matrix.
In the FAHP scale, the trapezoidal fuzzy number (TrFN) has four boundary values a, b, c, and d: The degree of membership increases between a and b, flattens between b and with a degree of 1 (i.e., values between c and d fully belong to the category), and then decreases between c and d (Figure 3). Each fuzzy set representing the categories described in Table 5 was represented by trapezoidal membership functions (Table 3 and Figure 4).

Figure 3.
Four parameters describing the trapezoidal membership function.

Table 5.
Trapezoidal membership functions.

Figure 4.
Trapezoidal membership functions.
Step 3: Calculation of the Combined Fuzzy Decision Matrix.
After the AHP comparison value is transformed into the FAHP scale value, a combined decision matrix is formed. The process of obtaining a fuzzy combined decision matrix value is shown using the equation of the following formula:
where , , and ,
Step 4: Calculation of the Normalized Fuzzy Decision Matrix Based on Beneficial (Positive) and Cost (Negative) Criteria.
Now we need to identify the benefit (positive) and cost (negative) criteria and compute the fuzzy decision matrix:
Then, the decision matrix is normalized using the following equation:
Step 5: Normalized Fuzzy Decision Matrix Based on a Single User’s Input.
Then, the matrix value is multiplied by the fuzzy normalized weight of each criterion obtained from the fuzzy AHP.
Step 6: Deriving Fuzzy Ideal Solution, Fuzzy Positive Ideal Solution (FPIS), and Fuzzy Negative Ideal Solution (FNIS).
Now, from the matrix, fuzzy ideal solutions are obtained by the following:
Fuzzy Positive Ideal Solution (FPIS):
where
Fuzzy Negative Ideal Solution (FNIS):
where .
Step 7: Distance from FPIS and FNIS.
Now, the distance from each alternative is calculated using the following formula:
where ; a2, b2, c2, d2 = A* for the positive distance and A− for the negative distance.
Step 8: Calculation of Closeness Coefficient.
Now the closeness coefficient (CCi) of each alternative are calculated as
The higher value of CCi gets a higher ranking order.
Step 9: Ranking and Selection of Decisions.
For the number of members (N) in a team, the combined decision is calculated as
where Nimportance = the importance of the Nth member in the team and N = the total number of members.
3.8. Ranking of Alternatives with Fuzzy VIKOR
Opricovic developed the VIKOR method in 1998 for the multi-criteria optimization of complex systems [88]. VIKOR focuses on ranking and sorting a set of alternatives against various or possibly conflicting and non-commensurable decision criteria [89]. Similar to other MCDM methods such as TOPSIS, VIKOR uses an aggregating function to express closeness to the ideal. However, unlike TOPSIS, where the ranking introduces an index considering closeness to the ideal solution, this technique employs linear normalization to eliminate units of criteria functions [90]. In many instances, an extension of VIKOR, such as fuzzy VIKOR, is utilized to generate a fuzzy compromise solution for MCDM cases [91]. The steps of the calculations are explained as follows [89,90,92]:
Step 1: The input parameters are assessed and weighted beneficial (positive) and cost (negative) criteria are chosen.
Step 2: Linguistic terms are converted into the fuzzy Scale, as shown in Table 5 previously.
Step 3: The importance of the decision makers’ judgement is determined, and their weights for each criterion are computed (Table 6).

Table 6.
Importance of decision makers’ judgement matrix.
Step 4: Generation of combined decision matrix of the team.
The process of obtaining a fuzzy combined decision matrix value is shown using the equation of the following formula:
where
Step 5: Now, both the benefit (positive) and cost (negative) criteria are identified, and the normalized fuzzy decision matrix is computed as
Step 6: Defuzzification: The normalized fuzzy decision matrix is normalized as
Step 7: The best element of criteria ( and worst element of criteria are calculated as follows:
For beneficial criteria, and for non-beneficial criteria
Step 8: The value of utility measure (Si), regret measure (Ri), and VIKOR index (Qi) are calculated as
where Si and Ri denote the utility measure and regret measure for the alternatives xi, and Wi is the weight of each criterion. Now, we compute the values of S* = min (Si), S− = max(Si), i = 1, 2, 3…m.
We determine the values of Qi for j = 1, 2, 3…m and rank the alternatives by values of Qj:
where v is the weight for the strategy of maximum group utility and 1 − v is the weight of the individual regret. Usually, v is 0.5, and when v > 0.5, the index of Qj will tend toward majority agreement, and clearly, when v < 0.5, the index of Qi will indicate a majority of negative attitudes. With the smallest number being the best option, the three values, Si, Ri and Qi are ranked from biggest to smallest in ascending order.
4. Case Study
This research used a case study on an eight-story building to validate the theoretical model. A practical example with numerical computation of user, project, and structural data was essential to derive the model’s output in terms of ranking alternatives. The case study also assisted in creating several scenarios to verify the developed system’s consistency and sensitivity. Details of the case study are discussed in the subsequent paragraphs.
4.1. Description of the Case Study
The primary reason for selecting an eight-story building is that all chosen options of structural materials (RC, SS, RM, and timber) remain acceptable alternatives for this height. The Athena Impact Estimator for Buildings has an inbuilt database for Calgary, Canada; therefore, the structure’s location was chosen for ease of LCA and LCCA calculations. Eighty years of building life expectancy were considered according to the guidelines of Infrastructure Canada for five-story or more apartment buildings [93]. Other details of the building are given in Table 7. The architectural view of the building and structural layout with different material options are shown in Figure 5, Figure 6, Figure 7, Figure 8 and Figure 9.

Table 7.
Study parameters as input in the ‘Athena Impact Estimator for Buildings’.
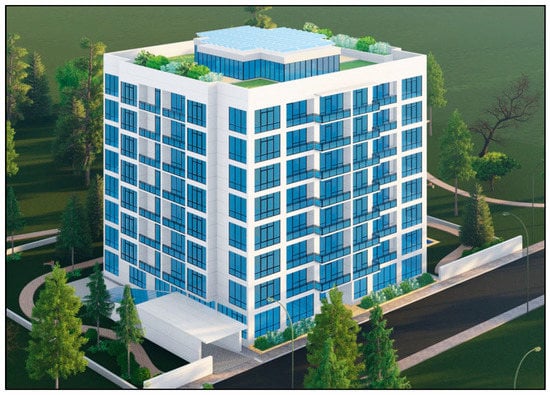
Figure 5.
Architectural view of the eight-story building.
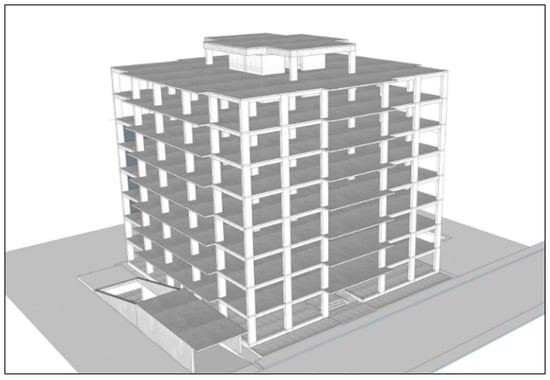
Figure 6.
Building structure using RC.
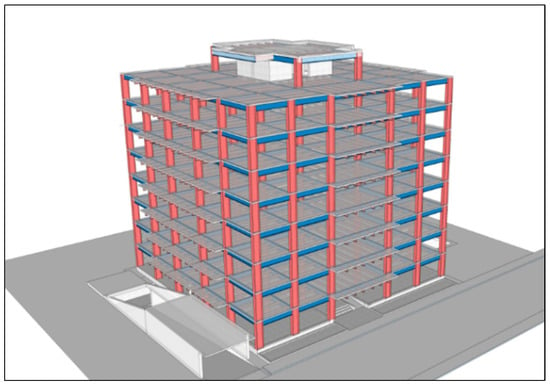
Figure 7.
Building structure using SS.
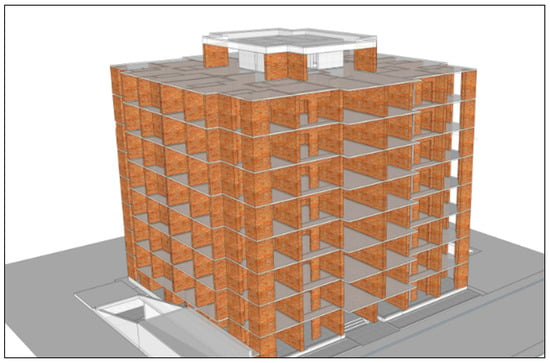
Figure 8.
Building structure using RM.
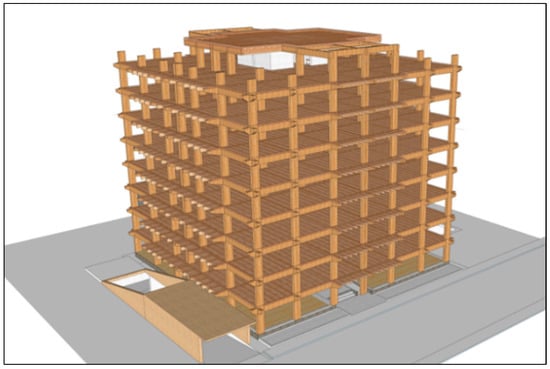
Figure 9.
Building structure using timber.
The data from three teams comprising nine members were used in this case study. Each team had a representative from the owner, constructor, and design teams who were experts in their relevant fields. The members of the study teams were the project owners, prime consultants, chief structural engineers, principal architects, project coordinators, project managers, and academic researchers from some leading Canadian construction companies, such as Clark Builders, Stantec, GEC Architecture, RJC Engineers, Alberta Masonry Council, Chandos Construction, Wood Works, and the University of Alberta. It is important to note that the members of Team 1 and Team 2 were from several leading construction industries, whereas Team 3 was formed from academic researchers and people who were already practicing sustainable construction. Details of the team members are given in Table 8.

Table 8.
Details of the respondents who took part in the case study.
4.2. Calculation of LCA and LCCA
The Athena Impact Estimator for Buildings application was used to determine the quantity of construction materials required to build the model building. The cost criteria were then computed using the Alberta, Canada market rate, and the emission rate was calculated using the environmental analysis module of the same application. Results are tabulated in Table 9.

Table 9.
The calculated cost of materials and emission rate.
4.3. Normalizing of the Quantitative User Input to Qualitative Value
Step 1: The inputs of Table 9 were normalized by dividing each cell value by the sum value of each column (total criteria values for all alternatives). The obtained normalized decision matrix is shown in Table 10.

Table 10.
Converted to a Normalized Matrix.
Step 2: The Shannon diversity index measures the diversity of range values for any criterion among the alternatives. The results are shown in Table 11, with the lowest greenhouse gas emission value (kg CO2 equivalent/sqm) factoring in at 1.28.

Table 11.
Shannon Diversity and Equitability Index.
Step 3: Shannon’s equitability index (Table 11) represented the value of Shannon’s diversity index divided by the logarithm value of the total number of alternatives considered in the decision-making process. It is also called the entropy value.
Step 4: The degree of divergence was calculated by subtracting the Shannon equitability index from the unit value, as shown in Table 12. These range values were considered to transform all other criteria values of the matrix from objective to subjective values.

Table 12.
Determination of range.
Step 5: Finally, the normalized values for Table 9 inputs were tabulated in Table 13, equalizing with the ranges shown in Table 12.

Table 13.
Output subjective result.
4.4. Calculation of Weightage for Each Criteria Using the Fuzzy AHP
4.4.1. Criteria and Codes
The names of the evaluation criteria and codes for them are listed in Table 14. The subsequent results were generated based on the input of one stakeholder (owner of Team 3) using the formula and procedure described in Section 3.

Table 14.
Evaluation Criteria and Codes.
4.4.2. Calculation of Weightage for Each Criterion
Steps 1 and 2: A pairwise comparison matrix was developed for each user to compute the relative priorities of criteria from the user’s point of view. Each criterion was evaluated with the others on a nine-point scale, as described. Each cell was then divided by the column sum to obtain the normalized value.
Steps 3 and 4: Typically, obtaining an acceptable consistency value was complicated once there were many criteria to be evaluated with each other. The users performed a few trials and errors to achieve consistent values. The sample calculation of the consistency check of one of the users (designer, Team 3) is shown below:
Here, n = 16. CI = = 0.1306.
RI for n = 16 was 1.59.
So, CR = 0.1306/1.59 = 8.25% < 10%, which was an acceptable result.
Steps 5 and 6: The crisp values were fuzzified using the fuzzification table. Fuzzy normalized weights were obtained and ranked in ascending order. Depending on the input in the pairwise comparison matrix, the result of the fuzzified normalized weightage of the criterion varied from user to user. Table 15 shows the fuzzified normalized weight of the criteria used by all the stakeholders in this study.

Table 15.
Summary of the fuzzified normalized criteria weightage of all stakeholders.
4.5. Ranking of Alternatives with Fuzzy TOPSIS
Step 1: Five options were available to the user: “Very High, High, Medium, Low, and Very Low” for twelve subjective criteria. Additionally, a total of four criteria were fixed for a specific location and time and had an objective value. These values were transformed from objective to subjective using the Shannon entropy method, which is shown in Table 13. Finally, normalized user inputs for all evaluation criteria are shown in Table 16.

Table 16.
User input after converting objective values into subjective inputs.
Steps 2 and 3: The user input table was then transformed into a fuzzy decision matrix using the trapezoidal membership function described in Section 3. The combined decision matrix was the combination of three stakeholders’ fuzzy input values of the same team.
Steps 4 and 5: The normalized fuzzy decision matrix was calculated based on the criterion category, whether it was a beneficial or a cost criterion. For beneficial criteria, the membership function was divided by the maximum value of the sets; for the cost criteria, it was reciprocal of the values divided by the minimum values of the set. The weighted normalized fuzzy decision matrix was based on the owner’s input and criteria weight derived from the fuzzy AHP.
Steps 6 and 7: Deriving the fuzzy ideal solution; The fuzzy positive ideal solution (FPIS) and fuzzy negative ideal solution (FNIS) were derived from the weighted normalized fuzzy decision matrix. The Euclidian distance of each criterion of any alternative was measured in this step. Distance from the FPIS is shown in Table 17 and distance from FNIS is shown in Table 18.

Table 17.
Distance from the FPIS.

Table 18.
Distance from FNIS.
Step 8: The alternative was ranked based on the value of CCi in descending order as shown in Table 19.

Table 19.
Ranking of one stakeholder (Owner of Team 3).
Step 9: The final combined result (Table 20) of Team 3′s stakeholders was calculated using the weights assigned to each person multiplied by the corresponding CCi. The owner’s viewpoint was given greater priority in this case, with a weighting of 40%, while the opinions of the other two team members received a weighting of 30%.

Table 20.
The combined result of one team (Team 3).
Step 10: The ranking of alternatives was determined similarly for Teams 1 and 2. The overall results of all groups involving fuzzy TOPSIS are displayed in Table 21.

Table 21.
The overall result of all teams (using fuzzy TOPSIS).
4.6. Ranking of Alternatives with Fuzzy VIKOR
Steps 1 and 2: Here, the input parameters of stakeholders were similar to those used in fuzzy TOPSIS.
Steps 3 to 6: The importance and weightage of the stakeholders’ criterion (taken from FAHP) were listed here. The owner’s opinion was given a higher weightage of 40%, while the rest of the team received 30%. Later, the combined decision matrix, normalized fuzzy decision matrix, and de-fuzzified matrix were generated.
Step 7: The best element of criteria ( and worst element of criteria were calculated from the de-fuzzified matrix. was the highest value among all alternatives for a criterion and was the lowest value among all alternatives for the same criterion. The calculated result is shown in Table 22.

Table 22.
Best element and worst element criteria value.
Step 8: Finally, using the formula, the utility measure (Si), regret measure (Ri), and VIKOR index (Qi) values were obtained as shown in Table 23. The alternatives were ranked based on the value of the VIKOR index (Qi). The lower the value of Qi, the closer the solution was to the ideal solution, and the higher the ranking of the alternative.

Table 23.
Utility measure (Si), regret measure (Ri), and VIKOR index (Qi) value.
Step 9: Similarly, Steps 1 to 8 were repeated for the constructor and designer of the team. The combined result of the stakeholders of Team 3 was thus obtained and is shown in Table 24.

Table 24.
Ranking of alternatives for one team (Team 3).
Step 10: Similar analysis was carried out on the user inputs from Teams 1 and 2 to rank the alternatives. All the results are compiled in Table 25.

Table 25.
The overall result of fuzzy VIKOR for different teams.
4.7. Results
Initially, the fuzzified normalized weightage of criteria was calculated using the AHP for the nine responses. A graphical representation of the weightage summary of teams is given in Figure 10. Team 1 assigned a higher weightage for the technical criteria and a lower weightage for the environmental criteria. Criteria weightage of the technical, economic, and social criteria of Team 2 was within a close range; however, they assigned relatively minor importance to the environmental criteria. Team 3, on the other hand, closely distributed the weightage for all, giving the highest emphasis to the environmental criteria. The weightage obtained through these calculations was used in subsequent phases for ranking the alternatives. The result’s acceptance in this method was determined by checking the consistency ratio, which was less than 10% in all cases.
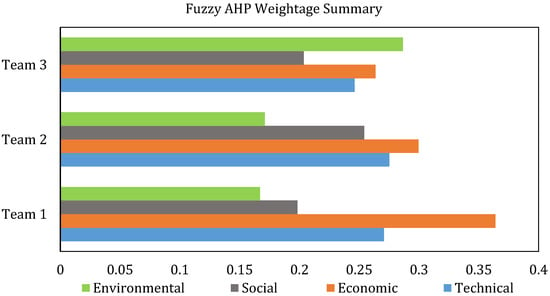
Figure 10.
Summary of the fuzzified normalized weightage of all teams.
The next step of the calculation was ranking alternatives with fuzzy TOPSIS using the criteria weightage calculated by the fuzzy AHP. The result of this method was interpreted from the CC (closeness coefficient): The greater the CC, the higher the ranking. Any team’s weighted CC was calculated considering the importance of the opinion of the owner, constructor, and designer as 40%, 30%, and 30%, respectively, in the group decision-making process. For Team 1, the final weighted CCs for RC, SS, Timber, and RM were 0.5753, 0.5502, 0.3915, and 0.44327, respectively. The ranking of alternatives for that group was as follows: First priority was RC; second priority was SS; third priority was RM; and last priority was timber. The weighted CCs of Team 2 for RC, SS, Timber, and RM were 0.7572, 0.5441, 0.1892, and 0.3884, respectively. RC also became the first choice according to their preferences, followed by SS, RM, and timber. In the case of Team 3, the weighted CCs were 0.3653, 0.4590, 0.6404, and 0.3786 for RC, SS, timber, and RM, respectively. Timber became the first preference for this group, and then the SS, RM, and RC, sequentially. As a whole, RC was the first and timber was the last preference of Teams 1 and 2. In contrast, timber was the first and RC was the last choice in the case of Team 3.
The same sets of data were then calculated using the fuzzy VIKOR method. Criteria weightage obtained through the fuzzy AHP was applied here while ranking the alternatives. As discussed, its ranking was based on closeness to the ideal solution and expressed with the term VIKOR index (Qi). In the case of Team 1, the Qi values for RC, SS, timber, and RM were 0.027, 0.342, 0.997, and 0.946, respectively; therefore, RC was this group’s most preferred option. The Qi values for Team 2 were 0.306, 0.199, 0.850, and 0.580 for RC, SS, timber, and RM, respectively. The priority of options of this group was SS, RC, RM, and Timber, respectively. Finally, the Qi values for Team 3 were 1.000, 0.845, 0.000, and 0.692 for RC, SS, timber, and RM, and timber was the most preferred alternative among all options. In brief, Team 1 preferred RC, Team 2 preferred SS, and Team 3 preferred timber as the best option. In contrast, timber was the least preferred option for Teams 1 and 2; RC was the least preferred for Team 3.
One of the expected contributions of this research was to develop a DSS that should assist the decision makers in choosing evaluation criteria and assigning relative importance to those in the combination of qualitative and quantitative methods in an IPD framework for selecting the most sustainable structural material. Details of the multi-criteria DSS have been explained in the next section of this paper.
5. Details of DSS Desktop Application Software
This desktop application has been developed using the ‘Microsoft dot-net framework’ and is intended to operate on the Windows platform. C sharp was used in the ‘Windows form application’ for coding this software, and its algorithm was based on the fuzzy TOPSIS technique for ranking the alternatives. A graphical user interface was also developed using the ‘Windows form application.’ Microsoft Management Studio used ‘MySQL’ and the ‘Windows database server’ for database management. After logging in, users were required to create a new project (or retrieve the data of a previously saved project), and three entities were needed to give their inputs in the same interface. Users could edit or change the evaluation criteria during the initial inputs. Later, they needed to assign percentages of weightage for evaluation criteria (using text fields) and preferences for different alternatives (using dropdown menu options). Subsequently, they were required to assign a percentage for each entity (using text fields), stating the importance of stakeholders’ opinions in group decision-making. This application took the qualitative inputs as the users’ preferences and quantitative inputs as computed numerical values. Finally, it presented the ranking of alternatives as the output.
5.1. User Input to the System
5.1.1. Alternatives and Criteria Selection
The following input of the application concerned the selection of the alternatives (e.g., RC, SS, timber, and RM in this study). Users could include new alternatives here or retrieve information from the created database. Next was the selection of evaluation criteria for all pillars of sustainable construction, and users had the flexibility here to select criteria pertinent to any project (Figure 11).
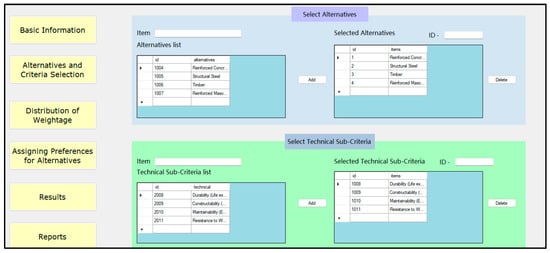
Figure 11.
Alternative and evaluation criteria selection.
5.1.2. Weightage Distribution
In this input stage, all stakeholders of the decision-making team needed to assign weightage for four main criteria and a group of sub-criteria under each criterion (Figure 12).
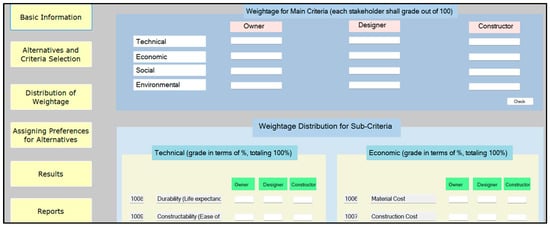
Figure 12.
Distribution of weightage.
5.1.3. Assigning Preferences for Different Alternatives
The final user’s input concerned assigning preference for different alternatives. Here, all stakeholders needed to assign their importance for qualitative evaluation criteria chosen at the initial stage. The inputs were ‘very high,’ ‘high,’ etc., for all the evaluation criteria that needed to be assigned, comparing all alternatives considered for the decision-making problem (Figure 13).
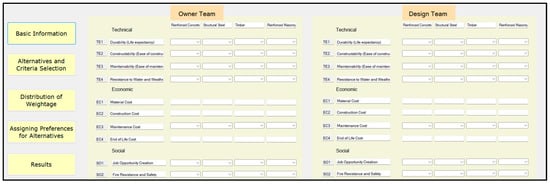
Figure 13.
Assigning preferences for different alternatives.
5.2. System Output
In the end, this application generated several outputs for the users. A screenshot of the output is shown in Figure 14. The weightage distribution graph displays a summary of the weightage assigned by different stakeholders. It represents the different importance stakeholders gave to technical, economic, social, and environmental aspects. The results for the priority of alternatives for different stakeholders were also displayed in three tables. Finally, the stakeholders had the opportunity to assign importance to their opinion to obtain the overall ranking of the alternatives.
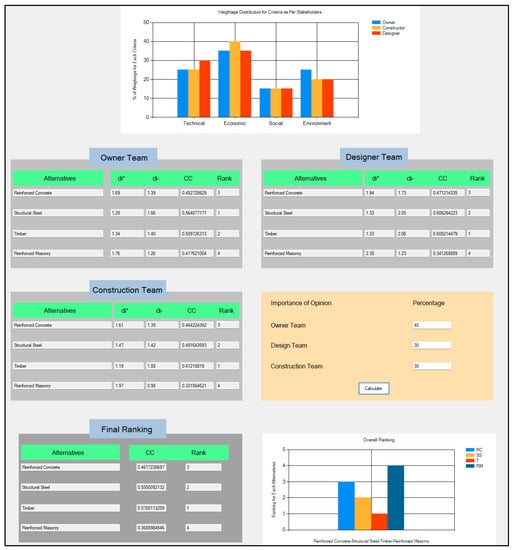
Figure 14.
Graphical output for weightage distribution and ranking of alternatives.
6. Sensitivity Analysis
Saltelli et al. defined sensitivity analysis as “the study of how the uncertainty in the output of a model (numerical or otherwise) can be apportioned to different sources of uncertainty in the model input” [94]. It is a verification process to check that the system fulfils the intended purpose by analyzing the output results with the variations of input parameters [95]. Researchers used different techniques such as the Monte Carlo Simulations [39], the creation of different scenarios [80,96], and combinations of case studies [95], etc., for model verification. In this research, a sensitivity analysis was carried out by running the developed model under various scenarios to ensure that it was responsive to changes in its input and that the output produced meaningful results [80,96].
6.1. Criteria Weightage Sensitivity
The sensitivity of the user input and criteria weight was analyzed, creating four different scenarios. Four sets of weights for criteria were used to represent four instances, as shown in Table 23. Those scenarios were then tested to observe their influences on CCi values of the developed DSS, expressing the ranking of alternatives. Here, one pillar’s criterion weights were assigned larger weights than the others’ for each scenario, as shown in Table 26. In Table 27, the input value findings are displayed, and in Figure 15, the results demonstrate that altering the weights of the criterion significantly affected the CCi values of the alternatives. If the criteria weightage for any sustainability pillar increased, giving it more priority, the CCi value also increased significantly and had a substantial impact on ranking.

Table 26.
Scenarios based on the sustainability pillar’s focus.

Table 27.
CCi values for four scenarios.
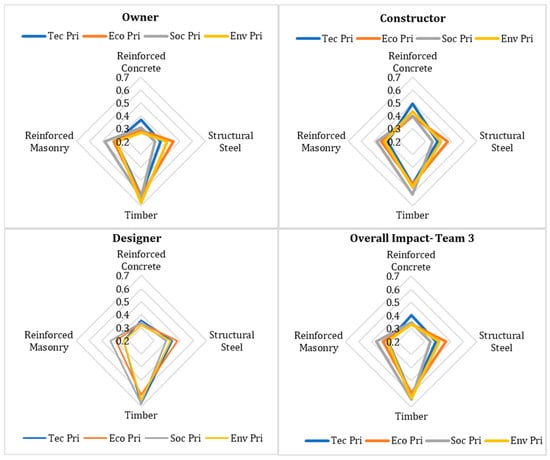
Figure 15.
Radar chart showing the sensitivity of the model for criteria weightage.
In Table 26, for each scenario, four criteria of one sustainability pillar were weighted with a higher value of 0.10 each, and the other 12 criteria were weighted with 0.05. Users’ input for preferences for different alternatives was kept constant to observe the impact on the decision-making process. The option with a greater input in favor of positive criteria would be ranked higher; conversely, negative or cost factors would have the opposite effect. For validation, criteria weightage from this table was then used in the same sample’s fuzzy TOPSIS calculation that was explained in Section 4 to rank the alternatives. Each scenario derived one set of ranking results for the alternatives, while the criteria weightage was only altered, and user preferences were kept constant. The output results for different scenarios are shown in Table 27.
In Scenario 1, it was observed that providing the technical pillars with greater criteria weightage affected the ranking of RC for Team 3, which was ranked here as the second priority. Figure 15 displays all other impacts graphically once technical, economic, social, and environmental factors were prioritized more. When the overall impact of Team 3 was considered, giving more technical priority resulted in reinforced concrete having a higher CCi value, whereas higher social and environmental priorities resulted in a better CCi for timber. SS was given higher consideration when ranking according to economic priorities. Similar explanations were applicable to other scenarios too.
6.2. Sensitivity Analysis of User Preferences for Alternatives
The user’s input determined how the alternatives were ranked. Four scenarios are depicted here to investigate the variability of the CCi value caused by various user inputs regarding preferences for alternatives. Here, all the criteria were given equal weights to verify the model’s sensitivity to visualize the user preference input vividly. The graphical output of the analysis is shown in Figure 16.
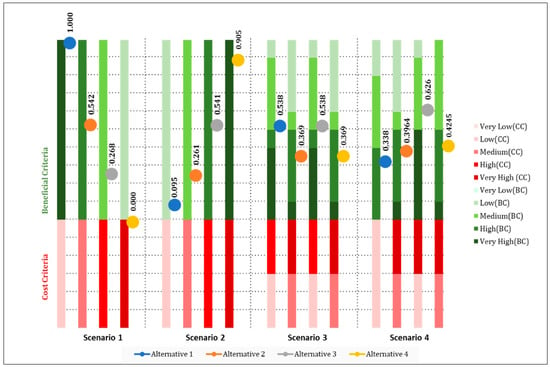
Figure 16.
Chart showing the sensitivity of the model for user preferences.
For Scenario 1, the best possible condition was created for Alternative 1. It was given the highest preferences (very high) for beneficial criteria and lower preferences (low) for cost criteria. At the same time, the weightage for all criteria and stakeholders’ importance was kept constant and equal. As a result, Alternative 1 obtained the highest CCi value, which was expected to determine the model’s sensitivity. Similarly, priorities for Alternatives 2, 3, and 4 were gradually altered in the case of user input, and the expected reflection of that was observed in the system’s output.
In the case of Scenario 2, for both beneficial and cost criteria, the highest preferences (Very High) were given. However, higher preferences would increase the ranking when it came to beneficial criteria, but they had the opposite effect when it came to cost criteria. From the ranking result of Scenario 2, it was derived that a higher input value of cost criteria resulted in a lower CCi value from Scenario 1. Alternative 4 added some value to the CCi due to its lower preference input terms of the cost criteria. Similarly, priorities for Alternatives 2, 3, and 4 were gradually altered in the case of user input, and the expected reflection of that was observed in the system’s output.
For Scenario 3, it was noticeable that even though each alternative had the identical nature of user preferences assigned to it (“Very High” for four criteria, “High” for four criteria, “Medium” for four criteria, and “Low” for four criteria), the outcome varied. This is due to the existence of beneficial and cost criteria. The CCi values for Alternatives 2 and 4 were negatively impacted by higher cost criterion values. This demonstrates that the developed model was sensitive to the input given on its core cost–benefit criteria.
In the case of Scenario 4, the output result demonstrates that Alternative 3 achieved a better ranking with a higher CCi value since it was randomly allocated with a greater number of higher-value inputs. Regarding Alternative 3, it received very high preferences across a higher number (five) of beneficial criteria, which raised its CCi value and drove it to the top of the ranking.
7. Discussion
Both fuzzy TOPSIS and fuzzy VIKOR are based on the principle of an aggregating function representing closeness to the ideal solution [90]. However, these methods use different types of normalization, where TOPSIS uses vector normalization and VIKOR uses linear normalization. The aggregate function used in VIKOR represents a distance (Qi) from the ideal solution, whereas TOPSIS uses a ranking index (CC) that calculates the distance between positive and negative ideal solutions. Therefore, the highest-ranked alternative by TOPSIS is the highest-ranked index and is not always necessarily the closest to the ideal solution, which is the case for VIKOR [90]. In this study, rankings of alternatives were carried out employing both of these methods using the criteria weightage from the fuzzy AHP. A comparison of the results obtained is shown in Figure 17. We obtained twenty-four ranking results in this study, involving twelve from fuzzy TOPSIS and fuzzy VIKOR. Except for four cases, all other results were similar in both techniques. These four occurred once there were conflicting situations between the distance measured from the ideal solution by these techniques.
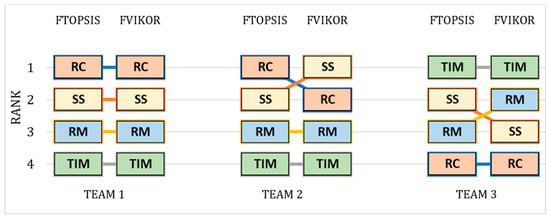
Figure 17.
Comparison of final ranking results by fuzzy TOPSIS and fuzzy VIKOR.
The data analysis and results deduced that a decision from this model is entirely dependent on the user inputs. This system calculates based on the users’ information: Weightage of the criteria and preferences for different alternatives. Therefore, it can be decided that a sustainable selection is only possible if the stakeholders change their traditional thinking process based on short-term economic gain and seek a sustainable solution. In this study, out of the three teams, two were from traditional construction industries, and the third team comprised members who were either researching or implementing sustainable construction. The results reflected their organizational behavior and showed that the selection of Teams 1 and 2 was more inclined toward technical and economic aspects. Their priority for social and environmental aspects was relatively lower; therefore, reinforced concrete or structural steel was the top-ranked alternative resulting from inputs on criteria weightage and preferences. In contrast, the preferences of Team 3 were more balanced, giving due importance to social and environmental aspects; therefore, timber was the most preferred selection as the structural material for this eight-story residential building.
The findings of this current approach were compared with several previous studies that used fuzzy AHP, TOPSIS, and VIKOR to solve decision-making problems in construction. Authors used the fuzzy AHP to assign weightage and prioritize the importance of criteria and TOPSIS and VIKOR to rank the alternatives [70,79,80,89,97]. They used the preferences and opinions of the stakeholders as the input of the system to determine the output as the ranking of the options. This study also followed a similar approach and integrated the opinion of all project stakeholders to make the most sustainable decision. Therefore, this confirms the reliability of this approach.
As the outcome of the study, it can be concluded that the construction industry’s overall performance has raised extreme concern regarding reducing its negative impacts and improving global sustainability. The appropriate selection of materials can achieve sustainability in building construction. Each material has its own sustainability characteristics; therefore, one may be cost-effective but more environmentally harmful or aesthetically incompatible with the environment. Multi-criteria decision-making is essential for selecting the most sustainable material from several alternatives [48,52]. This research argued that sustainable selection is only possible once the stakeholders move away from the traditional short-term cost–benefit analysis and choose to balance all factors of sustainable construction to maximize value and minimize harm. Therefore, the onus is on the users to make conscious decisions to improve the balance between development and sustainability to pave the way for a harmonious society for future generations.
8. Conclusions
This study followed a hybrid approach to develop a decision support system using the fuzzy AHP, fuzzy TOPSIS, and fuzzy VIKOR multi-criteria decision-making techniques. The evaluation criteria for assessing the technical, economic, social, and environmental pillars of sustainable construction vary based on the type and nature of the construction projects and stakeholders’ preferences. The opinions of several industry experts and academic researchers were obtained to finalize the list of evaluation criteria appropriate for this research. However, this list was used as the basis for the calculation and development of the algorithms of the DSS. Users would always have the opportunity to change the evaluation criteria depending on the type of project, its location, and stakeholders’ preferences. Still, the methodology would work in a similar way for sustainable decision-making.
For the calculation, development, and verification of the DSS, a hypothetical eight-story building was considered in this study. The collected data were analyzed and calculated in several steps. The result showed there were notable differences in the final ranking of the alternatives of different teams. Moreover, it was deduced that there were no ideal solutions to these kinds of problems; instead, optimum solutions can be obtained considering all factors of sustainable construction practices. If users give more importance to economic gain and ignore the environmental aspects, the output result would reflect that. In contrast, if the stakeholders make a balanced choice combining all factors of sustainable construction and considering the entire life cycle of the project, their preferred option will comply with sustainable construction, as displayed by the selection of Team 3 in this study.
The DSS has been developed to assist decision makers in making a sustainable selection in an IPD framework. A few notable advantages of the developed DSS software are as follows: It is a joint application, where all stakeholders can give their input in the IPD framework for a decision, users can edit/modify the alternatives and evaluation criteria according to their needs, and users have the option to set the importance of criteria; this application can handle both qualitative and quantitative data—it can take the qualitative inputs as the users’ preferences (i.e., ‘very high’, ‘high’, etc.) and quantitative inputs as computed numerical values; the stakeholder can set the importance of their opinions in group decision-making; and most importantly, it is a generic model that can be used for multiple sustainable group decision-making purposes. This convenient, adaptable, and simple DSS is expected to increase objectivity, improve transparency and consistency in sustainable construction, and systemize the process.
In this study, RC, SS, timber, and RM were included as alternatives to the structural elements, discarding any other composites. The developed DSS was tested with a hypothetical case study on an eight-story building in Calgary, Alberta, considering the opinions of nine academic and industry experts. In addition to TOPSIS and VIKOR, further researchers can use other techniques such as PROMETHEE, DEMATEL, CBA, and ANP to verify the applications developed in this research.
This study was conducted on selecting structural elements only, and there is further scope to evaluate the entire building for sustainability using the developed DSS. We identified some variations in ranking results obtained through TOPSIS and VIKOR, and there can be a more detailed study to investigate and comment on those variations in the future. The desktop application has a database to store information related to life cycle analysis, cost, location, etc., which users can enrich and update according to their needs.
Author Contributions
Conceptualization, M.M.A.B. and A.H.; methodology, M.M.A.B.; software, M.M.A.B.; validation, M.M.A.B. and A.H.; formal analysis, M.M.A.B.; investigation, M.M.A.B.; data curation, M.M.A.B.; writing—original draft preparation, M.M.A.B.; writing—review and editing, A.H.; visualization, M.M.A.B.; supervision, A.H. All authors have read and agreed to the published version of the manuscript.
Funding
This research received no external funding.
Institutional Review Board Statement
Not applicable.
Informed Consent Statement
Not applicable.
Data Availability Statement
The data presented in this study are available on request from the corresponding author.
Conflicts of Interest
The authors declare no conflict of interest.
References
- UNEP 2021 Global Status Report for Buildings and Construction|Globalabc. Available online: https://globalabc.org/resources/publications/2021-global-status-report-buildings-and-construction (accessed on 10 June 2022).
- CURT. Managing Construction Productivity. Available online: https://www.curt.org/committees/managing-construction-productivity/ (accessed on 10 September 2022).
- COP26. The Glasgow Climate Pact–Key Outcomes from COP26|UNFCCC. Available online: https://unfccc.int/process-and-meetings/the-paris-agreement/the-glasgow-climate-pact-key-outcomes-from-cop26 (accessed on 12 September 2022).
- Farzanehrafat, M.; Akbarnezhad, A.; Ghoddousi, P. Analysis of Different Views towards Social Sustainability in Construction. In Proceedings of the International Symposium on Automation and Robotics in Construction, Oulu, Finland, 18 June 2015. [Google Scholar]
- Purvis, B.; Mao, Y.; Robinson, D. Three Pillars of Sustainability: In Search of Conceptual Origins. Sustain. Sci. 2019, 14, 681–695. [Google Scholar] [CrossRef]
- Schoolman, E.; Guest, J.; Bush, K.; Bell, A. How Interdisciplinary is Sustainability Research? Analyzing the Structure of an Emerging Scientific Field. Sustain. Sci. 2012, 7, 67–80. [Google Scholar] [CrossRef]
- Müller, J. Reforming United Nations—The Struggle for Legitimacy and Effectiveness; Brill: Leiden, The Netherlands, 2006; pp. 442–484. ISBN 978-90-47-40960-1. [Google Scholar]
- Yılmaz, M.; Bakış, A. Sustainability in Construction Sector. Procedia-Soc. Behav. Sci. 2015, 195, 2253–2262. [Google Scholar] [CrossRef]
- Ochshorn, J. Structural Elements for Architects and Builders, 1st ed.; Butterworth-Heinemann: Oxford, UK, 2009; ISBN 979-8-68442-803-6. [Google Scholar]
- Stephan, A.; Stephan, L. Life Cycle Energy and Cost Analysis of Embodied, Operational and User-Transport Energy Reduction Measures for Residential Buildings. Appl. Energy 2016, 161, 445–464. [Google Scholar] [CrossRef]
- Oldfield, P. The Sustainable Tall Building, 1st ed.; Routledge: Abingdon, UK, 2019; ISBN 978-1138905863. [Google Scholar]
- Cowan, H.J. A History of Masonry and Concrete Domes in Building Construction. Build. Environ. 1977, 12, 1–24. [Google Scholar] [CrossRef]
- Laguarda Mallo, M.F.; Espinoza, O. Awareness, Perceptions and Willingness to Adopt Cross-Laminated Timber by the Architecture Community in the United States. J. Clean. Prod. 2015, 94, 198–210. [Google Scholar] [CrossRef]
- Gharehbaghi, K. Advancements in Concrete Technology in Australia: Geo-Polymer Concrete. Int. J. Constr. Environ. 2015, 7, 19–29. [Google Scholar] [CrossRef]
- Goggins, J.; Keane, T.; Kelly, A. The Assessment of Embodied Energy in Typical Reinforced Concrete Building Structures in Ireland. Energy Build. 2010, 42, 735–744. [Google Scholar] [CrossRef]
- Nassar, R.-U.-D.; Soroushian, P.; Ghebrab, T. Field Investigation of High-Volume Fly Ash Pavement Concrete. Resour. Conserv. Recycl. 2013, 73, 78–85. [Google Scholar] [CrossRef]
- Allwood, J.M.; Cullen, J.M.; Milford, R.L. Options for Achieving a 50% Cut in Industrial Carbon Emissions by 2050. Environ. Sci. Technol. 2010, 44, 1888–1894. [Google Scholar] [CrossRef]
- Jayasinghe, C.; Fonseka, W.M.C.D.J.; Abeygunawardhene, Y.M. Load Bearing Properties of Composite Masonry Constructed with Recycled Building Demolition Waste and Cement Stabilized Rammed Earth. Constr. Build. Mater. 2016, 102, 471–477. [Google Scholar] [CrossRef]
- Hendry, E.A.W. Masonry Walls: Materials and Construction. Constr. Build. Mater. 2001, 15, 323–330. [Google Scholar] [CrossRef]
- Thamboo, J.A. Reinforced Masonry, An Alternative to Reinforced Concrete. In Proceedings of the 2018 Society of Structural Engineers Sri Lanka Conference, Colombo, Sri Lanka, 27 March 2018. [Google Scholar]
- Guo, H.; Liu, Y.; Meng, Y.; Huang, H.; Sun, C.; Shao, Y. A Comparison of the Energy Saving and Carbon Reduction Performance between Reinforced Concrete and Cross-Laminated Timber Structures in Residential Buildings in the Severe Cold Region of China. Sustainability 2017, 9, 1426. [Google Scholar] [CrossRef]
- Gale, F.P. The Tropical Timber Trade Regime; Palgrave MacMillan: London, UK, 1998; pp. 61–78. ISBN 978-0333697696. [Google Scholar]
- Miller, A.; Ip, K. Sustainable Construction Materials. In Design and Management of Sustainable Built Environments; Yao, R., Ed.; Springer: London, UK, 2013; pp. 341–358. ISBN 978-1-4471-4780-0. [Google Scholar]
- Švajlenka, J.; Kozlovská, M. Modern Method of Construction Based on Wood in the Context of Sustainability. Civ. Eng. Environ. Syst. 2017, 34, 127–143. [Google Scholar] [CrossRef]
- Buck, D.; Wang, X.A.; Hagman, O.; Gustafsson, A. Comparison of Different Assembling Techniques Regarding Cost, Durability, and Ecology—A Survey of Multi-Layer Wooden Panel Assembly Load-Bearing Construction Elements. BioResources 2015, 10, 8378–8396. [Google Scholar] [CrossRef]
- Eom, S.B. Decision Support Systems Research: Current State and Trends. Ind. Manag. Data Syst. 1999, 99, 213–221. [Google Scholar] [CrossRef]
- Zavadskas, E.K.; Pamučar, D.; Stević, Ž.; Mardani, A. Multi-Criteria Decision-Making Techniques for Improvement Sustainability Engineering Processes. Symmetry 2020, 12, 986. [Google Scholar] [CrossRef]
- Chai, J.; Liu, J.N.K.; Ngai, E.W.T. Application of Decision-Making Techniques in Supplier Selection: A Systematic Review of Literature. Expert Syst. Appl. 2013, 40, 3872–3885. [Google Scholar] [CrossRef]
- Bouyssou, D. Multicriteria Decision-Aid, Vincke, Ph., Chichester: Wiley, 1992. J. Multi-Criteria Decis. Anal. 1994, 3, 131. [Google Scholar] [CrossRef]
- Deng, H.; Yeh, C.-H.; Willis, R.J. Inter-Company Comparison Using Modified TOPSIS with Objective Weights. Comput. Oper. Res. 2000, 27, 963–973. [Google Scholar] [CrossRef]
- Jato-Espino, D.; Castillo-Lopez, E.; Rodriguez-Hernandez, J.; Canteras-Jordana, J.C. A Review of Application of Multi-Criteria Decision Making Methods in Construction. Autom. Constr. 2014, 45, 151–162. [Google Scholar] [CrossRef]
- Sharma, A.; Saxena, A.; Sethi, M.; Shree, V. Varun Life Cycle Assessment of Buildings: A Review. Renew. Sustain. Energy Rev. 2011, 15, 871–875. [Google Scholar] [CrossRef]
- Islam, H.; Jollands, M.; Setunge, S.; Bhuiyan, M.A. Optimization Approach of Balancing Life Cycle Cost and Environmental Impacts on Residential Building Design. Energy Build. 2015, 87, 282–292. [Google Scholar] [CrossRef]
- Marszal, A.J.; Heiselberg, P. Life Cycle Cost Analysis of a Multi-Storey Residential Net Zero Energy Building in Denmark. Energy 2011, 36, 5600–5609. [Google Scholar] [CrossRef]
- Ramesh, T.; Prakash, R.; Shukla, K.K. Life Cycle Energy Analysis of Buildings: An Overview. Energy Build. 2010, 42, 1592–1600. [Google Scholar] [CrossRef]
- Stazi, F.; Mastrucci, A.; Munafò, P. Life Cycle Assessment Approach for the Optimization of Sustainable Building Envelopes: An Application on Solar Wall Systems. Build. Environ. 2012, 58, 278–288. [Google Scholar] [CrossRef]
- Russell-Smith, S.V.; Lepech, M.D. Cradle-to-Gate Sustainable Target Value Design: Integrating Life Cycle Assessment and Construction Management for Buildings. J. Clean. Prod. 2015, 100, 107–115. [Google Scholar] [CrossRef]
- Hajare, A.; Elwakil, E. Integration of Life Cycle Cost Analysis and Energy Simulation for Building Energy-Efficient Strategies Assessment. Sustain. Cities Soc. 2020, 61, 102293. [Google Scholar] [CrossRef]
- AbouHamad, M.; Abu-Hamd, M. Framework for Construction System Selection Based on Life Cycle Cost and Sustainability Assessment. J. Clean. Prod. 2019, 241, 118397. [Google Scholar] [CrossRef]
- Islam, H.; Jollands, M.; Setunge, S.; Haque, N.; Bhuiyan, M.A. Life Cycle Assessment and Life Cycle Cost Implications for Roofing and Floor Designs in Residential Buildings. Energy Build. 2015, 104, 250–263. [Google Scholar] [CrossRef]
- Schade, J. Life Cycle Cost Calculation Models for Buildings. In Proceedings of the 4th Nordic Conference on Construction Economics and Organization: Development Processes in Construction Management, Luleå, Sweden, 14 June 2007; pp. 321–329. [Google Scholar]
- AIA Integrated Project Delivery: A Guide. Available online: https://www.bdcnetwork.com/aia-and-aia-california-council-partner-introduce-integrated-project-delivery-guide (accessed on 14 February 2022).
- Hall, D.M.; Scott, W.R. Early Stages in the Institutionalization of Integrated Project Delivery. Proj. Manag. J. 2019, 50, 128–143. [Google Scholar] [CrossRef]
- Elghaish, F.; Hosseini, M.R.; Talebi, S.; Abrishami, S.; Martek, I.; Kagioglou, M. Factors Driving Success of Cost Management Practices in Integrated Project Delivery (IPD). Sustainability 2020, 12, 9539. [Google Scholar] [CrossRef]
- Zhu, X.; Meng, X.; Zhang, M. Application of Multiple Criteria Decision Making Methods in Construction: A Systematic Literature Review. J. Civ. Eng. Manag. 2021, 27, 372–403. [Google Scholar] [CrossRef]
- Marcher, C.; Giusti, A.; Matt, D.T. Decision Support in Building Construction: A Systematic Review of Methods and Application Areas. Buildings 2020, 10, 170. [Google Scholar] [CrossRef]
- Minhas, M.R.; Potdar, V. Decision Support Systems in Construction: A Bibliometric Analysis. Buildings 2020, 10, 108. [Google Scholar] [CrossRef]
- Hashemi, H.; Ghoddousi, P.; Nasirzadeh, F. Sustainability Indicator Selection by a Novel Triangular Intuitionistic Fuzzy Decision-Making Approach in Highway Construction Projects. Sustainability 2021, 13, 1477. [Google Scholar] [CrossRef]
- Bektur, G. A Hybrid Fuzzy MCDM Approach for Sustainable Project Portfolio Selection Problem and an Application for a Construction Company. İktisadi Ve İdari Bilim. Fakültesi Derg. 2021, 23, 182–194. [Google Scholar] [CrossRef]
- Marović, I.; Perić, M.; Hanak, T. A Multi-Criteria Decision Support Concept for Selecting the Optimal Contractor. Appl. Sci. 2021, 11, 1660. [Google Scholar] [CrossRef]
- Zhang, C.; Zhang, J.; Yang, Q. Identifying Critical Risk Factors in Green Product Certification Using Hybrid Multiple-Criteria Decision-Making. Sustainability 2022, 14, 4513. [Google Scholar] [CrossRef]
- Lu, M.; Wudhikarn, R. Using the Best-Worst Method to Develop Intellectual Capital Indicators in Financial Service Company. In Proceedings of the 2022 Joint International Conference on Digital Arts, Media and Technology with ECTI Northern Section Conference on Electrical, Electronics, Computer and Telecommunications Engineering (ECTI DAMT & NCON), Chiang Rai, Thailand, 26–28 January 2022; pp. 81–86. [Google Scholar]
- Zoghi, M.; Rostami, G.; Khoshand, A.; Motalleb, F. Material Selection in Design for Deconstruction Using Kano Model, Fuzzy-AHP and TOPSIS Methodology. Waste Manag. Res. 2022, 40, 410–419. [Google Scholar] [CrossRef]
- Akadiri, P.O.; Olomolaiye, P.O.; Chinyio, E.A. Multi-Criteria Evaluation Model for the Selection of Sustainable Materials for Building Projects. Autom. Constr. 2013, 30, 113–125. [Google Scholar] [CrossRef]
- Josiah Marut, J.; Alaezi, J.O.; Obeka, I.C. A Review of Alternative Building Materials for Sustainable Construction Towards Sustainable Development. J. Mod. Mater. 2020, 7, 68–78. [Google Scholar] [CrossRef]
- Kamali, M.; Hewage, K.N. Performance Indicators for Sustainability Assessment of Buildings. In Proceedings of the 5th International/11th Construction Specialty Conference, CSCE, Regina, SK, Canada, 27–30 May 2015. [Google Scholar]
- Li, P.; Froese, T.M. A Green Home Decision-Making Tool: Sustainability Assessment for Homeowners. Energy Build. 2017, 150, 421–431. [Google Scholar] [CrossRef]
- Minhas, M.R.; Potdar, V. Development of an Effective System for Selecting Construction Materials for Sustainable Residential Housing in Western Australia. Appl. Math. 2020, 11, 825–844. [Google Scholar] [CrossRef]
- Pearce, A.R.; Hastak, M.; Vanegas, J.A. A Decision Support System for Construction Materials Selection Using Sustainability as a Criterion. In Proceedings of the NCSBCS Conference on Building Codes and Standards, Annapolis, MA, USA, 1995; p. 13. [Google Scholar]
- Yang, J.; Ogunkah, I.C.B. A Multi-Criteria Decision Support System for the Selection of Low-Cost Green Building Materials and Components. J. Build. Constr. Plan. Res. 2013, 01, 89–130. [Google Scholar] [CrossRef]
- Fazeli, A.; Jalaei, F.; Khanzadi, M.; Banihashemi, S. BIM-Integrated TOPSIS-Fuzzy Framework to Optimize Selection of Sustainable Building Components. Int. J. Constr. Manag. 2019, 22, 1240–1259. [Google Scholar] [CrossRef]
- Sahlol, D.G.; Elbeltagi, E.; Elzoughiby, M.; Abd Elrahman, M. Sustainable Building Materials Assessment and Selection Using System Dynamics. J. Build. Eng. 2021, 35, 101978. [Google Scholar] [CrossRef]
- Alam Bhuiyan, M.M.; Sulle, A.; Hammad, A. Application of Choosing by Advantage (CBA) to Select Most Sustainable Project, Metro Extension Case Study. In Proceedings of the 4th European and Mediterranean Structural Engineering and Construction Conference, Leipzig, Germany, 20–25 June 2022. [Google Scholar] [CrossRef]
- Kappenthuler, S.; Seeger, S. From Resources to Research—A Framework for Identification and Prioritization of Materials Research for Sustainable Construction. Mater. Today Sustain. 2020, 7, 100009. [Google Scholar] [CrossRef]
- Figueiredo, K.; Pierott, R.; Hammad, A.W.A.; Haddad, A. Sustainable Material Choice for Construction Projects: A Life Cycle Sustainability Assessment Framework Based on BIM and Fuzzy-AHP. Build. Environ. 2021, 196, 107805. [Google Scholar] [CrossRef]
- Rahim, F.A.; Muzaffar, S.A.; Yusoff, N.S.M.; Zainon, N.; Wang, C. Sustainable Construction Through Life Cycle Costing. J. Build. Perform. 2014, 5, 12. [Google Scholar]
- Danso, H. Dimensions and Indicators for Sustainable Construction Materials: A Review. Res. Dev. Mater. Sci. 2018, 3, 1–9. [Google Scholar] [CrossRef]
- Fallahpour, A.; Wong, K.Y.; Rajoo, S.; Olugu, E.U.; Nilashi, M.; Turskis, Z. A Fuzzy Decision Support System for Sustainable Construction Project Selection: An Integrated FPP-FIS Model. J. Civ. Eng. Manag. 2020, 26, 247–258. [Google Scholar] [CrossRef]
- Kaya, T.; Kahraman, C. Multicriteria Decision Making in Energy Planning Using a Modified Fuzzy TOPSIS Methodology. Expert Syst. Appl. 2011, 38, 6577–6585. [Google Scholar] [CrossRef]
- Solangi, Y.A.; Tan, Q.; Mirjat, N.H.; Valasai, G.D.; Khan, M.W.A.; Ikram, M. An Integrated Delphi-AHP and Fuzzy TOPSIS Approach toward Ranking and Selection of Renewable Energy Resources in Pakistan. Processes 2019, 7, 118. [Google Scholar] [CrossRef]
- El khouli, S.; John, V.; Zeumer, M. Sustainable Construction Techniques: From Structural Design to Material Selection: Assessing and Improving the Environmental Impact of Buildings; DETAIL: München, Germany, 2016; ISBN 978-3-95553-238-3. [Google Scholar]
- Ren, J.; Manzardo, A.; Mazzi, A.; Zuliani, F.; Scipioni, A. Prioritization of Bioethanol Production Pathways in China Based on Life Cycle Sustainability Assessment and Multicriteria Decision-Making. Int. J. Life Cycle Assess. 2015, 20, 842–853. [Google Scholar] [CrossRef]
- Jost, L. Entropy and Diversity. Oikos 2006, 113, 363–375. [Google Scholar] [CrossRef]
- Wang, T.-C.; Lee, H.-D. Developing a Fuzzy TOPSIS Approach Based on Subjective Weights and Objective Weights. Expert Syst. Appl. 2009, 36, 8980–8985. [Google Scholar] [CrossRef]
- ATHENA Impact Estimator for Buildings. 2022. Available online: http://www.athenasmi.org/our-software-data/impact-estimator (accessed on 10 September 2022).
- Reza, B.; Sadiq, R.; Hewage, K. Emergy-Based Life Cycle Assessment (Em-LCA) of Multi-Unit and Single-Family Residential Buildings in Canada. Int. J. Sustain. Built Environ. 2014, 3, 207–224. [Google Scholar] [CrossRef]
- ISO 14044; Environmental Management: Life Cycle Assessment. Critical Review Processes and Reviewer Competencies: Additional Requirements and Guidelines to ISO 14044:2006. BSI: London, UK, 2014.
- Forman, E.H.; Gass, S.I. The Analytic Hierarchy Process—An Exposition. Oper. Res. 2001, 49, 469–486. [Google Scholar] [CrossRef]
- Dağdeviren, M.; Yavuz, S.; Kılınç, N. Weapon Selection Using the AHP and TOPSIS Methods under Fuzzy Environment. Expert Syst. Appl. 2009, 36, 8143–8151. [Google Scholar] [CrossRef]
- Sirisawat, P.; Kiatcharoenpol, T. Fuzzy AHP-TOPSIS Approaches to Prioritizing Solutions for Reverse Logistics Barriers. Comput. Ind. Eng. 2018, 117, 303–318. [Google Scholar] [CrossRef]
- Saaty, T.L. A Scaling Method for Priorities in Hierarchical Structures. J. Math. Psychol. 1977, 15, 234–281. [Google Scholar] [CrossRef]
- Ertuğrul, İ.; Karakaşoğlu, N. Comparison of Fuzzy AHP and Fuzzy TOPSIS Methods for Facility Location Selection. Int. J. Adv. Manuf. Technol. 2008, 39, 783–795. [Google Scholar] [CrossRef]
- Kahraman, C.; Yasin Ateş, N.; Çevik, S.; Gülbay, M.; Ayça Erdoğan, S. Hierarchical Fuzzy TOPSIS Model for Selection among Logistics Information Technologies. J. Enterp. Inf. Manag. 2007, 20, 143–168. [Google Scholar] [CrossRef]
- Chen, T.-Y.; Tsao, C.-Y. The Interval-Valued Fuzzy TOPSIS Method and Experimental Analysis. Fuzzy Sets Syst. 2008, 159, 1410–1428. [Google Scholar] [CrossRef]
- Gligoric, Z.; Beljic, C.; Simeunovic, V. Shaft Location Selection at Deep Multiple Orebody Deposit by Using Fuzzy TOPSIS Method and Network Optimization. Expert Syst. Appl. 2010, 37, 1408–1418. [Google Scholar] [CrossRef]
- Büyüközkan, G.; Çifçi, G. A Combined Fuzzy AHP and Fuzzy TOPSIS Based Strategic Analysis of Electronic Service Quality in Healthcare Industry. Expert Syst. Appl. 2012, 39, 2341–2354. [Google Scholar] [CrossRef]
- Mocq, J.; St-Hilaire, A.; Cunjak, R.A. Assessment of Atlantic Salmon (Salmo Salar) Habitat Quality and Its Uncertainty Using a Multiple-Expert Fuzzy Model Applied to the Romaine River (Canada). Ecol. Model. 2013, 265, 14–25. [Google Scholar] [CrossRef]
- Opricovic, S.; Tzeng, G.-H. Multicriteria Planning of Post-Earthquake Sustainable Reconstruction. Comput.-Aided Civ. Infrastruct. Eng. 2002, 17, 211–220. [Google Scholar] [CrossRef]
- Shemshadi, A.; Shirazi, H.; Toreihi, M.; Tarokh, M.J. A Fuzzy VIKOR Method for Supplier Selection Based on Entropy Measure for Objective Weighting. Expert Syst. Appl. 2011, 38, 12160–12167. [Google Scholar] [CrossRef]
- Opricovic, S.; Tzeng, G.-H. Compromise Solution by MCDM Methods: A Comparative Analysis of VIKOR and TOPSIS. Eur. J. Oper. Res. 2004, 156, 445–455. [Google Scholar] [CrossRef]
- Opricovic, S. Fuzzy VIKOR with an Application to Water Resources Planning. Expert Syst. Appl. 2011, 38, 12983–12990. [Google Scholar] [CrossRef]
- Opricovic, S.; Tzeng, G.-H. Extended VIKOR Method in Comparison with Outranking Methods. Eur. J. Oper. Res. 2007, 178, 514–529. [Google Scholar] [CrossRef]
- Government of Canada, S.C. Average Expected Useful Life of New Municipally Owned Social and Affordable Housing Assets, by Urban and Rural, and Population Size, Infrastructure Canada. Available online: https://www150.statcan.gc.ca/t1/tbl1/en/tv.action?pid=4610000801 (accessed on 17 June 2022).
- Saltelli, A.; Tarantola, S.; Campolongo, F.; Ratto, M. Sensitivity Analysis in Practice; John Wiley & Sons, Ltd.: Hoboken, NJ, USA, 2002; ISBN 0-470-87093-1. [Google Scholar]
- Bakhoum, E.S.; Brown, D.C. An Automated Decision Support System for Sustainable Selection of Structural Materials. Int. J. Sustain. Eng. 2015, 8, 80–92. [Google Scholar] [CrossRef]
- Dara, C.; Hachem-Vermette, C.; Assefa, G. Life Cycle Assessment and Life Cycle Costing of Container-Based Single-Family Housing in Canada: A Case Study. Build. Environ. 2019, 163, 106332. [Google Scholar] [CrossRef]
- Awasthi, A.; Govindan, K.; Gold, S. Multi-Tier Sustainable Global Supplier Selection Using a Fuzzy AHP-VIKOR Based Approach. Int. J. Prod. Econ. 2018, 195, 106–117. [Google Scholar] [CrossRef]
Disclaimer/Publisher’s Note: The statements, opinions and data contained in all publications are solely those of the individual author(s) and contributor(s) and not of MDPI and/or the editor(s). MDPI and/or the editor(s) disclaim responsibility for any injury to people or property resulting from any ideas, methods, instructions or products referred to in the content. |
© 2023 by the authors. Licensee MDPI, Basel, Switzerland. This article is an open access article distributed under the terms and conditions of the Creative Commons Attribution (CC BY) license (https://creativecommons.org/licenses/by/4.0/).