Article

The Impact of Property Rights Structure on High-Quality Development of Enterprises Based on Integrated Machine Learning—A Case Study of State-Owned Enterprises in China

School of Economics and Management, Harbin Institute of Technology (Shenzhen), Shenzhen 518000, China
*
Author to whom correspondence should be addressed.
Sustainability 2023, 15(4), 3016; https://doi.org/10.3390/su15043016
Submission received: 5 January 2023 / Revised: 2 February 2023 / Accepted: 2 February 2023 / Published: 7 February 2023

Abstract

:
High-quality development of state-owned enterprises (SOEs) is of great significance to the transformation of the dynamic energy of the Chinese economy in the new development stage and the improvement of quality and efficiency. To this end, we selected 32 evaluation indicators based on three perspectives: social responsibility, effectiveness and efficiency, and independent innovation. Then, we applied the fixed-base efficacy coefficient method and the longitudinal and horizontal pull-out gearing method to obtain the indexes for measuring the level of high-quality development of SOEs by linear weighting. On this basis, a model constructed by an integrated machine learning algorithm was used to explore the impact of changes in the ownership structure of SOEs on the level of high-quality development of enterprises. The study shows that (1) the overall development quality of SOEs has been on an upward trend since 2008, among which the quality of competitive SOEs has been on an upward trend, while the performance of public welfare SOEs is slightly less; (2) the property rights reform of SOEs introduces the shareholding ratio of the largest non-state shareholder and the level of high-quality development as a sine function, keeping the nature of state property rights unchanged, while maintaining the ratio in the range of 25.2–50%; (3) the relationship between the ratio of the share capital of the employee stock ownership plan to the total share capital and the level of high-quality development of SOEs is increasing, then decreasing, and then stabilizing, the ratio is maintained at about 5%, and the marginal effect of the employees’ motivation on the improvement of the quality of enterprise development is stronger; (4) the implementation of an employee stock ownership plan by SOEs more than twice a year can play a positive role in improving the quality of enterprise development. This can provide theoretical guidance for measuring the level of high-quality development of SOEs, reforming the ownership structure of SOEs, and promoting the process of high-quality macroeconomic development.

1. Introduction

Since the 21st century, the power of emerging markets and developing countries has risen as a group, and some emerging countries have become the leaders of global economic growth, with their economic scale taking up a larger share of the global economy and investment. The rise of emerging market countries and developing countries as a group has become an irreversible trend of the times. In recent years, the contribution rate of these countries to world economic growth has been steadily high, reaching 80% in 2016, making them a main engine of growth. Recently, the world economy has shown an upward trend, international trade and investment have rebounded, a new round of technology and industrial revolution is ready to take off, and new industries, new technologies, and new business models are emerging. In this sense, emerging markets and developing countries face rare development opportunities. At the same time, risks and uncertainties in the world economy are rising simultaneously, multilateral trade negotiations are struggling, and the implementation of the Paris Agreement is encountering resistance. The spillover effects of policy adjustments are still fermenting. The world economy is entering a critical period of accelerated transformation of old and new dynamics, the game of interests and rules is becoming increasingly intense, and the external environment for emerging markets and developing countries is more complex and severe. As the largest developing country, China is also the representative of the fastest-growing economies of emerging markets and developing countries. Analyzing the actual economic development of China helps to interpret the economic model of emerging economies and clarify the changing trends of the international economic landscape, while helping to accelerate the development trend of emerging markets.
Since the reform and opening up, China’s economy has started from a state of shortage, and after more than 40 years of rapid growth and expansion of production capacity, the problem of material shortage in people’s lives has been solved. According to official Chinese data, China’s GNP per capita will be RMB 80,976 in 2021, reaching the income level of a medium-sized country. However, while China’s economy is growing rapidly, changes in the development environment and conditions at home and abroad have made it difficult for the traditional crude growth model of the Chinese economy, which relies on factor inputs, external demand-pull, investment drive, and scale expansion, to adapt to the demand for sustainable and healthy economic development, and the Chinese economy has revealed problems such as imbalanced development, low quality and efficiency, and insufficient innovation. At the same time, with the increase in income levels and the expansion of the middle-income population, the consumption structure is accelerating the high-end, service, diversification, and personalized direction of upgrading, and the expectations of product quality, quantity, and brand requirements are increasing at a scale that traditional production methods cannot fully meet. Based on these new changes and new features, the 19th Party Congress report pointed out that China’s economy has shifted from a high-speed growth stage to a high-quality development stage to promote China’s economic development quality change, efficiency change, and power change.
Since then, high-quality development has become a theme in China’s new era, which is different from the quality of economic growth [1,2,3]. Although both assess economic development from the perspective of “quality” [4], high-quality development includes not only economic factors, but also social and environmental factors [5], which can be understood as a kind of “high efficiency, fair and green sustainable development” aimed at meeting the growing needs of people for a better life, part of the highly efficient, equitable, and green sustainable development paradigm.
As the main body of the real economy, cultivating a group of enterprises with strong vitality, creativity, growth, and competitiveness will inevitably help achieve high-quality macroeconomic development [6]. State-owned enterprises occupy an important position in the Chinese economic system, and the problems of being large but not strong, large but not excellent, and large but not active due to the lack of owners [7] have become key factors limiting their high-quality development. To solve the development problems of state-owned enterprises, the 2013 Decision of the Central Committee of the Communist Party of China on Several Major Issues of Comprehensively Deepening Reform allowed cross-shareholding of state-owned capital, collective capital, and non-public capital, and encouraged the development of mixed-ownership enterprises with non-public capital holding. This round of equity mix aims to improve the ownership structure of SOEs, promote state-owned capital to become stronger, better, and larger, and then promote the high-quality development of SOEs [8]. Subsequently, the 2018 government work report also clearly stated that “SOEs should be at the forefront of high-quality development through reform and innovation”.
Thus, it is clear that the high-quality development of SOEs has become a major proposition in the new development stage of China’s economy, and the adjustment of the property rights structure has become important to promote the high-quality development of SOEs. Based on this background, it is of practical significance to assess the level of quality development of Chinese SOEs and to clarify the effect of SOE property rights structure on the level of quality development. On the one hand, as a representative of emerging markets and developing countries, China’s successful strategy of crossing the middle-income trap and quality economic development can provide experience for emerging economies. On the other hand, China’s SOEs’ mixed ownership reform strategy based on property rights structure adjustment is comparable to that of privately owned SOEs in developed countries. However, China’s reform strategy of SOEs’ mixed ownership system based on property rights restructuring is quite different from the privatization process of SOEs in developed countries, and it is also in an early and pilot position in developing countries.
At present, scholarly research on high-quality development revolves around the macro level and micro level. The research on macroeconomic high-quality development mainly contains connotation analysis [9,10,11], dynamics and mechanism analysis [12], target requirements and strategic paths [13,14], development level measurement [15], and analysis of the impact effects of industrial structure changes [16]. In the measurement of macroeconomic high-quality development, the validity of single indicators, such as total factor productivity [17], green total factor productivity [18], GDP per capita [19], and welfare carbon emission intensity [20], is controversial. Jin Bei pointed out that high-quality development has multidimensional and rich characteristics, and a composite evaluation index system should be constructed [9]. Subsequently, the new development concept of innovation, coordination, green, openness, and sharing and its connotation and extension became the guiding ideology for scholars to construct a composite evaluation index system for high-quality economic development [3,4,21].
Domestic and foreign scholars have researched the high-quality development of enterprises. According to Huang Soojian, high-quality enterprise development can be defined as the target state and development paradigm of enterprises pursuing high-level, high-quality, and high-efficiency economic and social value creation, as well as shaping excellent sustained growth and sustained value creation quality capabilities among enterprises [6]. Chen Z. et al. [22] used total factor productivity and Chen L. et al. [19] used a single indicator such as economic value added (EVA) to replace the level of high-quality enterprise development. Gradually, some scholars also try to construct a composite evaluation index system for high-quality enterprise development. Zhang Tao constructed an integrated macro and micro index system covering the measurement of high-quality enterprise development level based on six dimensions: innovation, green, openness, sharing, efficiency and risk prevention, and control [11].
In addition, regarding the determination of the weights of the high-quality development index, scholars mostly use the subjective assignment method [11] or the principal component analysis method [23] and the entropy method [24] in the objective assignment method. The subjective assignment method is to assign indicators according to the researcher’s experience, and the evaluation results are not objective enough. The principal component analysis is relatively objective, but the extracted principal components are often difficult to meet the actual situation, the realistic meaning of indicators is weakened, and the meaning of indicator weights is difficult to interpret. The entropy method relies on the objective data’s characteristics for assignment, which is more applicable to static evaluation and not applicable to panel data assignment.
In summary, scholars in the past have conducted in-depth discussions on the connotation analysis and level measurement of high-quality development, which laid the foundation for this study. However, there are four shortcomings in the current research on the high-quality development of enterprises: (1) it is difficult to quantify some indicators in the measurement of high-quality development of enterprises, such as openness and sharing. (2) scholars lack dynamic panel applicability and time comparability in the measurement of high-quality development index. (3) the current research has not yet clarified the effect of the property rights structure of SOEs on the level of high-quality development. (4) current research has not clarified the effect of SOE ownership structure on the level of quality development. Based on the above-mentioned problems, this paper combines today’s rapidly developing artificial intelligence technology to build a model by using machine learning algorithms, thus greatly reducing the subjectivity brought about by manual data selection and ensuring that the research results have a certain degree of objectivity. At the same time, this method has advantages for modeling big data, which makes the research of this paper generally meaningful.
To address the above issues, we took Chinese SOEs as the research object and aimed to remedy the shortcomings of existing studies through the research idea shown in Figure 1.
In this work, we used an integrated learning model to investigate the impact of changes in the ownership structure of SOEs on the level of high-quality development [25]. Indicators were selected based on the equity mix perspective, and quantifiable indicators were selected from three perspectives: social responsibility, efficiency, and innovation. To ensure that the indexes of SOEs’ high-quality development levels are comparable over time, the data were standardized using the fixed-base efficacy coefficient method with 2008 as the base period, and the dynamic panel data were assigned weights using the longitudinal and cross-sectional pull-out gearing method. Finally, based on the prediction results of the integrated learning model, management conclusions and suggestions were obtained to improve the property rights structure of SOEs and enhance the level of high-quality development of SOEs.

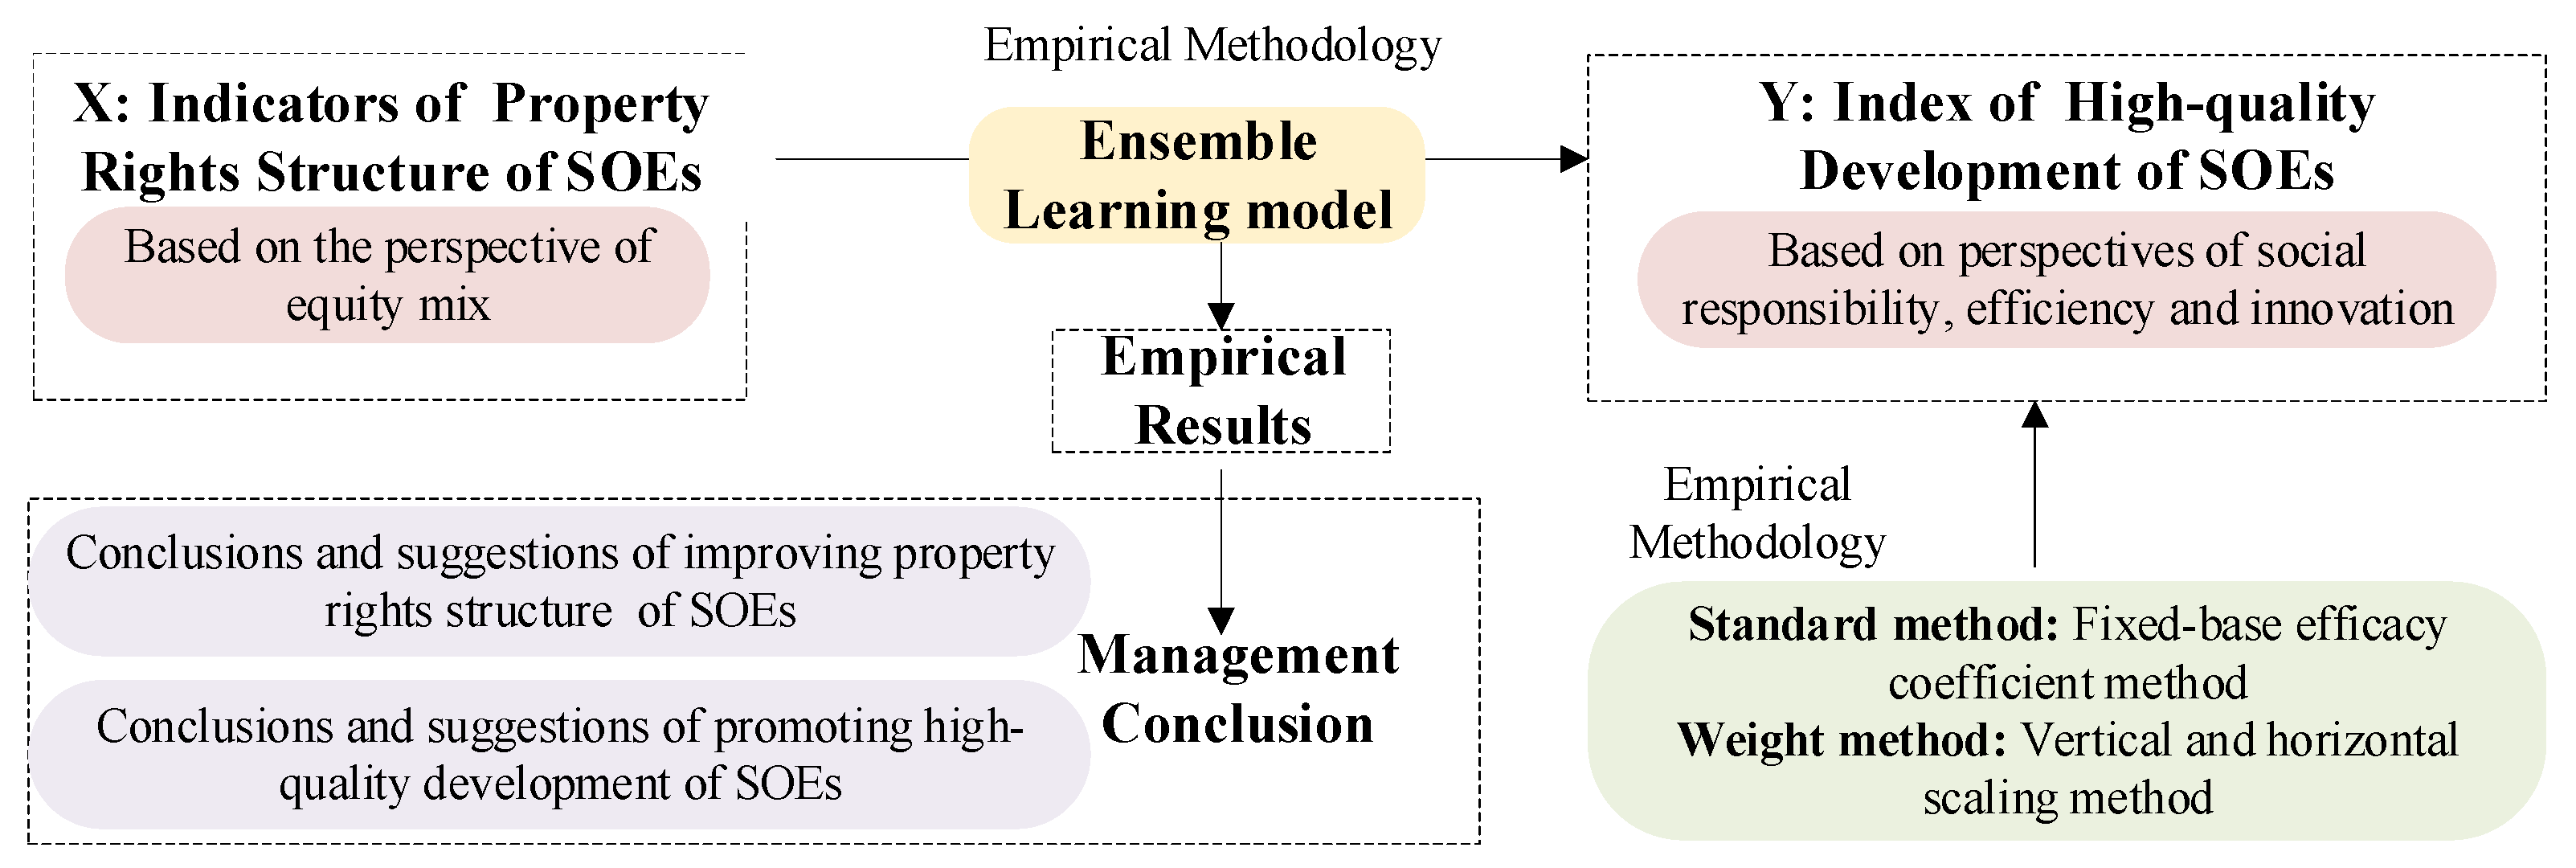
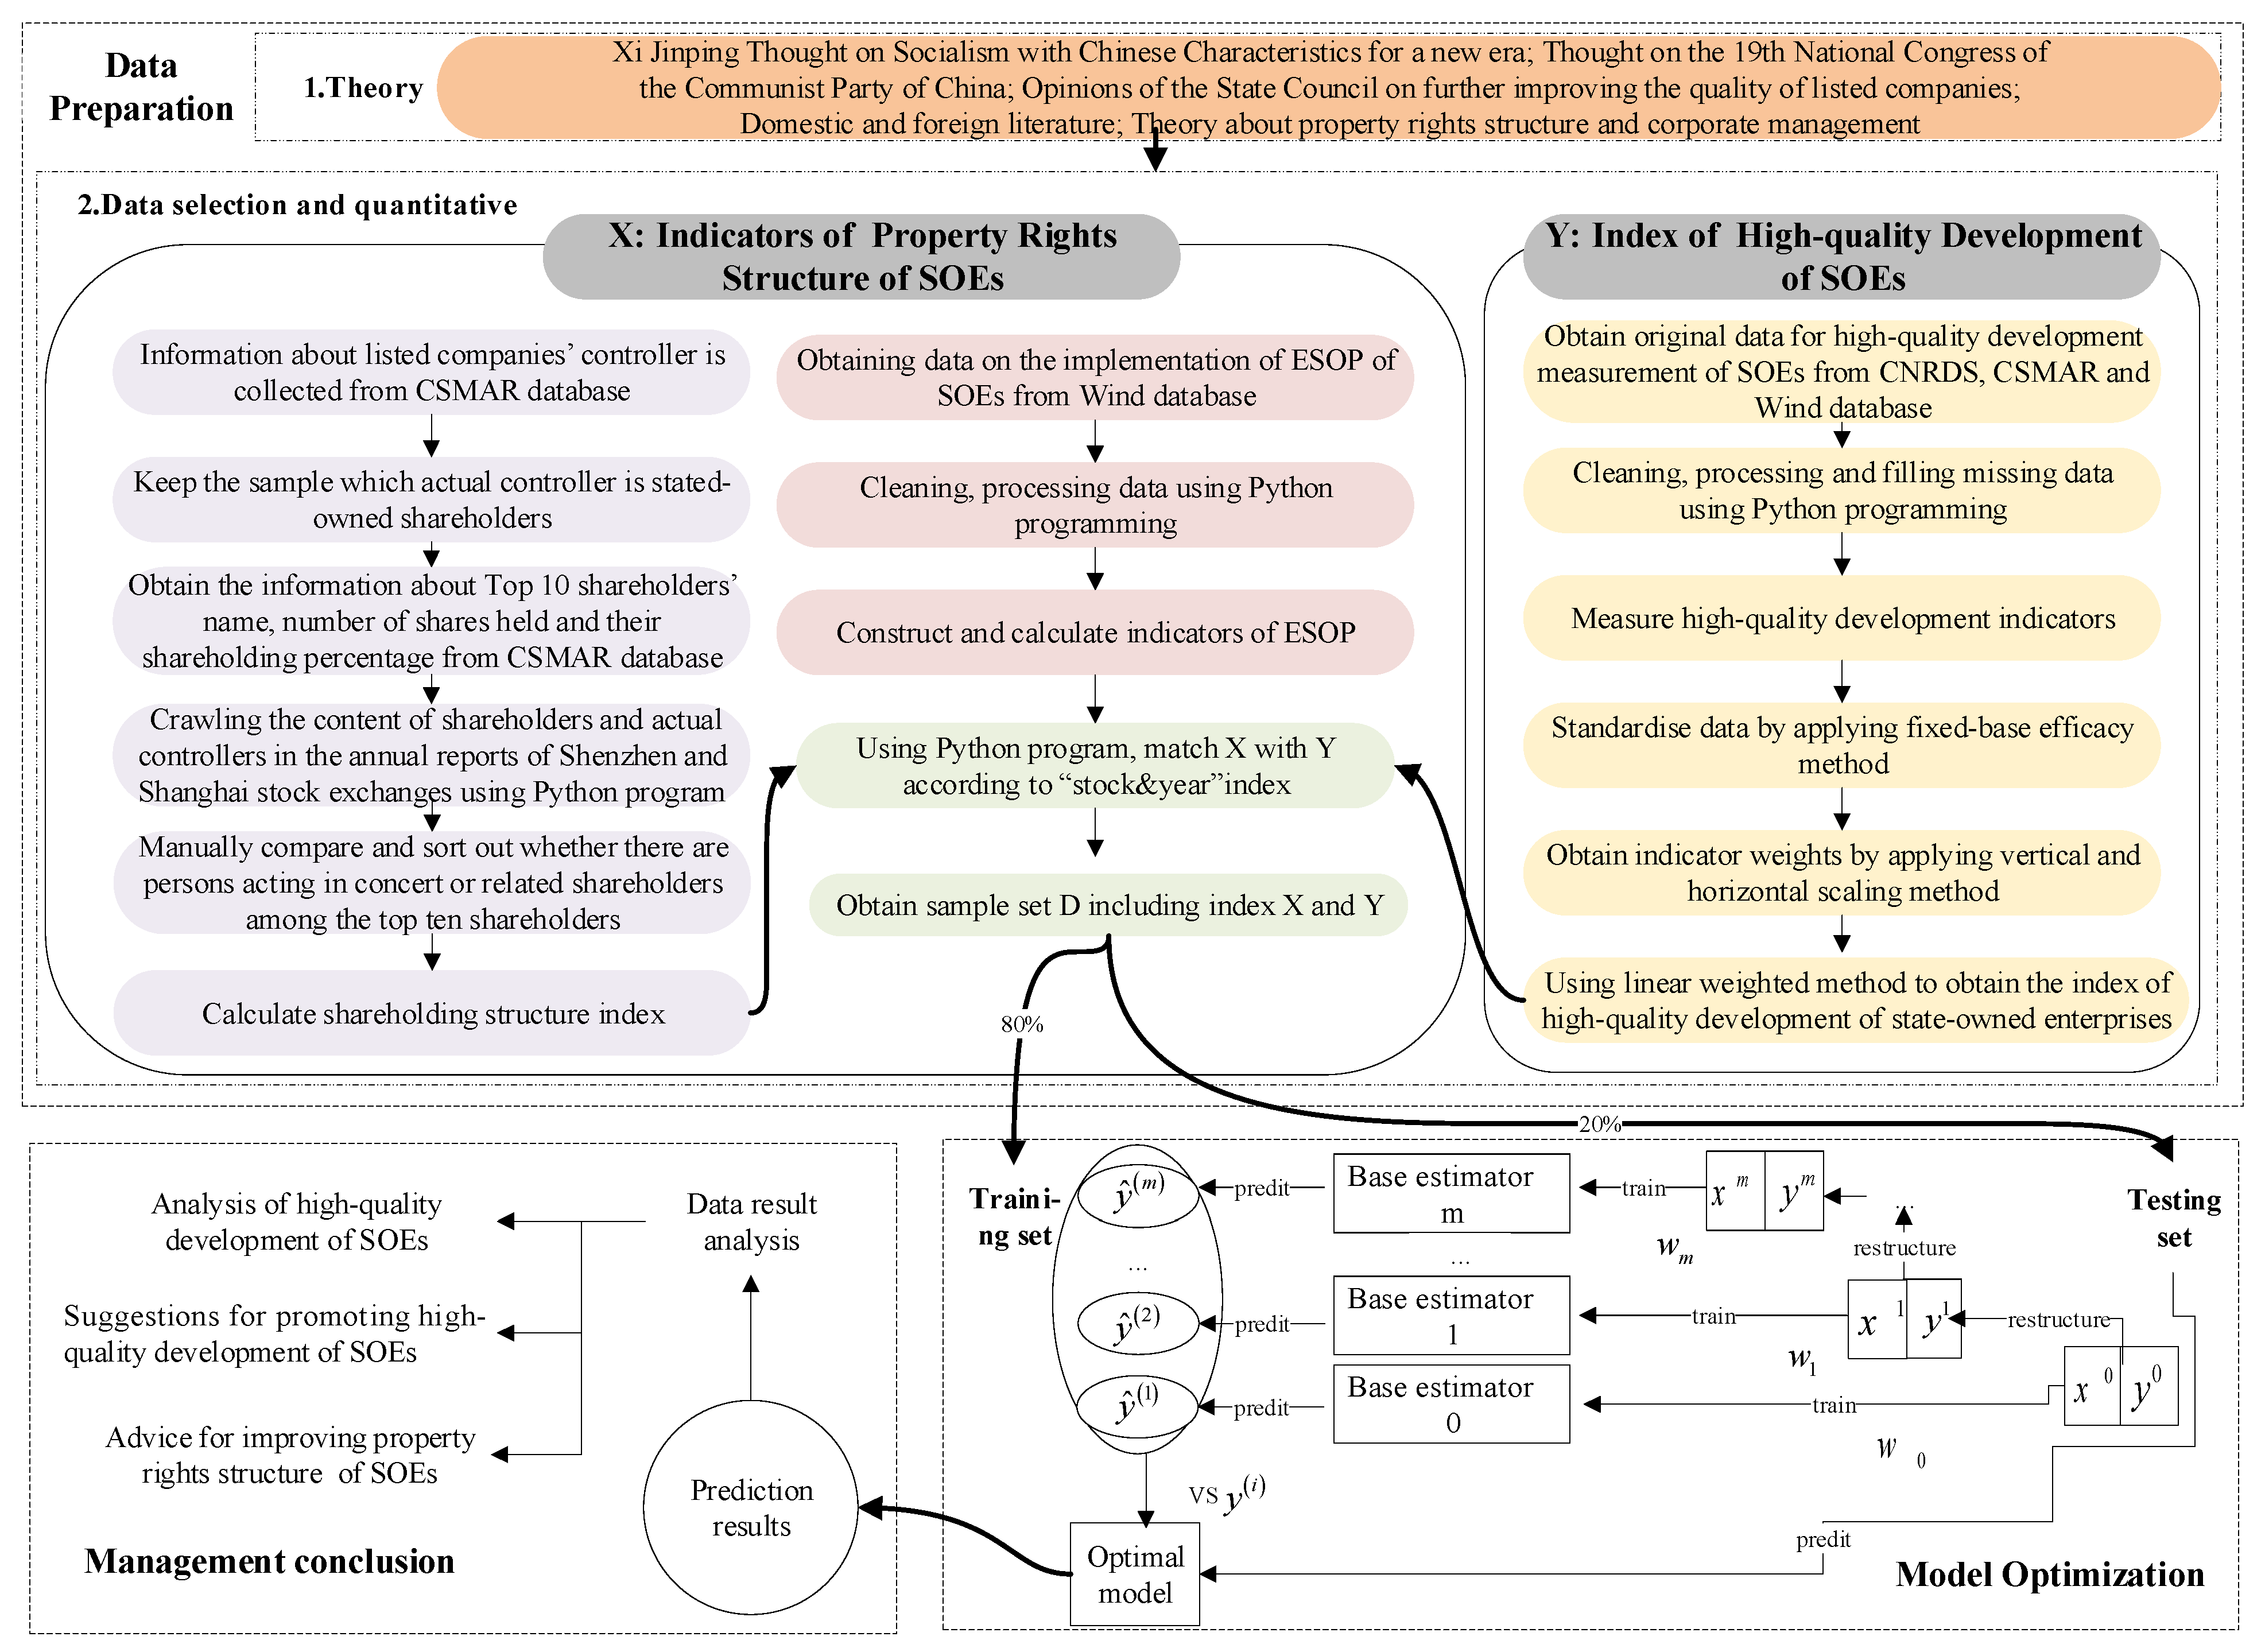
2. Research Methodology

2.1. Integrated Learning Model

Based on the way to continuously assign new weights to the original dataset, multiple base models were obtained, and by setting the model finding conditions, all base models were aggregated to finally obtain the optimal model and perform prediction analysis. The model derivation process is as follows. The basis is the Taylor expansion formula of Equation (1).
f ( x + Δ x ) f ( x ) + f ( x ) Δ x + 1 2 f ( x ) Δ x 2
The learning model target value y ^ i for the integrated CART tree can be explained by Equation (2).
y ^ i = k = 1 K f k x i , f k Tree
where Tree refers to CART tree. When no CART tree is integrated, the target value y ^ i ( 0 ) = 0. When 1 tree, 2 trees …… t trees are integrated, the target values are as follows, in order.
y ^ i 1 = f 1 x i = y ^ i 0 + f 1 x i y ^ i 2 = f 1 x i + f 2 x i = y ^ i 1 + f 2 x i y ^ i t = k = 1 t f k x i = y ^ i t 1 + f t x i
where y ^ i ( t ) is the target value of the model in round t, y ^ i ( t 1 ) is the target value of the model in the previous t − 1 round, and f k x i is the new function added in round t. For each regression tree, the model can be rewritten as Equation (4).
f k ( x ) = w q ( x ) , w R T , q : R d { 1 , 2 , , T }
where w is the leaf node score value and q(x) denotes the leaf node corresponding to sample x. T is the number of leaf nodes in the tree. The tree complexity is solved in Equation (5).
Ω f t = γ T + 1 2 λ j = 1 T ω j 2
Based on Equation (5), the objective function can be further modified to Equation (6).
O b j = i = 1 n l y i , y ^ l t + i = 1 t Ω f i = i = 1 n l y i , y ^ l t 1 + f t x i + Ω f t + constant
In the above equation, l y i , y ^ l t is the error function between the true value and the predicted value, aiming to find fk to minimize the objective function.
g i = y ^ t t 1 l y i , y ^ 2 t 1 , h i = y ^ t t 1 2 l y i , y ^ t t 1  
At this point, the approximate objective function is obtained based on the Taylor expansion (1), as in Equation (8).
Obj t i = 1 n l y i , y ^ t t 1 + g i f t x i + 1 2 h i f t 2 x i + Ω f t + constant
where l y i , y ^ t ( t 1 ) is the error value between the true value and the predicted value in the previous period, which is a constant term by default and can be combined with the constant term. Finally, the objective function is simplified as follows.
Obj t i = 1 n g i f t x i + 1 2 h i f t 2 x i + Ω f t  
If the objective function is transformed from traversing on samples to traversing on leaf nodes, the following solution formula can be obtained.
O b j t i = 1 n [ g i w q x i + 1 2 h i w q 2 x i ] + γ T + 1 2 λ j = 1 T ω j 2     = i l j g i w j + 1 2 i I j h i + λ ω j 2 + γ T
If further ordered,
G j = i l j g i ,   H j = i I j h i
It can then be organized to obtain
Obj ( t ) = G j w j + 1 2 H j + λ ω j 2 + γ T
Taking the first-order partial derivative of w j in Equation (12) above, it can be organized as follows.
Obj ( t ) w j = G + H j + λ w j = 0
It can then be organized to obtain
w j = G j H j + λ
Substitute Equation (14) back into Equation (12) to obtain the final objective function.
Obj = 1 2 j = 1 T G j 2 H j + λ + γ T

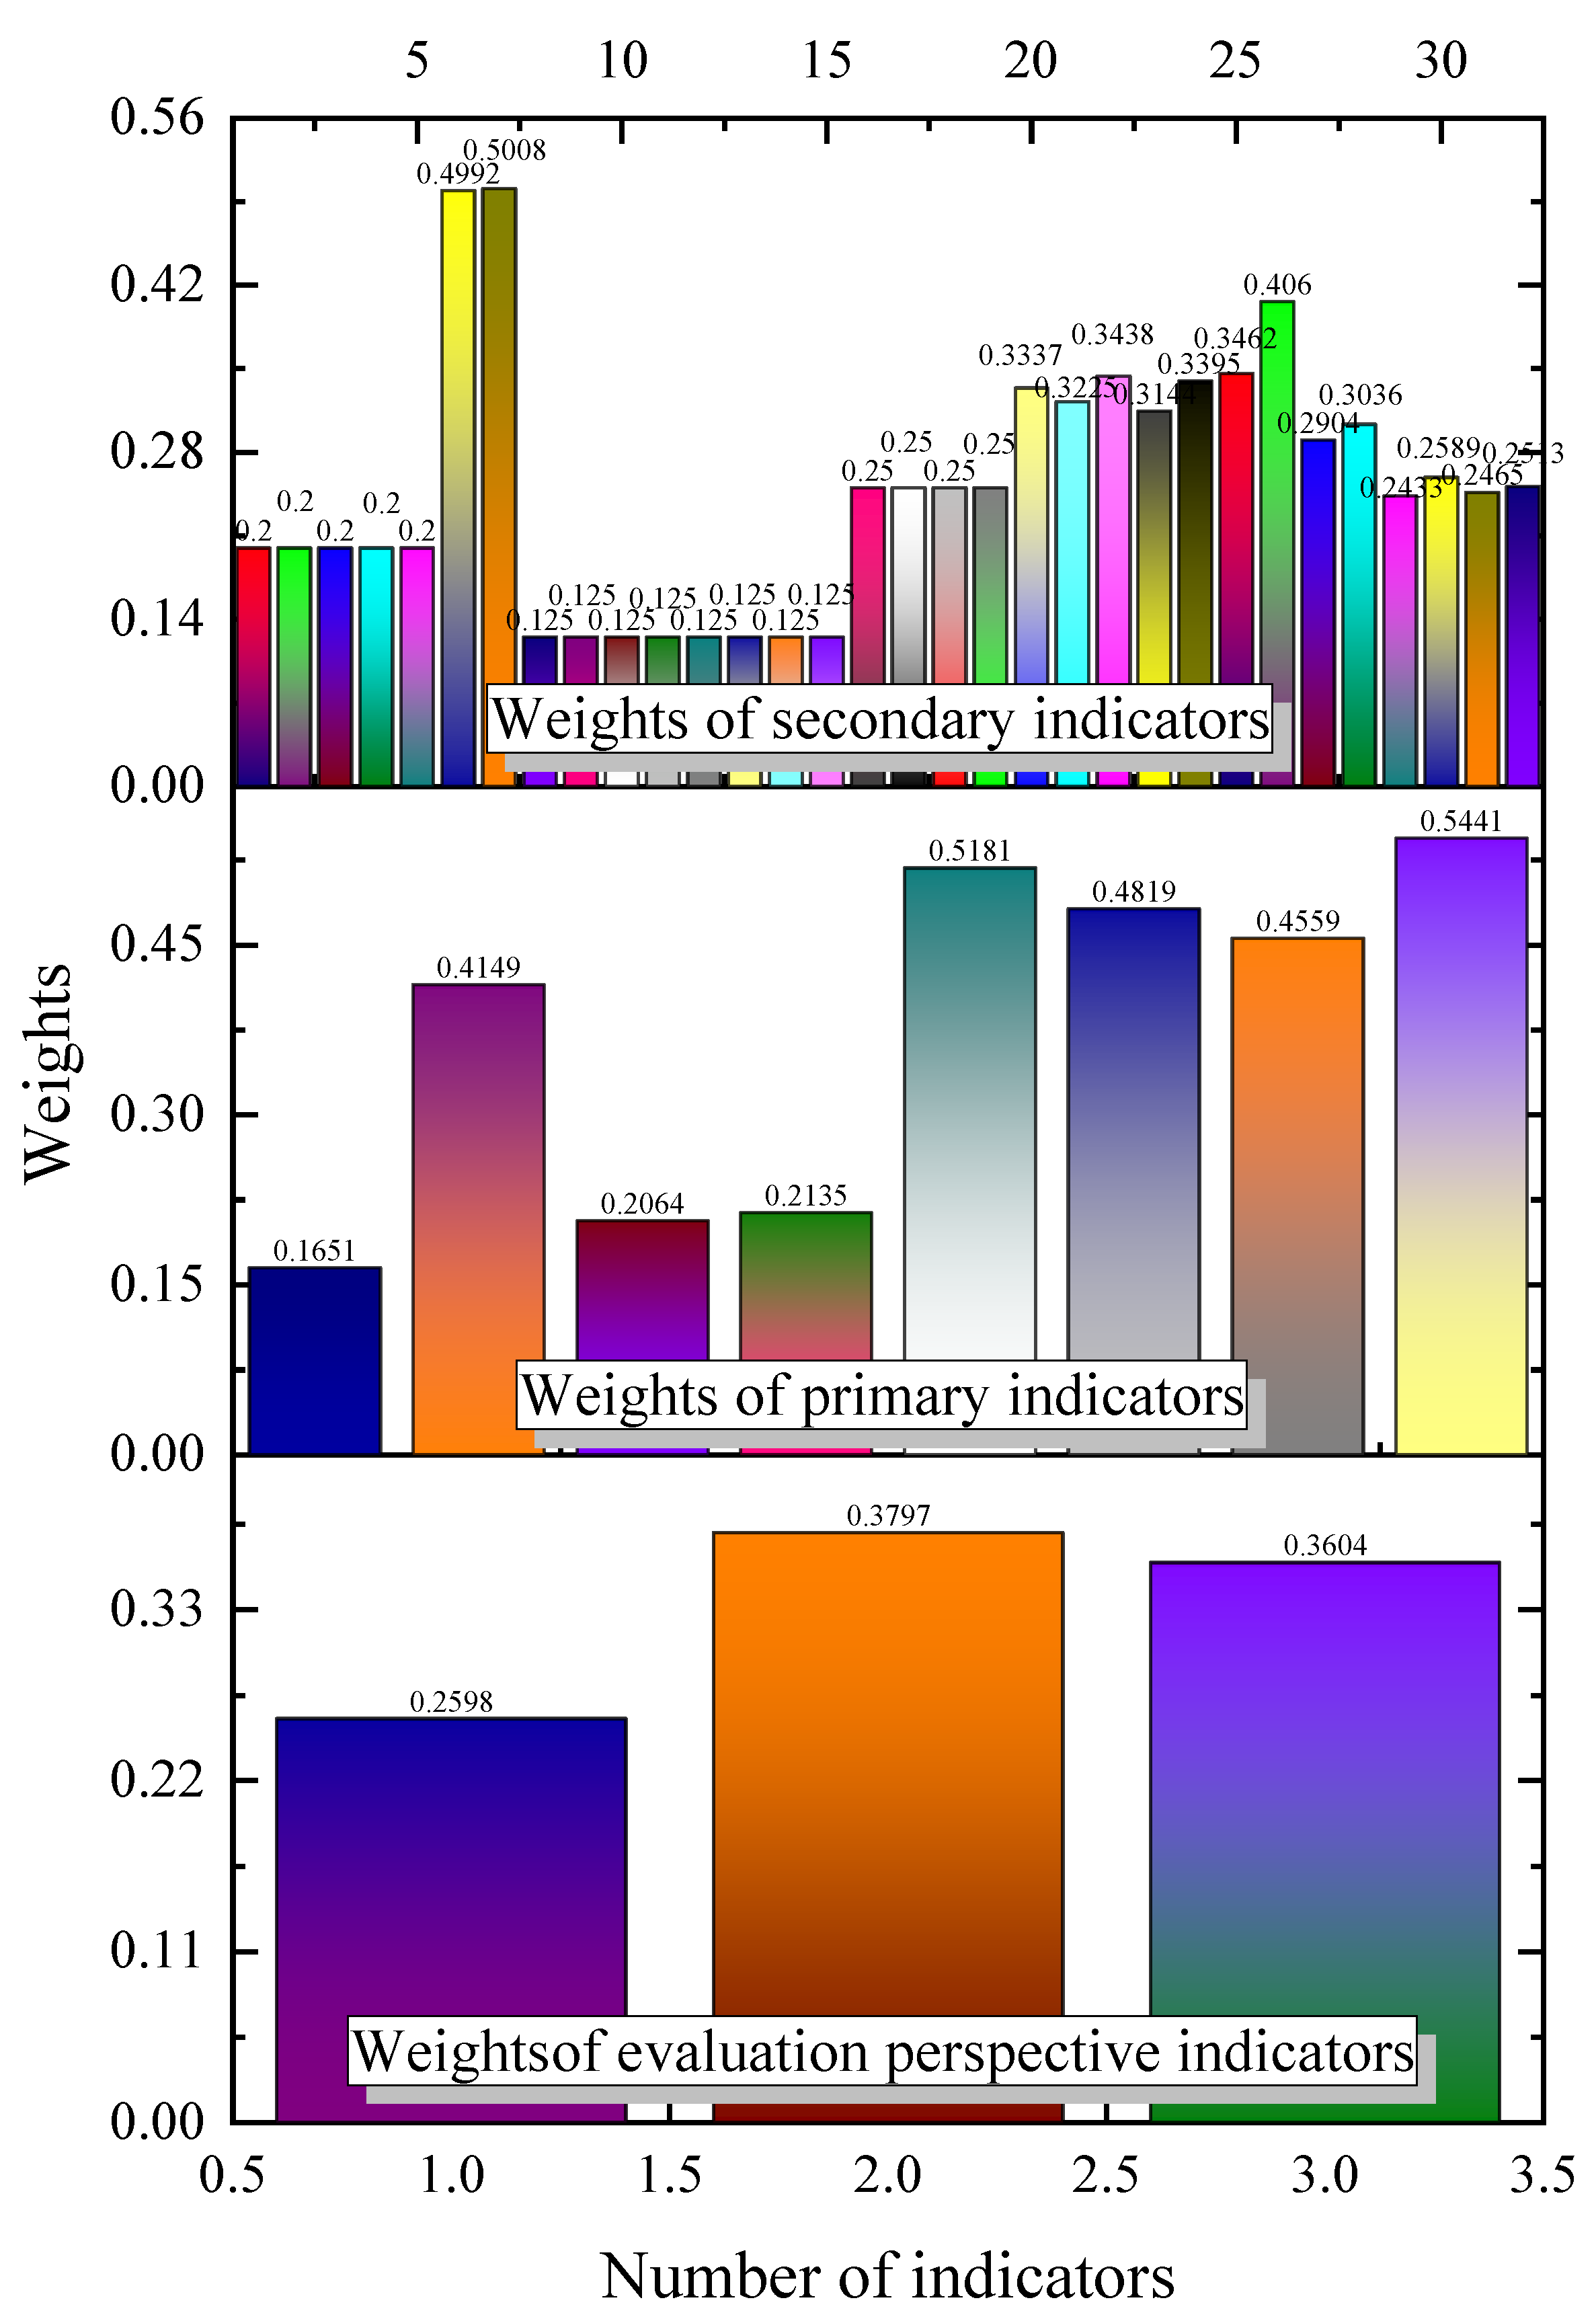
2.2. Base-Effectiveness Coefficient Method

To ensure that the QDI is comparable across years, the 2008 base period was used to standardize the data using the fixed-base efficacy coefficient method, with the following formula.
s i j t k = 10 × max x j t 1 x i j t k max x j t 1 min x j t 1 x j   is   a   positive   indicator 10 × x i j t k min x j t 1 max x j t 1 min x j t 1 x j   is   a   inverse   indicator  
where x i j t k and s i j t k denote the original and normalized values of the j-th indicator of the i-th stock in the year t k , respectively, and max x j t 1 and min x j t 1 denote the maximum and minimum values of the j-th indicator of all stocks in the base period 2008, respectively.

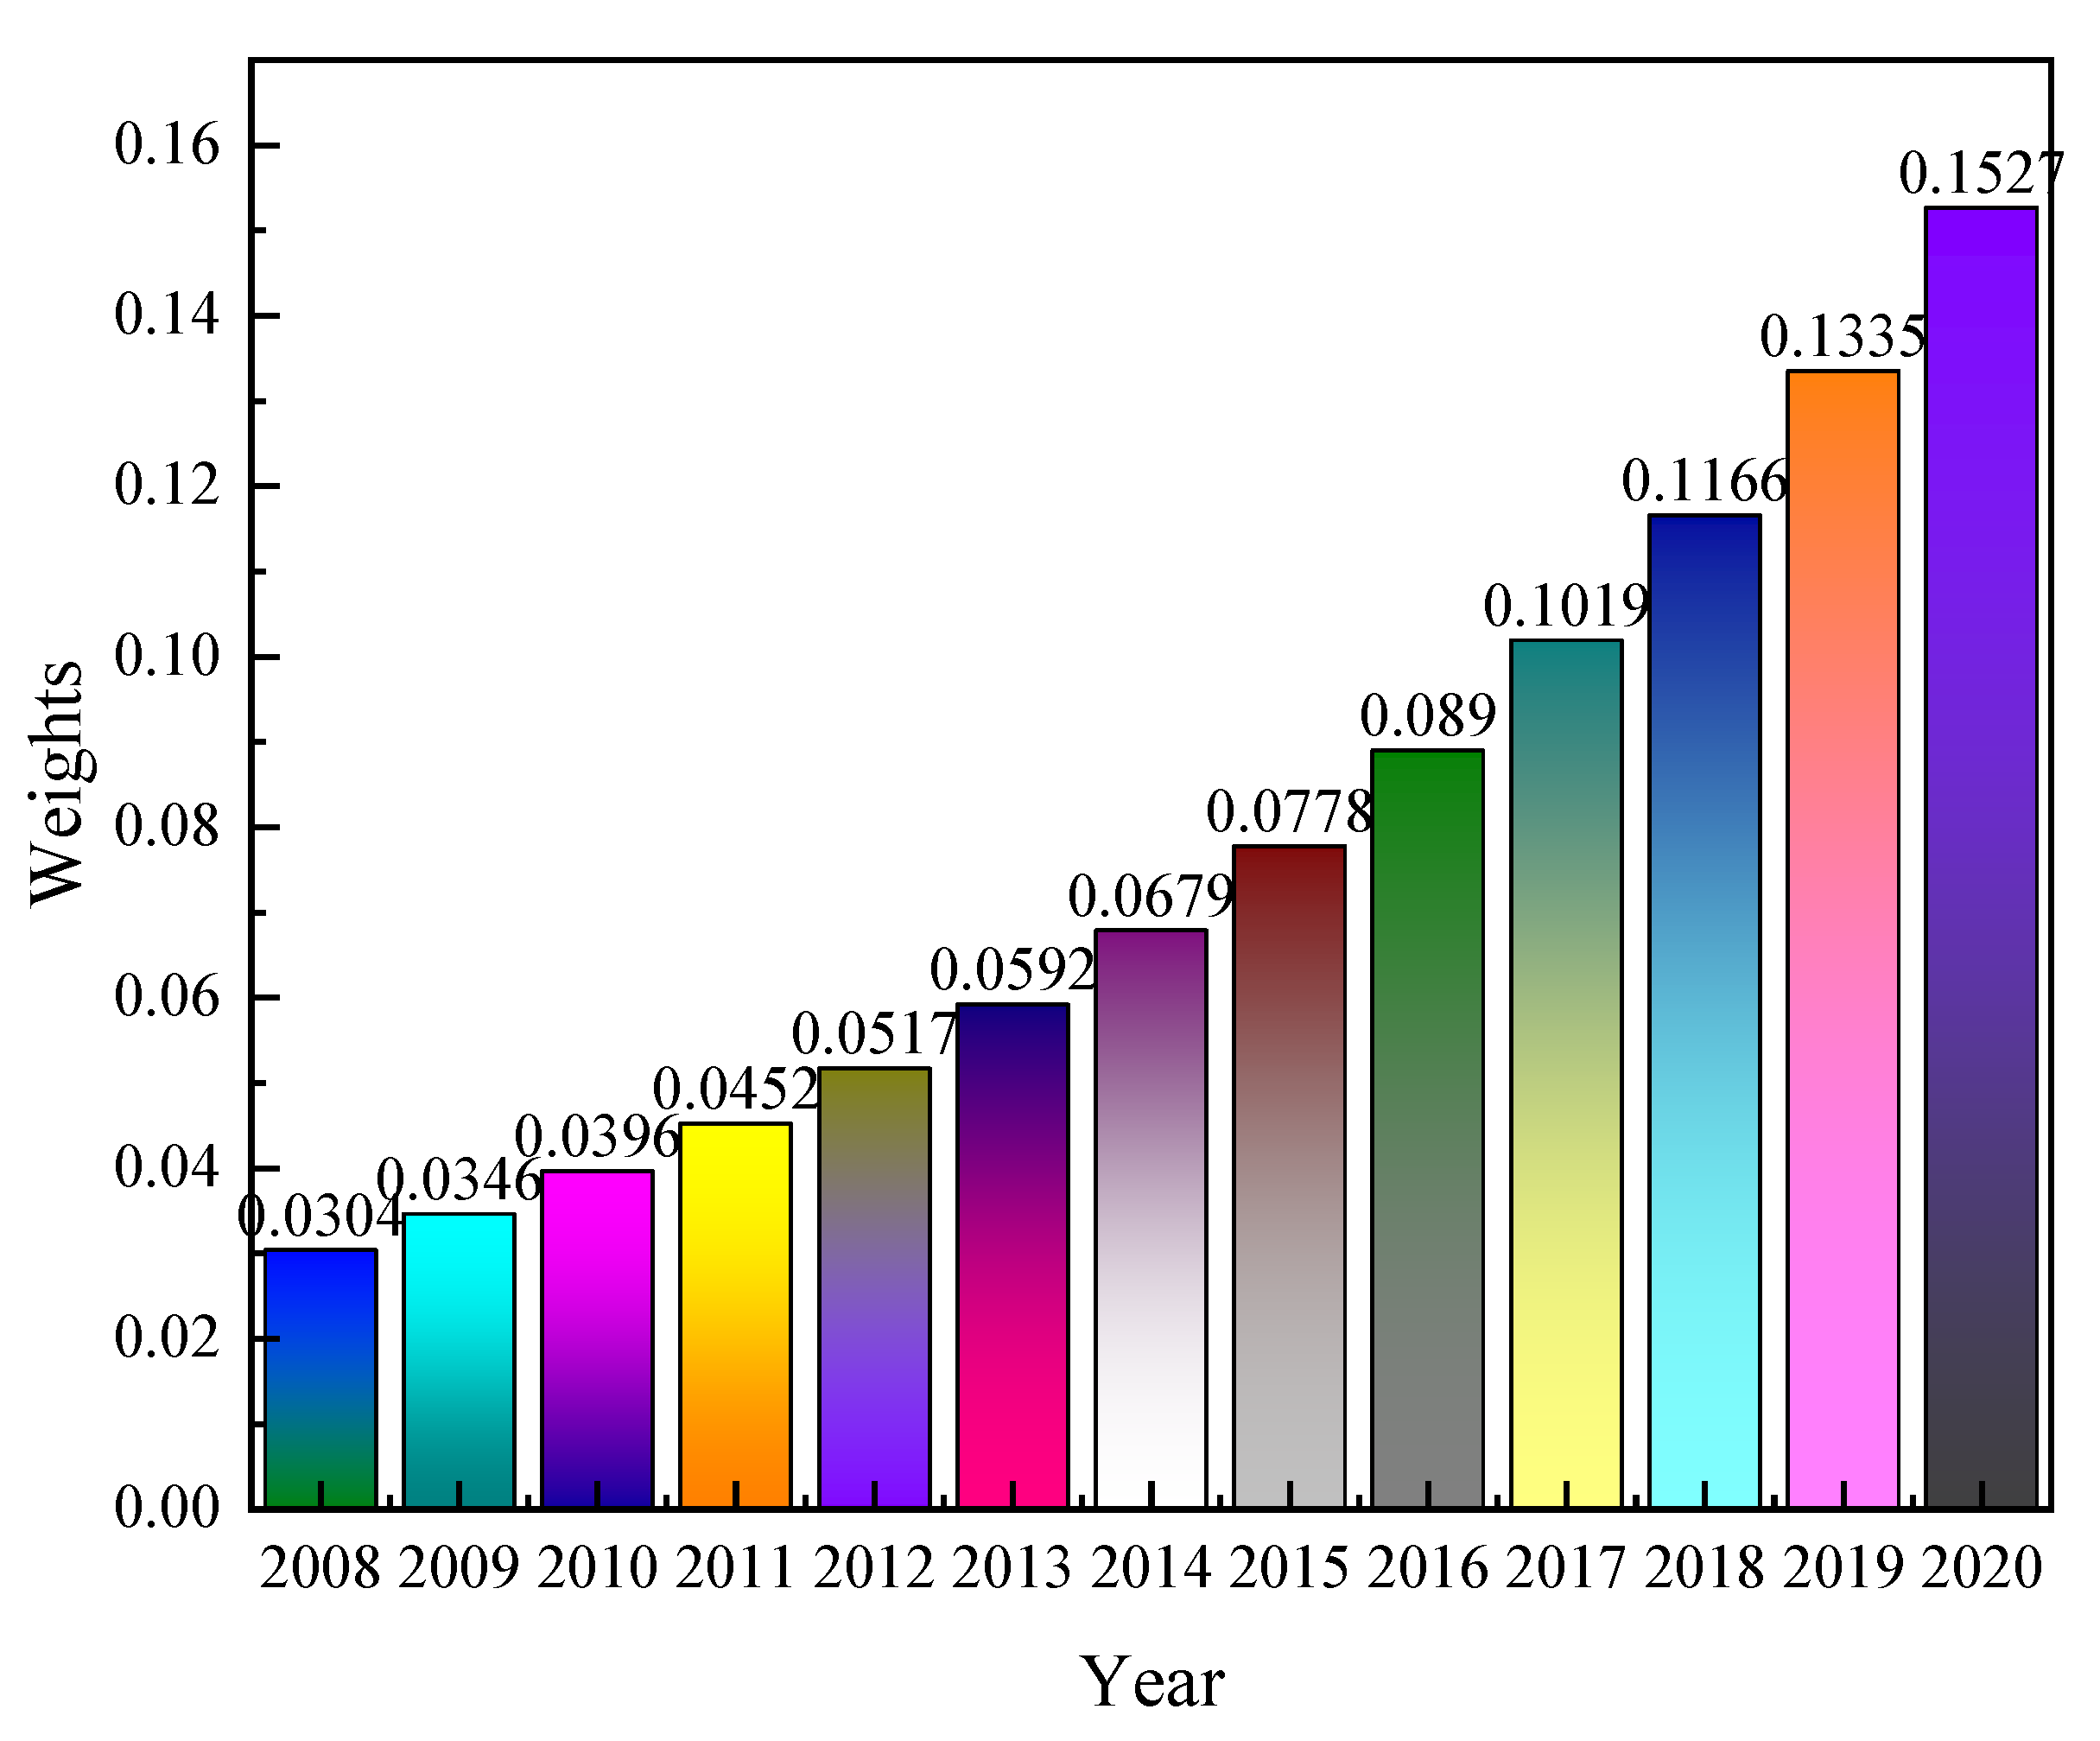
2.3. Longitudinal Pull-Out Method

To reflect the differences among the evaluated objects to the greatest extent and to realize the panel data weighting, the principle of the longitudinal pull-out method is as follows: with n evaluated objects s 1 , s 2 , s 3 , , s n , and m rating indicators x 1 , x 2 , x 3 , , x m , in the time order t 1 , t 2 , … form the time-series stereo data { x i j t k }—see Table 1, where k = 1 , 2 , , T ; i = 1 , 2 , , n , and { x i j t k } is the standard data processed by dimensionless processing.
To accurately evaluate s 1 , s 2 , s 3 , , s n , the weight coefficient w j of x m needs to be determined (it is generally required that w j > 0 and w 1 + ⋯ + w m = 1). The comprehensive evaluation problem supported by the time-series stereo data table can be expressed by the following equation.
y i t k = F ω 1 t k , ω 2 t k , , ω 2 t k ; x i 1 t k , x i 2 t k , , x i m t k
where y i t k is the integrated evaluation value at moment t k . Further evolving into the integrated evaluation function of Equation (18),
y i t k = ω j x i j t k , k = 1 , 2 , , T ; i = 1 , 2 , , n
The principle of determining the weight coefficients w j (j = 1, 2, …, m) is to reflect the maximum possible differences between the evaluated objects in the time-series stereo data table, while the overall differences of s 1 , s 2 , s 3 , , s n in the time-series stereo data table { x i j t k } can be described by the total sum of squared deviations of y i t k .
e 2 = k = 1 T i = 1 n ( y i t k y ¯ ) 2
It can be obtained by normalizing the raw time-series stereo data.
y ¯ = 1 T k = 1 T 1 n i = 1 n j = 1 m ω j ω j x i j t k = 0
e 2 = y i t k 2 = k = 1 T W f H k W = W f k = 1 T H k W
With W = ω 1 , ω 2 , ω m f , H = H k for m     m order symmetric matrix, and H k = X k f X k ( k = 1 , 2 , , T ) , the following can be obtained:
X k = x 11 t k x 1 m t k x n 1 t k x n m t k , k = 1 , 2 , , T
When W is the eigenvector corresponding to the largest eigenvalue of the matrix H = H k , e 2 takes the maximum value. By the linear algebra Frobenius theorem, if H k > 0 , ( k = 1 , 2 , , T ) , there must be H > 0 and the weight coefficient W vector is positive after the normalization process. When H k > 0 , ( k = 1 , 2 , , T ) , the rankings of s 1 , s 2 , s 3 , , s n obtained by applying the horizontal pull-out gearing method and the vertical pull-out gearing method, respectively, are the same at the moment t k . When there is some k such that there are negative elements in H k , the above conclusion does not hold and W can be solved by the following planning problem.
M a x W f H W     s . t . W = 1 ;    W > 0

3. Research Progress Design

The main research content of this paper can be divided into three parts: data pre-processing, model construction, optimization, and conclusion, and the specific research steps are shown in Figure 2.
Data pre-processing. Based on Xi Jinping’s thought of socialism with Chinese characteristics, the report of the 19th National Congress and the “Opinions of the State Council on Further Improving the Quality of Listed Companies” (hereinafter referred to as “Opinions”), after combing the existing literature and related theories, we analyzed the connotation of high-quality development of SOEs and selected indicators to measure the property rights structure and high-quality development level of SOEs, and the data acquisition and calculation process of indicators are shown in Section 4.2 and Section 4.3. After that, the data were matched with the indexes of quality development level based on the indexes of “stock” and “year” by Python method, and the sample set D was obtained.
Model construction and optimization. An integrated learning model was used to investigate the impact of changes in ownership structure on the level of quality development of SOEs. For this, 80% of the data in sample set D were used for training and 20% were used for prediction, and the optimal prediction model was obtained by setting the model optimizing conditions. Subsequently, concerning the maximum and minimum values of X in sample set D, the change in the level of high-quality development of SOEs Y is predicted when X varies in a certain range in the form of random numbers, and the proportion setting when the effect of each X to raise the value of Y is optimal is explored.
Conclusion. By analyzing the measurement and prediction results, we summarize the current situation of high-quality development of SOEs, and provide management suggestions for the optimization of SOEs’ property rights structure and the enhancement of high-quality development level.

4. Data Screening and Indicator Construction

4.1. Theoretical Compendium

(1)
Theoretical combing of high-quality development of state-owned enterprises
As the core requirements for the high-quality development of China’s economy, the five development concepts of innovation, coordination, green, openness, and sharing are also the basic guidelines for the high-quality development of state-owned enterprises. From the perspective of innovation development, SOEs should vigorously promote the innovation-driven strategy; realize the change in enterprise development momentum; strive to emerge in the new round of scientific and technological revolution and industrial revolution; uphold the 19th National Congress ideology; promote the deep integration of Internet, big data, artificial intelligence, and the real economy; and then cultivate global competitiveness. From the perspective of green development, state-owned enterprises should follow the development trend of industrial greening; vigorously implement green production, green manufacturing, and green management; reduce energy and resource consumption per unit of product; reduce environmental damage throughout the life cycle; and build into resource-saving and environment-friendly enterprises. From the perspective of shared development, on the one hand, we should deepen the reform of state-owned enterprises in monopolistic industries, eliminate the barriers to entry to the greatest extent possible, and promote the sharing of development opportunities and reform dividends between state-owned enterprises and private enterprises; on the other hand, state-owned enterprises should actively fulfill their social responsibilities, participate in solving social problems, create shared values, and form a new pattern of development in which enterprises and social benefit and prosper together.
The core requirements of high-quality economic development are mapped onto SOEs, which means that SOEs should achieve high-level endogenous development momentum, high-level comprehensive output efficiency, highly adapted operational efficiency, highly recognized quality products and services, and highly recognized social value concept of shared benefits. In this paper, following Nie Changfei’s research idea of high-quality macroeconomic development, high-quality development is defined as “five high and one good” [26], referring to high innovation ability, high product and service quality, high economic efficiency, high social efficiency, high ecological efficiency, and good economic operation status. The evaluation indexes are more scientific and accurate.
(2)
Theoretical arrangement of property rights structure of state-owned enterprises
The report of the 19th National Congress indicates that China’s economy has entered the stage of high-quality development, and the reform of the economic system must focus on improving the property rights system to achieve effective incentives for property rights and the elimination of superiority and inferiority of enterprises. On 9 October 2020, the Opinions also pointed out that we should encourage and support the listing of pilot enterprises of mixed ownership reform, and play the active role of equity investment institutions in promoting the optimization of corporate governance, innovation and entrepreneurship, and industrial upgrading. At the same time, we support state-owned enterprises to carry out mixed-ownership reform by relying on the capital market; improving the equity incentive and employee stock ownership system of listed companies; making more flexible arrangements in terms of objects, methods, and pricing; strengthening the sharing of benefits between workers and owners; better attracting and retaining talents; and fully mobilizing the enthusiasm of employees of listed companies. In summary, the new round of SOE ownership structure reform aims to enrich the types of SOE equity, bring into play the enthusiasm of non-public equity, improve corporate governance, and enhance corporate efficiency to help SOEs develop with high quality. Therefore, we selected indicators to measure the change in SOEs’ ownership structure based on the perspective of equity mix.

4.2. Indicator Selection

(1)
Selection of indicators for high-quality development of SOEs
Innovation capacity. This paper quantifies the independent innovation capability of SOEs from two perspectives: innovation input and from innovation output. Innovation input includes three indicators: the proportion of R&D expenditure to main business income, the proportion of R&D personnel to company employees, and the proportion of master and doctoral personnel. Innovation output includes four indicators: the number of patents cited, the number of patents granted, the proportion of invention patents, and the degree of digital transformation of SOEs in the context of the digital economy.
Product and service quality. This paper evaluates the five parts of SOEs’ product quality assurance system, product honors obtained, the existence of product disputes, after-sales service, and customer satisfaction surveys.
Economic efficiency. In this paper, total factor productivity and economic value added are selected to characterize the economic profitability of SOEs.
Social benefits. State-owned enterprises should contribute to society through social value creation on the one hand, and pay attention to stakeholders on the other. In this paper, the CSR report’s comprehensiveness, the number of pages of the report, whether there is a CSR column in the company’s annual report and CSR reliability assurance, and the proportion of total social donation and income tax to a profit of SOEs are selected to measure the social benefits of SOEs from two perspectives: CSR report and public welfare tax.
Eco-efficiency. To examine the performance of SOEs in energy conservation and emission reduction and participation in environmental management, eight indicators were selected to measure the amount of environmental protection: environmental investment, green office, environmental certification, environmental recognition, energy saving, the implementation of three waste-reduction measures, environmental penalties, and pollutant emissions.
Economic operation status. The operating status of the state-owned economy depends on the operational efficiency of SOEs, which requires SOEs to focus on operational capability, so three indicators are selected to measure the operating status of SOEs: total asset turnover rate, inventory turnover rate, and fixed asset turnover rate.
According to the requirements of the 19th Party Congress Report and the Opinions, CSR should include responsibilities to shareholders, creditors, employees, customers, communities, and the environment. Therefore, the product and service quality in the above analysis reflects the responsibilities of SOEs to customers and can be included in the general framework of social responsibility, and eco-efficiency reflects the responsibilities of SOEs in the environment and can also be included in the general framework of social responsibility. After summarizing and organizing, this paper finally selects a total of 8 primary and 32 secondary indicators from three aspects—social responsibility, effectiveness and efficiency, and independent innovation—and the specific evaluation perspective, indicator name, indicator interpretation, and attributes are shown in Table 2.
(2)
Selection of indicators of SOEs’ ownership structure
The change in the ownership structure of SOEs is mainly due to the entry of private capital into SOEs after the reform of the SOE system, which leads to the change in the equity structure of SOEs, so the indicators representing the depth and mix of non-state equity involvement are selected for investigation. In particular, the internal employee shareholding of SOEs realized by employee stock ownership plan, which belongs to non-state equity, will also change the equity structure of SOEs to some extent. With reference to existing studies [27,28,29,30,31,32,33] a total of eight indicators measure the changes in the ownership structure of SOEs: the shareholding ratio of the first largest non-state shareholder (shr1th), the shareholding ratio of all non-state shareholders among the top ten shareholders (shrt), whether the first largest non-state shareholder is the controlling shareholder dummy variable (k1th), the type of shareholding among the top ten shareholders (catg), the degree of equity checks and balances (ebal), the employee stock ownership plan implementation dummy variable (esop), employee stock ownership plan implementation equity ratio (imprat), and number of implementation (esopnum). The type of equity covers four categories: state-owned shareholders, private shareholders (domestic non-state-owned enterprise legal persons, domestic natural persons), foreign shareholders (foreign enterprise legal persons, foreign natural persons), and others. If there is only one type of shareholder, the value is 1. If there are two types of shareholders, the value is 2, and so on. The range of shareholding types is 1–4, and the specific indicators are shown in Table 3.

4.3. Indicator Quantification

(1)
Data source
Among the listed SOEs, most of them are invested in by different investment institutions. From the results of previous studies, it can be found that the average exit time of investment institutions in the investment process is about 1 year. This implies that there is a time lag for firms to obtain performance, which also imposes a lag in agency costs. Therefore, given that the current latest sample data are from 2021, with a one-year lag time, the final time interval chosen was 2008–2020. This paper selects a sample of enterprises whose actual controllers are state-owned from 2008 to 2020, excluding PT, ST, and financial and real estate enterprises. The data were mainly obtained from CNRDS, Wind, and CSMAR databases, and the original data were cleaned, processed, and further calculated based on Python. For a small number of missing values in the sample data, this paper uses the arithmetic average method to fill in the missing values, which means the arithmetic average of the two periods before and after the missing values, and if there is still a missing period before and after the missing values, the value of the non-missing side in the before and after period is used to fill in the missing values. In order to make the constructed evaluation indices comparable at both time and individual levels, only balanced panel observations are retained in this paper, and the sample of SOEs listed after 2008 is deleted.
Step 1: Download the top ten shareholders’ files from CSMAR database to obtain the shareholder names, shareholding numbers, and shareholding ratios. Step 2: Crawl the textual content of the annual reports disclosed by SOEs on Shenzhen and Shanghai stock exchanges about shareholders and actual controllers based on Python, and manually compare and sort the top ten. Step 3: Obtain the implementation data of the employee stock ownership plan of the sample SOEs from the Wind database until 31 December 2020, and construct the index values of the employee stock ownership plan.
The process of obtaining the values of the indicators for the evaluation of high-quality development of SOEs is as follows. Step 1: Download the raw data from CNRDS, CAMAR, and Wind Financial Research Database. Step 2: Standardize the raw data of the indicators by applying the method of fixed-base efficacy coefficient. Step 3: Determine the weights of the indicators by applying the method of pulling out the grades in vertical and horizontal directions. Step 4: Weight the data of each indicator. Step 4: Weight the data of each indicator to construct the index value for measuring the level of high-quality development of SOEs.
(2)
Index calculation
Some indicators in the index of high-quality development of SOEs need to be further calculated as follows: income tax to profit ratio is the ratio of the amount of income tax paid by SOEs to total profit; labor productivity is the ratio of total enterprise output to total number of employees, where total enterprise output is the sum of sales revenue and inventory value added; digital transformation degree is the degree of digital transformation disclosed in the annual reports of enterprises using the keywords “artificial intelligence technology”, “blockchain technology”, “cloud computing technology”, and “big data technology”. In particular, the calculation process of total factor productivity (TFP) of SOEs is explained as follows.
The Olley–Pakes (OP) method was used to calculate the TFP of enterprises, borrowed from Lu et al. [34]. The estimated total factor productivity is based on the Cobb–Douglas (C-D) production function with the following functional form.
Y i t = A i t L i t α K i t β
where Y i t is output, L i t is labor input, K i t is capital input, and A i t is TFP. Taking the logarithm of Equation (24), we can obtain Equation (25).
y i t = α l i t + β k i t + u i t
where y i t , l i t , and k i t are the logarithmic values of Y i t , L i t , and K i t , respectively. The residual term u i t in Equation (25) contains the logarithmic value of TFP, and the TFP estimate can be obtained by estimating Equation (25). Using the simple linear estimation method may ignore the correlation between the residual term and the regression term in Equation (25), and it means that some current factors affecting the firm’s TFP may have been considered by the firm and used to adjust the current factor inputs. Equation (26) can be used to solve the above problem.
y i t = α l i t + β k i t + ω i t + e i t
ω i t is part of the residual term of Equation (25), which refers to factors that can be observed by the firm and have affected factor inputs in the current period. e i t is the true residual term due to unobservable technology shocks as well as measurement errors. First, construct the relationship between the firm’s capital stock and investment functional formula.
K i t + 1 = ( 1 δ ) K i t + I i t
where K is the firm’s capital stock and I is the firm’s current investment. The higher the current period ω i t is, the higher the current period investment is. Then, construct an optimal investment function.
i i t = i t ω i t , k i t
To obtain ω i t , the inverse function of Equation (28) can be calculated assuming that h = i 1 ( ) , and ω i t is finally written as Equation (29).
ω i t = h i i i t , k i t
Substituting Equation (29) into the production function estimation Equation (26) yields:
y i t = β l i t + γ k i t + h i i i t , k i t + e i t
where the first term of Equation (30) represents the labor contribution and the second term represents the capital contribution. Let
ϕ i t = γ k i t + h i i i t , k i t
Equation (30) can be further rewritten.
y i t = β l i t + ϕ i t + e i t
ϕ i t is a polynomial containing the logarithmic values of investment and capital stock, whose estimate is denoted as ϕ ˜ i t . By estimating the above equation, consistent unbiased estimated coefficients of the labor term can be obtained and the estimated coefficients are used to fit ϕ ˜ i t . Let
V i t = y i t β ^ l i t
The following equation is estimated.
V i t = γ k i t + g ϕ t 1 γ k i t 1 + μ i t + e i t
where g is a function containing the values of ϕ and the lags of the capital stock. Along the same lines as estimating the unbiased coefficients of the labor term, this function can be estimated by higher-order polynomials in ϕ t 1 and k t 1 . In order to obtain valid estimates, it is necessary to ensure that the estimated coefficients of the capital stock are always consistent in the current period and in the lagged period by means of nonlinear least squares. The estimation of Equation (34) is completed and all coefficients in the production function have been successfully estimated. Using the estimation results, the C-D production function is fitted and the logarithm of the residuals is obtained, which is the logarithm of the TFP.

5. Results of Measuring the Level of High-Quality Development of SOEs

Based on the Python implementation of the fixed-base efficacy coefficient method and the longitudinal and horizontal pull-out gearing method, the weights of the evaluation perspective, primary indicators, and secondary indicators for the evaluation of high-quality development of SOEs were obtained, as shown in Figure 3.
From the evaluation perspective weighting, the highest proportion of efficiency of SOEs is 0.38, which is in line with the concept of business development. Especially for SOEs, the pursuit of high-quality development on the basis of self-management and self-sufficiency caters to the original policy intention of reforming the institutional mechanism of SOEs and improving the property rights structure. The weighting of independent innovation is 0.36, as the first driving force leading the development of SOEs. The weight of social responsibility is 0.26. As the executor of national strategies, SOEs are responsible for safeguarding people’s livelihood and maintaining social stability, so their social responsibility should take up an important proportion in the evaluation index of high-quality development. This paper obtains a better proportion to meet the requirements of SOEs’ missions. Further, the year weights obtained by the longitudinal and cross-sectional pull-out grade method are shown in Figure 4.
Combined with Figure 4, it is found that the weight coefficient of high-quality development in the time dimension shows an increasing trend year by year, with larger values of weight coefficients in 2017, 2018, 2019, and 2020, and the data results are consistent with the economic characteristics of the new era in China, where the report of the 19th National Congress in 2017 proposed that the economy should achieve high-quality development, and enterprises, as the main body of the real economy, have changed their business goals and development paradigms to pursue higher quality and a higher level of development. Combining the results in Figure 3, the linear weighting method is applied to obtain the value of high-quality development level index Q i for the i-th stock in year t k with the following formula.
Q i t k = j = 1 m ω j s i j t k
Linearly weighted values of each SOE’s annual high-quality development level measurement index are shown in columns 2 to 14 of Table 4. The penultimate column (column 15) shows the composite score of the quality development level from 2008 to 2020, linearly weighted according to the time weights in Figure 4. The last column (column 16) is the ranking according to the composite score from the highest to the lowest. Given the length of the article, only partial data results are presented in Table 4.
From the above table, it is easy to find that the index value of the high-quality development level of SOEs generally shows an increasing trend in the time dimension. Especially after the 19th National Congress in 2017, the index value has an obvious upward trend, and the data indicate that the quality of SOE development has improved on the whole. In 2015, the State Council issued the “Guidance on Deepening the Reform of State-owned Enterprises”, which divided SOEs into two categories: commercial and public welfare. The two categories have different functional positionings, and their main objectives and assessment contents are fundamentally different. In order to further visualize the high-quality development of SOEs, we plotted the trends of the indexes of high-quality development of SOEs in commercial and public welfare sectors according to the industry code classification of the SEC in 2012.
From the trend of the curve in Figure 5, the development quality of SOEs in general shows an upward trend, and the development quality level of competitive SOEs is generally higher than that of public welfare SOEs. Among the competitive SOEs, the construction industry is in the forefront of all SOEs, and the value tends to rise with the year. The development quality of manufacturing industry also shows a rising trend year by year, but the growth rate is slow. The leasing and service industry SOEs have a small decreasing trend in the sample area, but the overall trend is rising. Among SOEs in the public welfare category, the development quality of SOEs in the electricity, heat, and gas production and supply industry has the same trend as that of SOEs in the construction industry, and the development quality has improved faster. The development quality of SOEs in the transportation, storage, and postal industry has the same trend as that of SOEs in the leasing and service industry, with an overall upward trend, but with a small downward fluctuation trend. The development quality of SOEs in the water conservancy industry still needs to be improved, especially after the subprime mortgage crisis in 2018. After the crisis, the development quality showed a downward trend. In summary, from the industry classification, the development quality of SOEs in the public welfare category is generally low, and further reform solutions need to be sought to improve the property rights system of companies and enhance governance efficiency and profitability in order to further improve the development quality. This is also in line with other scholars’ studies in different economies [35].

6. Analysis of the Results of the Impact of Changes in the Ownership Structure of SOEs on High-Quality Development

Based on the integrated learning model, this paper will focus on exploring the influence of the change in property structure of state-owned enterprises on the high-quality development level of enterprises. First, the optimal conditions of the model are set up to obtain the optimal prediction model.

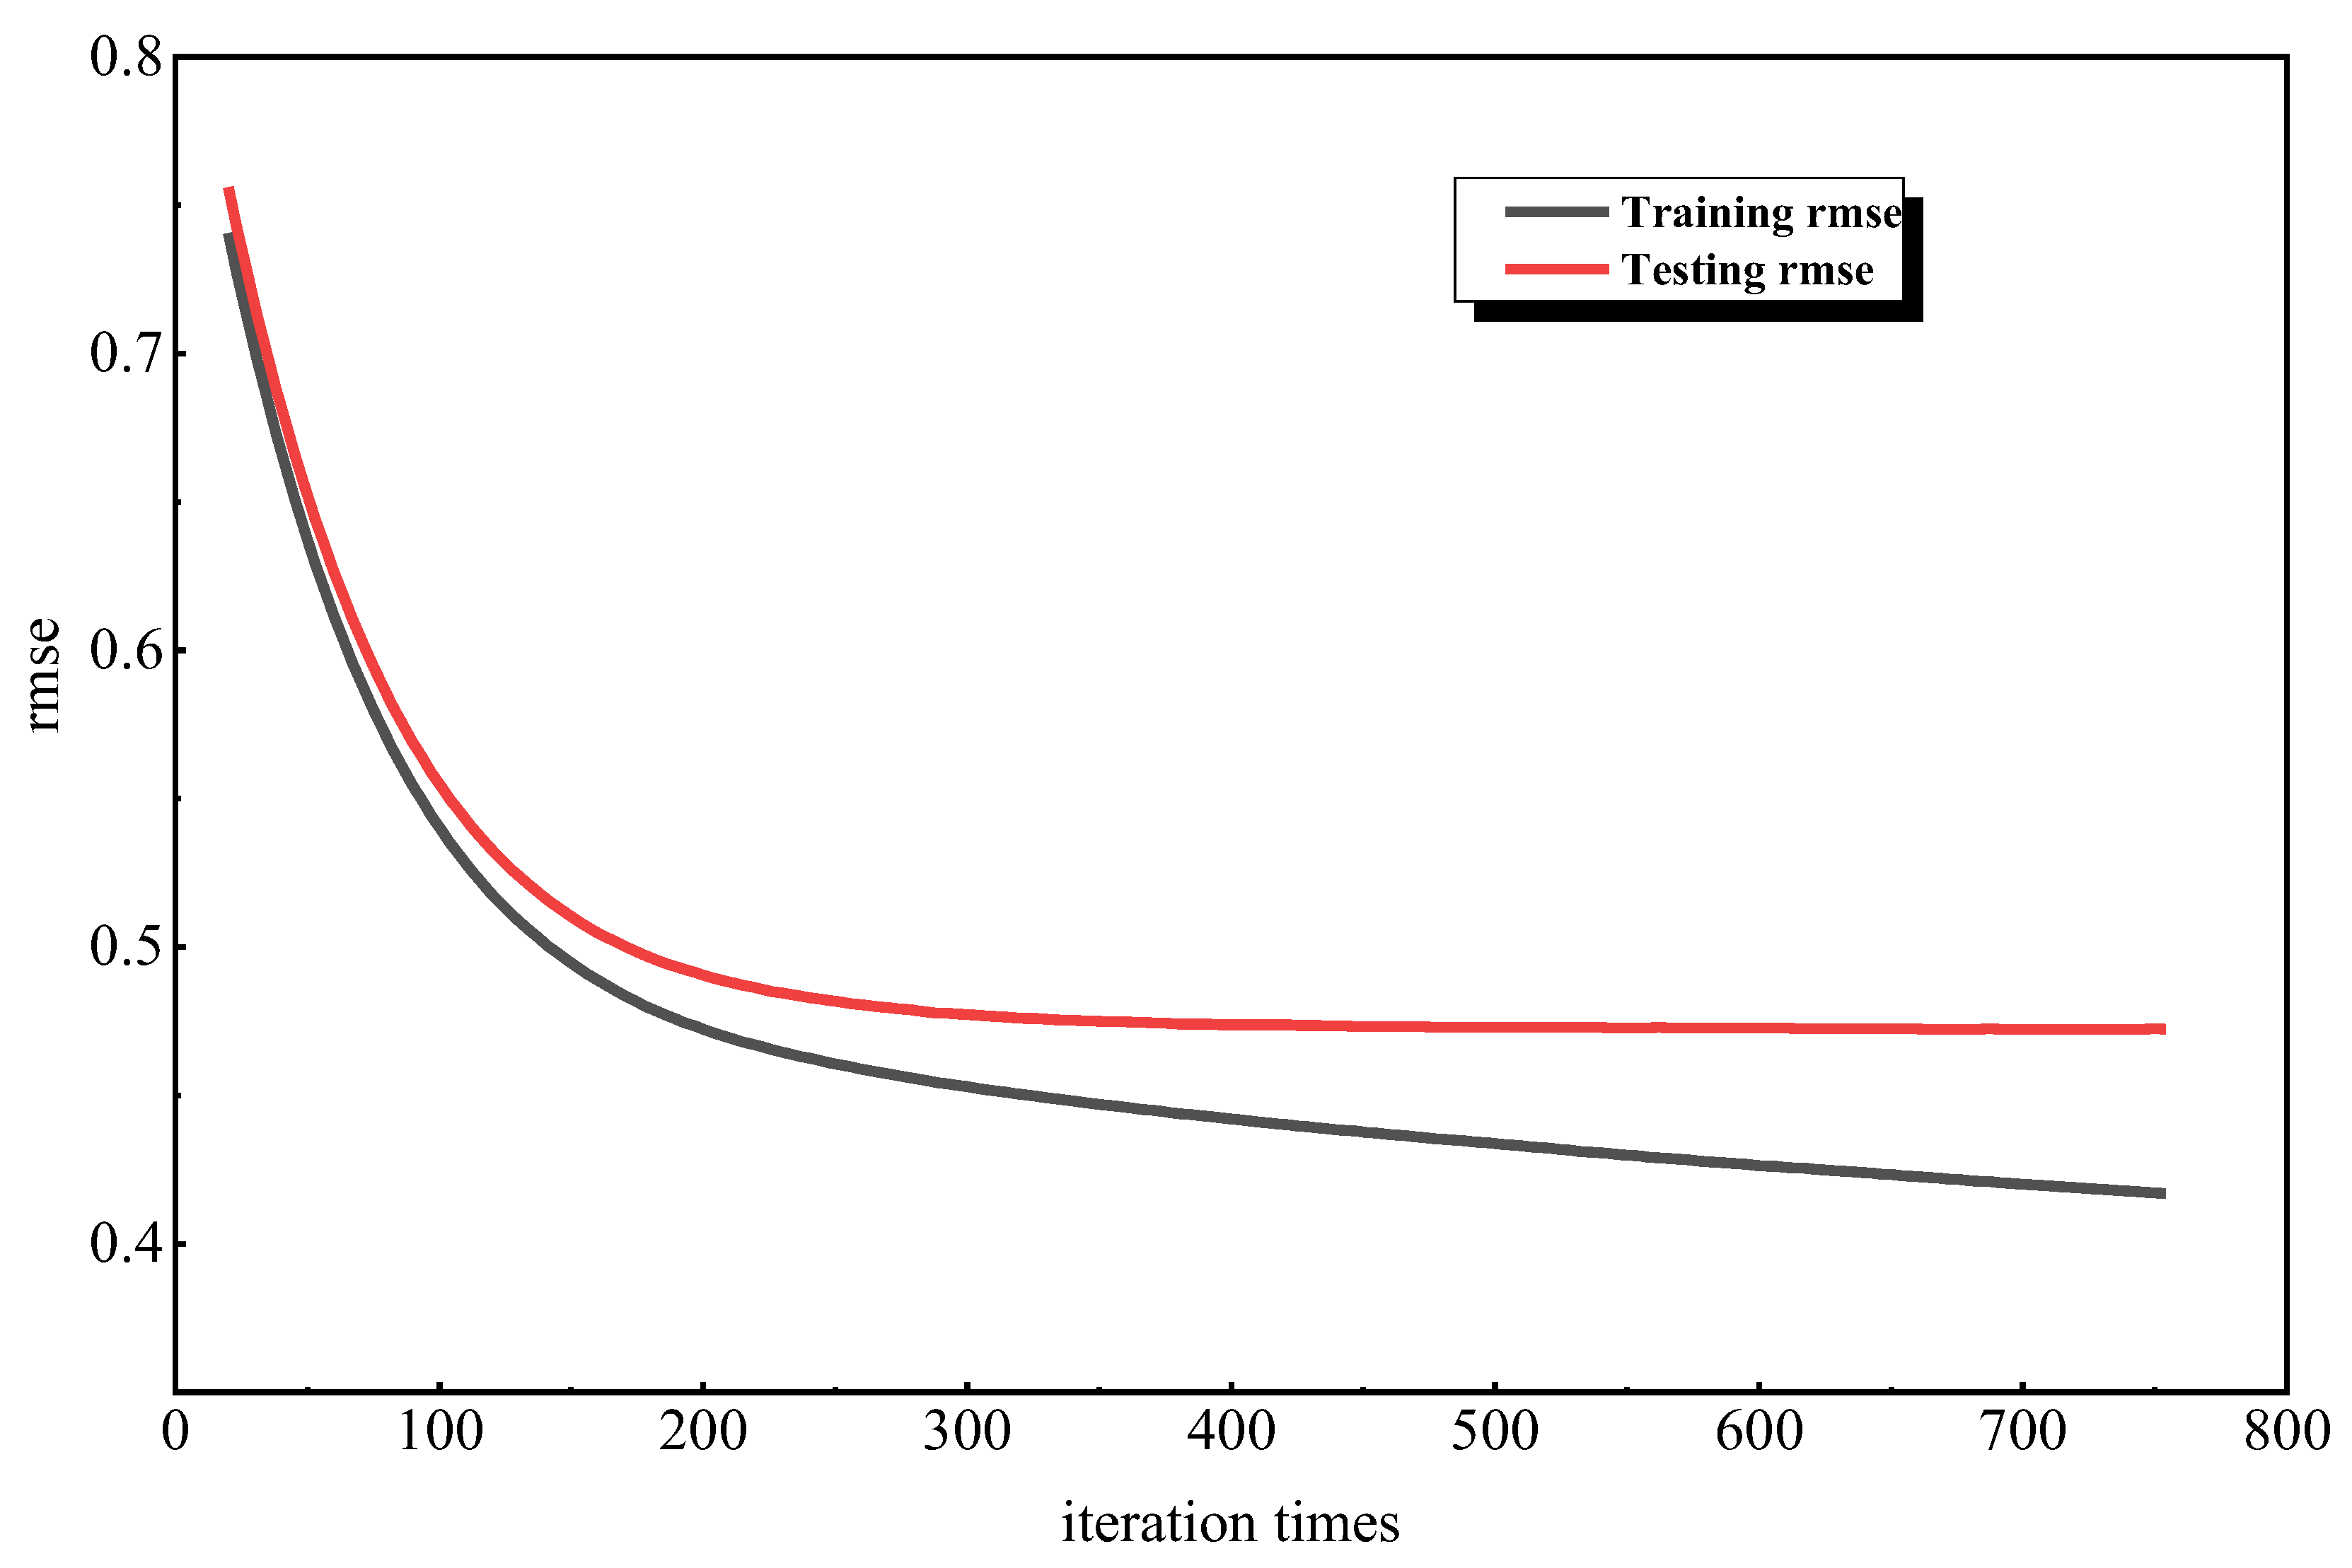
6.1. Integrated Model Training and Testing Results

The mean square error (RMSE) is used as the evaluation function to evaluate the training effect of the model, and the RMSE is calculated as follows.
rmse = 1 n i = 1 n y ^ 1 y i 2
In this paper, we set the maximum depth of CART tree (max_depth) to 32, the minimum weight of nodes inside the newly generated CART tree (min_child_weight) to 64, and the number of randomly sampled samples (subsample) for training the integrated learning model based on the Python programming environment to 0.8. The trends of RMSE for training and testing are shown in Figure 6.
As shown in Figure 6, the black line is the training set RMSE, and it can be obtained from the figure that the value of RMSE has been in a decreasing trend with the increase in the training cycle during the training process. The red line is the test set RMSE, and the decrease rate of RMSE value is larger in the test cycle [0–200], which proves that the integrated learning model adjusts the nodes and node weights drastically at this stage when integrating CART tree, but as the prediction cycle increases, the change rate of RMSE value is slow; at this time, the integrated learning model is in the fine-tuning stage for internal nodes and weights, and the integrated learning model stops training and reaches the optimal state when the RMSE value reaches about 0.48.

6.2. Analysis of Empirical Results

Using the trained integrated learning model, we predicted the impact on the level of high-quality development of SOEs when the ownership structure of SOEs fluctuates in a certain range in the form of random numbers with reference to the maximum and minimum values of the indicators of the ownership structure of SOEs in sample set D. We also explore the proportional setting of the ownership structure of SOEs when the effect of enhancing the level of high-quality development of enterprises is optimal. The first representative indicator of SOE ownership structure is the shareholding ratio of the first largest non-state shareholder. Figure 7 shows the predicted relationship between the shareholding ratio of the first largest non-state-owned shareholder and the measured value of high-quality development level of SOEs; the black line indicates the real relationship line between them, and the red line is the proposed relationship line between them.
From the fitted relationship line in Figure 7, it can be seen that the influence of the shareholding ratio of the first largest non-state shareholder on the high-quality development of SOEs shows a sine function trend in general, and the introduced large non-state shareholder has difficulty in having a say in the management activities of SOEs when it holds 4.5–25.2% of the company’s shares. The quality of SOE development shows a small decreasing trend with the first largest non-state shareholder. As the shareholding of the top non-state shareholder increases further, its voice in the enterprise begins to increase, and the pursuit of maximizing shareholder value leads to a significant increase in the efficiency and development level of SOEs, but after its shareholding exceeds 50%, the motivation of non-state shareholders to take advantage of the special political resources of SOEs, build an interest empire, and seek to maximize their own interests gradually emerges, resulting in a decreasing development trend in the development quality of SOEs. Based on the results in Figure 5, SOEs need to reform their ownership structure, retain the status of the effective state-owned controller, and introduce the first non-state shareholder with a shareholding ratio between 25.2% and 50%, when the non-public equity has the best effect on improving the development quality of SOEs. Similarly, the impact of employee stock ownership plan implementation share capital to total share capital ratio and the number of implementations on the level of high-quality development of SOEs, after replacing random numbers and calling the trained model, the fitting results obtained are shown in Figure 8.
Figure 8a shows the relationship between the ratio of the implemented share capital of employee stock ownership plan to total share capital and the high-quality development of SOEs; the black line is the real relationship line and the red line is the proposed relationship line. When the ratio is less than 5%, the marginal incentive effect brought by the shareholder status is larger for every 1% increase in the amount of equity acquisition by employees, and the employees are more motivated to work, which translates into the improvement of enterprise efficiency and thus significantly promotes the quality of development of SOEs. When the ratio is in the range of 5–11%, the marginal incentive effect brought by the shareholder status is weaker for every 1% increase in the amount of equity acquisition by employees, and employees are less motivated to work, which leads to a lack of motivation to increase the quality of development brought by the improvement of enterprise efficiency. When the ratio reaches 11%, the role of employee motivation for enterprise efficiency improvement is fully highlighted, and the level of enterprise development quality no longer changes with the ratio, and the relationship between the two presents a stable state. The maximum value of the implemented share capital of employee stock ownership plan in China at this stage is 9.27% of the total share capital, and it is known from the figure that the promotion effect of employee stock ownership plan implementation on the high-quality development of SOEs is in a desirable space. Based on the results in Figure 8, SOEs should maintain the shares given to internal employees within the range of 2.5–6.5% of the total share capital for the reform of the ownership structure.
Figure 8b shows the relationship between the number of employee share ownership plan implementations and the high-quality development of SOEs; the black line is the real relationship line and the red line is the proposed relationship line. From the fitted line, it is inferred that the level of quality development of SOEs gradually increases with the increase in the number of implementations, and after the number of implementations exceeds 1.5, the level of quality of SOEs is as high as 1.53, and then it is stabilized at the highest value level. The results of the above graph show that the number of employee stock ownership plan implementations is positively related to the level of quality development of SOEs. This trend indicates that the number of employees’ shareholdings and their participation in the company’s behavior increase as the number of shareholding plans increases, and that employees are motivated to participate in corporate governance and their own work as shareholders of the company, thus promoting the efficiency and quality of development of SOEs. Based on the results in Figure 8, SOEs should implement employee stock ownership plans more frequently than twice a year to ensure that the employees’ contribution to the improvement of the company’s development quality is maximized.

7. Conclusions

In the new era, China’s economy is shifting from the stage of high-speed growth to the stage of high-quality development. As the ballast of the national economy, SOEs, through equity mix, can improve the property rights structure and solve the outstanding problems of being large but not strong, large but not good, and large but not active, which can promote the macroeconomy to achieve high-quality development. Therefore, it is of great practical significance to clarify the development status of SOEs in the new development stage and to interpret the impact of changes in the property rights structure on the level of high-quality development of SOEs. Based on the requirements of the 19th National Congress Report and the Opinions, we selected 32 quantifiable indicators from three dimensions—social responsibility, efficiency and effectiveness, and independent innovation—to measure the level of high-quality development of SOEs. The index was linearly weighted to obtain the index of high-quality development level of SOEs. Further, an integrated learning model was used to investigate the effect of changes in the ownership structure of SOEs on the changes in the level of high-quality development based on the perspective of equity mixture, in an attempt to clarify the logical relationship between the ownership structure and high-quality development, and to provide theoretical support for the next step in SOE ownership reform and development quality improvement. The main conclusions obtained from this paper are as follows.
(1)
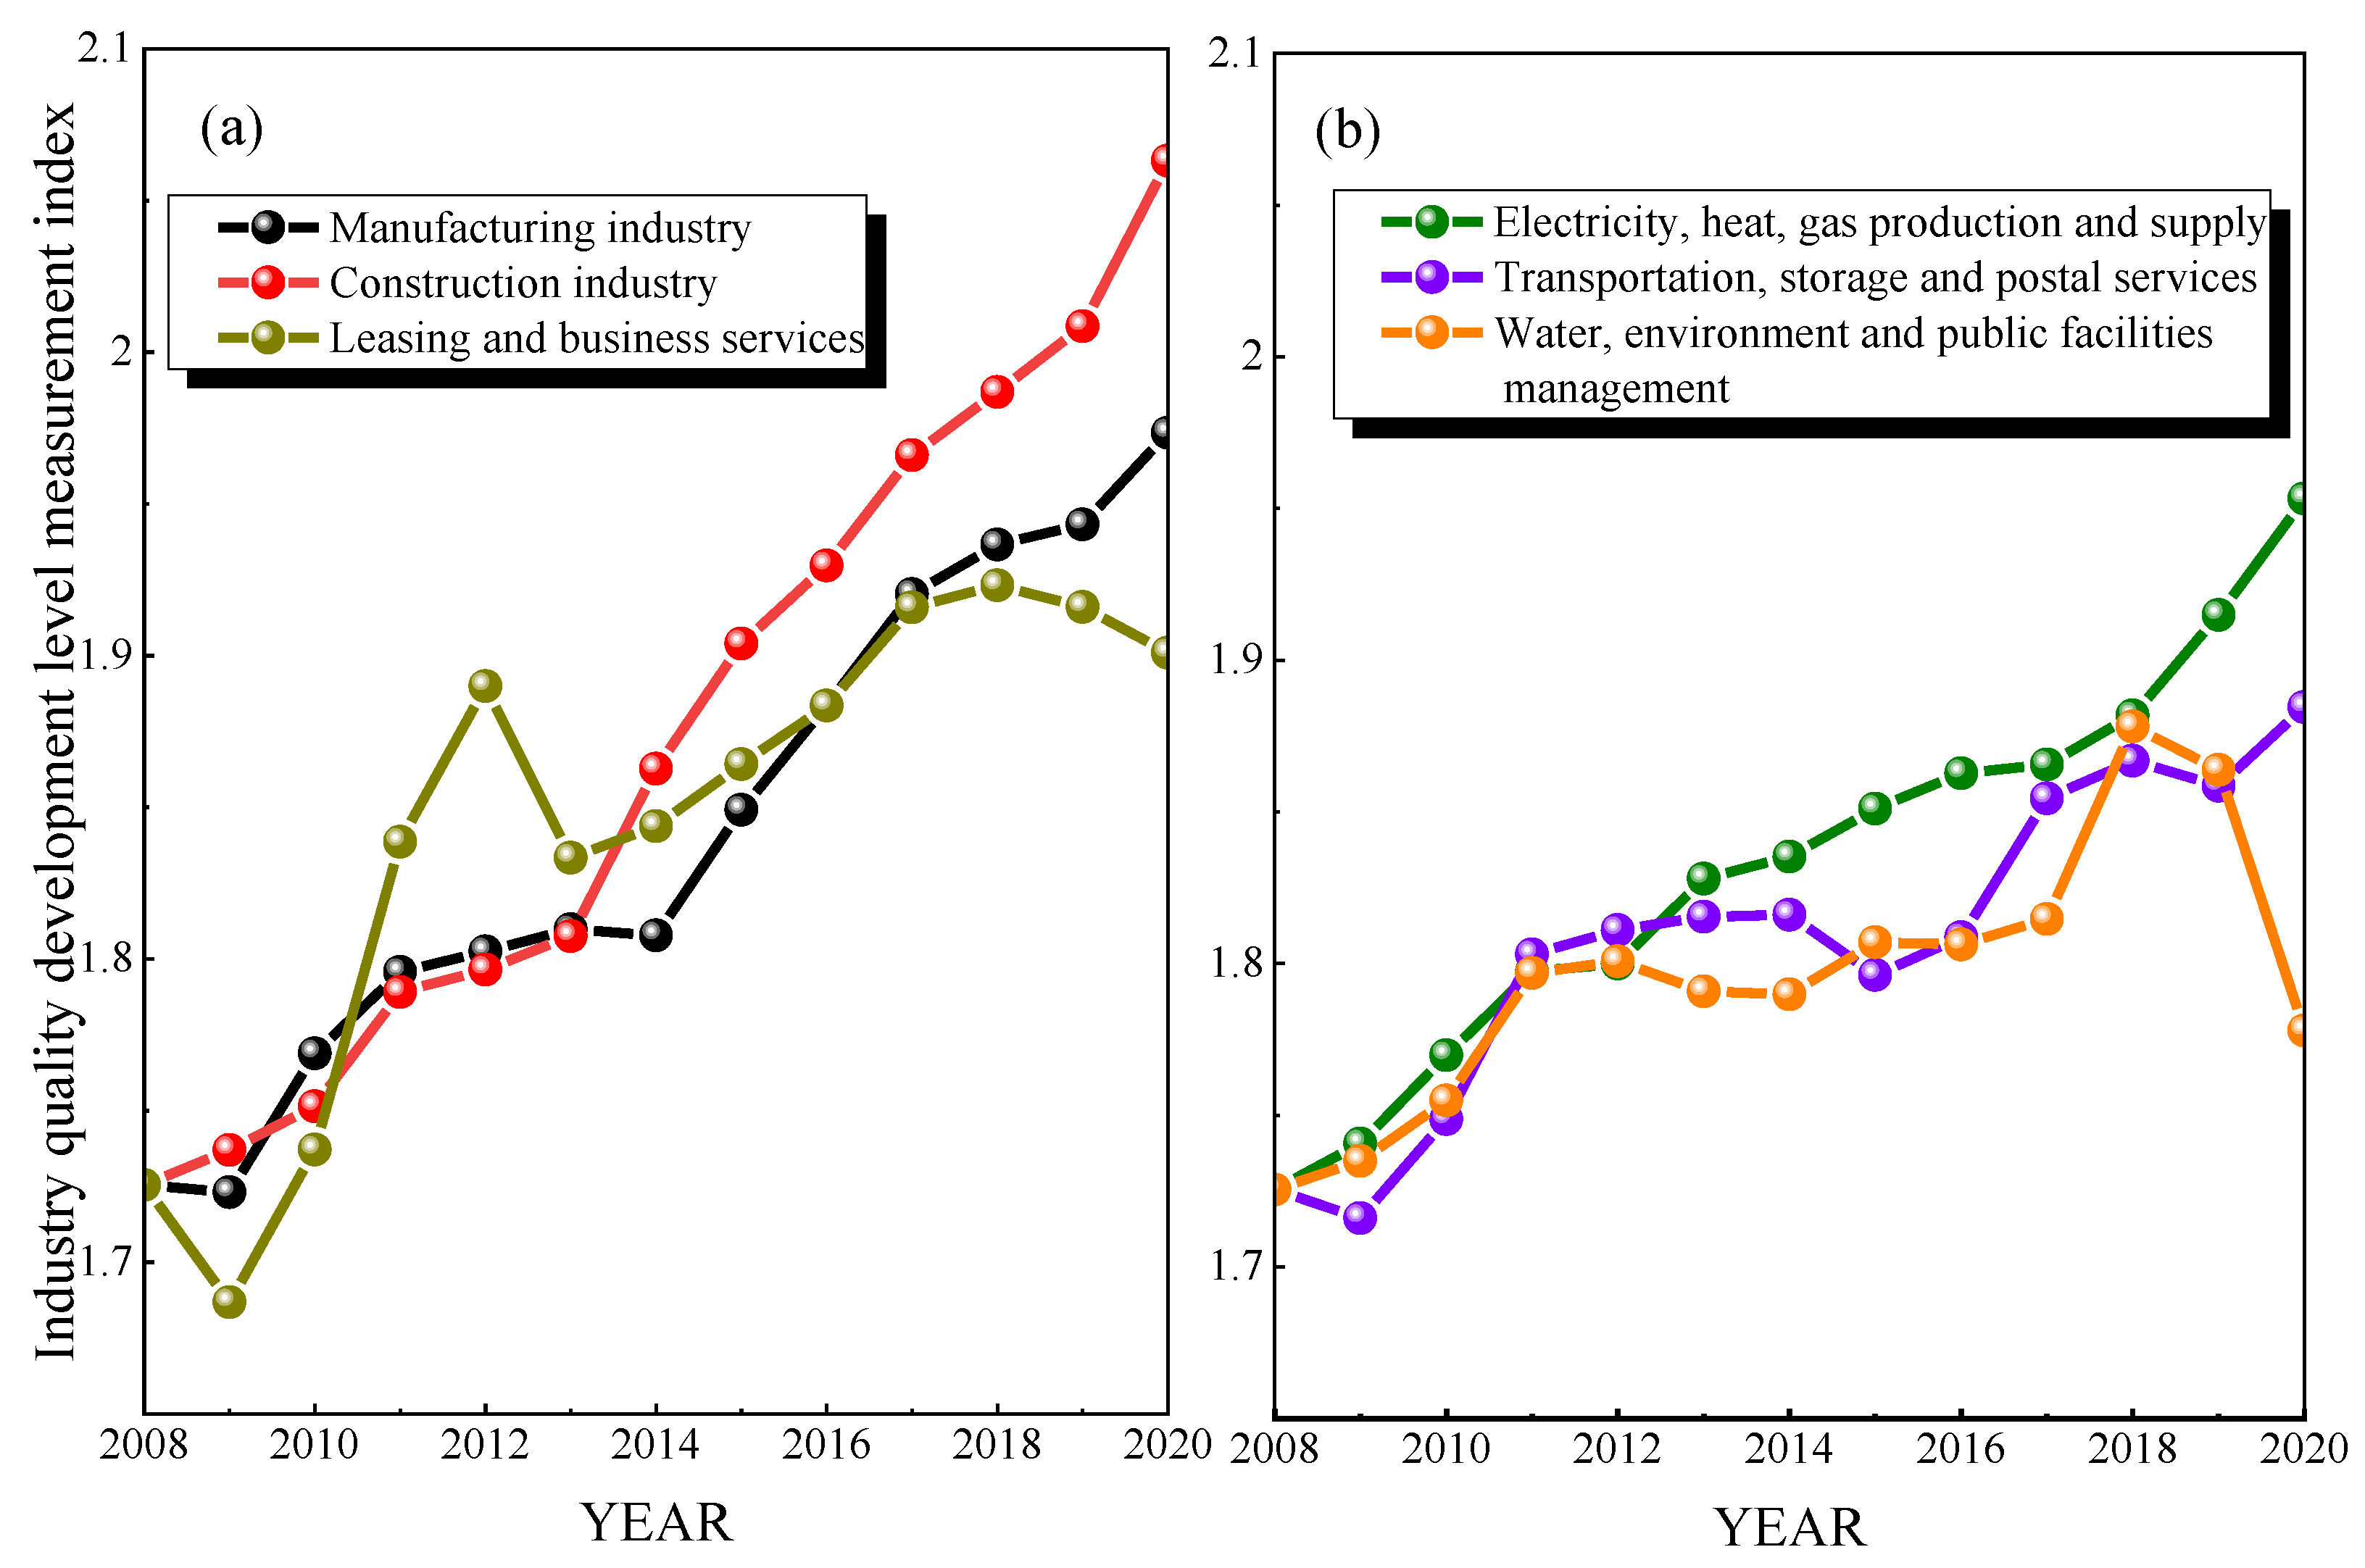
Since 2008, the level of quality development of Chinese SOEs has shown an overall upward trend, and the performance of competitive SOEs is generally better than that of public welfare SOEs. In particular, the value of the quality development index of the construction industry is at the forefront of all SOEs, and the value tends to increase significantly every year. The development quality of SOEs in the public welfare category water conservancy industry needs to be improved; especially after the subprime crisis in 2018, the measurement index showed a downward change trend, and further reform solutions need to be sought to improve the corporate property rights system and enhance governance efficiency and profitability in order to further improve the development quality.
(2)
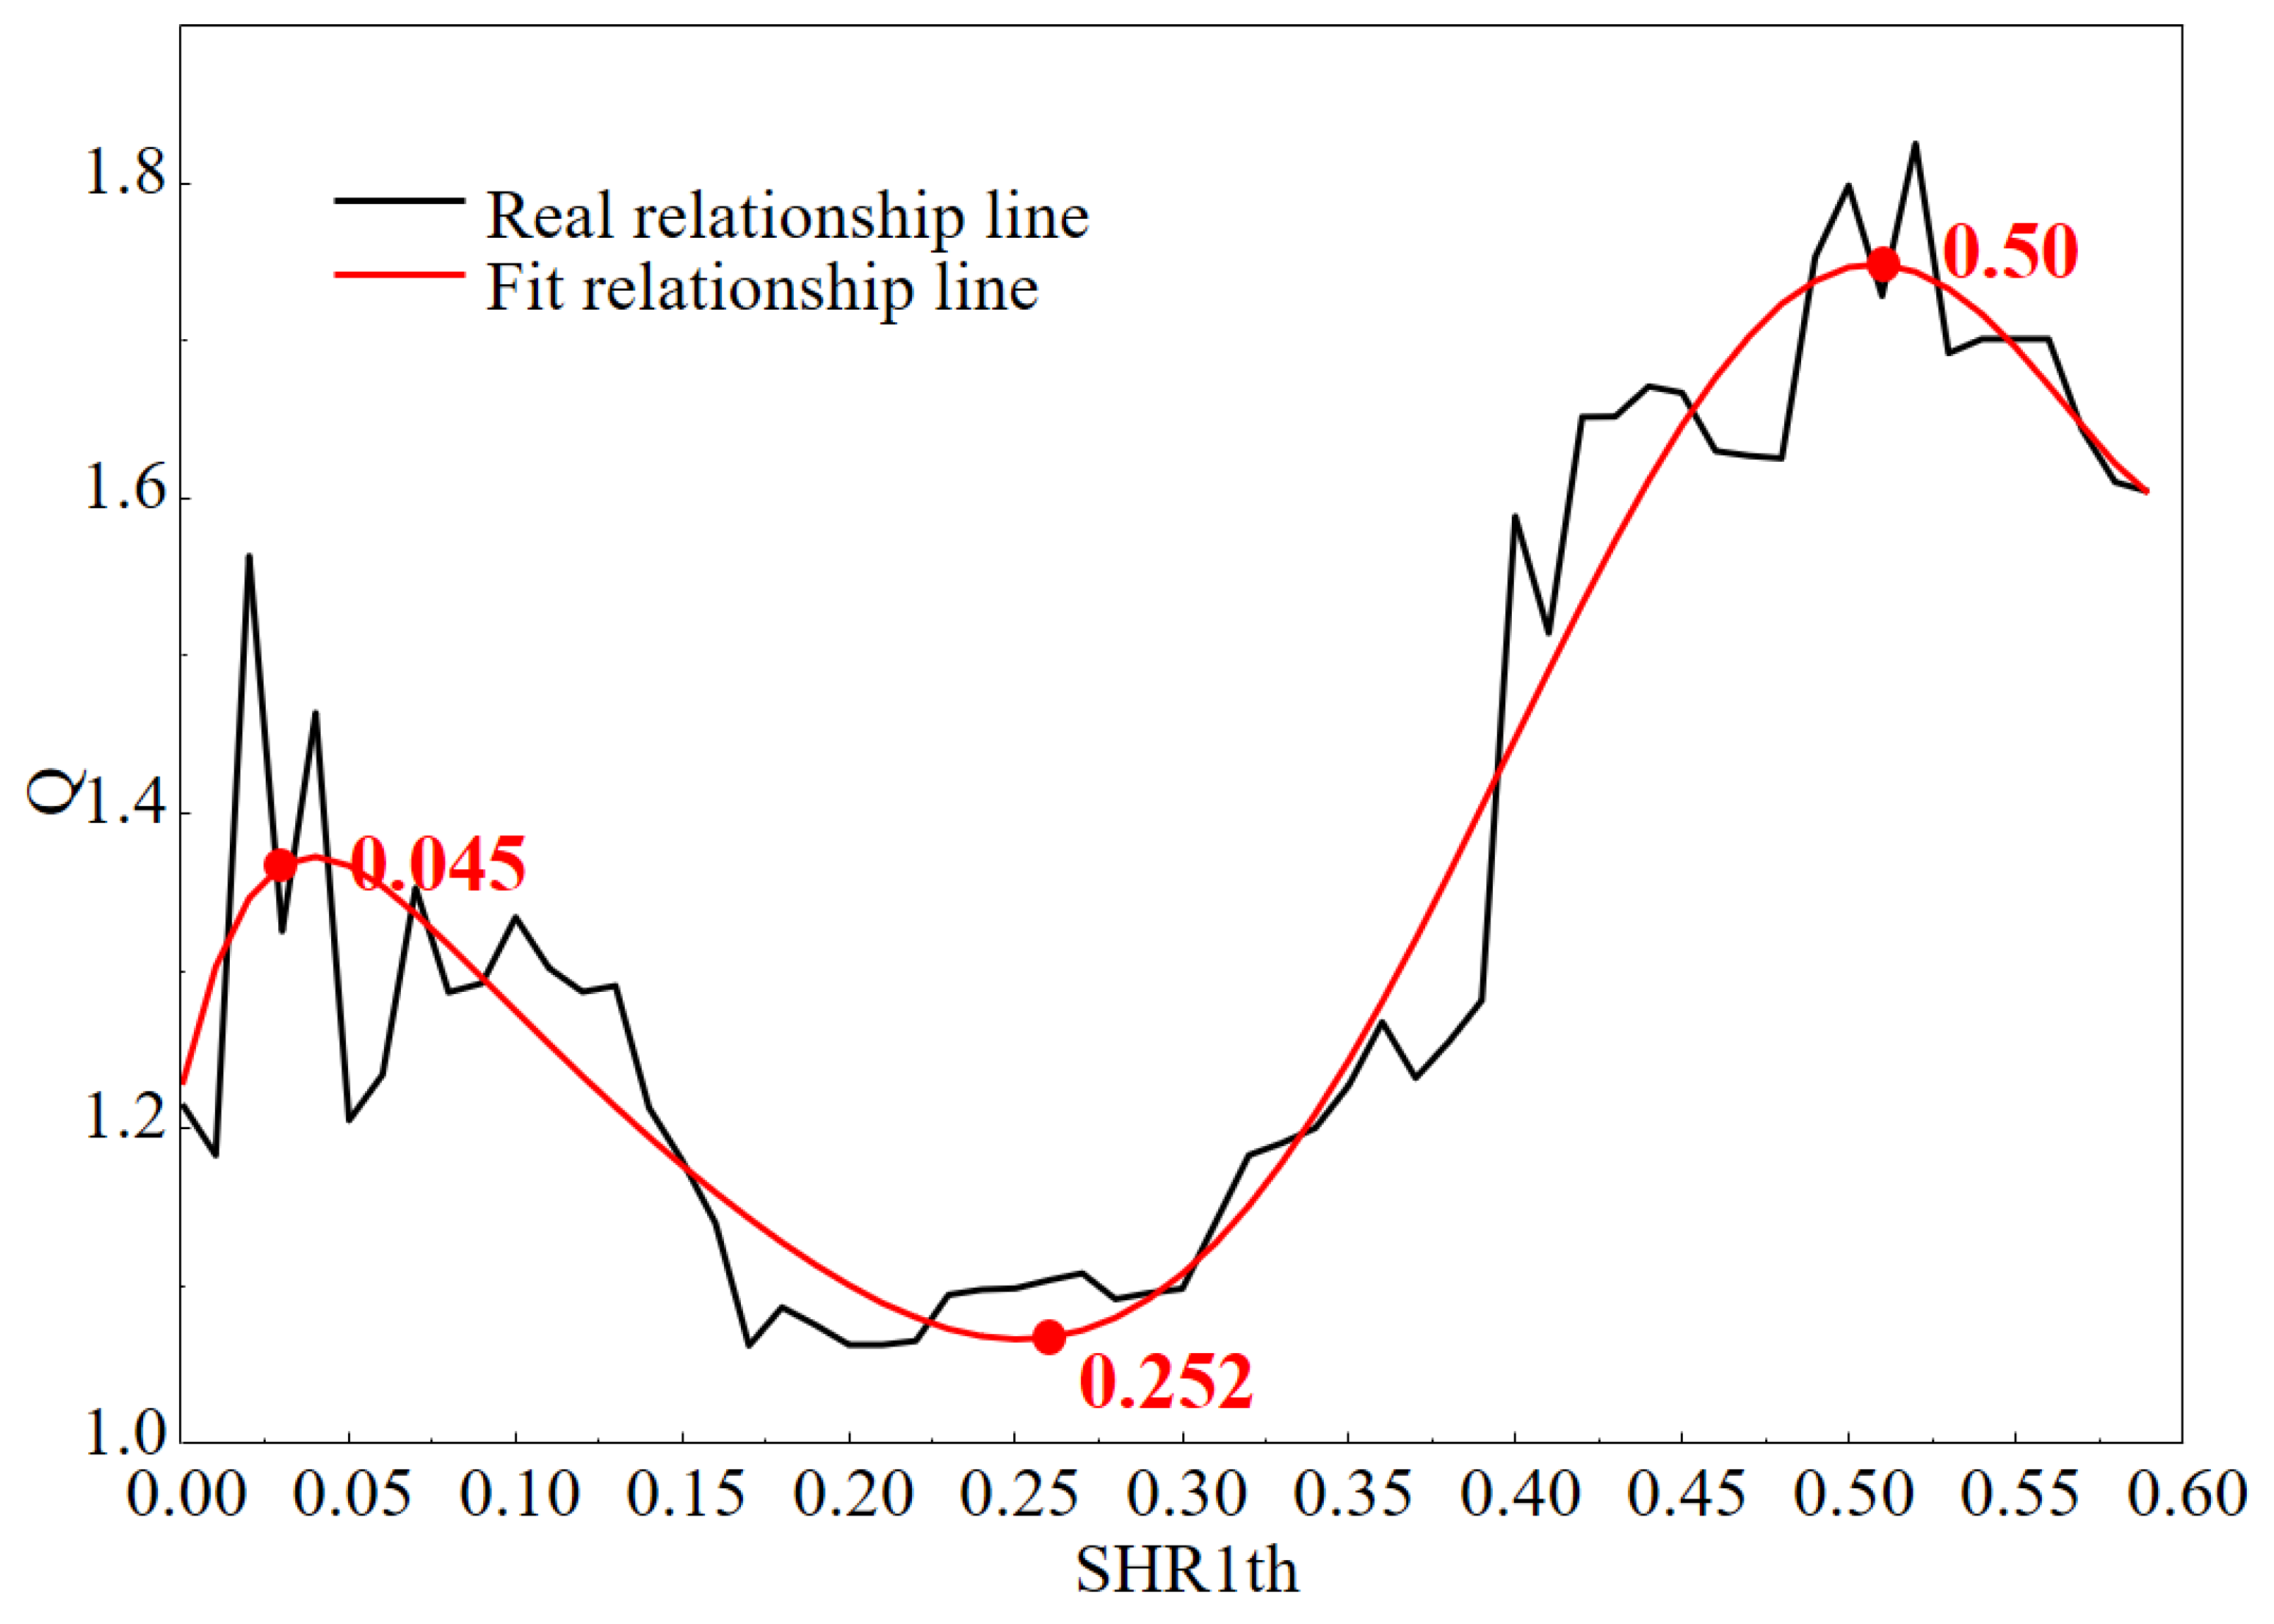
Equity mixed reform encourages SOEs to introduce non-public capital to improve the property rights structure, and there is a sine function relationship between the shareholding ratio of the first non-state shareholder introduced by SOEs and the level of high-quality development of SOEs. The shareholding ratio is maintained in the range of 25.2–50%. The change in property rights structure leads to positive changes in the development quality of SOEs. In order to ensure the positive effect of the change in ownership structure on the development quality of SOEs, SOEs should maintain the same nature of state-owned property rights.
(3)
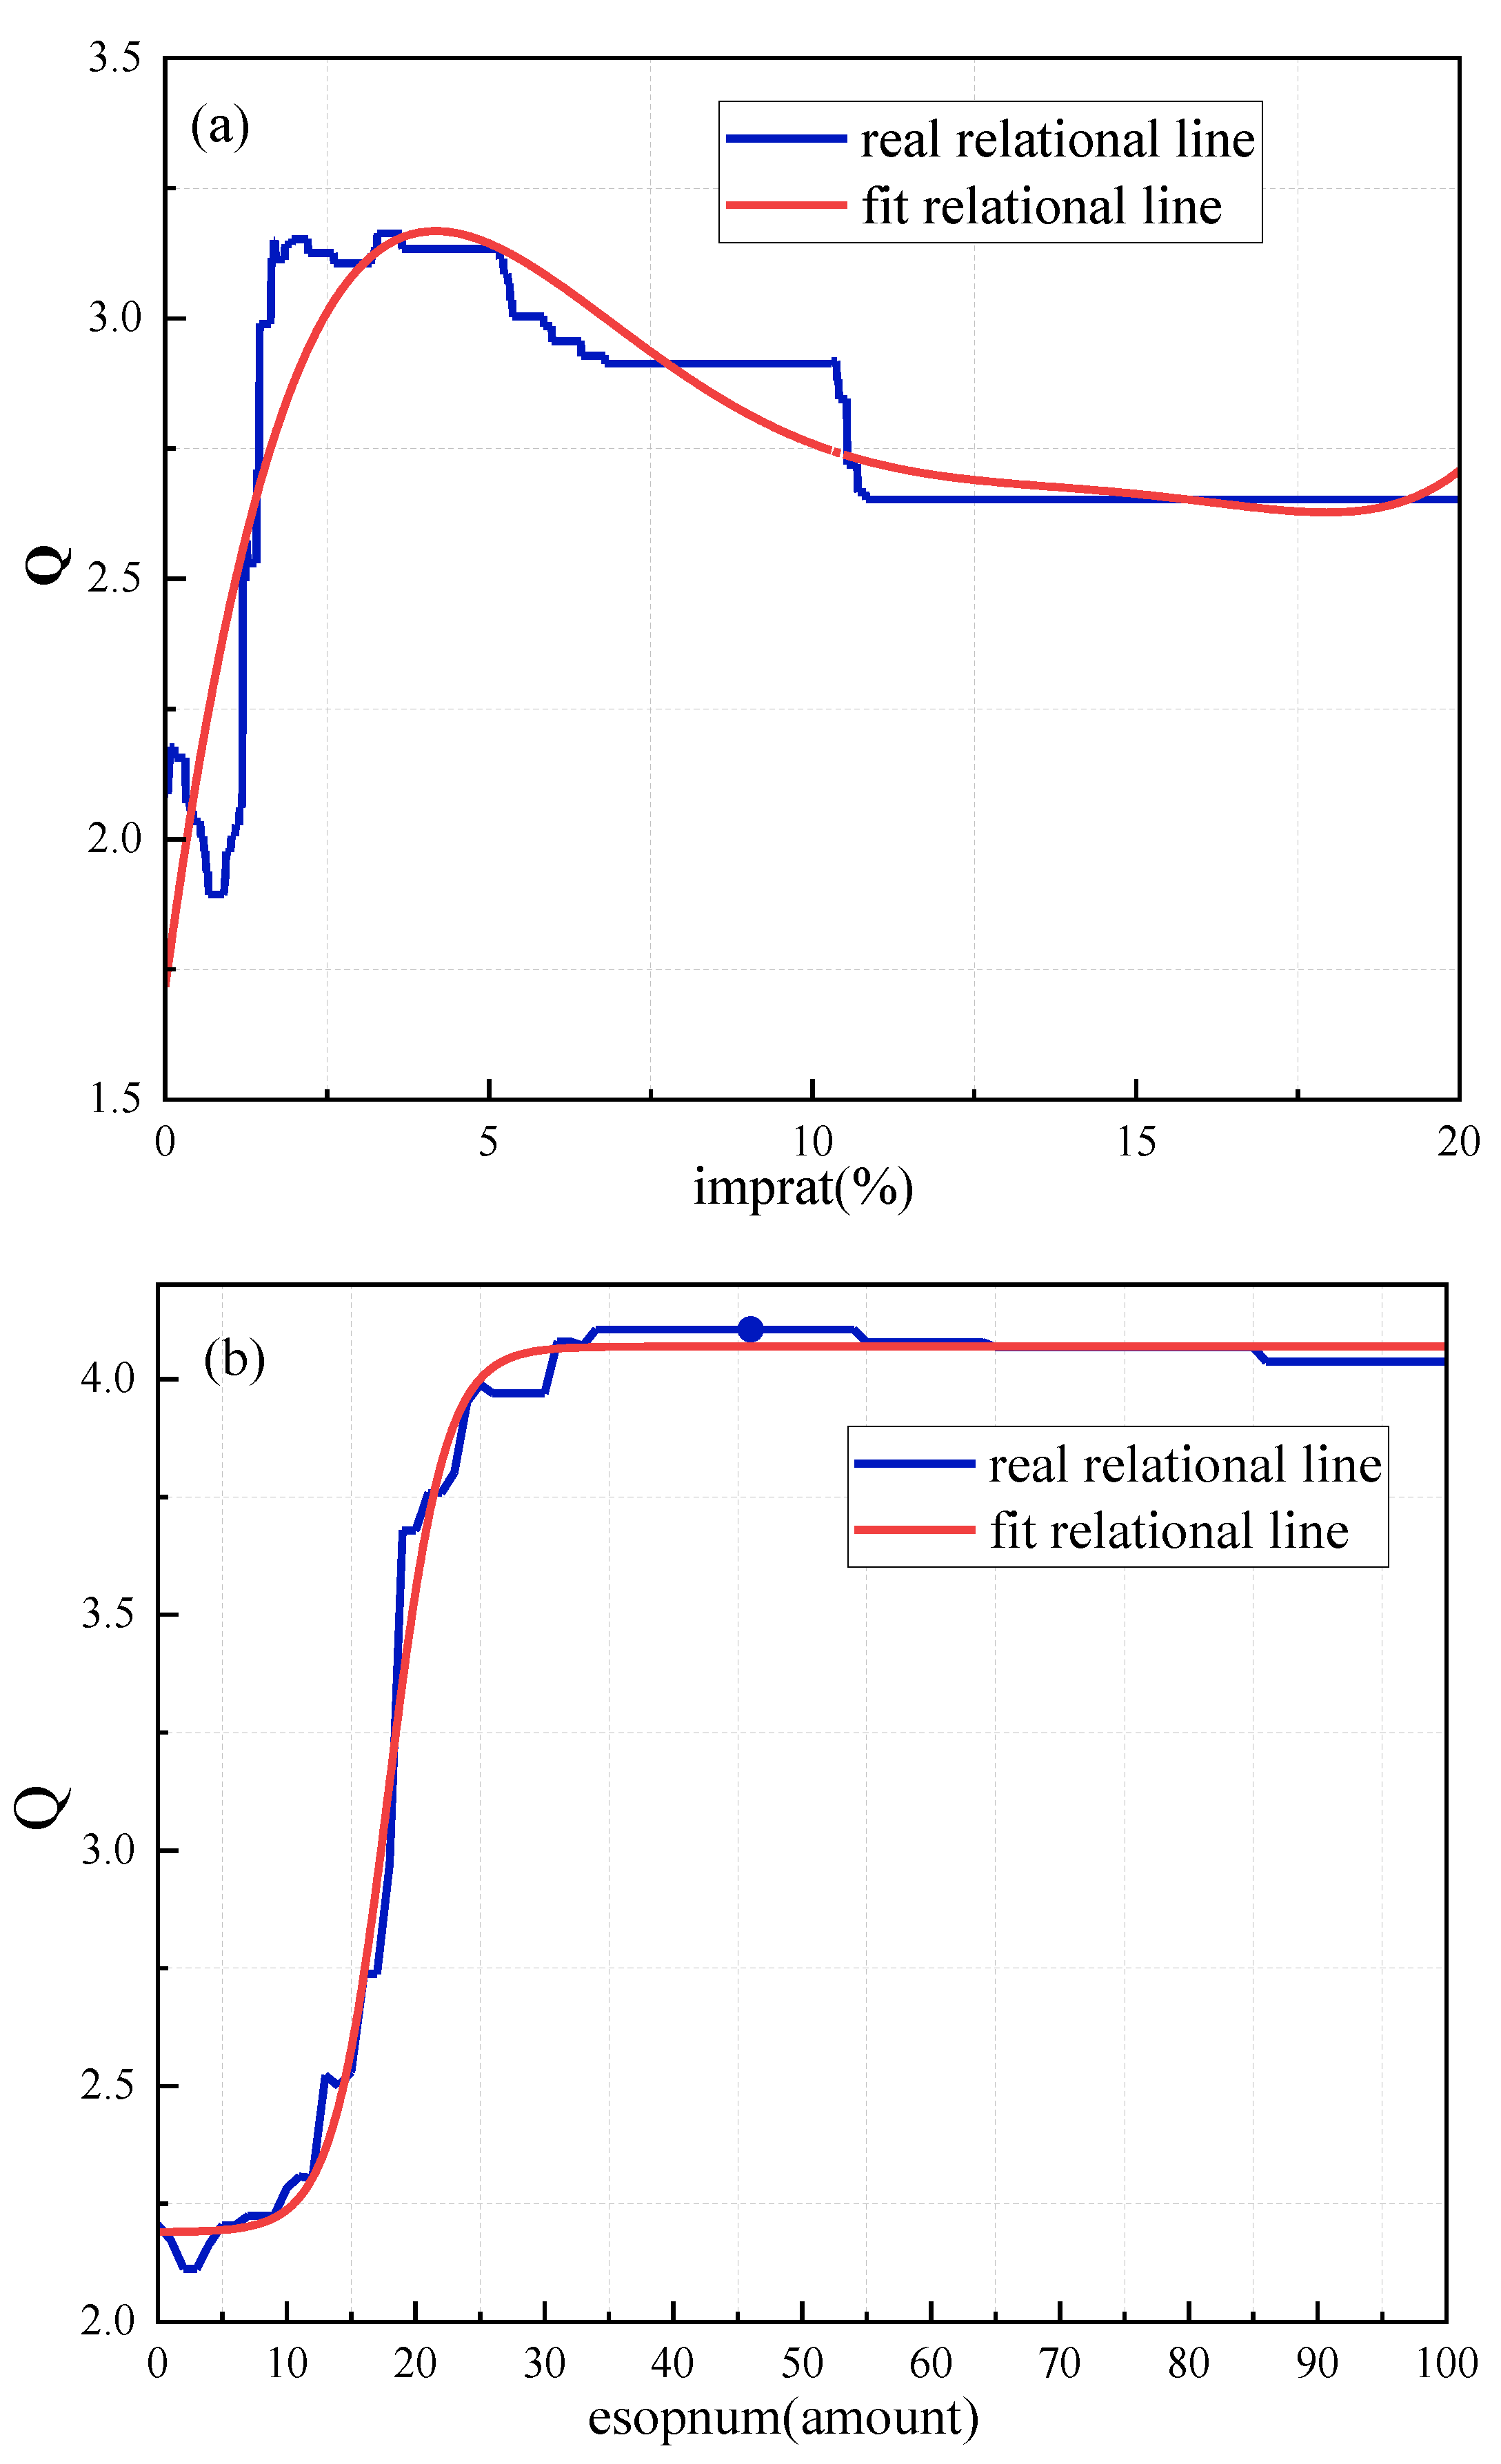
The impact of the share capital of employee stock ownership plans on the level of quality development of SOEs tends to increase, then decrease, and then stabilize. The marginal incentive effect of employees is the greatest when the share capital is maintained at about 5%, and the effect of relying on their own hard work to improve the quality of development of SOEs is the most significant.
(4)
The number of employee stock ownership plans implemented positively affects the level of high-quality development of SOEs. In order to maximize employee motivation and improve the quality of SOE development, SOEs should implement employee stock ownership plans more than twice a year.
This paper combines today’s rapidly developing artificial intelligence technology to build models by using machine learning algorithms, thus greatly reducing the subjectivity brought about by manual data selection and ensuring that the research results have a certain degree of objectivity. At the same time, this method has advantages for modeling big data, which makes the research of this paper generally meaningful. Since only invalid data were removed and large amounts of data were used to construct the model, the research method of this paper is applicable and generalizable, and can be extended to other economies for validation. The contributions of this paper are as follows.
(1)
Based on the guiding ideas of China’s 19th National Congress Report and Opinions, quantifiable measurement indexes were selected, and the fixed-base efficacy coefficient method and the longitudinal and horizontal pull-out gearing method were used to measure the level of high-quality development of SOEs, ensuring that the indexes have comparability in time and dynamic changes, which enriches the research methods and literature related to high-quality development of enterprises.
(2)
Based on the integrated learning model, we investigated the impact of changes in the ownership structure of SOEs on the level of high-quality development, which can provide reference implications for SOEs to further improve the ownership structure and enhance the level of development while demonstrating the effect of equity mixing, and help achieve the goal of high-quality macroeconomy.
(3)
Using Chinese enterprises as a sample, the findings can be used as a reference for emerging markets and developing countries to cross the middle-income trap and formulate SOE reform strategies.

Author Contributions

Conceptualization, Y.B. and D.W.; methodology, Y.B.; software, X.Z.; validation, Y.B., D.Z. and D.W.; formal analysis, Y.B.; investigation, Y.B., D.Z. and X.Z.; resources, D.W.; data curation, X.Z.; writing—original draft preparation, Y.B. and X.Z.; writing—review and editing, D.W. and D.Z.; visualization, Y.B., D.W., D.Z. and X.Z.; supervision, D.W.; project administration, Y.B.; funding acquisition, D.W. All authors have read and agreed to the published version of the manuscript.

Funding

This research was funded by the National Natural Science Foundation of China Grant (Delin Wu: 71702196), and Shenzhen Humanities and Social Sciences Key Research Base Grant (Delin Wu: KP191001, KP191002, KP191003).

Institutional Review Board Statement

Not applicable.

Informed Consent Statement

Not applicable.

Data Availability Statement

The data used to support the findings of this study have not been made available because all the data come from third parties—CNRDS database (http://www.cnrds.com(accessed on 5 November 2022)), Wind database (http://www.wind.com.cn/portal/zh/WDS/index.html(accessed on 5 November 2022)), and CSMAR database (http://www.csmar.com/channels/31.html(accessed on 5 November 2022)).

Conflicts of Interest

The authors declare no conflict of interest.

References

  1. Ohashi-Kaneko, K.; Takase, M.; Kon, N.; Fujiwara, K.; Kurata, K. Effect of light quality on growth and vegetable quality in leaf lettuce, spinach and komatsuna. Environ. Control. Biol. 2007, 45, 189–198. [Google Scholar] [CrossRef]
  2. Chakamera, C.; Alagidede, P. The nexus between infrastructure (quantity and quality) and economic growth in Sub Saharan Africa. Int. Rev. Appl. Econ. 2018, 32, 641–672. [Google Scholar] [CrossRef]
  3. Mlachila, M.; Tapsoba, R.; Tapsoba, S.J. A quality of growth index for developing countries: A proposal. Soc. Indic. Res. 2017, 134, 675–710. [Google Scholar] [CrossRef]
  4. Wei, M.; Li, S. A study on measuring the level of quality development of China’s economy in the new era. Res. Quant. Econ. Tech. Econ. 2018, 35, 3–20. [Google Scholar]
  5. Ren, B. Judgment Criteria, Determinants and Ways to Achieve High-Quality Economic Development in China in the New Era. China Post 2018, 10, 5–16. [Google Scholar]
  6. Huang, S.J.; Xiao, H.J.; Wang, X. On the high-quality development of state-owned enterprises. China Ind. Econ. 2018, 10, 19–41. [Google Scholar]
  7. Xiao, H. High-quality development of state-owned enterprises for the 14th Five-Year Plan. Econ. Syst. Reform. 2020, 5, 22–29. [Google Scholar]
  8. Huang, Q. Industrial development and industrialization in China in the 40 years of reform and opening up. China Soc. Sci. Dig. 2019, 9, 5–23. [Google Scholar]
  9. Jin, B. An economic study on "high-quality development". China Ind. Econ. 2018, 4, 5–18. [Google Scholar]
  10. Wang, Y. A century of change, high-quality development and building a new development pattern. Manag. World 2020, 36, 1–13. [Google Scholar]
  11. Zhang, T. Research on the theoretical interpretation and measurement method of high-quality development. Res. Quant. Econ. Tech. Econ. 2020, 37, 23–43. [Google Scholar]
  12. Gao, P.; Yuan, F.; Hu, H.; Liu, X. Dynamics, mechanisms and governance of high-quality development. Econ. Syst. Res. 2020, 55, 4–19. [Google Scholar]
  13. Zhang, J.K.; Hou, Y.Z.; Liu, P.E.L.; He, J.W.; Zhuo, X. Target requirements and strategic path of high-quality development. Manag. World 2019, 35, 1–7. [Google Scholar]
  14. Zhao, T.; Zhang, Z.; Liang, S.K. Digital economy, entrepreneurial activity and high-quality development Empirical evidence from Chinese cities. Manag. World 2020, 36, 65–76. [Google Scholar]
  15. Xu, X.; Li, S.; Wang, X.; Bi, Q. The choice of China’s economic growth target: Ending the “collapse theory” with high-quality development. World Econ. 2018, 41, 3–25. [Google Scholar]
  16. Liu, Z.B.; Ling, Y.H. Structural transformation, total factor productivity and high-quality development. Manag. World 2020, 36, 15–29. [Google Scholar]
  17. Liu, S.; Zhang, S.J.; Zhu, H.D. Research on the measurement of national innovation drive and its effect on high quality economic development. Res. Quant. Econ. Tech. Econ. 2019, 36, 3–23. [Google Scholar]
  18. Yu, Y.; Yang, X.; Zhang, S. A study on the spatial and temporal transition characteristics of China’s economy from high growth to high quality development. Res. Quant. Econ. Tech. Econ. 2019, 36, 3–21. [Google Scholar]
  19. Chen, S.; Chen, D. Haze pollution, government governance and economic quality development. Econ. Res. 2018, 53, 20–34. [Google Scholar]
  20. Xiao, Z.Y. Analysis of the dynamics of high-quality development in China—Based on economic and social development perspectives. Soft Sci. 2019, 33, 1–5. [Google Scholar]
  21. Qi, J. Fiscal expenditure incentives, spatial correlation and quality of economic growth: Evidence from a Chinese province. Int. J. Bus. Sci. Appl. Manag. 2016, 11, 191–201. [Google Scholar] [CrossRef]
  22. Chen, Z.; Liu, Y.M. Government subsidies, firm innovation and high-quality development of manufacturing firms. Reform 2019, 08, 140–151. [Google Scholar]
  23. Cao, X.; Ren, B. Analysis of time series changes and regional differences in the quality of economic growth in China. Econ. Res. 2011, 46, 26–40. [Google Scholar]
  24. Xiao, Z.; Wang, Y. Notes on “Structural entropy weighting method for determining the weights of evaluation indicators”. Oper. Res. Manag. 2020, 29, 145–149. [Google Scholar]
  25. Wang, X.P.; Yu, X.L.; Wang, T.T. Air pollution impact prediction in chemical parks based on integrated learning strategy. Oper. Res. Manag. 2021, 30, 127–134. [Google Scholar]
  26. Nie, C.; Jian, X. Measurement of high-quality development in China and analysis and comparison of the status quo between provinces. J. Quant. Tech. Econ. 2020, 37, 26–47. [Google Scholar]
  27. Gong, Y.; Choi, S.U. State Ownership and Accounting Quality: Evidence from State-Owned Enterprises in China. Sustainability 2021, 13, 8659. [Google Scholar] [CrossRef]
  28. Megginson, W.L.; Ullah, B.; Wei, Z. State ownership, soft-budget constraints, and cash holdings: Evidence from China’s privatized firms. J. Bank Financ. 2014, 48, 276–291. [Google Scholar] [CrossRef]
  29. Dragomir, V.D.; Dumitru, M.; Feleagă, L. Political interventions in state-owned enterprises: The corporate governance failures of a European airline. J. Account. Public Policy 2021, 40, 106855. [Google Scholar] [CrossRef]
  30. Minor, P.; Walmsley, T.; Strutt, A. State-owned enterprise reform in Vietnam: A dynamic CGE analysis. J. Asian Econ. 2018, 55, 42–57. [Google Scholar] [CrossRef]
  31. Zhou, T.; Li, J. Does mixed ownership improve the financial quality of Chinese listed companies? A case study of SXNBM’s privatization process. Nankai Bus. Rev. Int. 2017, 8, 367–388. [Google Scholar] [CrossRef]
  32. Du, Y.; Wang, R. Impact of corporate governance ability on capital gains in mixed ownership enterprises. Transform. Bus. Econ. 2020, 19, 92–113. [Google Scholar]
  33. Ruan, L.; Liu, H. The impact of institutional innovation on internal control: Evidence from Chinese state-owned enterprises. Int J. Technol. Manag. 2021, 85, 255–273. [Google Scholar] [CrossRef]
  34. Lu, X.; Lian, Y.J. Total factor productivity estimation of Chinese industrial firms: 1999–2007. China Econ. 2012, 11, 541–558. [Google Scholar]
  35. Kong, Y.; Famba, T.; Chituku-Dzimiro, G.; Sun, H.; Kurauone, O. Corporate Governance Mechanisms, Ownership and Firm Value: Evidence from Listed Chinese Firms. Int. J. Financ. Stud. 2020, 8, 20. [Google Scholar] [CrossRef]
Figure 1. Research framework for empirical analysis.
Sustainability 15 03016 g001
Figure 2. Design of research steps.
Sustainability 15 03016 g002
Figure 3. Weights of indicators at different levels of enterprise quality development.
Sustainability 15 03016 g003
Figure 4. Time dimension weights.
Sustainability 15 03016 g004
Figure 5. Statistical chart of quality development index of SOEs in different industries: (a) competitive industries; (b) public service industry.
Sustainability 15 03016 g005
Figure 6. RMSE iterative evolutionary curve.
Sustainability 15 03016 g006
Figure 7. The relationship between the shareholding ratio of the first largest non-state shareholder and the index of high-quality development level of state-owned enterprises.
Sustainability 15 03016 g007
Figure 8. The relationship between the implementation of employee stock ownership plan and the index of high-quality development level of state-owned enterprises: (a) employee stock ownership plan implementation share capital as a percentage of total share capital; (b) number of employee stock purchase plan implementations.
Sustainability 15 03016 g008
Table 1. Raw timing stereo data.
System t 1 t 2 t r
x 1 , x 2 , x 3 , , x m x 1 , x 2 , x 3 , , x m x 1 , x 2 , x 3 , , x m
s 1 x 11 t 1 , x 12 t 1 , x 13 t 1 , , x 1 m t 1 x 11 t 2 , x 12 t 2 , x 13 t 2 , , x 1 m t 2 x 11 t r , x 12 t r , x 13 t r , , x 1 m t r
s 2 x 21 t 1 , x 22 t 1 , x 23 t 1 , , x 2 m t 1 x 21 t 2 , x 22 t 2 , x 23 t 2 , , x 2 m t 2 x 21 t r , x 22 t r , x 23 t r , , x 2 m t r
s n x n 1 t 1 , x n 2 t 1 , x n 3 t 1 , , x n m t 1 x n 1 t 2 , x n 2 t 2 , x n 3 t 2 , , x n m t 2 x n 1 t r , x n 2 t r , x n 3 t r , , x n m t r
Table 2. Evaluation indicators for high-quality development of state-owned enterprises.
Target LayerPerspective LayerCriteria LayerIndicator LayerIndicator DescriptionIndicator Attributes
The Index of high-quality development of SOEs (Q)Social responsibilityProduct serviceQuality assurance systemThe value is 1 if there is a quality assurance system; otherwise, it is 0Positive
Quality certificationThe value of the quality certification is 1; otherwise, it is 0Positive
Product disputesThe value is 1 if there is a product dispute; otherwise, it is 0Negative
After-sales serviceThe value is 1 if there is after-sales service; otherwise, it is 0Positive
Customer satisfaction surveysIf there is a customer satisfaction survey, the value is 1; otherwise, it is 0Positive
Donation and taxationDonationAnnual social donation amount of enterprisesPositive
TaxationThe ratio of income tax paid by SOEs to total profitsPositive
Environmental protectionEnvironmental investmentAnnual environmental investment amount of enterprisesPositive
Environmental penaltyIf there is an environmental penalty, the value is 1; otherwise, it is 0Negative
Pollutant emissionIf there is a pollutant emission behavior, the value is 1; otherwise, it is 0Negative
Green officeIf the green office policy has been implemented, the value is 1; otherwise, it is 0Positive
Environmental certificationIf there is an environmental certification, the value is 1; otherwise, it is 0Positive
Environmental recognitionIf there is an environmental recognition, the value is 1; otherwise, it is 0Positive
Energy savingThe value is 1 if there is an energy-saving behavior; otherwise, it is 0Positive
Measures to reduce the three wastesIf there are measures to reduce the three wastes, the value is 1; otherwise, it is 0Positive
CSR reportComprehensiveness of reportIf the content covers 6 aspects of responsibility, the value is 1; otherwise, it is 0Positive
Number of pages of reportTotal number of pages of CSR reportPositive
CSR columnIf there is a CSR column in the annual report, the value is 1; otherwise, it is 0Positive
CSR reliability guaranteeIf there is a CSR reliability guarantee, the value of 1; otherwise, it is 0Positive
Profit and operationProfitabilityTotal factor productivity (TFP)Calculated by OP methodPositive
Economic value added (EVA)Net operating profit after tax—total capital × weighted average cost of capitalPositive
Labour productivityThe ratio of the total output of the enterprise to the total number of employeesPositive
Operating efficiencyTotal asset turnoverThe ratio of the total sales revenue of the enterprise to the average total assetsNegative
Inventory turnoverThe ratio of the prime operating cost of the enterprise to the average inventory balanceNegative
Fixed asset turnoverThe ratio of the total sales revenue of the enterprise to the average net fixed asset valueNegative
InnovationInnovation inputR&D investment intensityThe ratio of R&D expenditure to operating income of enterprisesPositive
Proportion of R&D staffThe ratio of the number of R&D personnel to the total number of employeesPositive
Ratio of staff with a higher degreeThe ratio of the number of employees who earned master’s or doctoral degrees to the total number of employeesPositive
Innovation outputNumber of citations of patentsThe number of citations of the company’s authorized patentsPositive
Number of granted patentsThe number of company patents grantedPositive
Proportion of invention patentsThe proportion of invention patents in the patent application of enterprisesPositive
Degree of digital transformationThe sum of the frequency of keywords related to “artificial intelligence technology”, “blockchain technology”, “cloud computing technology”, “big data technology”, and “digital technology application” disclosed in annual reportPositive
Table 3. Definitions of SOEs property rights structure indicators.
SymbolDefinition
s h r 1 t h Shareholding ratio of the largest non-state-owned shareholder
s h r t Shareholding ratio of all non-state-owned shareholders among the top ten shareholders
k 1 t h Whether the largest non-state-owned shareholder is a controlling shareholder dummy variable. If yes, the value is 1; otherwise, it is 0
c a t g Shareholding types among the top ten shareholders
e b a l Ownership balances (shareholding ratio of non-state-owned shareholders among the top ten shareholders/shareholding ratio of state-owned shareholders)
e s o p ESOP implementation dummy variable. If implemented, it is 1; otherwise, it is 0
i m p r a t The share capital of the ESOP as a percentage of the company’s total share capital
e s o p n u m The number of implementations of the ESOP of a listed company in one year
Table 4. Selected results of the measurement value of the level of high-quality development of SOEs.
2008200920102011201220132014201520162017201820192020
0000081.72551.74881.80441.88801.79851.75931.77431.97282.15662.15502.16182.13042.0601
0000111.72551.73891.76351.80201.84731.79051.83501.79341.89251.90101.88731.91961.8479
0000141.72551.82031.85651.82171.80321.84691.84061.78351.80661.81991.81571.81901.7664
0000161.72551.74291.81591.81941.84891.83751.82571.91371.90262.06242.09332.11802.1444
0000251.72551.69171.69821.73971.75881.75971.77061.79391.73341.87841.90562.01921.9115
0000291.72551.74921.74121.73211.74171.87481.85481.90791.93391.84161.96432.00521.9484
0000301.72551.72171.86011.94711.75371.98051.98862.01142.01582.05792.05382.06612.1022
6008771.72551.73581.71701.65831.61701.60381.59201.63941.61351.64211.50091.76691.9158
6008901.72551.85781.73291.87701.82731.93731.84281.82271.74931.87301.72522.00881.7537
6008971.72551.73131.75271.79971.89571.86571.88301.84791.83881.86541.89571.85491.6976
6009601.72551.70821.78201.82381.78601.75921.72691.77551.81321.91441.82441.81871.8928
6009611.72551.81101.83441.79011.81511.86881.90851.91191.93521.83751.87921.95402.0182
6009631.72551.69621.79631.80411.77321.72601.74351.68001.76711.84591.90871.89371.9456
6009711.72551.77381.76401.77821.86801.87721.79371.61781.71551.89691.96311.94841.8857
6009751.72551.60301.67461.73441.81371.71511.79521.81761.91521.79381.83891.90921.9691
6009841.72551.73811.79061.85481.82661.78871.74171.79651.81951.83911.89812.01601.9913
6010011.72551.71901.73761.79351.80621.60631.61991.68471.64281.71311.72931.86491.8656
6018721.72551.64551.67151.65421.66691.61451.66001.77981.63281.60561.61911.62911.8191
Disclaimer/Publisher’s Note: The statements, opinions and data contained in all publications are solely those of the individual author(s) and contributor(s) and not of MDPI and/or the editor(s). MDPI and/or the editor(s) disclaim responsibility for any injury to people or property resulting from any ideas, methods, instructions or products referred to in the content.

