Article

Groundwater Risk Assessment Based on DRASTIC and Special Vulnerability of Solidified/Stabilized Heavy-Metal-Contaminated Sites

Key Lab of Groundwater Resources and Environment, Ministry of Education, Jilin University, Changchun 130021, China
*
Author to whom correspondence should be addressed.
Sustainability 2023, 15(4), 2997; https://doi.org/10.3390/su15042997
Submission received: 16 November 2022 / Revised: 24 January 2023 / Accepted: 3 February 2023 / Published: 7 February 2023

Abstract

:
Solidification/stabilization technology is commonly used in the remediation of heavy-metal-contaminated sites, which reduces the leaching capacity of heavy metals, but the total amount of heavy metals in the soil is not reduced, there is still a risk of heavy metal re-release and contamination of groundwater, and the risk of groundwater contamination of solidified/stabilized heavy-metal-contaminated sites needs to be assessed. Through the analysis of the system structure of solidified/stabilized heavy-metal-contaminated sites, combined with the integration method of pollution sources—the vadose zone-aquifer, based on the DRASTIC model and the special vulnerability of the solidification/stabilization site, a groundwater pollution risk assessment index system including 4 influencing factors such as site hazard, pollutant hazard, aquifer vulnerability, and natural conditions and a total of 18 evaluation indexes was constructed. Each evaluation index was graded and assigned a scoring value combined with the Analytic Hierarchy Process (AHP) to calculate index weights. The comprehensive weights of site hazard, contaminant stability, aquifer vulnerability, and natural conditions were 0.1894, 0.3508, 0.3508, and 0.1090, respectively. The isometric method was used to classify the pollution risk into five risk levels (very low risk [0, 2), low risk [2, 4), medium risk [4, 6), high risk [6, 8), and very high risk [8, 10]), and a groundwater comprehensive index pollution risk assessment model was established. The model was applied to the actual site. The results showed that under the scenario of direct landfill of remediated soil, the comprehensive indexes of groundwater pollution risk for As and Cd were 4.55 and 4.58, respectively, both of which were medium risk. When the surrounding protective measures were supplemented, the comprehensive indexes of groundwater pollution risk for As and Cd were 3.98 and 4.02, respectively. Cd remained as medium risk and As as low risk. In both scenarios, the combined groundwater contamination risk index of Cd was greater than that of As because the contaminant stability of As was higher than that of Cd. The average percentage of aquifer vulnerability score reached 45.50%, which was higher than the weight of site inherent vulnerability of 35.08%, indicating that the original site hydrogeological conditions are fragile, groundwater is vulnerable to contamination, and the in situ landfill solidification/stabilization of soil is at risk. In order to further reduce the risk, the topographic slope was increased, thereby increasing the surface drainage capacity, which reduced the combined groundwater contamination risk index for As and Cd to 3.94 and 3.90, both of which were low risk. This study provides a new method for assessing the risk of groundwater contamination at solidified/stabilized heavy-metal-contaminated sites. It also has reference significance for selecting solidification/stabilization remediation parameters

1. Introduction

Heavy metals in soil can migrate downward with rainfall and pollute groundwater, threatening human health. According to the National Soil Pollution Survey Bulletin released in 2014, the number of inorganic pollutant exceedance sites in China accounted for 82.8% of the total number of exceedance sites, and the primary exceedance pollutants were Cd, Hg, As, Cu, Pb, Cr, Zn, and Ni [1]. Solidification/stabilization (S/S) is widely used due to its cost-effectiveness. According to USEPA’s statistics on remediation technologies for 216 sites contaminated with heavy metals and heavy metal compounds in the first 20 years of 2005, up to 80.6% of the sites were remediated by this method [2]. S/S fixes pollutants by physical or chemical methods or converts pollutants into chemically inactive forms, preventing pollutants from migrating into the soil environment. The remediation effect is affected by the type of agent and the physicochemical properties of the soil [3], mainly assessed by experimental methods such as toxic leaching and sequential extraction [4,5]. However, the leaching concentration of heavy metals and heavy metal forms in S/S soils is not constant [6]. With environmental changes, these methods can only assess the static risk during the implementation phase of S/S remediation, but not the long-term dynamic risk in the environment [7].
To address the drawback that it is difficult to assess the long-term environmental risk of heavy metals retained in soil [8], scholars have studied the long-term stability of S/S heavy metals by soil column leaching experiments [9] and quantitative accelerated aging experiments [10]. For example, Zha simulated 3 years of acid rain on cement-alkali slag cured/stabilized Zn-contaminated soil by soil column leaching experiments and found that the Zn concentration in the filtrate always met the requirements (<1 mg/L) [11]. Shen used the accelerated aging method and found that the stabilization effect decreased when the TCLP leaching concentration of Pb and Cd increased over a simulated acid rain period of 52 to 104 years [6]. Suzuki found that curing Pb-contaminated soil with magnesium oxide was still effective after 100 years of simulated acid rain by using the accelerated aging method (Pb < 0.01 mg/L) [10].
However, although these experimental methods achieved good results, there are two key problems. One is that it is difficult to simulate field sites in the laboratory realistically. The other is that the S/S heavy metal risk varies with stabilizer, heavy metal, and site conditions, and all situations cannot be studied experimentally. For the first problem, scholars have evaluated soil sampling from actual S/S sites [12], and Wang found that leaching concentrations of soil samples within S/S sites met drinking water standards after 17 years [13]. However, there are fewer cases of long-term monitoring implementation at S/S sites, the costs are greater, and it is difficult for the monitoring years to reach larger orders of magnitude. For the second problem, there is no systematic assessment method. Therefore, this paper attempts to establish an assessment system to describe the possibility of heavy metal re-release from S/S soils by some important evaluation indexes and to assess the environmental risk of groundwater at S/S heavy metal sites by using groundwater as the risk receptor.
The groundwater pollution risk results from the interaction between aquifer vulnerability and pollution load. Both the inherent vulnerability of aquifers and the special vulnerability of pollutants should be considered. Intrinsic vulnerability reflects the aquifer’s hydrogeological properties and evaluates the aquifer’s sensitivity to pollutants [14,15]; special vulnerability evaluates the possibility and harm of releasing pollution sources and its relationship with the load and type of pollution, storage methods, etc.
DRASTIC is the most commonly used model for evaluating the inherent vulnerability of aquifers based on a weighted combination of seven hydrogeological settings (depth to water table, net recharge of aquifer, aquifer media, soil media, topography, impact of vadose zone, and hydraulic conductivity). DRASTIC was named by the abbreviation of each index, an empirical model developed by USEPA for assessing groundwater contamination potential [16]. In DRASTIC, for the special vulnerability of groundwater, different scenarios require the construction of different evaluation models. Huan evaluated the risk of potential pollution sources by quantifying the nature of contaminants and potential infiltration load and generated a groundwater pollution risk map for Jilin City based on DRASTIC [17]. Zhang, based on landfill disposal technology by evaluating the landfill size, waste type, leachate collection system, top cover, etc., related to the potential damage degree, combined with DRASTIC to establish a landfill groundwater risk evaluation system [18]. Zhao constructed a groundwater pollution risk evaluation system combining groundwater vulnerability and pollution load based on simulated pollutant migration values and DRASTIC [19]. However, there is no groundwater risk assessment model for the special vulnerability of S/S heavy-metal-contaminated sites.
Based on the inherent vulnerability of aquifers and the special vulnerability of S/S heavy metal sites, this study uses AHP to establish a comprehensive index pollution risk evaluation model. This risk assessment method involves less work and requires less data, and it can provide support for risk identification and control of groundwater at S/S heavy-metal-contaminated sites. It can also provide a reference basis for remediation and treatment of heavy-metal-contaminated sites.

2. Methods

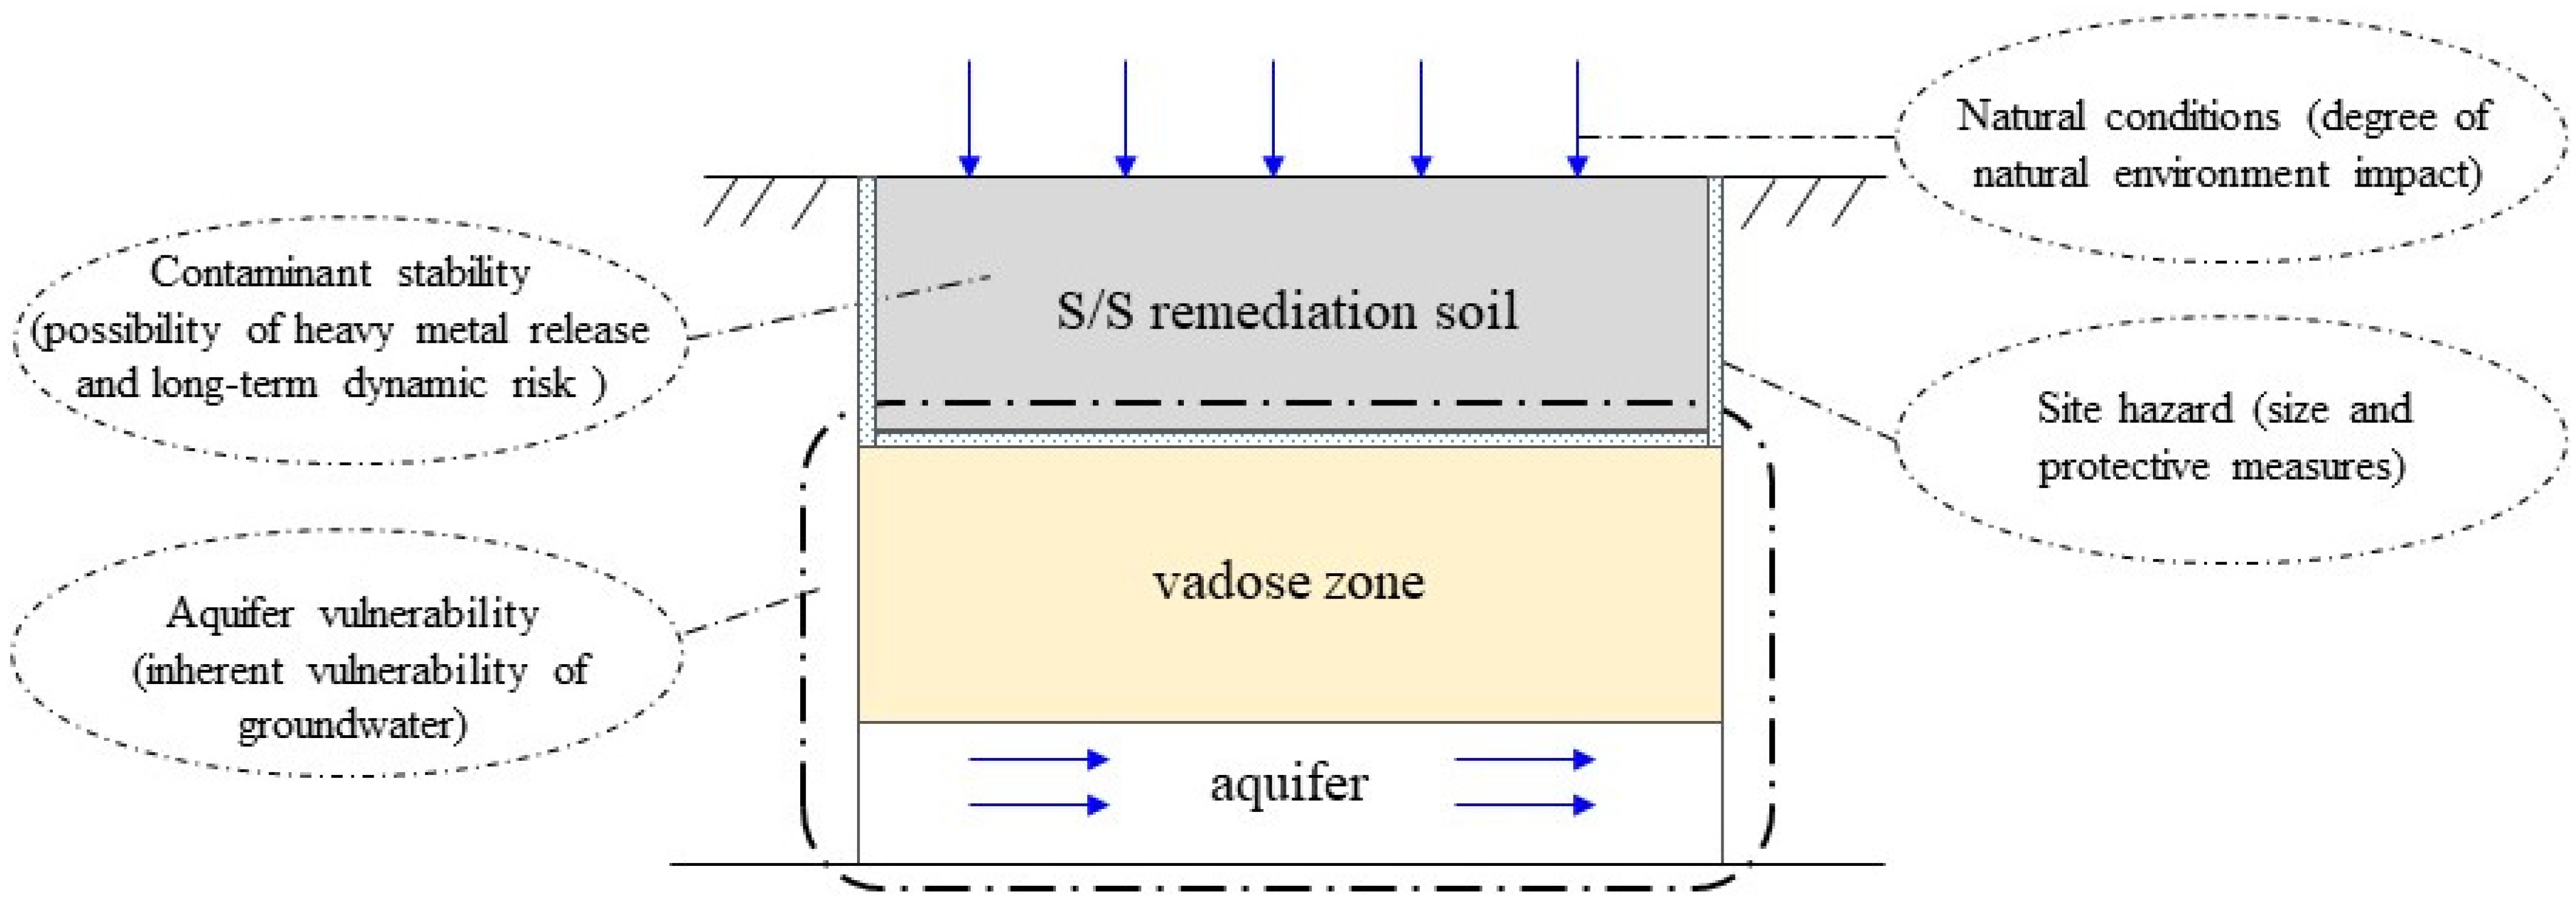
2.1. Conceptual Model

We combine the integration method of pollution sources—the vadose zone aquifer, taking S/S soil as the pollution source and considering the blocking effect of the underlying vadose zone. Taking groundwater as the risk receptor and screening the main influencing factors and evaluation indexes, the risk assessment conceptual model is shown in Figure 1. The risk assessment system includes four influences: site hazard (H), contaminant stability (S), aquifer vulnerability (V), and natural conditions (N). Aquifer vulnerability assesses the inherent vulnerability of groundwater, mainly the pollution resistance of the envelope and the ability of contaminants to disperse in the aquifer [20]. The remaining three influencing factors constitute the specific vulnerability of groundwater. Site hazard assesses the size of the site and protective measures. Contaminant stability assesses the possibility of heavy metal release from S/S soils and the long-term dynamic risk, which is determined by the stabilization effect, the properties of the heavy metals themselves, and the soil properties. Natural conditions assess the extent to which the site is affected by the natural environment, such as rainfall, freezing, and thawing.

2.2. Index System Construction

There are many factors affecting the risk of groundwater contamination at S/S sites. Following scientificity, characterizability, measurability, and operability principles, 18 evaluation indexes are selected from 4 evaluation factors (Figure 2).

2.2.1. Site Hazards

A larger site size represents an increase in the number of contamination sources, and some impermeable measures can be proactively deployed to prevent groundwater contamination from rainwater leaching and infiltration of contaminants [21]. In situ S/S injects remediation chemicals directly into the soil layer, which may lack bottom and side protection for contaminated soil [22], but when curing with cement-based materials, the cured soil has a high unconfined compressive strength (UCS) and low permeability coefficient [23], which is equivalent to having concrete protection in place. Ex situ S/S excavates the polluted soil and then performs S/S treatment. Protective measures can be installed to reduce environmental risks before the restored soil is buried [24]. Therefore, four evaluation indexes are selected: site size, top protection, side protection, and bottom protection.

2.2.2. Contaminant Stability

The stronger stability of the contaminant indicates the lower possibility of re-release. As mentioned above, the effect assessment of S/S includes the toxicity leaching method, sequential extraction method, etc. Three evaluation indexes that can be obtained experimentally are selected: toxicity leaching factor, stabilization efficiency, and leaching form ratio. However, these indexes are not sufficient to assess the long-term dynamic risk. Considering that the dynamic risk mainly originates from the change in soil environmental pH under the effect of acid rain and is also related to the type and content of heavy metals, three evaluation indexes of soil pH, organic matter and clay, and exceedance multiple of heavy metal are added considering the characteristics of heavy metals and the buffering effect of soil on pH. It is worth mentioning that although solidification and stabilization have different mechanisms on heavy metals, their long-term dynamic risks can still be assessed by the same indexes. The meaning of each index is described below.
(1) Toxicity leaching factor
Toxic leaching concentration needs to be lower than the standard limit. The toxicity leaching factor is defined as the ratio of leaching concentration to the hazardous waste identification standard limit. The lower the toxicity leaching factor, the lower the environmental risk. The calculation formula is shown in the following.
        k = c 1 C × 100 %
where   c 1 is the stabilized soil toxicity leaching concentration of S/S soil, and   C is the standard limit of hazardous waste identification, according to the “hazardous waste identification standards leaching toxicity identification (GB5085.3-2007)” requirements. The typical heavy metal hazardous waste identification standard limit values are shown in Table 1.
(2) Stabilization efficiency
Generally, the higher the stabilization efficiency, the lower the environmental risk. The calculation formula is shown in the following.
                  w = c 0 c 1 c 0 × 100 %
where c 0 is the toxic leaching concentration of unstabilized contaminated soil.
(3) Leachable form ratio
The RAC model has been widely used to assess the environmental risk of heavy metals in soils and is based on the leachable form of the ratio of solid phase matrix (Tessier: exchangeable (T1) and carbonate-bound (T2) [25,26]; or BCR: weak acid extraction [27]) to total heavy metals to assess the level of potential environmental risk in five classes: environmentally safe (<1%), low risk (1–10%), medium risk (11–30%), high risk (31–50%), and very high risk (>50%) [12,28].
(4) Soil pH
Soil heavy metal stabilization mechanisms include adsorption, surface precipitation, and immobilization [29]. Soil pH is considered the most critical factor affecting heavy metal release. Lower pH creates a positive charge on the soil surface, leading to easy desorption of heavy metals [30], and also leads to carbonate dissolution, allowing the release of heavy metals in the carbonate-bound state, as well as the decomposition of other soil fractions, such as aluminum and iron hydroxides, leading to the heavy metal release in these phases [31]. Acid rain action lowers soil pH and increases the risk of heavy metal leaching.
(5) Organic matter and clay
Organic matter forms complexes with heavy metals; this binding form is less susceptible to desorption and poses less environmental risk. Strawn found that Pb desorbed slowly from the SOM fraction of the soil and that the type of complex formed between Pb and SOM was stronger than the complex formed on the mineral surface [32]. Yujun found that the higher the organic carbon content of the soil, the higher the content of anti-desorption Hg(II), probably due to the preferential binding of Hg(II) to high-energy sites [33]. In addition, the higher the organic matter, the greater the soil cation exchange capacity and the greater the pH buffering effect [34,35,36].
Clay has a large specific surface area, a high CEC, and specific sorption sites; therefore, it also has a pH buffering capacity [31]. Curtin found that soil buffering capacity was strongly correlated with organic matter and positively correlated with clay content, but the correlation was weak (but significant, p < 0.05); however, the contribution of clay remained significant due to the much larger mass of clay than organic matter in the soil. Clay is estimated to contribute 12–37% (mean 21%) of the pH buffer [34]. Thus, although organic matter has a greater pH buffering effect than clay, the two are considered together because soil clay content is generally greater than organic matter.
(6) Exceedance multiple of heavy metals
The toxicity leaching experiment evaluated the leaching concentration, the proportion of heavy metal form was assessed by the sequential extraction method, and the total metal concentration was not considered. Even though the toxic leaching concentration met the requirements, an increase in soil heavy metal concentration implies an increase in the total amount of potentially releasable metals. In addition, although the leachable form ratio may be low, the amount of leaching increases with the increase in heavy metal concentration. Moreno conducted sorption and desorption experiments on ten soils, and it was found that Pb desorption was low (10%) for Pb concentrations of 500 and 1000 mg/kg; 30~35% for concentrations of 2000, 3000, and 4000 mg/kg; more than 50% for 5000 and 6000 mg/kg [3]. Considering the different toxicity of different heavy metals to the environment, the same concentration standard cannot be used. Thus, we define the exceedance multiple of heavy metals as the ratio between the total amount of heavy metals in soil and the screening value limit of the first type of land in the “Soil Environmental Quality-Construction Land Soil Pollution Risk Control Standard (GB 36600-2018) “. The limit value is set to protect human health and is based on the toxicity of different kinds of heavy metals. When the total amount of heavy exceeds the screening value, there may be risks to human health, and further risk assessment should be carried out. Typical heavy metal screening values for the first type of land are shown in Table 1.

2.2.3. Aquifer Vulnerability

DRASTIC assesses the potential of groundwater contamination based on a weighted combination of seven hydrogeologic parameters. Each DRASTIC parameter is assigned a weight of 1–5 depending on the relative importance of influencing contaminant inflow to groundwater, and different gradations of each parameter are assigned a score of 1–10. The higher the DRASTIC score, the higher the likelihood of contamination [14]. DRASTIC is often used in combination with other assessment indexes and is widely used to assess groundwater risk under various scenarios [14,15,17,18,20]. However, there are still some shortcomings, such as the determination of the scoring scale, weighting factors, and selection of evaluation indexes being subjective and having limitations in application in different regions [37]. Due to the lack of sensitivity of the soil medium (S) [20], while the soil pH, organic matter, and clay can reflect S/S soil properties, we delete the soil medium to better match the s/s heavy-metal-contaminated site characteristics, so the aquifer vulnerability includes the remaining DRATIC for a total of 6 evaluation indexes.

2.2.4. Natural Conditions

The driving force of the long-term risk of S/S heavy metals is mainly the variability in the natural environment, and the influencing factors of natural conditions mainly include indexes such as average annual rainfall, rainfall pH, and the number of freeze–thaw cycles. As the net recharge in DRASTIC is derived from rainfall calculation, the average annual rainfall is no longer included. Acid rain leaching can decrease soil pH, and the lower the rainfall pH, the higher the risk of heavy metal release [30,31]. Freeze–thaw causes changes in the size and stability of soil aggregates, resulting in increased permeability [38], and also accelerates the release of Fe-Mn oxides and dissolved organic matter from the soil, promoting the formation of soluble complexed heavy metals [39], thus allowing heavy metals to enter the aquifer. Therefore, natural conditions include two evaluation indexes: rainfall pH and freeze–thaw cycles.

2.2.5. Index System

Through the analysis and summary, the S/S heavy metal site groundwater pollution risk assessment index system is determined, as shown in Table 2.

2.3. Grading and Scoring Methods of Evaluation Indexes

Selection basis: ① refer to the literature on landfill and regional groundwater risk assessment; ② refer to information on examples of S/S remediation sites; ③ refer to the literature on the correlation between typical heavy metal desorption and soil properties; ④ according to national, industry, and locally prescribed standards; ⑤ grading and scoring of indexes by the expert scoring method.

2.4. Determination of Evaluation index Weights

The weights of each index reflect their importance in groundwater vulnerability assessment. The Analytic Hierarchy Process (AHP) is a multi-criteria decision-making method proposed by Saaty, which has become one of the most commonly used multi-criteria analysis methods to determine the weights of parameters in multi-criteria problems [20,40]. In the AHP method, each problem is modeled from top to bottom in a hierarchy consisting of an objective level, a criterion level, and an indicator level. The scaling method proposed by Saaty (Table 3) is used to score and create a two-by-two comparison matrix to assess the level of importance between the indexes included in a level. The weights are determined by normalizing the two-by-two comparison matrix. The weights are in the range of 0–1, and their sum equals 1.
A certain degree of inconsistency may occur when two criteria comparisons are made in the AHP method. Therefore, the logical consistency of the two-two comparisons must be checked. To measure the consistency of pairwise comparison judgments, the consistency ratio proposed by Saaty is used. The upper limit of this ratio proposed by Saaty is “0.10”. If the consistency ratio calculated for a judgment is lower than 0.10, the judgment is considered to show sufficient consistency to continue the evaluation. If the consistency ratio is higher than 0.10, the judgment is considered inconsistent, and further modifications are needed to reduce the consistency ratio.

2.5. Comprehensive Index Risk Evaluation Model

The four influencing factors are weighted and summed, while the risk assessment index of each influencing factor is equal to the weighted sum of its respective evaluation index. The comprehensive index of groundwater pollution risk (R) of the S/S site is calculated.
R = i = 1 4 X i W i = H × W H + S × W S + V × W V + N × W N
H = i = 1 4 C 1 i W 1 i
where Xi and Wi are the i-th influencing factor score and weight values, respectively; C 1 i and W 1 i are the score and weight of each index in the site hazard (H), respectively; the rest of each influencing factor is calculated by referring to Equation (4).

3. Results and discussion

3.1. Index Classification and Scoring

Evaluation indicators are divided into qualitative and quantitative indicators, qualitative indicators are classified into different risk levels according to different categories of indicators, and quantitative indicators are classified into different risk levels according to different value ranges of indicators. Each evaluation indicator is scored from 1 to 10 according to the risk level, with 1 representing the least risk and 10 representing the most risk.
The grading method and scoring values are shown in Table 4, Table 5, Table 6 and Table 7. The following is the grading and scoring process for several significant indexes.

3.1.1. Site Hazard Index Classification and Scoring

In evaluating the site size index, reference is made to the landfill size classification and the literature related to the status of Remediation of contaminated sites in China. The landfill’s first level is 5000 m3 and the maximum level is 500,000 m3 [18,41]. As landfills are generally large, it is necessary to reduce the corresponding value when evaluating the site scale index of contaminated sites. Ma surveyed 76 contaminated sites in China to support future remediation decisions of contaminated sites [42], and the scale of 76 sites ranged from 100 to 1,530,000 m3. To make these sites roughly evenly distributed in each grading, we take the first level as 2500 m3. The rest of the grading is shown in Table 4. After grading, the 76 sites in each grading proportion are 26%, 18%, 21%, 21%, and 13%; the most is in the 1st level, the least is in the 5th level, and the other levels are roughly the same distribution.
When evaluating the indexes of bottom protection, the environmental risk of heavy metals to groundwater can be significantly blocked when the site is equipped with a double-layer composite impermeable, so a minimum score of 1 is given. When no protection measures are equipped, and the underlying medium is natural sand and gravel, it means that almost all heavy metals can enter the groundwater after being re-released, and the environmental risk is greatest, so a maximum score of 10 is given. Other protective measures are given intermediate scores according to the protective effect.

3.1.2. Contaminant Stability Index Grading and Scoring

In evaluating the organic matter and clay indexes, we refer to the Siga model rating curve for assigning scores. The Siga model establishes the vulnerability rating curve of the soil by the dry weight content of clay and organic matter, and the vulnerability rating is inversely proportional to the organic matter and fines content, with the maximum risk (CNS = 10) set at 0% and the minimum risk (CNS = 1) ≥ 65% [43], calculated as follows.
  C N S = 10 13.85 F A + F M O
where C N S is the soil vulnerability class, and F A and F M O are the clay and organic matter content, respectively.
In evaluating soil pH index, the effect of pH on soil buffering capacity and heavy metal leaching is considered comprehensively. As pH exhibits different properties for heavy metals in cationic groups (Pb, Cu, Zn, Cd, Ni, Hg) and heavy metals in anionic groups (Cr, As), they need to be discussed separately.
For cationic heavy metals, remediation agents can increase soil pH to increase soil resistance to acid erosion [36,44], while increasing pH also causes heavy metals to precipitate or adsorb into the soil, reducing heavy metal leaching [45,46]. Thus, a soil pH of 7.5–10 is the lowest risk. However, many heavy metals will exhibit amphoteric behavior in alkaline regions with high pH. Leaching of Pb increases with an increasing dosage of stabilizing agents [47]; Cu leaching rate is usually lowest at slightly alkaline pH, but at high alkaline conditions (>10), leaching increases due to the formation of soluble hydroxide complexes instead [48]. In addition, at high-alkaline conditions, partial dissolution of soil organic matter increases the leachability of heavy metals by binding Pb and Cu to dissolved organic matter [49], so when pH ≥ 10, we give a slightly higher risk value of 3. The risk gradually increases when the pH decreases; therefore, the assigned score also gradually increases.
Cr and As occur as oxygen anions and are at greatest risk in the strongly acidic range as cationic heavy metals. In the alkaline pH range, on the one hand, it increases soil buffering capacity, but the increased OH- also competes with anionic heavy metals for sorption sites while increasing the risk of conversion of Cr(III) to Cr(VI) and As(V) to As(III), both more mobility and toxicity [48]. In addition, under highly alkaline conditions, soil-dissolved organic matter can compete with As for adsorption sites [50]. In the weak acid range, soil surface H+ increases, leading to the adsorption of anions [51]. Many studies have also found the lowest Cr and As leaching concentrations in the 6.5–7.5 range [52,53], thus giving a minimum score of 1, a higher score in the highly alkaline and acidic regions, and intermediate values in the rest.

3.1.3. Aquifer Vulnerability Index Classification and Scoring

Considering that the DRASTIC model is widely used with better results [14,20], we directly use the range of values and scores of the parameters in DRASTIC.

3.1.4. Grading and Scoring of Natural Condition Indexes

The greater the number of freeze–thaw cycles, the greater the effect on soil damage [54]. Zhongping found that the rate of increase in Pb2+ leaching concentration was relatively low when the number of freeze–thaw cycles was less than 30, and the rate of increase in Pb2+ leaching concentration increased as the number of freeze–thaw cycles increased [55]. We use the website of the China Meteorological Administration to find the meteorological statistics of representative cities in China during 1997–2006 and count a freeze–thaw cycle when the temperature is below −5 °C and the temperature increases to above +5 °C on the same day. We calculate the number of freeze–thaw cycles in the representative cities of China and find that the number of freeze–thaw cycles in the representative cities of China ranges from 0 to 78. As the effect on S/S heavy metals is not obvious at a lower number of freeze–thaw cycles (compared with 30) [55], the first level is set to 5 times and the maximum level is set to 50 times.

3.2. Calculation of Weights

The judgments (relative importance of the parameters) in the two-by-two comparison matrix are determined by reviewing the relevant literature and consulting a team of experts through a questionnaire to synthesize the opinions. We use the example of contaminant stability to illustrate the process of calculating the weights.
First, the judgment matrix (Table 8) is constructed, the judgment matrix is solved using the sum-product method, the eigenvectors of the judgment matrix are calculated as ω = [0.2218, 0.0459, 0.0459, 0.3831, 0.2218, 0.0814]T, the maximum eigenvalue λmax = 6.03, the consistency index CI = 0.0054, and the random consistency index RI = 1.24. Consistency ratio CR = 0.0043, CR < 0.10, indicating that the consistency of the judgment matrix hierarchical single ordering is acceptable. Therefore, C21–C26 weights are 0.2218, 0.0459, 0.0459, 0.3831, 0.2218, and 0.0814, respectively. The weights of the remaining indexes are shown in Table 2, the hierarchical total ranking weights also need to be tested for consistency, and the hierarchical total ranking value CR = 0.0082, CR < 0.10 indicates that the consistency of hierarchical total ranking is acceptable.
After obtaining the original weights of the 4 influencing factors in the criterion level and the 18 evaluation indicators in the indicator layer, the original weights of the criterion level and the original weights of the evaluation indicators in the indicator layer are multiplied to obtain the comprehensive weights of each evaluation indicator, and the sum of all indicator weights is also 1.
The comprehensive weights of the evaluation indicators within the 4 influencing factors are added to obtain the comprehensive weights of the 4 influencing factors. The comprehensive weights of site hazard, contaminant stability, aquifer vulnerability, and natural conditions are 0.1894, 0.3508, 0.3508, and 0.1090, respectively, which also represent the weighting of the 4 influencing factors on the groundwater pollution risk assessment of 18.94%, 35.08%, 35.08%, and 10.90%, respectively. This indicates that the contaminant stability and aquifer vulnerability of the S/S site has the most significant degree of influence on groundwater. Increasing the stability of S/S contaminants and selecting sites with higher aquifer vulnerability can reduce the risk of groundwater contamination by S/S heavy metals. We also reduce the risk of groundwater contamination by installing additional engineering protection measures to reduce the site hazard.
According to Figure 3, it can be seen that the most significant weight among the 18 evaluation indicators is the leachable form ratio, which is 0.1344, followed by depth to water table and impact of vadose zone, both of which are 0.1013. The leachable form ratio determines the percentage of S/S heavy metals easily re-released by external influence, which directly reflects the remediation effect of S/S remediation agents, and this evaluation indicator should be considered first when selecting S/S remediation agents. Depth to water table and impact of vadose zone reflect the inherent vulnerability of groundwater at S/S sites, and these two indicators need to be considered first when selecting a site for S/S heavy metal soil landfill.
The least weight is given to side protection at 0.0112, followed by topography and the number of freeze–thaw cycles, both with a weight of 0.0158, indicating that these indicators can be appropriately dropped from consideration when weighing groundwater risk and remediation costs. However, although these indicators have a small weight among all evaluation indicators, it should be noted that the weights only assess the relative importance of these indicators and do not mean that they are absolutely unimportant.

3.3. Evaluation Level Classification

The sum of all evaluation index weights is 1, and all evaluation index scores are between 1 and 10, implying that the R calculated by Equations (3) and (4) takes a value between 1 and 10. The equal spacing method is used to classify the pollution risk into five intervals (Table 9), corresponding to five risk levels in turn (very low risk [0, 2), low risk [2, 4), medium risk [4, 6), high risk [6, 8), and very high risk [8, 10]). Environmental management can establish regulatory measures adapted to the risk level.

3.4. Case Study

3.4.1. Study Site

The study area is located in a site left after the relocation of a chemical enterprise in Liaoning Province, Northeast China. The site has about 20 years of history so far. The soil heavy metals As and Cd in the site exceed the standard. The contaminated area is 89,036 m2. After the contaminated soil is stabilized to meet the standard, the site is planned as a park green space and square. Most of the site is flat. Some areas are slightly undulating, and the shallow stratigraphic lithology mainly consists of clay, gravel, industrial waste, etc., with a gravel content of 30% to 50%, particle sizes of 1 to 15 cm, a seed diameter greater than 20 cm block, and a deep stratigraphic lithology of medium weathering block gray dolomite, debris structure, and laminar structure. The groundwater level is shallow, generally about 0.40~3.60 m underground. The main aquifer is a miscellaneous fill and strongly weathered dolomitic tuff, and groundwater mainly receives atmospheric precipitation and infiltration recharge from surrounding rivers. The project area belongs to a temperate continental monsoon climate, four distinct seasons, and mild climate. The average annual temperature is 11.6 °C, the average yearly rainfall is 581.30 mm, and precipitation is mainly concentrated in the May–September flood season, accounting for about 70% of the total annual rainfall. The heavy-metal-contaminated soil in the project area has been remediated with stabilizing agents in the early stage. The stabilizing agents are mainly alkaline oxides. The compound curing/stabilizing agents contain Ca, Si, Al, and other components, with an addition ratio of 3%, and the toxic leaching concentration of heavy metals in the soil after remediation meets the limit value.

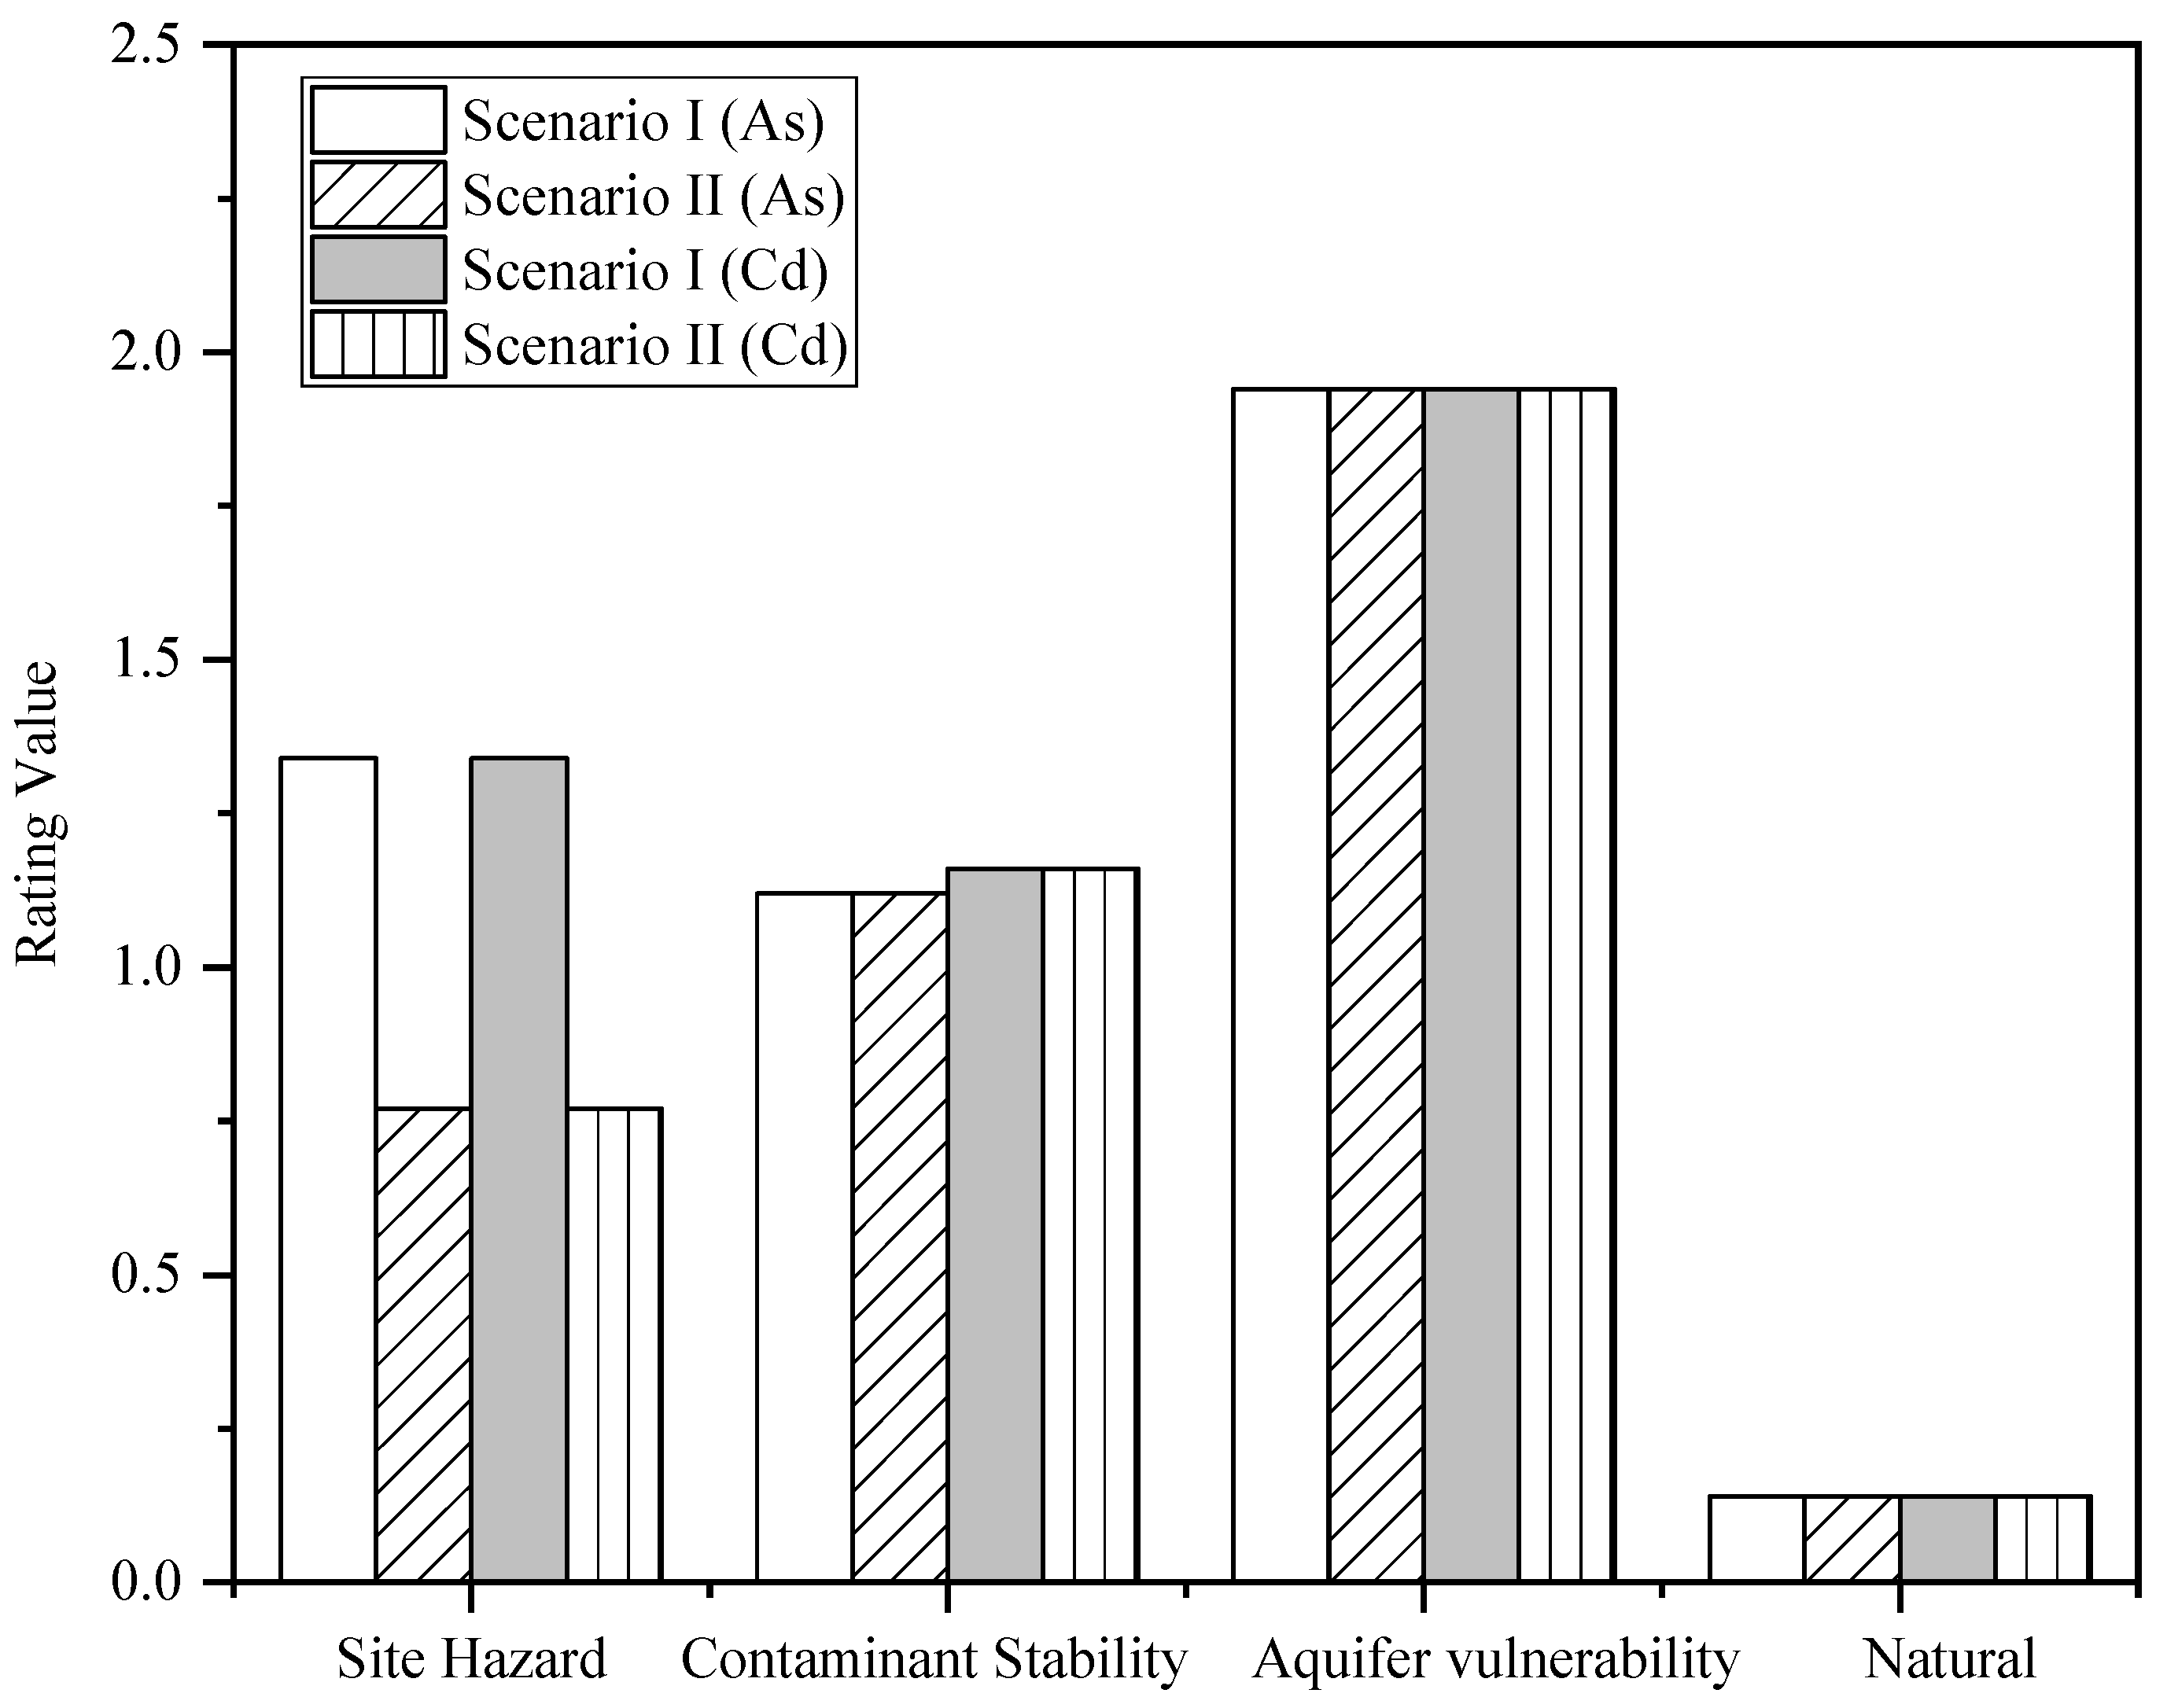
3.4.2. Risk Assessment

Our objective is to apply a risk assessment model to evaluate the risk of groundwater contamination when the stabilized soil is landfilled in situ by collecting information and remediation parameters in the project area, and it can provide a reference basis for later project decisions. We assume two scenarios. Scenario 1: Stabilization of heavy-metal-contaminated soil and direct landfill in place. Scenario 2 is supplemental protective measures around the landfill site. The parameter values of each evaluation index are shown in Table 10 below.
The combined groundwater contamination risk indices for As and Cd are 4.55 and 4.58 at a direct landfill, respectively, both being medium risk, and when supplemented with protective measures, the combined groundwater contamination risk indices for As and Cd are 3.98 and 4.02, respectively, with the risk of As to groundwater reduced to low risk, but Cd still being medium risk.
In both scenarios, Cd’s integrated index of groundwater contamination risk is greater than that for As. As we can see from Figure 4, the reason is that the stability scores of Cd and As are 1.16 and 1.12 for contaminants in both scenarios, which indicates that the stability of Cd in S/S soil is lower than that of As in this site, resulting in a greater risk of groundwater contamination. Further analysis of the differences in the evaluation indexes of the indicator layer shows that Cd and As have different scores in the leachable form ratio and soil pH, with 0.67 and 0.40 for the leachable form ratio and 0.08 and 0.31 for the soil pH, respectively. A proportion of 12.5% of the Cd leachable form ratio is greater than 9.05% of the As, resulting in the index levels of level 3 and level 2 for the leachable form ratio of Cd and As, respectively (Table 5) and assigning scores of 5 and 3, respectively, with greater risk for Cd. There have been many studies showing that Cd in soil heavy metals belong to high activity and easy release [51,56,57], and further research is needed to reduce the leachable form ratio of Cd.
Although the soil pH is 9.05, Cd and As have different properties for pH changes due to their cationic and anionic group heavy metals, respectively.
In the soil pH index, Cd and As are graded as level 2 and level 3 and assigned different scores of 1 and 4, respectively (Table 5), with As being more risky.
The different scores assigned to the two heavy metals multiplied by the evaluation index weights result in different scoring values. Therefore, for compound heavy-metal-contaminated sites, the effect of soil pH change on different heavy metal ions needs to be considered comprehensively, and the soil pH control near 7.5 may be less risky for different heavy metals (Table 5) [45,46,52,53].
We calculate the sum of the scores of aquifer vulnerability as a percentage of the total score of all evaluation indicators in each scenario and then find the arithmetic mean. The average percentage of aquifer vulnerability score reaches 45.50%. However, the weight of the aquifer vulnerability is only 35.08%, indicating that the site groundwater is vulnerable to contamination and in situ landfill S/S soil is at risk.
It can also be seen that to reduce the risk of in situ landfill S/S soil, on the one hand, the stability of S/S heavy metals can be improved, and the other is to actively deploy protective measures. To further reduce the risk, the terrain’s slope can be increased to improve the surface drainage capacity. When the slope of the ground is increased to 6%, the index score can be reduced from 10 to 5, so the comprehensive index of groundwater pollution risk of As and Cd can be reduced to 3.94 and 3.90, both of which are low risk.

4. Conclusions

S/S heavy-metal-contaminated soils still have the risk of secondary groundwater contamination, and if the stabilized soils are all transported to landfills for disposal, not only is the economic cost high, but land resources will also be wasted. There is a lack of groundwater risk assessment models for the special vulnerability of S/S heavy-metal-contaminated sites. Therefore, we constructed a groundwater pollution risk assessment index system including 4 influencing factors such as site hazard, pollutant hazard, aquifer vulnerability, and natural conditions with a total of 18 evaluation indexes by analyzing the system structure of solidified/stabilized heavy-metal-contaminated sites. Each evaluation index was graded and assigned a scoring value; combined with AHP to calculate index weights, the isometric method was used to classify the pollution risk into five risk levels, and a groundwater comprehensive index pollution risk assessment model was established.
The model was applied to the actual site, and the results showed that the combined groundwater contamination risk indices for As and Cd were 4.55 and 4.58 for the direct landfill scenario of remediated soil, respectively, both of which were medium risk. When the perimeter protection measures were supplemented, the combined groundwater contamination risk indices for As and Cd were 3.98 and 4.02, and the risk of As to groundwater was reduced to low risk, but Cd was still medium risk. In both scenarios, the combined groundwater contamination risk index for Cd was greater than that for As because the contaminant stability of As was higher than that of Cd at the modified site.
The original site’s hydrogeological conditions are fragile, groundwater is susceptible to contamination, and in situ landfilling of consolidated/stabilized soil is risky. To further reduce the risk, the topographic slope was increased, thereby increasing the surface drainage capacity, which reduced the combined groundwater contamination risk index to 3.94 and 3.90 for As and Cd, respectively, both of which were low risk.
This study provides a new method for assessing the risk of groundwater contamination at solidified/stabilized heavy-metal-contaminated sites, which is simple and practical and requires less work and data. It is easy to operate and also suitable for comparative evaluation of S/S sites, allowing priority levels to be set for effective management of S/S heavy-metal-contaminated sites. In addition, the assessment system can provide a reference for the selection of remediation agents for S/S remediation, evaluation of remediation effects, and also for the selection of new landfill areas for S/S heavy metal soils; the proposed method can suggest better site selection and construction strategies to protect the surrounding environment.
Due to the limitations of the collected data and evaluation methods, the established risk evaluation index system and evaluation results have a certain degree of uncertainty. Long-term soil and groundwater environmental monitoring of S/S heavy-metal-contaminated sites is needed to further verify the method’s practicality.

Author Contributions

Writing—original draft, review and editing, Z.W.; conceptualization, funding acquisition, Z.C. All authors have read and agreed to the published version of the manuscript.

Funding

This research was funded by the National Key R&D Program of China (No. 2020YFC1806403-2). The authors appreciate the contribution of State-Local joint engineering lab for control and remediation technologies of the petrochemical contaminated site.

Institutional Review Board Statement

Not applicable.

Informed Consent Statement

Not applicable.

Data Availability Statement

Not applicable.

Conflicts of Interest

The authors declare no conflict of interest.

References

  1. Ministry of Environmental Protection; Ministry of Land and Resources. National Soil Pollution Status Survey Bulletin; Ministry of Environmental Protection: Beijing, China, 2014. [Google Scholar]
  2. US EPA. Innovative Treatment Technologies for Site Cleanup, 12th ed.; Annual Status Report, EPA 542-R-07-012; US EPA: Washington, DC, USA, 2007. [Google Scholar]
  3. Moreno, A.M.; Quintana, J.R.; Pérez, L.; Parra, J.G. Factors influencing lead sorption–desorption at variable added metal concentrations in Rhodoxeralfs. Chemosphere 2006, 64, 758–763. [Google Scholar] [CrossRef] [PubMed]
  4. Liu, S.; Miao, C.; Yao, S.; Ding, H.; Zhang, K. Soil stabilization/solidification (S/S) agent—Water-soluble thiourea formaldehyde (WTF) resin: Mechanism and performance with cadmium (Ⅱ). Environ. Pollut. 2021, 272, 116025. [Google Scholar] [CrossRef] [PubMed]
  5. Reddy, V.A.; Solanki, C.H.; Kumar, S.; Reddy, K.R.; Du, Y.-J. Comparison of limestone calcined clay cement and ordinary Portland cement for stabilization/solidification of Pb-Zn smelter residue. Environ. Sci. Pollut. Res. 2021, 29, 11393–11404. [Google Scholar] [CrossRef] [PubMed]
  6. Shen, Z.; Hou, D.; Xu, W.; Zhang, J.; Jin, F.; Zhao, B.; Pan, S.; Peng, T.; Alessi, D.S. Assessing long-term stability of cadmium and lead in a soil washing residue amended with MgO-based binders using quantitative accelerated ageing. Sci. Total Environ. 2018, 643, 1571–1578. [Google Scholar] [CrossRef] [PubMed]
  7. Dong, H.; Yoneda, M.; Feng, L. Risk dynamic evolution index based on fraction transformation and its application to site risk assessment. J. Hazard. Mater. 2021, 412, 125210. [Google Scholar] [CrossRef]
  8. Xue, Q.; Wang, P.; Li, J.-S.; Zhang, T.-T.; Wang, S.-Y. Investigation of the leaching behavior of lead in stabilized/solidified waste using a two-year semi-dynamic leaching test. Chemosphere 2017, 166, 1–7. [Google Scholar] [CrossRef]
  9. Zhang, X.; Tong, J.; Hu, B.; Wei, W. Adsorption and desorption for dynamics transport of hexavalent chromium (Cr(VI)) in soil column. Environ. Sci. Pollut. Res. 2017, 25, 459–468. [Google Scholar] [CrossRef]
  10. Suzuki, T.; Nakamura, A.; Niinae, M.; Nakata, H.; Fujii, H.; Tasaka, Y. Lead immobilization in artificially contaminated kaolinite using magnesium oxide-based materials: Immobilization mechanisms and long-term evaluation. Chem. Eng. J. 2013, 232, 380–387. [Google Scholar] [CrossRef]
  11. Zha, F.; Liu, C.; Kang, B.; Yang, X.; Zhou, Y.; Yang, C. Acid rain leaching behavior of Zn-contaminated soils solidified/stabilized using cement–soda residue. Chemosphere 2021, 281, 130916. [Google Scholar] [CrossRef]
  12. Li, Z.; Gong, Y.; Zhao, D.; Deng, H.; Dang, Z.; Lin, Z. Field assessment of carboxymethyl cellulose bridged chlorapatite microparticles for immobilization of lead in soil: Effectiveness, long-term stability, and mechanism. Sci. Total Environ. 2021, 781, 146757. [Google Scholar] [CrossRef]
  13. Wang, F.; Wang, H.; Al-Tabbaa, A. Leachability and heavy metal speciation of 17-year old stabilised/solidified contaminated site soils. J. Hazard. Mater. 2014, 278, 144–151. [Google Scholar] [CrossRef] [PubMed]
  14. Wang, J.; He, J.; Chen, H. Assessment of groundwater contamination risk using hazard quantification, a modified DRASTIC model and groundwater value, Beijing Plain, China. Sci. Total Environ. 2012, 432, 216–226. [Google Scholar] [CrossRef] [PubMed]
  15. Zhao, Y.; Zhang, J.; Chen, Z.; Zhang, W. Groundwater contamination risk assessment based on intrinsic vulnerability, pollution source assessment, and groundwater function zoning. Hum. Ecol. Risk Assess. Int. J. 2019, 25, 1907–1923. [Google Scholar] [CrossRef]
  16. Aller, L.; Bennett, T.; Lehr, J.; Petty, R.J.; Hackett, G. DRASTIC: A Standardized System for Evaluating Groundwater Pollution Potential Using Hydrogeologics; US Environmental Protection Agency: Washington, DC, USA, 1987. [Google Scholar]
  17. Huan, H.; Zhang, B.-T.; Kong, H.; Li, M.; Wang, W.; Xi, B.; Wang, G. Comprehensive assessment of groundwater pollution risk based on HVF model: A case study in Jilin City of northeast China. Sci. Total Environ. 2018, 628–629, 1518–1530. [Google Scholar] [CrossRef]
  18. Zhang, B.; Li, G.; Cheng, P.; Yeh, T.-C.J.; Hong, M. Landfill Risk Assessment on Groundwater Based on Vulnerability and Pollution Index. Water Resour. Manag. 2016, 30, 1465–1480. [Google Scholar] [CrossRef]
  19. Zhao, X.; Wang, D.; Xu, H.; Ding, Z.; Shi, Y.; Lu, Z.; Cheng, Z. Groundwater pollution risk assessment based on groundwater vulnerability and pollution load on an isolated island. Chemosphere 2021, 289, 133134. [Google Scholar] [CrossRef]
  20. Zhang, Q.; Li, P.; Lyu, Q.; Ren, X.; He, S. Groundwater contamination risk assessment using a modified DRATICL model and pollution loading: A case study in the Guanzhong Basin of China. Chemosphere 2021, 291, 132695. [Google Scholar] [CrossRef]
  21. Hu, G.; Liu, H.; Chen, C.; Hou, H.; Li, J.; Hewage, K.; Sadiq, R. Low-temperature thermal desorption and secure landfill for oil-based drill cuttings management: Pollution control, human health risk, and probabilistic cost assessment. J. Hazard. Mater. 2021, 410, 124570. [Google Scholar] [CrossRef]
  22. Fleri, M.A.; Whetstone, G.T. In situ stabilisation/solidification: Project lifecycle. J. Hazard. Mater. 2007, 141, 441–456. [Google Scholar] [CrossRef]
  23. Al-Tabbaa, A.; Boes, N. Pilot in situ auger mixing treatment of a contaminated site. Part 4. Performance at five years. Proc. Inst. Civ. Eng. -Geotech. Eng. 2002, 155, 187–202. [Google Scholar] [CrossRef]
  24. Lu, S.F.; Wu, Y.L.; Chen, Z.; Li, T.; Shen, C.; Xuan, L.K.; Xu, L. Remediation of contaminated soil and groundwater using chemical reduction and solidification/stabilization method: A case study. Environ. Sci. Pollut. Res. 2021, 28, 12766–12779. [Google Scholar] [CrossRef]
  25. Khadhar, S.; Sdiri, A.; Chekirben, A.; Azouzi, R.; Charef, A. Integration of sequential extraction, chemical analysis and statistical tools for the availability risk assessment of heavy metals in sludge amended soils. Environ. Pollut. 2020, 263, 114543. [Google Scholar] [CrossRef]
  26. Setia, R.; Dhaliwal, S.S.; Singh, R.; Kumar, V.; Taneja, S.; Kukal, S.S.; Pateriya, B. Phytoavailability and human risk assessment of heavy metals in soils and food crops around Sutlej river, India. Chemosphere 2020, 263, 128321. [Google Scholar] [CrossRef] [PubMed]
  27. Sundaray, S.K.; Nayak, B.B.; Lin, S.; Bhatta, D. Geochemical speciation and risk assessment of heavy metals in the river estuarine sediments—A case study: Mahanadi basin, India. J. Hazard. Mater. 2011, 186, 1837–1846. [Google Scholar] [CrossRef] [PubMed]
  28. Liu, H.L.; Li, H.L.; Yin, C.Q.; Shan, B. Fraction distribution and risk assessment of heavy metals in sediments of Moshui Lake. J. Environ. Sci. 2008, 20, 390–397. [Google Scholar] [CrossRef]
  29. Lee, S.Z.; Allen, H.E.; Huang, C.P.; Sparks, D.L.; Sanders, P.F.; Peijnenburg, W.J. Predicting soil− water partition coefficients for cadmium. Environ. Sci. Technol. 1996, 30, 3418–3424. [Google Scholar] [CrossRef]
  30. Jing, Y.; He, Z.; Yang, X. Effects of pH, organic acids, and competitive cations on mercury desorption in soils. Chemosphere 2007, 69, 1662–1669. [Google Scholar] [CrossRef]
  31. Ottosen, L.M.; Hansen, H.K.; Jensen, P.E. Relation between pH and desorption of Cu, Cr, Zn, and Pb from industrially polluted soils. Water Air Soil Pollut. 2009, 201, 295–304. [Google Scholar] [CrossRef]
  32. Strawn, D.G.; Sparks, D.L. Effects of Soil Organic Matter on the Kinetics and Mechanisms of Pb(II) Sorption and Desorption in Soil. Soil Sci. Soc. Am. J. 2000, 64, 144–156. [Google Scholar] [CrossRef]
  33. Yin, Y.; Allen, H.E.; Huang, C.P.; Sparks, D.L.; Sanders, P.F. Kinetics of Mercury(II) Adsorption and Desorption on Soil. Environ. Sci. Technol. 1997, 31, 496–503. [Google Scholar] [CrossRef]
  34. Curtin, D.; Trolove, S. Predicting pH buffering capacity of New Zealand soils from organic matter content and mineral characteristics. Soil Res. 2013, 51, 494–502. [Google Scholar] [CrossRef]
  35. Shaheen, S.M. Sorption and lability of cadmium and lead in different soils from Egypt and Greece. Geoderma 2009, 153, 61–68. [Google Scholar] [CrossRef]
  36. Gwenzi, W.; Gora, D.; Chaukura, N.; Tauro, T. Potential for leaching of heavy metals in open-burning bottom ash and soil from a non-engineered solid waste landfill. Chemosphere 2016, 147, 144–154. [Google Scholar] [CrossRef] [PubMed]
  37. Qian, H.; Li, P.; Howard, K.W.F.; Yang, C.; Zhang, X. Assessment of groundwater vulnerability in the Yinchuan Plain, Northwest China using OREADIC. Environ. Monit. Assess. 2011, 184, 3613–3628. [Google Scholar] [CrossRef] [PubMed]
  38. Wei, M.L.; Du, Y.J.; Reddy, K.R.; Wu, H.L. Effects of freeze-thaw on characteristics of new KMP binder stabilized Zn-and Pb-contaminated soils. Environ. Sci. Pollut. Res. 2015, 22, 19473–19484. [Google Scholar] [CrossRef]
  39. McIntyre, A.M.; Guéguen, C. Binding interactions of algal-derived dissolved organic matter with metal ions. Chemosphere 2013, 90, 620–626. [Google Scholar] [CrossRef] [PubMed]
  40. Şener, Ş.; Şener, E.; Nas, B.; Karagüzel, R. Combining AHP with GIS for landfill site selection: A case study in the Lake Beyşehir catchment area (Konya, Turkey). Waste Manag. 2010, 30, 2037–2046. [Google Scholar] [CrossRef]
  41. Liu, Z.C.; He, L.S.; Dong, J.; Meng, R.; Song, B.Y.; Xi, B.D. Risk assessment of groundwater pollution for simple waste landfill. Res. Environ. Sci. 2012, 25, 833–839. [Google Scholar]
  42. Ma, Y.; Dong, B.; Bai, Y.; Zhang, M.; Xie, Y.; Shi, Y.; Du, X. Remediation status and practices for contaminated sites in China: Survey-based analysis. Environ. Sci. Pollut. Res. 2018, 25, 33216–33224. [Google Scholar] [CrossRef]
  43. Ibe, K.M.; Nwankwor, G.I.; Onyekuru, S.O. Assessment of ground water vulnerability and its application to the development of protection strategy for the water supply aquifer in Owerri, Southeastern Nigeria. Environ. Monit. Assess. 2001, 67, 323–360. [Google Scholar] [CrossRef]
  44. Reddy, V.A.; Solanki, C.H.; Kumar, S.; Reddy, K.R.; Du, Y.-J. Stabilization/Solidification of Zinc- and Lead-Contaminated Soil Using Limestone Calcined Clay Cement (LC3): An Environmentally Friendly Alternative. Sustainability 2020, 12, 3725. [Google Scholar] [CrossRef]
  45. Xia, W.-Y.; Feng, Y.-S.; Jin, F.; Zhang, L.-M.; Du, Y.-J. Stabilization and solidification of a heavy metal contaminated site soil using a hydroxyapatite based binder. Constr. Build. Mater. 2017, 156, 199–207. [Google Scholar] [CrossRef]
  46. Reddy, V.A.; Solanki, C.H.; Kumar, S.; Reddy, K.R.; Du, Y.-J. New ternary blend limestone calcined clay cement for solidification/stabilization of zinc contaminated soil. Chemosphere 2019, 235, 308–315. [Google Scholar] [CrossRef] [PubMed]
  47. Kogbara, R.B.; Al-Tabbaa, A.; Yi, Y.; Stegemann, J.A. pH-dependent leaching behaviour and other performance properties of cement-treated mixed contaminated soil. J. Environ. Sci. 2012, 24, 1630–1638. [Google Scholar] [CrossRef]
  48. Kumpiene, J.; Lagerkvist, A.; Maurice, C. Stabilization of As, Cr, Cu, Pb and Zn in soil using amendments–a review. Waste Manag. 2008, 28, 215–225. [Google Scholar] [CrossRef]
  49. Voglar, G.E.; Leštan, D. Solidification/stabilisation of metals contaminated industrial soil from former Zn smelter in Celje, Slovenia, using cement as a hydraulic binder. J. Hazard. Mater. 2010, 178, 926–933. [Google Scholar] [CrossRef]
  50. Redman, A.D.; Macalady, D.L.; Ahmann, D. Natural Organic Matter Affects Arsenic Speciation and Sorption onto Hematite. Environ. Sci. Technol. 2002, 36, 2889–2896. [Google Scholar] [CrossRef] [PubMed]
  51. Rodrigues, S.; Henriques, B.; da Silva, E.F.; Pereira, M.; Duarte, A.; Groenenberg, J.; Römkens, P. Evaluation of an approach for the characterization of reactive and available pools of 20 potentially toxic elements in soils: Part IISolid-solution partition relationships and ion activity in soil solutions. Chemosphere 2010, 81, 1560–1570. [Google Scholar] [CrossRef]
  52. Yu, Y.; Qu, G.; Wu, B.; Lu, Q.; Ning, P. Characterization of the Stabilization of Arsenic in Mine Tailings. Anal. Lett. 2017, 50, 1862–1875. [Google Scholar] [CrossRef]
  53. Rodrfguez-Piñero, M.; Pereira, C.F.; de Elvira Francoy, C.R.; Vale Parapar, J.F. Stabilization of a chromium-containing solid waste: Immobilization of hexavalent chromium. J. Air Waste Manag. Assoc. 2011, 48, 1093–1099. [Google Scholar] [CrossRef]
  54. Mohanty, S.K.; Saiers, J.E.; Ryan, J.N. Colloid-facilitated mobilization of metals by freeze–thaw cycles. Environ. Sci. Technol. 2014, 48, 977–984. [Google Scholar] [CrossRef] [PubMed]
  55. Zhongping, Y.; Yao, W.; Xuyong, L.; Shupei, R.; Hui, X.; Jiazhuo, C. The effect of long-term freeze-thaw cycles on the stabilization of lead in compound solidified/stabilized lead-contaminated soil. Environ. Sci. Pollut. Res. 2021, 28, 37413–37423. [Google Scholar] [CrossRef] [PubMed]
  56. Islam, M.N.; Taki, G.; Nguyen, X.P.; Jo, Y.-T.; Kim, J.; Park, J.-H. Heavy metal stabilization in contaminated soil by treatment with calcined cockle shell. Environ. Sci. Pollut. Res. 2017, 24, 7177–7183. [Google Scholar] [CrossRef] [PubMed]
  57. Xu, M.; Zhao, Z.; Song, Y.; Li, J.; You, Y.; Li, J. Evaluation of ferrihydrite-humic acid coprecipitate as amendment to remediate a Cd-and Pb-contaminated soil. Geoderma 2020, 361, 114131. [Google Scholar] [CrossRef]
Figure 1. The conceptual model for risk assessment of groundwater contamination at S/S sites.
Sustainability 15 02997 g001
Figure 2. Groundwater pollution risk assessment framework diagram of the S/S site.
Sustainability 15 02997 g002
Figure 3. Evaluation indicators weights.
Sustainability 15 02997 g003
Figure 4. Influence factor score values.
Sustainability 15 02997 g004
Table 1. Soil pollution risk screening value and toxic leaching concentration limits of typical heavy metals.
Heavy Metal TypePbCuZnCdNiCr(VI)AsHg
Screening value (mg/kg)4002000-201503208
Leaching concentration limit (mg/L)510010015550.1
Table 2. Index system for assessing the risk of groundwater contamination at S/S heavy metal sites.
Target Layer ASystem Layer BIndex Layer C
Influencing FactorsWeightEvaluation IndexesOriginal WeightCombined Weight
Risk assessment of groundwater contamination at S/S heavy metal sitesSite Hazard B10.1893Site Size C110.51320.0972
Top protection C120.14780.0280
Side protection C130.05940.0112
Bottom protection C140.28000.0530
Contaminant stability B20.3509Exceedance multiple of heavy metals C210.22180.0778
Stabilization efficiency C220.04590.0161
Toxicity leaching factor C230.04590.0161
Leachable form ratio C240.38310.1344
Soil pH C250.22180.0778
Organic matter and clay C260.08140.0286
Aquifer Vulnerability B30.3509Depth to water table C310.28870.1013
Net recharge of aquifer C320.17240.0605
Topography C330.04510.0158
Impact of vadose zone C340.28870.1013
Hydraulic conductivity C350.10240.0359
Aquifer media C360.10240.0359
Natural conditions B40.1094Rainfall pH C410.85590.0936
Freeze-thaw cycle C420.14270.0156
Table 3. The comparison scale in AHP.
ScaleDefinition (Compare Impact Factors a and b)
1Equal importance
3Weak importance of one over another
5Essential or strong importance
7Demonstrated importance
9Absolute importance
2,4,6,8Intermediate values between the two adjacent judgments
ReciprocalsIf activity a has one of the above nonzero numbers assigned to it when compared with activity b, then b has the reciprocal value when compared with a
Table 4. Site hazard risk assessment index system grading and scoring.
Evaluation IndexesClassification of Indexes
Level 1Level 2Level 3Level 4Level 5
Site size/m3<0.25 × 1030.25 × 103~1.5 × 1041.5 × 104~5 × 1045 × 104~20 × 104≥20 × 104
Rating124710
Top protectionConcreteCompacted claySoilNone
Rating13510
Side protectionDouble-layer composite impermeableSingle layer protectionConcreteNone
Rating13410
Bottom protectionDouble-layer composite impermeableSingle layer protectionConcreteNatural powdered clayNatural gravel
Rating134510
Table 5. Contamination stability risk assessment index system grading and scoring.
Evaluation IndexesClassification of Indexes
Level 1Level 2Level 3Level 4Level 5
Exceedance multiple of heavy metals/times<1[1, 5)[5, 10)[10, 20)≥20
Rating135710
Stabilization efficiency/%≥95[90, 95)[80, 90)[70, 80)<70
Rating124710
Toxicity leaching factor<0.1[0.1, 0.3)[0.3, 0.6)[0.6, 0.9)≥0.9
Rating124710
Organic matter and clay/%≥65[40, 65)[30, 40)[10, 30)<10
Rating135710
Soil pH (cation)≥10[7.5, 10)[6.5, 7.5)[5, 6.5)<5
Rating314710
Soil pH (anionic)≥10[7.5, 10)[6.5, 7.5)[5, 6.5)<5
Rating741310
Leachable form ratio/%<1[1, 10)[10, 30)[30, 50)≥50
Rating135710
Table 6. Aquifer vulnerability risk assessment index system grading and scoring.
Evaluation IndexesClassification of Indexes
Level 1Level 2Level 3Level 4Level 5Level 6Level 7Level 8Level 9Level 10
Depth to water table/m≥30.5[22.9, 30.5)[15.2, 22.9)[9.1, 15.2)[4.6, 9.1)[1.5, 4.6)<1.5
Rating12357910
Net recharge of aquifer/mm<51[51, 102)[102, 178)[178, 254)≥254
Rating136810
Topography/%≥18[12, 18)[6, 12)[2, 6)<2
Rating135910
Impact of vadose zoneClayLoamSandy loamSiltFine SandSandMedium sandCoarse sandSand and gravelGravel
Rating12345678910
Aquifer mediaClayLoamSandy loamSiltFine SandSandMedium sandCoarse sandSand and gravelGravel
Rating12345678910
Hydraulic conductivity (m/day)<4[4, 12)[12, 28)[28, 40)[40, 80)≥80
Rating1246810
Table 7. Grading and scoring of natural conditions risk assessment index system.
Evaluation IndexesClassification of Indexes
Level 1Level 2Level 3Level 4Level 5
Rainfall pH≥5.6[5, 5.6)[4, 5.5)<4.5
Rating15710
Freeze–thaw cycle/time<5[5, 15)[15, 30)[30, 50)≥50
Rating135710
Table 8. Contaminant stability judgment matrix.
Contaminant Stability B2Exceedance Multiple of Heavy Metals C21Stabilization Efficiency C22Toxicity Leaching Factor C23Leachable Form Ratio C24Soil pH C25Organic Matter
and Clay C26
Exceedance multiple
of heavy metals C21
1551/213
Stabilization efficiency C221/5111/71/51/2
Toxicity leaching factor C231/5111/71/51/2
Leachable form ratio C24277125
Soil pH C251551/213
Organic matter
and clay C26
1/3221/51/31
Table 9. Risk level grading.
GradingVery Low RiskLow RiskMedium RiskHigh RiskVery High Risk
Rating value (R)[0, 2)[2, 4)[4, 6)[6, 8)[8, 10]
Table 10. Groundwater risk assessment under each scenario.
Influencing FactorsEvaluation IndexesIndicator ValuesRating
Scenario 1Scenario 2Scenario 1Scenario 2
AsCdAsCdAsCdAsCd
Site HazardSite size/m3118,439118,439118,439118,4390.680.680.680.68
Top protectionNoneNoneConcreteConcrete0.280.280.030.03
Side protectionNoneNoneDouble-layer composite impermeableDouble-layer composite impermeable0.110.110.010.01
Bottom protectionNatural silty clayNatural silty clayDouble-layer composite impermeableDouble-layer composite impermeable0.270.270.050.05
Contaminant Stabilityexceedance multiple of heavy metals/times3.253.553.253.550.230.230.230.23
Stabilization efficiency/%96.5%95.1%96.5%95.1%0.020.020.020.02
Toxicity leaching factor/%0.550.020.550.020.020.020.020.02
Leachable form ratio/%3.0212.53.0212.50.400.670.400.67
Soil pH9.059.059.059.050.310.080.310.08
Organic matter and clay/%36.536.536.536.50.140.140.140.14
Aquifer VulnerabilityDepth to water table /m2.42.42.42.40.910.910.910.91
Net recharge of aquifer /mm93.0993.0993.0993.090.180.180.180.18
Topography e/%1.21.21.21.20.160.160.160.16
Impact of vadose zoneClay/GravelClay/GravelClay/GravelClay/Gravel0.410.410.410.41
Hydraulic conductivity (m/d)18.518.518.518.50.140.140.140.14
Aquifer mediaClay/GravelClay/GravelClay/GravelClay/Gravel0.140.140.140.14
Natural ConditionsRainfall pH5.65.65.65.60.090.090.090.09
Freeze–thaw cycle/times121212120.050.050.050.05
Composite Index (R)4.554.583.984.02
Disclaimer/Publisher’s Note: The statements, opinions and data contained in all publications are solely those of the individual author(s) and contributor(s) and not of MDPI and/or the editor(s). MDPI and/or the editor(s) disclaim responsibility for any injury to people or property resulting from any ideas, methods, instructions or products referred to in the content.

