

Validation of the Scale Knowledge and Perceptions about Edible Insects through Structural Equation Modelling

 ,
, 
 ,
,  ,
,  ,
,  , ,
, ,  , , , ,
  , , , ,
  , and
, and  add
Show full author list
add
Show full author list
Abstract
:1. Introduction
2. Materials and Methods
2.1. Instrument
2.2. Data Collection
2.3. Sample Characterisation
2.4. Statistical Analyses
- (a)
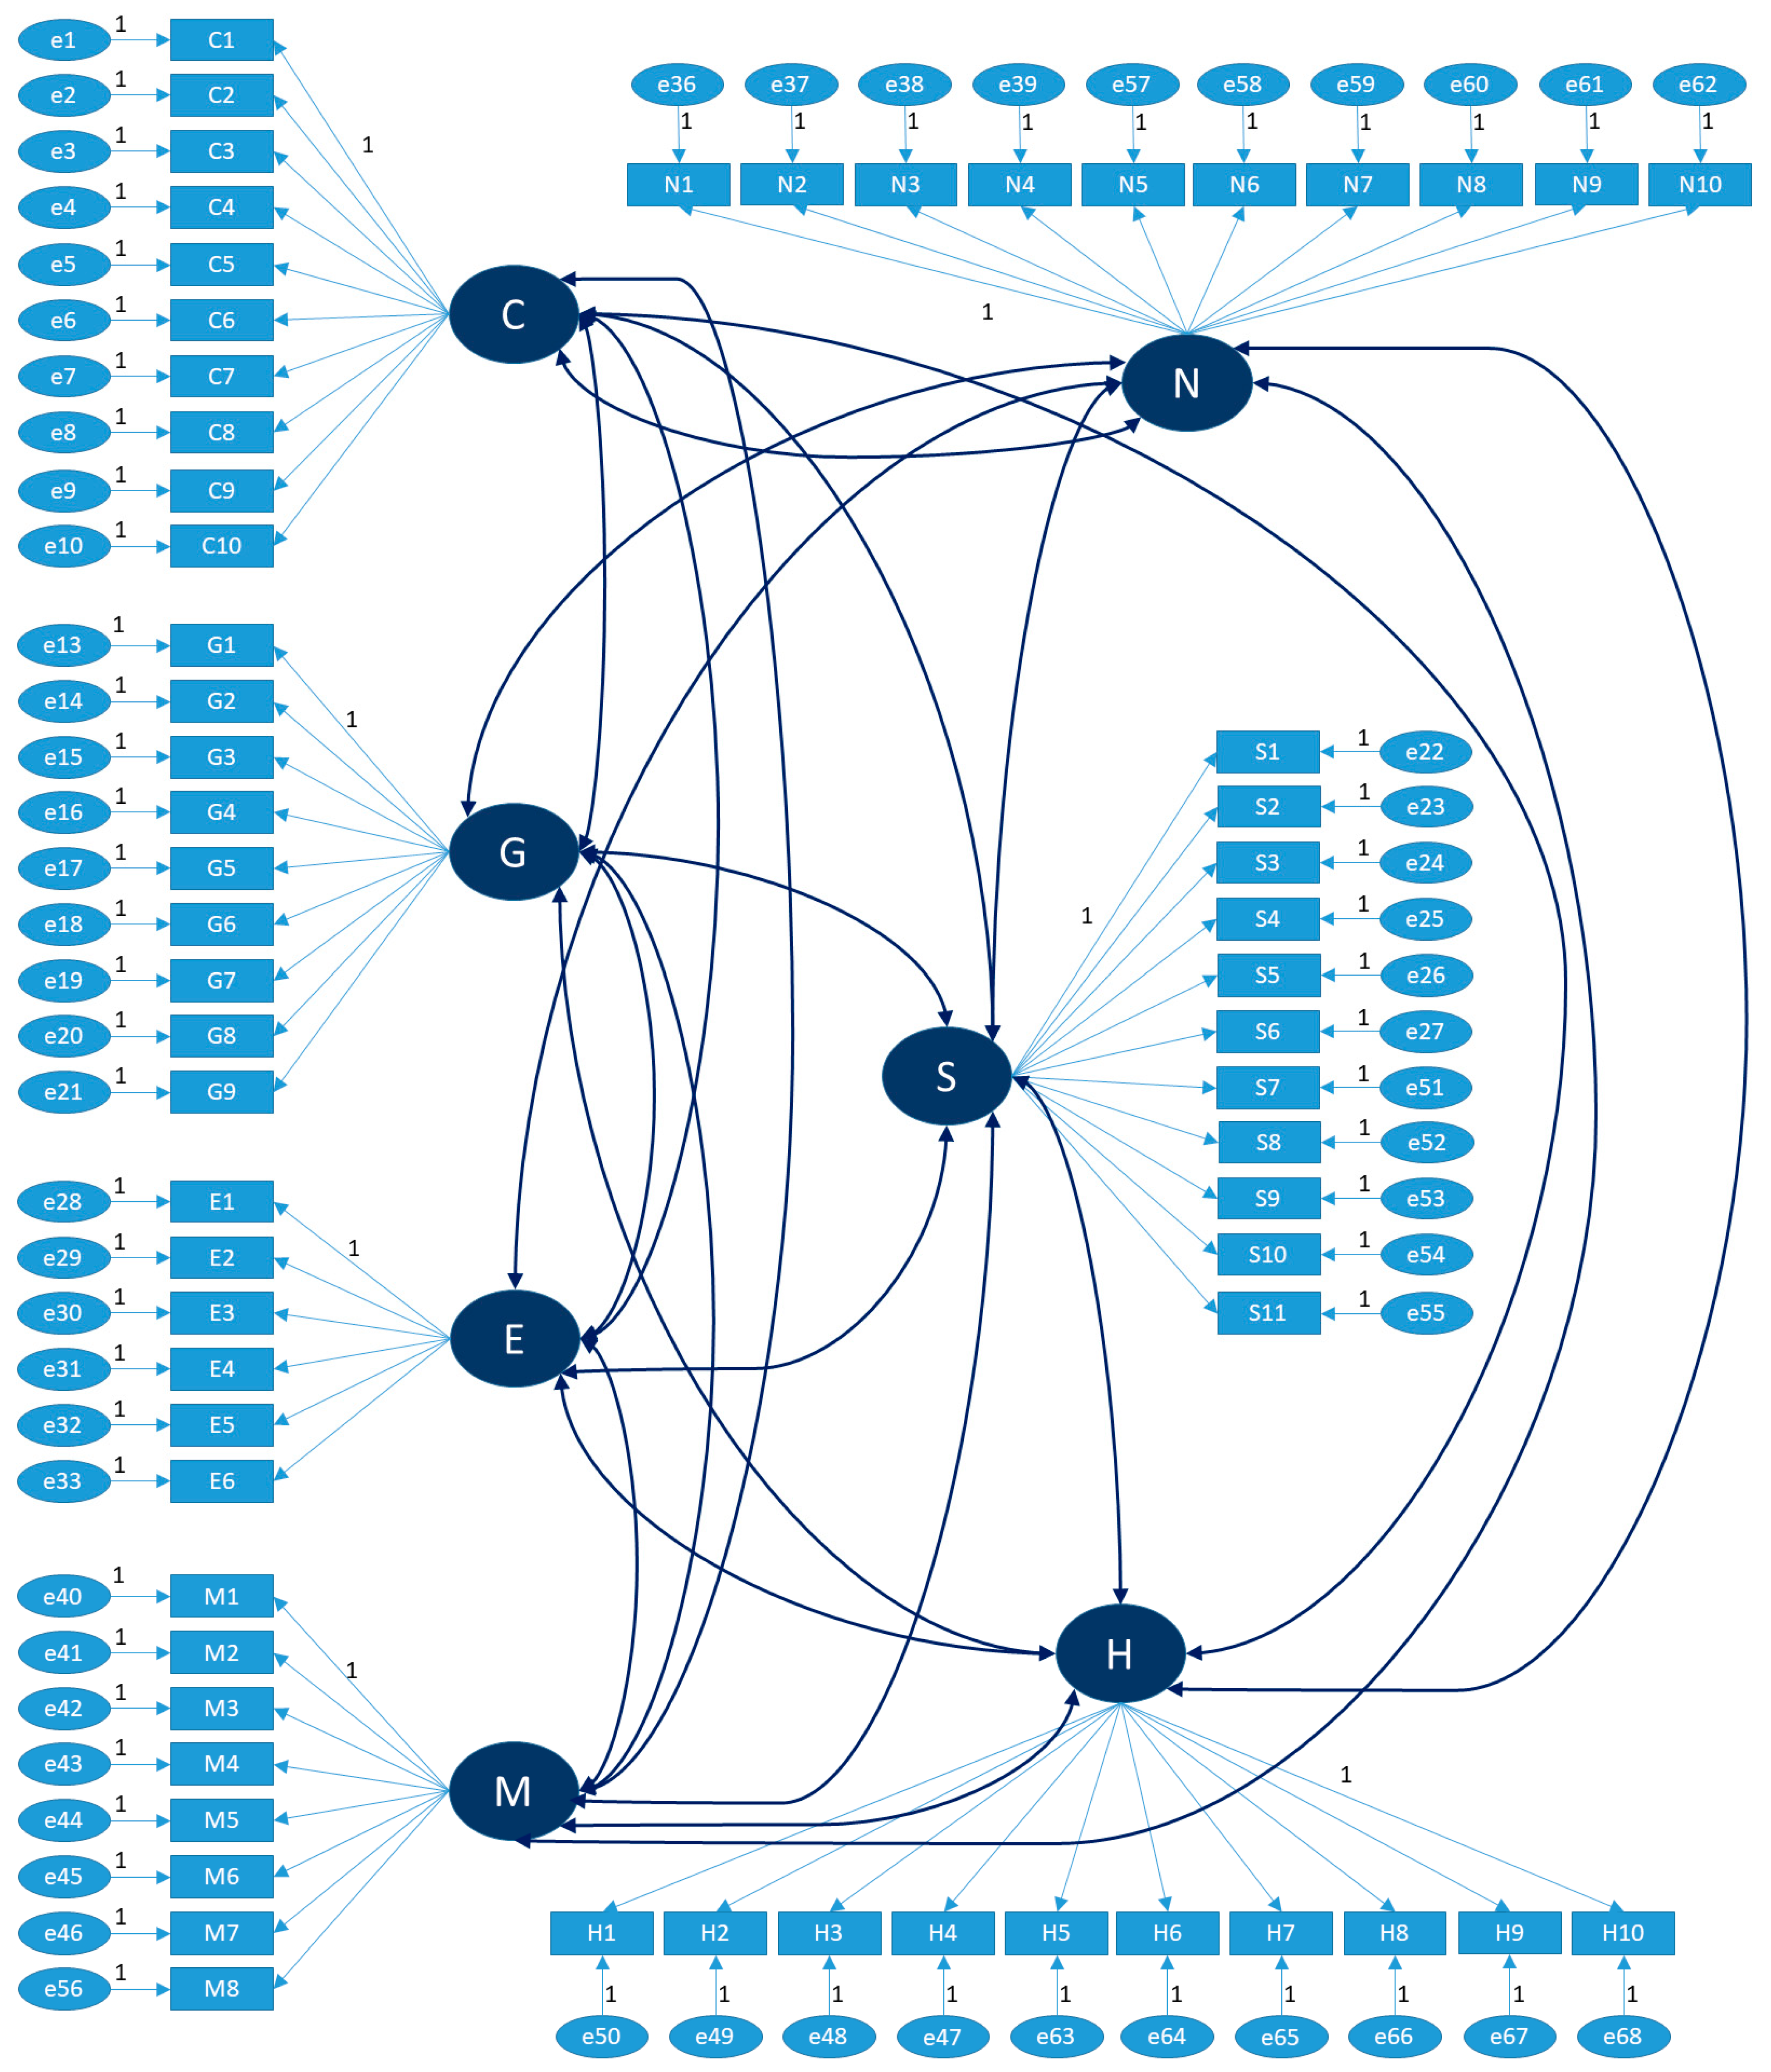
- The factorial weights are represented by the unidirectional arrows that link the factors (also called latent variables) with the indicators (or manifest variables)—the weights are also symbolised by lambda (λ).
- (b)
- The variances and covariances of the individual reliability of the indicators are represented by the unidirectional arrows linking the indicators to the errors—the variances are symbolised by delta (δ).
- (c)
- The variances and covariances of the factors, which in turn are symbolised by phi (Φ).
- (d)
- The error correlations, which are represented by delta (δ) and symbolised by bidirectional arrows, when covariance is included in the errors indicates that the covariance between the two indicators is due to reasons not explained by the factor (method effects). Bidirectional arrows are also used to symbolise covariance between factors.
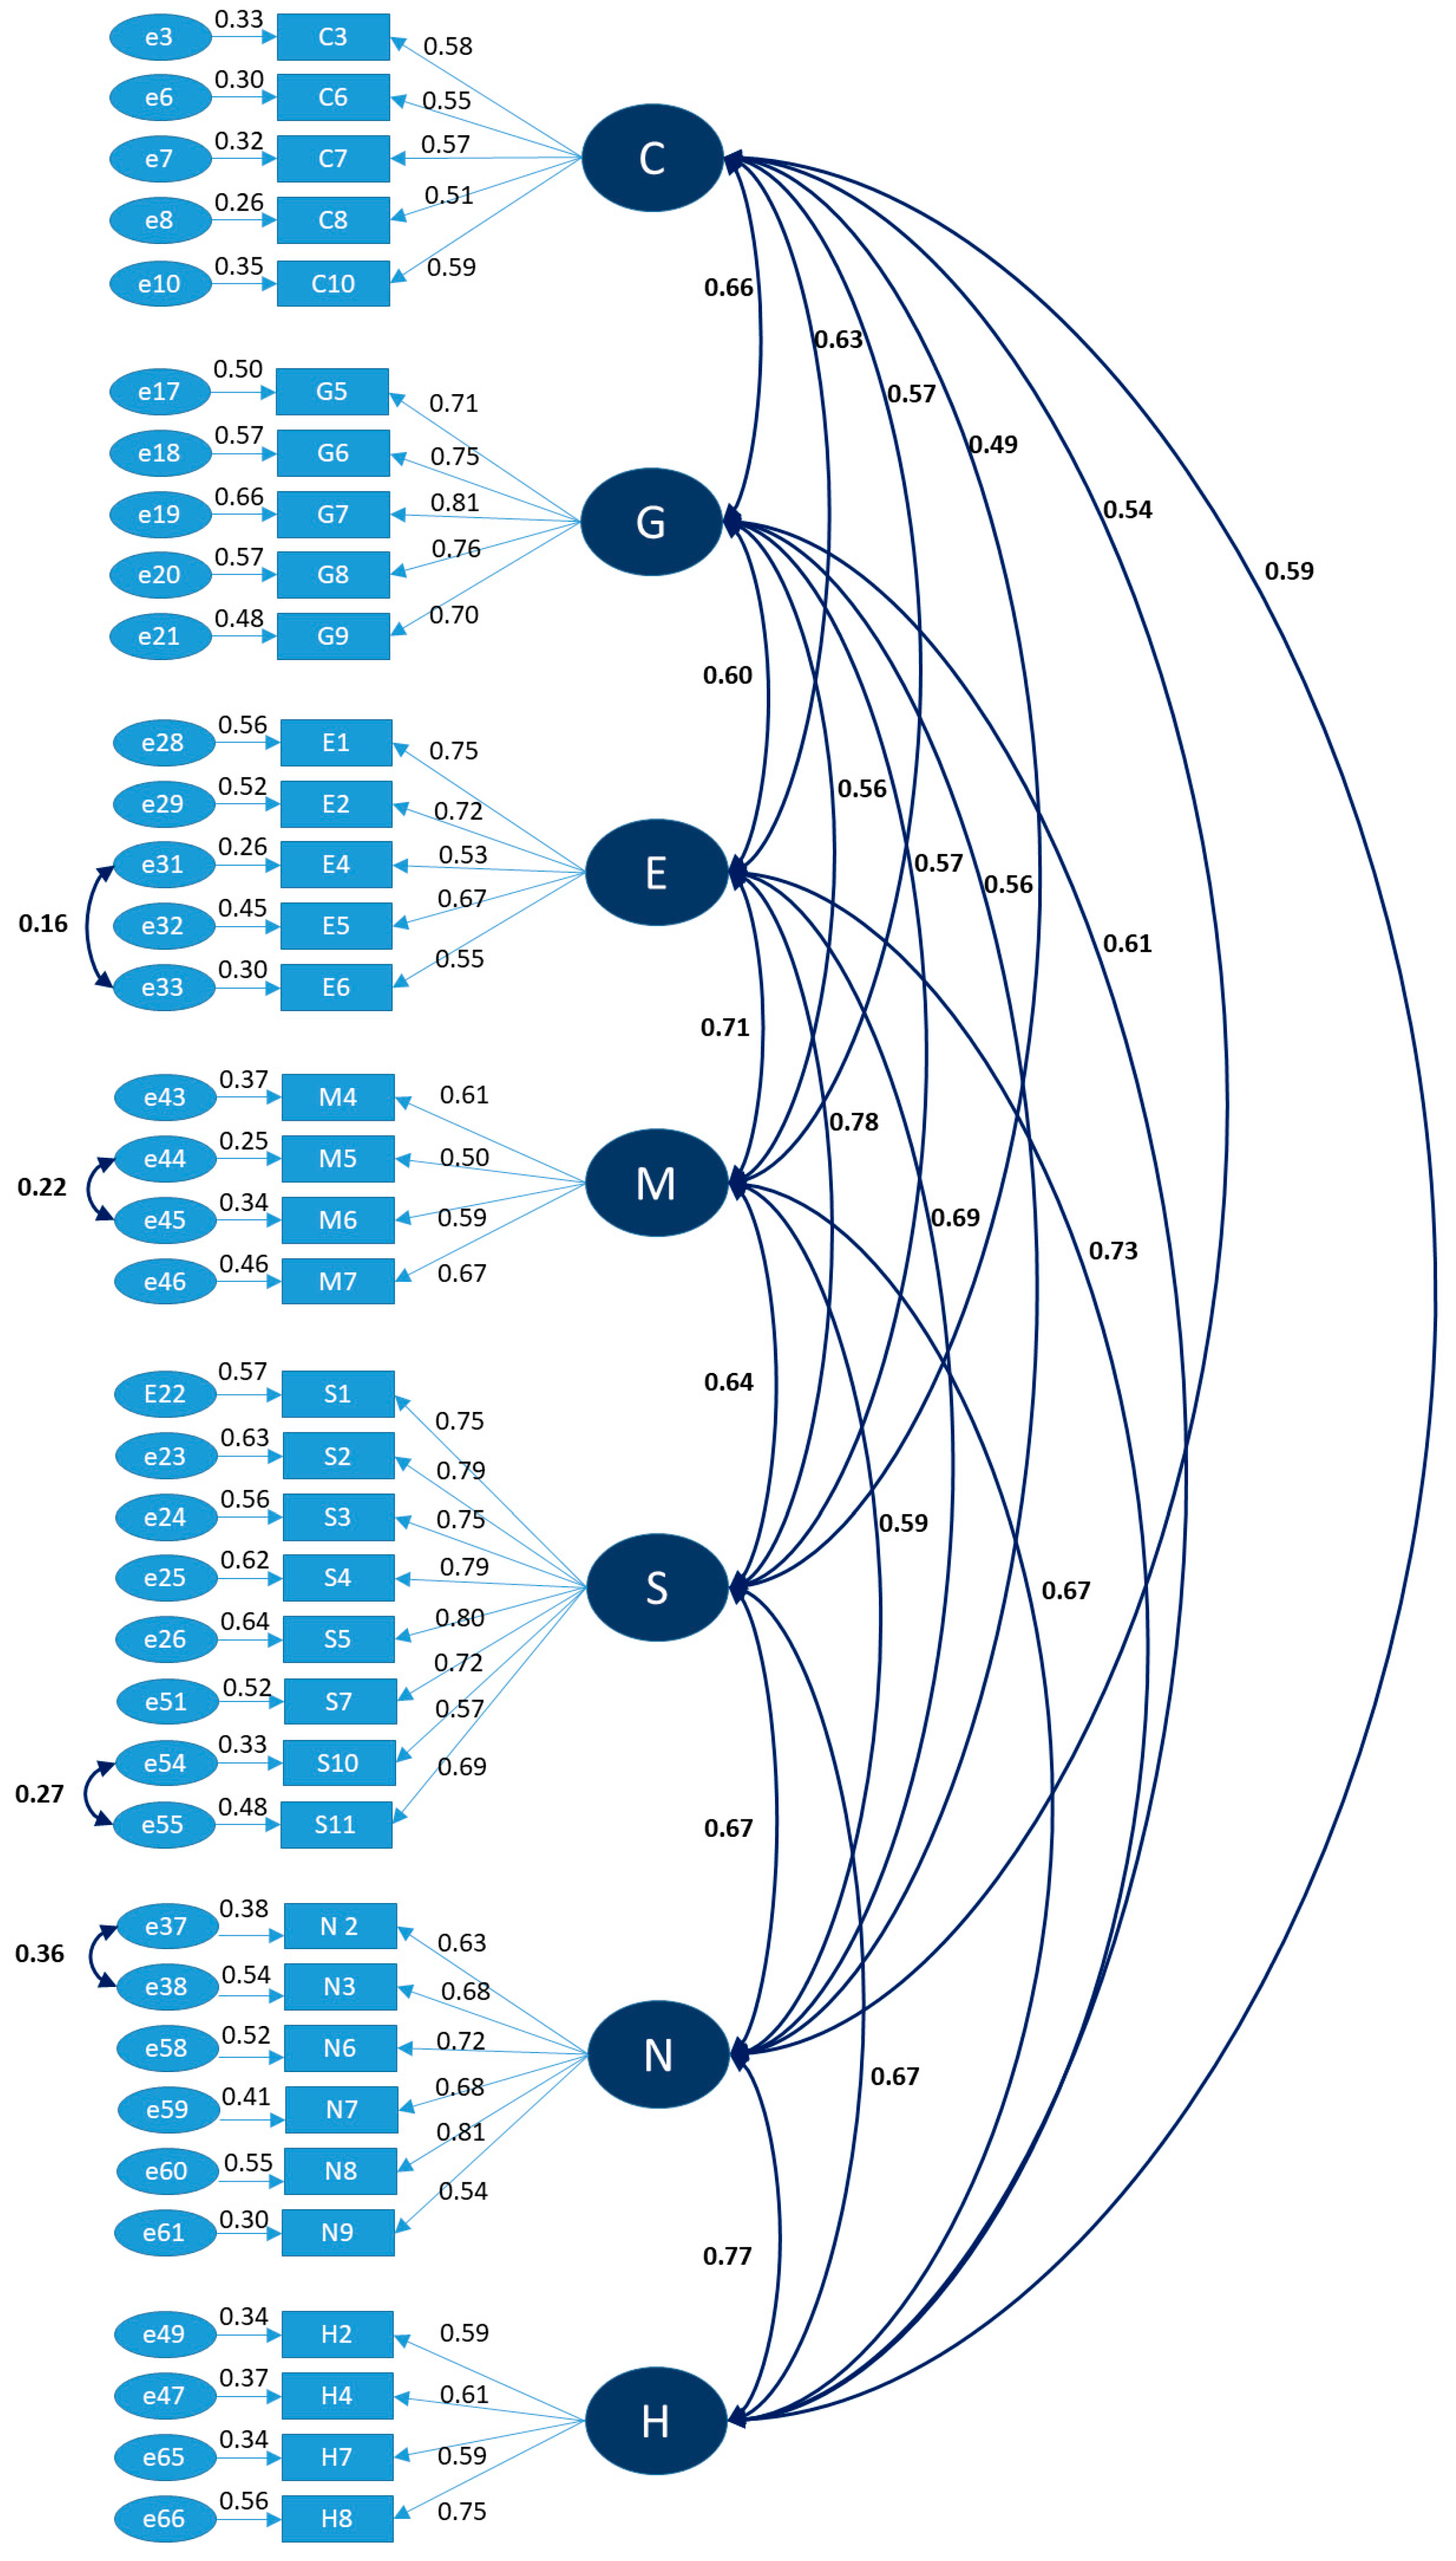
- Correlation between the factors (Φ)—higher coefficients indicate better correlations.
- Regression coefficients (λ)—values greater than 0.50 are advisable.
- Individual reliability of indicators (δ)—the coefficients should be ≥0.25.
- Statistical significance—p-value < 0.05.
- The composite reliability (CR): indicates if the items constitute manifestations of the factor. Reference values higher than 0.70 are suggested, although lower values may be acceptable for research with an exploratory nature [43].
- The mean extracted variance (MEV): it evaluates the convergent validity that occurs when the indicators, which are a reflection of a factor, saturate strongly in this factor. Values ≥ 0.50 are indicative of adequate validity, but this limit can be adjusted to 0.40 in exploratory analyses [43].
- The discriminant validity (Φ): it allows the evaluation of the discriminant validity of the factors, and their values (r2) must not be higher than the MEV of each of the factors.
3. Results
4. Discussion
5. Conclusions
Author Contributions
Funding
Institutional Review Board Statement
Informed Consent Statement
Data Availability Statement
Acknowledgments
Conflicts of Interest
References
- Guiné, R.P.F.; Florença, S.G.; Anjos, O.; Correia, P.M.R.; Ferreira, B.M.; Costa, C.A. An Insight into the Level of Information about Sustainability of Edible Insects in a Traditionally Non-Insect-Eating Country: Exploratory Study. Sustainability 2021, 13, 12014. [Google Scholar] [CrossRef]
- Runyan, C.W.; Stehm, J. Land Use Change, Deforestation and Competition for Land Due to Food Production. In Encyclopedia of Food Security and Sustainability; Ferranti, P., Berry, E.M., Anderson, J.R., Eds.; Elsevier: Oxford, UK, 2019; pp. 21–26. ISBN 978-0-12-812688-2. [Google Scholar]
- Theurl, M.C.; Lauk, C.; Kalt, G.; Mayer, A.; Kaltenegger, K.; Morais, T.G.; Teixeira, R.F.M.; Domingos, T.; Winiwarter, W.; Erb, K.-H.; et al. Food Systems in a Zero-Deforestation World: Dietary Change Is More Important than Intensification for Climate Targets in 2050. Sci. Total Environ. 2020, 735, 139353. [Google Scholar] [CrossRef]
- Haque, M.M.; Biswas, J.C. Emission Factors and Global Warming Potential as Influenced by Fertilizer Management for the Cultivation of Rice under Varied Growing Seasons. Environ. Res. 2021, 197, 111156. [Google Scholar] [CrossRef] [PubMed]
- Zhuang, M.; Shan, N.; Wang, Y.; Caro, D.; Fleming, R.M.; Wang, L. Different Characteristics of Greenhouse Gases and Ammonia Emissions from Conventional Stored Dairy Cattle and Swine Manure in China. Sci. Total Environ. 2020, 722, 137693. [Google Scholar] [CrossRef]
- McMichael, A.J.; Powles, J.W.; Butler, C.D.; Uauy, R. Food, Livestock Production, Energy, Climate Change, and Health. Lancet 2007, 370, 1253–1263. [Google Scholar] [CrossRef]
- Halloran, A.; Roos, N.; Eilenberg, J.; Cerutti, A.; Bruun, S. Life Cycle Assessment of Edible Insects for Food Protein: A Review. Agron. Sustain. Dev. 2016, 36, 57. [Google Scholar] [CrossRef]
- Huis, A. Potential of Insects as Food and Feed in Assuring Food Security. Annu. Rev. Entomol. 2013, 58, 563–583. [Google Scholar] [CrossRef]
- Huis, A.; Itterbeeck, J.V.; Klunder, H.; Mertens, E.; Halloran, A.; Muir, G.; Vantomme, P. Edible Insects: Future Prospects for Food and Feed Security; Food and Agriculture Organization of the United Nations: Rome, Italy, 2013. [Google Scholar]
- Nelson, G.C.; Rosegrant, M.W.; Koo, J.; Robertson, R.; Sulser, T.; Zhu, T.; Ringler, C.; Msangi, S.; Palazzo, A.; Batka, M.; et al. Climate Change: Impact on Agriculture and Costs of Adaptation; International Food Policy Research Institute: Washington, DC, USA, 2009. [Google Scholar]
- Ramos-Elorduy, J. Energy Supplied by Edible Insects from Mexico and Their Nutritional and Ecological Importance. Ecol. Food Nutr. 2008, 47, 280–297. [Google Scholar] [CrossRef]
- Smil, V. Eating Meat: Evolution, Patterns, and Consequences. Popul. Dev. Rev. 2002, 28, 599–639. [Google Scholar] [CrossRef]
- Gahukar, R.T. Edible Insects Collected from Forests for Family Livelihood and Wellness of Rural Communities: A Review. Glob. Food Secur. 2020, 25, 100348. [Google Scholar] [CrossRef]
- Ghosh, S.; Jung, C.; Meyer-Rochow, V.B. What Governs Selection and Acceptance of Edible Insect Species? In Edible Insects in Sustainable Food Systems; Halloran, A., Flore, R., Vantomme, P., Roos, N., Eds.; Springer International Publishing: Berlin/Heidelberg, Germany, 2018; pp. 331–351. ISBN 978-3-319-74011-9. [Google Scholar]
- Elhassan, M.; Wendin, K.; Olsson, V.; Langton, M. Quality Aspects of Insects as Food—Nutritional, Sensory, and Related Concepts. Foods 2019, 8, 95. [Google Scholar] [CrossRef]
- Imathiu, S. Benefits and Food Safety Concerns Associated with Consumption of Edible Insects. NFS J. 2020, 18, 1–11. [Google Scholar] [CrossRef]
- Lucas, A.J.S.; Menegon de Oliveira, L.; da Rocha, M.; Prentice, C. Edible Insects: An Alternative of Nutritional, Functional and Bioactive Compounds. Food Chem. 2020, 311, 126022. [Google Scholar] [CrossRef]
- Meyer-Rochow, V.B.; Chakravorty, J. Notes on Entomophagy and Entomotherapy Generally and Information on the Situation in India in Particular. Appl. Entomol. Zool. 2013, 48, 105–112. [Google Scholar] [CrossRef]
- Meyer-Rochow, V.B. Therapeutic Arthropods and Other, Largely Terrestrial, Folk-Medicinally Important Invertebrates: A Comparative Survey and Review. J. Ethnobiol. Ethnomed. 2017, 13, 9. [Google Scholar] [CrossRef]
- Mancini, S.; Moruzzo, R.; Riccioli, F.; Paci, G. European Consumers’ Readiness to Adopt Insects as Food. A Review. Food Res. Int. 2019, 122, 661–678. [Google Scholar] [CrossRef]
- Hopkins, I.; Farahnaky, A.; Gill, H.; Newman, L.P.; Danaher, J. Australians’ Experience, Barriers and Willingness towards Consuming Edible Insects as an Emerging Protein Source. Appetite 2022, 169, 105832. [Google Scholar] [CrossRef]
- Hwang, J.; Choe, J.Y. How to Enhance the Image of Edible Insect Restaurants: Focusing on Perceived Risk Theory. Int. J. Hosp. Manag. 2020, 87, 102464. [Google Scholar] [CrossRef]
- Arppe, T.; Niva, M.; Jallinoja, P. The Emergence of the Finnish Edible Insect Arena: The Dynamics of an ‘Active Obstacle’. Geoforum 2020, 108, 227–236. [Google Scholar] [CrossRef]
- Florença, S.G.; Correia, P.M.R.; Costa, C.A.; Guiné, R.P.F. Edible Insects: Preliminary Study about Perceptions, Attitudes, and Knowledge on a Sample of Portuguese Citizens. Foods 2021, 10, 709. [Google Scholar] [CrossRef] [PubMed]
- Guiné, R.P.F.; Duarte, J.; Ferrão, A.C.; Ferreira, M.; Correia, P.; Cardoso, A.P.; Bartkiene, E.; Szűcs, V.; Nemes, L.; Ljubičić, M.; et al. The Eating Motivations Scale (EATMOT): Development and Validation by Means of Confirmatory Factor Analysis (CFA) and Structural Equation Modelling (SEM). Zdr. Varst. 2021, 60, 4–9. [Google Scholar] [CrossRef]
- Müller, A. Insects as Food in Laos and Thailand: A Case of “Westernisation”? Asian J. Soc. Sci. 2019, 47, 204–223. [Google Scholar] [CrossRef]
- Aguilar-Toalá, J.E.; Cruz-Monterrosa, R.G.; Liceaga, A.M. Beyond Human Nutrition of Edible Insects: Health Benefits and Safety Aspects. Insects 2022, 13, 1007. [Google Scholar] [CrossRef] [PubMed]
- Payne, C.L.R.; Scarborough, P.; Rayner, M.; Nonaka, K. Are Edible Insects More or Less ‘Healthy’ than Commonly Consumed Meats? A Comparison Using Two Nutrient Profiling Models Developed to Combat over- and Undernutrition. Eur. J. Clin. Nutr. 2016, 70, 285–291. [Google Scholar] [CrossRef]
- Florença, S.G.; Guiné, R.P.F.; Gonçalves, F.J.A.; Barroca, M.J.; Ferreira, M.; Costa, C.A.; Correia, P.M.R.; Cardoso, A.P.; Campos, S.; Anjos, O.; et al. The Motivations for Consumption of Edible Insects: A Systematic Review. Foods 2022, 11, 3643. [Google Scholar] [CrossRef] [PubMed]
- Bednářová, M. Possibilities of Using Insects as Food in the Czech Republic. In Diploma Thesis; Mendel University: Brno, Czech Republic, 2013. [Google Scholar]
- Guiné, R.P.F.; Florença, S.G.; Anjos, O.; Boustani, N.M.; Chuck-Hernández, C.; Sarić, M.M.; Ferreira, M.; Costa, C.A.; Bartkiene, E.; Cardoso, A.P.; et al. Are Consumers Aware of Sustainability Aspects Related to Edible Insects? Results from a Study Involving 14 Countries. Sustainability 2022, 14, 14125. [Google Scholar] [CrossRef]
- Guiné, R.P.F.; Correia, P.; Coelho, C.; Costa, C.A. The Role of Edible Insects to Mitigate Challenges for Sustainability. Open Agric. 2021, 6, 24–36. [Google Scholar] [CrossRef]
- Ishara, J.; Ayagirwe, R.; Karume, K.; Mushagalusa, G.N.; Bugeme, D.; Niassy, S.; Udomkun, P.; Kinyuru, J. Inventory Reveals Wide Biodiversity of Edible Insects in the Eastern Democratic Republic of Congo. Sci. Rep. 2022, 12, 1576. [Google Scholar] [CrossRef]
- EFSA. Approval of Third Insect as a Novel Food. Available online: https://food.ec.europa.eu/safety/novel-food/authorisations/approval-insect-novel-food_en (accessed on 14 October 2022).
- EUR-Lex. Regulation (EU) 2015/2283 of the European Parliament and of the Council of 25 November 2015 on Novel Foods, Amending Regulation (EU) No 1169/2011 of the European Parliament and of the Council and Repealing Regulation (EC) No 258/97 of the European Parliament and of the Council and Commission Regulation (EC) No 1852/2001 (Text with EEA Relevance). 2015, Volume 327. Available online: https://eur-lex.europa.eu/legal-content/EN/TXT/?uri=celex%3A32015R2283 (accessed on 27 January 2023).
- Guiné, R.P.F.; Florença, S.G.; Costa, C.A.; Correia, P.M.R.; Ferreira, M.; Duarte, J.; Cardoso, A.P.; Campos, S.; Anjos, O. Development of a Questionnaire to Assess Knowledge and Perceptions about Edible Insects. Insects 2022, 13, 47. [Google Scholar] [CrossRef]
- Likert, R. A Technique for the Measurement of Attitudes. Arch. Psychol. 1932, 22, 5–55. [Google Scholar]
- Leighton, K.; Kardong-Edgren, S.; Schneidereith, T.; Foisy-Doll, C. Using Social Media and Snowball Sampling as an Alternative Recruitment Strategy for Research. Clin. Simul. Nurs. 2021, 55, 37–42. [Google Scholar] [CrossRef]
- Marôco, J. Análise Estatística Com o SPSS Statistics, 7th ed.; Report Number: Sintra, Portugal, 2018. [Google Scholar]
- Hauck-Filho, N.; Valentini, F. Coeficientes de fidedignidade e violações dos pressupostos essencialmente tau-equivalentes. Avaliação Psicológica 2020, 19, 2175–3431. [Google Scholar] [CrossRef]
- Brown, T.A. Confirmatory Factor Analysis for Applied Research, 2nd ed.; Guilford Press: New York, NY, USA, 2015. [Google Scholar]
- Hair, J.F.; Black, W.C.; Babin, B.J.; Anderson, R.E. Multivariate Data Analysis, 7th ed.; Prentice Hall: Upper Saddle River, NJ, USA, 2009; ISBN 978-0-13-813263-7. [Google Scholar]
- Marôco, J. Análise de Equações Estruturais. Fundamentos Teóricos, Software e Aplicações; ReportNumber: Lisboa, Portugal, 2014. [Google Scholar]
- Maroco, J.; Garcia-Marques, T. Qual a Fiabilidade Do Alfa de Cronbach? Questões Antigas e Soluções Modernas? Laboratório Psicol. 2006, 4, 65–90. [Google Scholar] [CrossRef]
- Tan, H.S.G.; Fischer, A.R.H.; Tinchan, P.; Stieger, M.; Steenbekkers, L.P.A.; van Trijp, H.C.M. Insects as Food: Exploring Cultural Exposure and Individual Experience as Determinants of Acceptance. Food Qual. Prefer. 2015, 42, 78–89. [Google Scholar] [CrossRef]
- Toti, E.; Massaro, L.; Kais, A.; Aiello, P.; Palmery, M.; Peluso, I. Entomophagy: A Narrative Review on Nutritional Value, Safety, Cultural Acceptance and A Focus on the Role of Food Neophobia in Italy. Eur. J. Investig. Health Psychol. Educ. 2020, 10, 628–643. [Google Scholar] [CrossRef]
- Cunha, L.M.; Ribeiro, J.C. Sensory and Consumer Perspectives on Edible Insects. In Edible Insects in the Food Sector: Methods, Current Applications and Perspectives; Sogari, G., Mora, C., Menozzi, D., Eds.; Springer International Publishing: Berlin/Heidelberg, Germany, 2019; pp. 57–71. ISBN 978-3-030-22522-3. [Google Scholar]
- Hamerman, E.J. Cooking and Disgust Sensitivity Influence Preference for Attending Insect-Based Food Events. Appetite 2016, 96, 319–326. [Google Scholar] [CrossRef]
- Nonaka, K. Feasting on Insects. Entomol. Res. 2009, 39, 304–312. [Google Scholar] [CrossRef]
- Loo, S.; Sellbach, U. Eating (with) Insects: Insect Gastronomies and Upside-Down Ethics. Parallax 2013, 19, 12–28. [Google Scholar] [CrossRef]
- Hurd, K.J.; Shertukde, S.; Toia, T.; Trujillo, A.; Pérez, R.L.; Larom, D.L.; Love, J.J.; Liu, C. The Cultural Importance of Edible Insects in Oaxaca, Mexico. Ann. Entomol. Soc. Am. 2019, 112, 552–559. [Google Scholar] [CrossRef]
- Tan, H.S.G.; House, J. Consumer Acceptance of Insects as Food: Integrating Psychological and Socio-Cultural Perspectives. In Edible Insects in Sustainable Food Systems; Halloran, A., Flore, R., Vantomme, P., Roos, N., Eds.; Springer International Publishing: Berlin/Heidelberg, Germany, 2018; pp. 375–386. ISBN 978-3-319-74011-9. [Google Scholar]
- Guiné, R.P.F.; Florença, S.G.; Correia, P.M.R.; Anjos, O.; Coelho, C.; Costa, C.A. Honey Bee (Apis mellifera L.) Broods: Composition, Technology and Gastronomic Applicability. Foods 2022, 11, 2750. [Google Scholar] [CrossRef]
- Cheung, T.L.; Moraes, M. Inovação no setor de alimentos: Insetos para consumo humano. Interações 2016, 17, 503–515. [Google Scholar] [CrossRef]
- Mishyna, M.; Chen, J.; Benjamin, O. Sensory Attributes of Edible Insects and Insect-Based Foods—Future Outlooks for Enhancing Consumer Appeal. Trends Food Sci. Technol. 2020, 95, 141–148. [Google Scholar] [CrossRef]
- Dion-Poulin, A.; Turcotte, M.; Lee-Blouin, S.; Perreault, V.; Provencher, V.; Doyen, A.; Turgeon, S.L. Acceptability of Insect Ingredients by Innovative Student Chefs: An Exploratory Study. Int. J. Gastron. Food Sci. 2021, 24, 100362. [Google Scholar] [CrossRef]
- Youssef, J.; Spence, C. Introducing Diners to the Range of Experiences in Creative Mexican Cuisine, Including the Consumption of Insects. Int. J. Gastron. Food Sci. 2021, 25, 100371. [Google Scholar] [CrossRef]
- Traynor, M.; Moreo, A.; Cain, L.; Burke, R.; Barry-Ryan, C. Exploring Attitudes and Reactions to Unfamiliar Food Pairings: An Examination of the Underlying Motivations and the Impact of Culinary Education. J. Culin. Sci. Technol. 2021, 19, 115–137. [Google Scholar] [CrossRef]
- Ordoñez-Araque, R.; Egas-Montenegro, E. Edible Insects: A Food Alternative for the Sustainable Development of the Planet. Int. J. Gastron. Food Sci. 2021, 23, 100304. [Google Scholar] [CrossRef]
- Borges, M.M.; da Costa, D.V.; Trombete, F.M.; Câmara, A.K.F.I. Edible Insects as a Sustainable Alternative to Food Products: An Insight into Quality Aspects of Reformulated Bakery and Meat Products. Curr. Opin. Food Sci. 2022, 46, 100864. [Google Scholar] [CrossRef]
- Nischalke, S.; Wagler, I.; Tanga, C.; Allan, D.; Phankaew, C.; Ratompoarison, C.; Razafindrakotomamonjy, A.; Kusia, E. How to Turn Collectors of Edible Insects into Mini-Livestock Farmers: Multidimensional Sustainability Challenges to a Thriving Industry. Glob. Food Secur. 2020, 26, 100376. [Google Scholar] [CrossRef]
- Lange, K.W.; Nakamura, Y. Edible Insects as Future Food: Chances and Challenges. J. Future Foods 2021, 1, 38–46. [Google Scholar] [CrossRef]
- Deroy, O.; Reade, B.; Spence, C. The Insectivore’s Dilemma, and How to Take the West out of It. Food Qual. Prefer. 2015, 44, 44–55. [Google Scholar] [CrossRef]
- Smil, V. Worldwide Transformation of Diets, Burdens of Meat Production and Opportunities for Novel Food Proteins. Enzym. Microb. Technol. 2002, 30, 305–311. [Google Scholar] [CrossRef]
- Offenberg, J. Oecophylla Smaragdina Food Conversion Efficiency: Prospects for Ant Farming. J. Appl. Entomol. 2011, 135, 575–581. [Google Scholar] [CrossRef]
- Oonincx, D.G.A.B.; van Itterbeeck, J.; Heetkamp, M.J.W.; van den Brand, H.; van Loon, J.J.A.; van Huis, A. An Exploration on Greenhouse Gas and Ammonia Production by Insect Species Suitable for Animal or Human Consumption. PLoS ONE 2010, 5, e14445. [Google Scholar] [CrossRef]
- Aarnink, A.J.A.; Keen, A.; Metz, J.H.M.; Speelman, L.; Verstegen, M.W.A. Ammonia Emission Patterns during the Growing Periods of Pigs Housed on Partially Slatted Floors. J. Agric. Eng. Res. 1995, 62, 105–116. [Google Scholar] [CrossRef]
- Pimentel, D.; Berger, B.; Filiberto, D.; Newton, M.; Wolfe, B.; Karabinakis, E.; Clark, S.; Poon, E.; Abbett, E.; Nandagopal, S. Water Resources: Agricultural and Environmental Issues. BioScience 2004, 54, 909–918. [Google Scholar] [CrossRef]
- Stull, V.J. Impacts of Insect Consumption on Human Health. J. Insects Food Feed. 2021, 7, 695–713. [Google Scholar] [CrossRef]
- EFSA. Scientific Committee Risk Profile Related to Production and Consumption of Insects as Food and Feed. EFSA J. 2015, 13, 4257. [Google Scholar] [CrossRef]
- Tanga, C.M.; Egonyu, J.P.; Beesigamukama, D.; Niassy, S.; Emily, K.; Magara, H.J.; Omuse, E.R.; Subramanian, S.; Ekesi, S. Edible Insect Farming as an Emerging and Profitable Enterprise in East Africa. Curr. Opin. Insect Sci. 2021, 48, 64–71. [Google Scholar] [CrossRef]
- Diener, S.; Studt Solano, N.M.; Roa Gutiérrez, F.; Zurbrügg, C.; Tockner, K. Biological Treatment of Municipal Organic Waste Using Black Soldier Fly Larvae. Waste Biomass. Valor. 2011, 2, 357–363. [Google Scholar] [CrossRef]
- Chia, S.Y.; Macharia, J.; Diiro, G.M.; Kassie, M.; Ekesi, S.; van Loon, J.J.A.; Dicke, M.; Tanga, C.M. Smallholder Farmers’ Knowledge and Willingness to Pay for Insect-Based Feeds in Kenya. PLoS ONE 2020, 15, e0230552. [Google Scholar] [CrossRef]
- Abro, Z.; Kassie, M.; Tanga, C.; Beesigamukama, D.; Diiro, G. Socio-Economic and Environmental Implications of Replacing Conventional Poultry Feed with Insect-Based Feed in Kenya. J. Clean. Prod. 2020, 265, 121871. [Google Scholar] [CrossRef]
- Govorushko, S. Global Status of Insects as Food and Feed Source: A Review. Trends Food Sci. Technol. 2019, 91, 436–445. [Google Scholar] [CrossRef]
- Derrien, C.; Boccuni, A. Current Status of the Insect Producing Industry in Europe. In Edible Insects in Sustainable Food Systems; Halloran, A., Flore, R., Vantomme, P., Roos, N., Eds.; Springer International Publishing: Berlin/Heidelberg, Germany, 2018; pp. 471–479. ISBN 978-3-319-74011-9. [Google Scholar]
- Anaduaka, E.G.; Uchendu, N.O.; Osuji, D.O.; Ene, L.N.; Amoke, O.P. Nutritional Compositions of Two Edible Insects: Oryctes Rhinoceros Larva and Zonocerus Variegatus. Heliyon 2021, 7, e06531. [Google Scholar] [CrossRef]
- Kouřimská, L.; Adámková, A. Nutritional and Sensory Quality of Edible Insects. NFS J. 2016, 4, 22–26. [Google Scholar] [CrossRef]
- Pemberton, R.W. Insects and Other Arthropods Used as Drugs in Korean Traditional Medicine. J. Ethnopharmacol. 1999, 65, 207–216. [Google Scholar] [CrossRef]
- Costa-Neto, E.M. Entomotherapy, or the Medicinal Use of Insects. etbi 2005, 25, 93–114. [Google Scholar] [CrossRef]
- Hall, F.; Reddivari, L.; Liceaga, A.M. Identification and Characterization of Edible Cricket Peptides on Hypertensive and Glycemic In Vitro Inhibition and Their Anti-Inflammatory Activity on RAW 264.7 Macrophage Cells. Nutrients 2020, 12, 3588. [Google Scholar] [CrossRef]
- Zielińska, E.; Baraniak, B.; Karaś, M. Identification of Antioxidant and Anti-Inflammatory Peptides Obtained by Simulated Gastrointestinal Digestion of Three Edible Insects Species (Gryllodes Sigillatus, Tenebrio Molitor, Schistocerca Gragaria). Int. J. Food Sci. Technol. 2018, 53, 2542–2551. [Google Scholar] [CrossRef]
- Malm, M.; Liceaga, A.M. Physicochemical Properties of Chitosan from Two Commonly Reared Edible Cricket Species, and Its Application as a Hypolipidemic and Antimicrobial Agent. Polysaccharides 2021, 2, 339–353. [Google Scholar] [CrossRef]
- Mohan, K.; Ganesan, A.R.; Muralisankar, T.; Jayakumar, R.; Sathishkumar, P.; Uthayakumar, V.; Chandirasekar, R.; Revathi, N. Recent Insights into the Extraction, Characterization, and Bioactivities of Chitin and Chitosan from Insects. Trends Food Sci. Technol. 2020, 105, 17–42. [Google Scholar] [CrossRef] [PubMed]
- Nino, M.C.; Reddivari, L.; Osorio, C.; Kaplan, I.; Liceaga, A.M. Insects as a Source of Phenolic Compounds and Potential Health Benefits. J. Insects Food Feed. 2021, 7, 1077–1087. [Google Scholar] [CrossRef]
- Baigts-Allende, D.; Doost, A.S.; Ramírez-Rodrigues, M.; Dewettinck, K.; Van der Meeren, P.; de Meulenaer, B.; Tzompa-Sosa, D. Insect Protein Concentrates from Mexican Edible Insects: Structural and Functional Characterization. LWT 2021, 152, 112267. [Google Scholar] [CrossRef]


| Variable | Group | N | % |
|---|---|---|---|
| Sex | Female | 4347 | 63.0 |
| Male | 2506 | 36.3 | |
| No answer | 47 | 0.7 | |
| Age | 18–30 years | 3321 | 48.2 |
| 31–50 years | 2489 | 36.1 | |
| 51 or more years | 1080 | 27.7 | |
| Education | Postgraduate | 2135 | 31.0 |
| University degree | 2234 | 32.4 | |
| Under-university | 2519 | 36.6 | |
| Living environment | Rural | 1067 | 15.5 |
| Urban | 4726 | 68.5 | |
| Suburban | 1107 | 16.0 |
| Evaluations | Indicators | Reference Values |
|---|---|---|
| Absolute fit | Ratio of chi-square and degrees of freedom (χ²/df) | If (χ²/df) is equal to 1 the fit is perfect. If (χ²/df) is >1 and ≤2 the fit is good. If (χ²/df) is >2 and ≤5 the fit is acceptable. If (χ²/df) is >5 the fit is unacceptable. |
| Root mean square residual (RMR) | The lower the value of RMR the better is the fit. RMR = 0 indicates a perfect fit. | |
| Standardised root mean square residual (SRMR) | Values lower than 0.08 are generally considered a good fit. SRMR = 0 indicates a perfect fit. | |
| Goodness of fit index (GFI) | Values ≥ 0.95 are recommended. Values > 0.90 are considered a good fit. GFI = 1 is a perfect fit. | |
| Relative fit | Comparative fit index (CFI) 1 | Values < 0.90 indicate a poor fit. Values ≥ 0.90 and ≤0.95 indicate a good adjustment. Values > 0.95 indicate a very good adjustment. CFI = 1 corresponds to a perfect fit. |
| Population discrepancy index | Root mean square error of approximation (RMSEA) | Values for RMSEA 2 between 0.05 and 0.08 mean the adjustment is good. Values of RMSEA < 0.05 are considered very good. |
| Variables | Statistics 1 | ||||
|---|---|---|---|---|---|
| M | SD | r | r2 | α | |
| Dimension One—Culture and Tradition (C) | |||||
| C1 | 3.56 | 1.10 | 0.447 | 0.240 | 0.932 |
| C2 | 1.74 | 1.22 | 0.258 | 0.344 | 0.933 |
| C3 | 3.63 | 1.04 | 0.481 | 0.291 | 0.932 |
| C4 | 2.75 | 1.11 | 0.306 | 0.196 | 0.933 |
| C5 | 2.79 | 1.04 | 0.282 | 0.275 | 0.933 |
| C6 | 2.93 | 1.17 | 0.352 | 0.307 | 0.933 |
| C7 | 3.30 | 1.03 | 0.432 | 0.317 | 0.932 |
| C8 | 3.02 | 1.01 | 0.329 | 0.273 | 0.933 |
| C9 | 3.60 | 1.13 | 0.380 | 0.264 | 0.932 |
| C10 | 3.04 | 1.11 | 0.409 | 0.347 | 0.932 |
| Dimension Two—Gastronomic Innovation and Gourmet Kitchen (G) | |||||
| G1 | 3.81 | 1.13 | 0.468 | 0.332 | 0.932 |
| G2 | 3.33 | 1.10 | 0.412 | 0.293 | 0.932 |
| G3 | 3.60 | 1.25 | 0.323 | 0.318 | 0.933 |
| G4 | 3.78 | 1.10 | 0.317 | 0.218 | 0.933 |
| G5 | 3.63 | 0.98 | 0.562 | 0.495 | 0.931 |
| G6 | 3.44 | 1.04 | 0.540 | 0.534 | 0.931 |
| G7 | 3.32 | 0.98 | 0.566 | 0.585 | 0.931 |
| G8 | 3.36 | 1.01 | 0.543 | 0.534 | 0.931 |
| G9 | 3.40 | 1.08 | 0.601 | 0.489 | 0.931 |
| Dimension Three—Environment and Sustainability (S) | |||||
| S1 | 3.44 | 1.16 | 0.660 | 0.568 | 0.930 |
| S2 | 3.65 | 1.06 | 0.643 | 0.595 | 0.931 |
| S3 | 3.54 | 0.97 | 0.644 | 0.555 | 0.931 |
| S4 | 3.67 | 1.02 | 0.629 | 0.600 | 0.931 |
| S5 | 3.62 | 1.08 | 0.685 | 0.621 | 0.930 |
| S6 | 3.22 | 0.99 | -0.030 | 0.268 | 0.935 |
| S7 | 3.53 | 1.03 | 0.595 | 0.507 | 0.931 |
| S8 | 3.35 | 1.06 | 0.021 | 0.289 | 0.935 |
| S9 | 3.45 | 0.99 | 0.390 | 0.279 | 0.932 |
| S10 | 3.36 | 0.96 | 0.512 | 0.407 | 0.932 |
| S11 | 3.55 | 0.99 | 0.594 | 0.523 | 0.931 |
| Dimension Four—Economic and Social Aspects (E) | |||||
| E1 | 3.45 | 1.04 | 0.631 | 0.499 | 0.931 |
| E2 | 3.43 | 1.05 | 0.603 | 0.486 | 0.931 |
| E3 | 3.53 | 0.98 | 0.190 | 0.248 | 0.933 |
| E4 | 3.54 | 0.90 | 0.478 | 0.343 | 0.932 |
| E5 | 3.39 | 0.89 | 0.547 | 0.438 | 0.931 |
| E6 | 3.38 | 0.90 | 0.488 | 0.345 | 0.932 |
| Dimension Five—Commercialisation and Marketing (M) | |||||
| M1 | 3.65 | 1.16 | 0.157 | 0.286 | 0.934 |
| M2 | 2.16 | 1.11 | -0.002 | 0.154 | 0.935 |
| M3 | 3.57 | 1.03 | 0.262 | 0.262 | 0.933 |
| M4 | 3.73 | 1.07 | 0.482 | 0.339 | 0.932 |
| M5 | 3.10 | 1.13 | 0.364 | 0.309 | 0.932 |
| M6 | 3.38 | 1.08 | 0.447 | 0.351 | 0.932 |
| M7 | 3.72 | 1.10 | 0.525 | 0.360 | 0.931 |
| M8 | 2.59 | 1.15 | 0.001 | 0.137 | 0.935 |
| Dimension Six—Nutritional Aspects (N) | |||||
| N1 | 3.73 | 1.04 | 0.342 | 0.368 | 0.933 |
| N2 | 3.54 | 1.04 | 0.593 | 0.504 | 0.931 |
| N3 | 3.87 | 0.97 | 0.685 | 0.602 | 0.931 |
| N4 | 3.41 | 1.02 | 0.267 | 0.375 | 0.933 |
| N5 | 3.38 | 0.91 | 0.635 | 0.551 | 0.931 |
| N6 | 3.22 | 0.81 | 0.539 | 0.513 | 0.932 |
| N7 | 3.28 | 0.95 | 0.494 | 0.416 | 0.932 |
| N8 | 3.39 | 0.88 | 0.613 | 0.581 | 0.931 |
| N9 | 3.11 | 0.90 | 0.380 | 0.362 | 0.932 |
| N10 | 3.00 | 0.82 | 0.205 | 0.256 | 0.933 |
| Dimension Seven—Health Effects (H) | |||||
| H1 | 3.15 | 1.03 | 0.283 | 0.232 | 0.933 |
| H2 | 3.67 | 0.93 | 0.506 | 0.359 | 0.932 |
| H3 | 3.40 | 1.05 | 0.269 | 0.418 | 0.933 |
| H4 | 3.41 | 0.98 | 0.554 | 0.385 | 0.931 |
| H5 | 3.20 | 0.99 | 0.124 | 0.416 | 0.934 |
| H6 | 3.58 | 0.95 | 0.280 | 0.266 | 0.933 |
| H7 | 3.36 | 0.83 | 0.439 | 0.373 | 0.932 |
| H8 | 3.36 | 0.86 | 0.603 | 0.474 | 0.931 |
| H9 | 3.20 | 0.90 | 0.145 | 0.309 | 0.934 |
| H10 | 2.99 | 0.83 | 0.002 | 0.275 | 0.934 |
| Trajectories | Statistics 1 | |||||
|---|---|---|---|---|---|---|
| E | SE | CR | p | |||
| C1 | ← | CC1 | 1.000 | |||
| C2 | ← | CC1 | 0.953 | 0.041 | 23.511 | *** |
| C5 | ← | CC1 | 1.008 | 0.038 | 26.807 | *** |
| C6 | ← | CC1 | 1.273 | 0.044 | 28.635 | *** |
| C7 | ← | CC1 | 1.233 | 0.041 | 30.013 | *** |
| C8 | ← | CC1 | 1.059 | 0.038 | 28.121 | *** |
| C9 | ← | CC1 | 1.027 | 0.040 | 25.833 | *** |
| C10 | ← | CC1 | 1.389 | 0.045 | 30.623 | *** |
| G1 | ← | GG2 | 1.000 | |||
| G2 | ← | GG2 | 1.001 | 0.034 | 29.292 | *** |
| G3 | ← | GG2 | 0.685 | 0.034 | 20.285 | *** |
| G4 | ← | GG2 | 0.612 | 0.030 | 20.431 | *** |
| G5 | ← | GG2 | 1.350 | 0.037 | 36.244 | *** |
| G6 | ← | GG2 | 1.481 | 0.040 | 36.774 | *** |
| G7 | ← | GG2 | 1.464 | 0.039 | 37.444 | *** |
| G8 | ← | GG2 | 1.427 | 0.039 | 36.605 | *** |
| G9 | ← | GG2 | 1.453 | 0.040 | 35.912 | *** |
| S1 | ← | SS3 | 1.000 | |||
| S2 | ← | SS3 | 0.960 | 0.014 | 66.515 | *** |
| S3 | ← | SS3 | 0.842 | 0.013 | 62.955 | *** |
| S4 | ← | SS3 | 0.926 | 0.014 | 66.424 | *** |
| S5 | ← | SS3 | 0.990 | 0.015 | 67.304 | *** |
| S6 | ← | SS3 | 0.016 | 0.014 | 1.091 | 0.275 |
| E1 | ← | EE4 | 1.000 | |||
| E2 | ← | EE4 | 0.978 | 0.018 | 55.788 | *** |
| E3 | ← | EE4 | 0.205 | 0.017 | 12.411 | *** |
| E4 | ← | EE4 | 0.644 | 0.015 | 42.906 | *** |
| E5 | ← | EE4 | 0.777 | 0.015 | 52.504 | *** |
| E6 | ← | EE4 | 0.657 | 0.015 | 44.022 | *** |
| N1 | ← | NN6 | 1.000 | |||
| N2 | ← | NN6 | 1.779 | 0.059 | 30.002 | *** |
| N3 | ← | NN6 | 1.797 | 0.059 | 30.677 | *** |
| N4 | ← | NN6 | 0.711 | 0.038 | 18.781 | *** |
| M1 | ← | MM5 | 1.000 | |||
| M2 | ← | MM5 | −0.006 | 0.048 | −0.130 | 0.896 |
| M3 | ← | MM5 | 1.249 | 0.073 | 17.143 | *** |
| M4 | ← | MM5 | 2.140 | 0.109 | 19.562 | *** |
| M5 | ← | MM5 | 1.870 | 0.099 | 18.808 | *** |
| M6 | ← | MM5 | 2.094 | 0.108 | 19.446 | *** |
| M7 | ← | MM5 | 2.272 | 0.116 | 19.664 | *** |
| H4 | ← | HH7 | 1.000 | |||
| H3 | ← | HH7 | 0.368 | 0.023 | 16.233 | *** |
| H2 | ← | HH7 | 0.907 | 0.022 | 40.643 | *** |
| H1 | ← | HH7 | 0.657 | 0.023 | 28.469 | *** |
| S7 | ← | SS3 | 0.859 | 0.014 | 60.642 | *** |
| S8 | ← | SS3 | 0.087 | 0.015 | 5.675 | *** |
| S9 | ← | SS3 | 0.501 | 0.014 | 35.458 | *** |
| S10 | ← | SS3 | 0.664 | 0.013 | 49.289 | *** |
| S11 | ← | SS3 | 0.808 | 0.014 | 59.414 | *** |
| M8 | ← | MM5 | 0.089 | 0.049 | 1.798 | 0.072 |
| N5 | ← | NN6 | 1.747 | 0.056 | 30.988 | *** |
| N6 | ← | NN6 | 1.419 | 0.047 | 30.171 | *** |
| N7 | ← | NN6 | 1.480 | 0.051 | 29.063 | *** |
| N8 | ← | NN6 | 1.690 | 0.055 | 30.995 | *** |
| N9 | ← | NN6 | 1.158 | 0.043 | 26.911 | *** |
| N10 | ← | NN6 | 0.589 | 0.031 | 19.276 | *** |
| H5 | ← | HH7 | 0.131 | 0.021 | 6.138 | *** |
| H6 | ← | HH7 | 0.522 | 0.021 | 24.666 | *** |
| H7 | ← | HH7 | 0.793 | 0.020 | 40.225 | *** |
| H8 | ← | HH7 | 1.026 | 0.022 | 47.203 | *** |
| H9 | ← | HH7 | 0.337 | 0.020 | 17.206 | *** |
| H10 | ← | HH7 | 0.087 | 0.018 | 4.910 | *** |
| C3 | ← | CC1 | 1.218 | 0.041 | 29.639 | *** |
| C4 | ← | CC1 | 0.940 | 0.038 | 24.753 | *** |
| Models for the KPEI Scale | Indicators 1 | |||||
|---|---|---|---|---|---|---|
| χ2/df | GFI | CFI | RMSEA | RMR | SRMR | |
| First-order initial model (without modification indices) | 22.171 | 0.751 | 0.749 | 0.055 | 0.072 | 0.056 |
| First-order final model (with modification indices) | 13.734 | 0.932 | 0.930 | 0.043 | 0.042 | 0.042 |
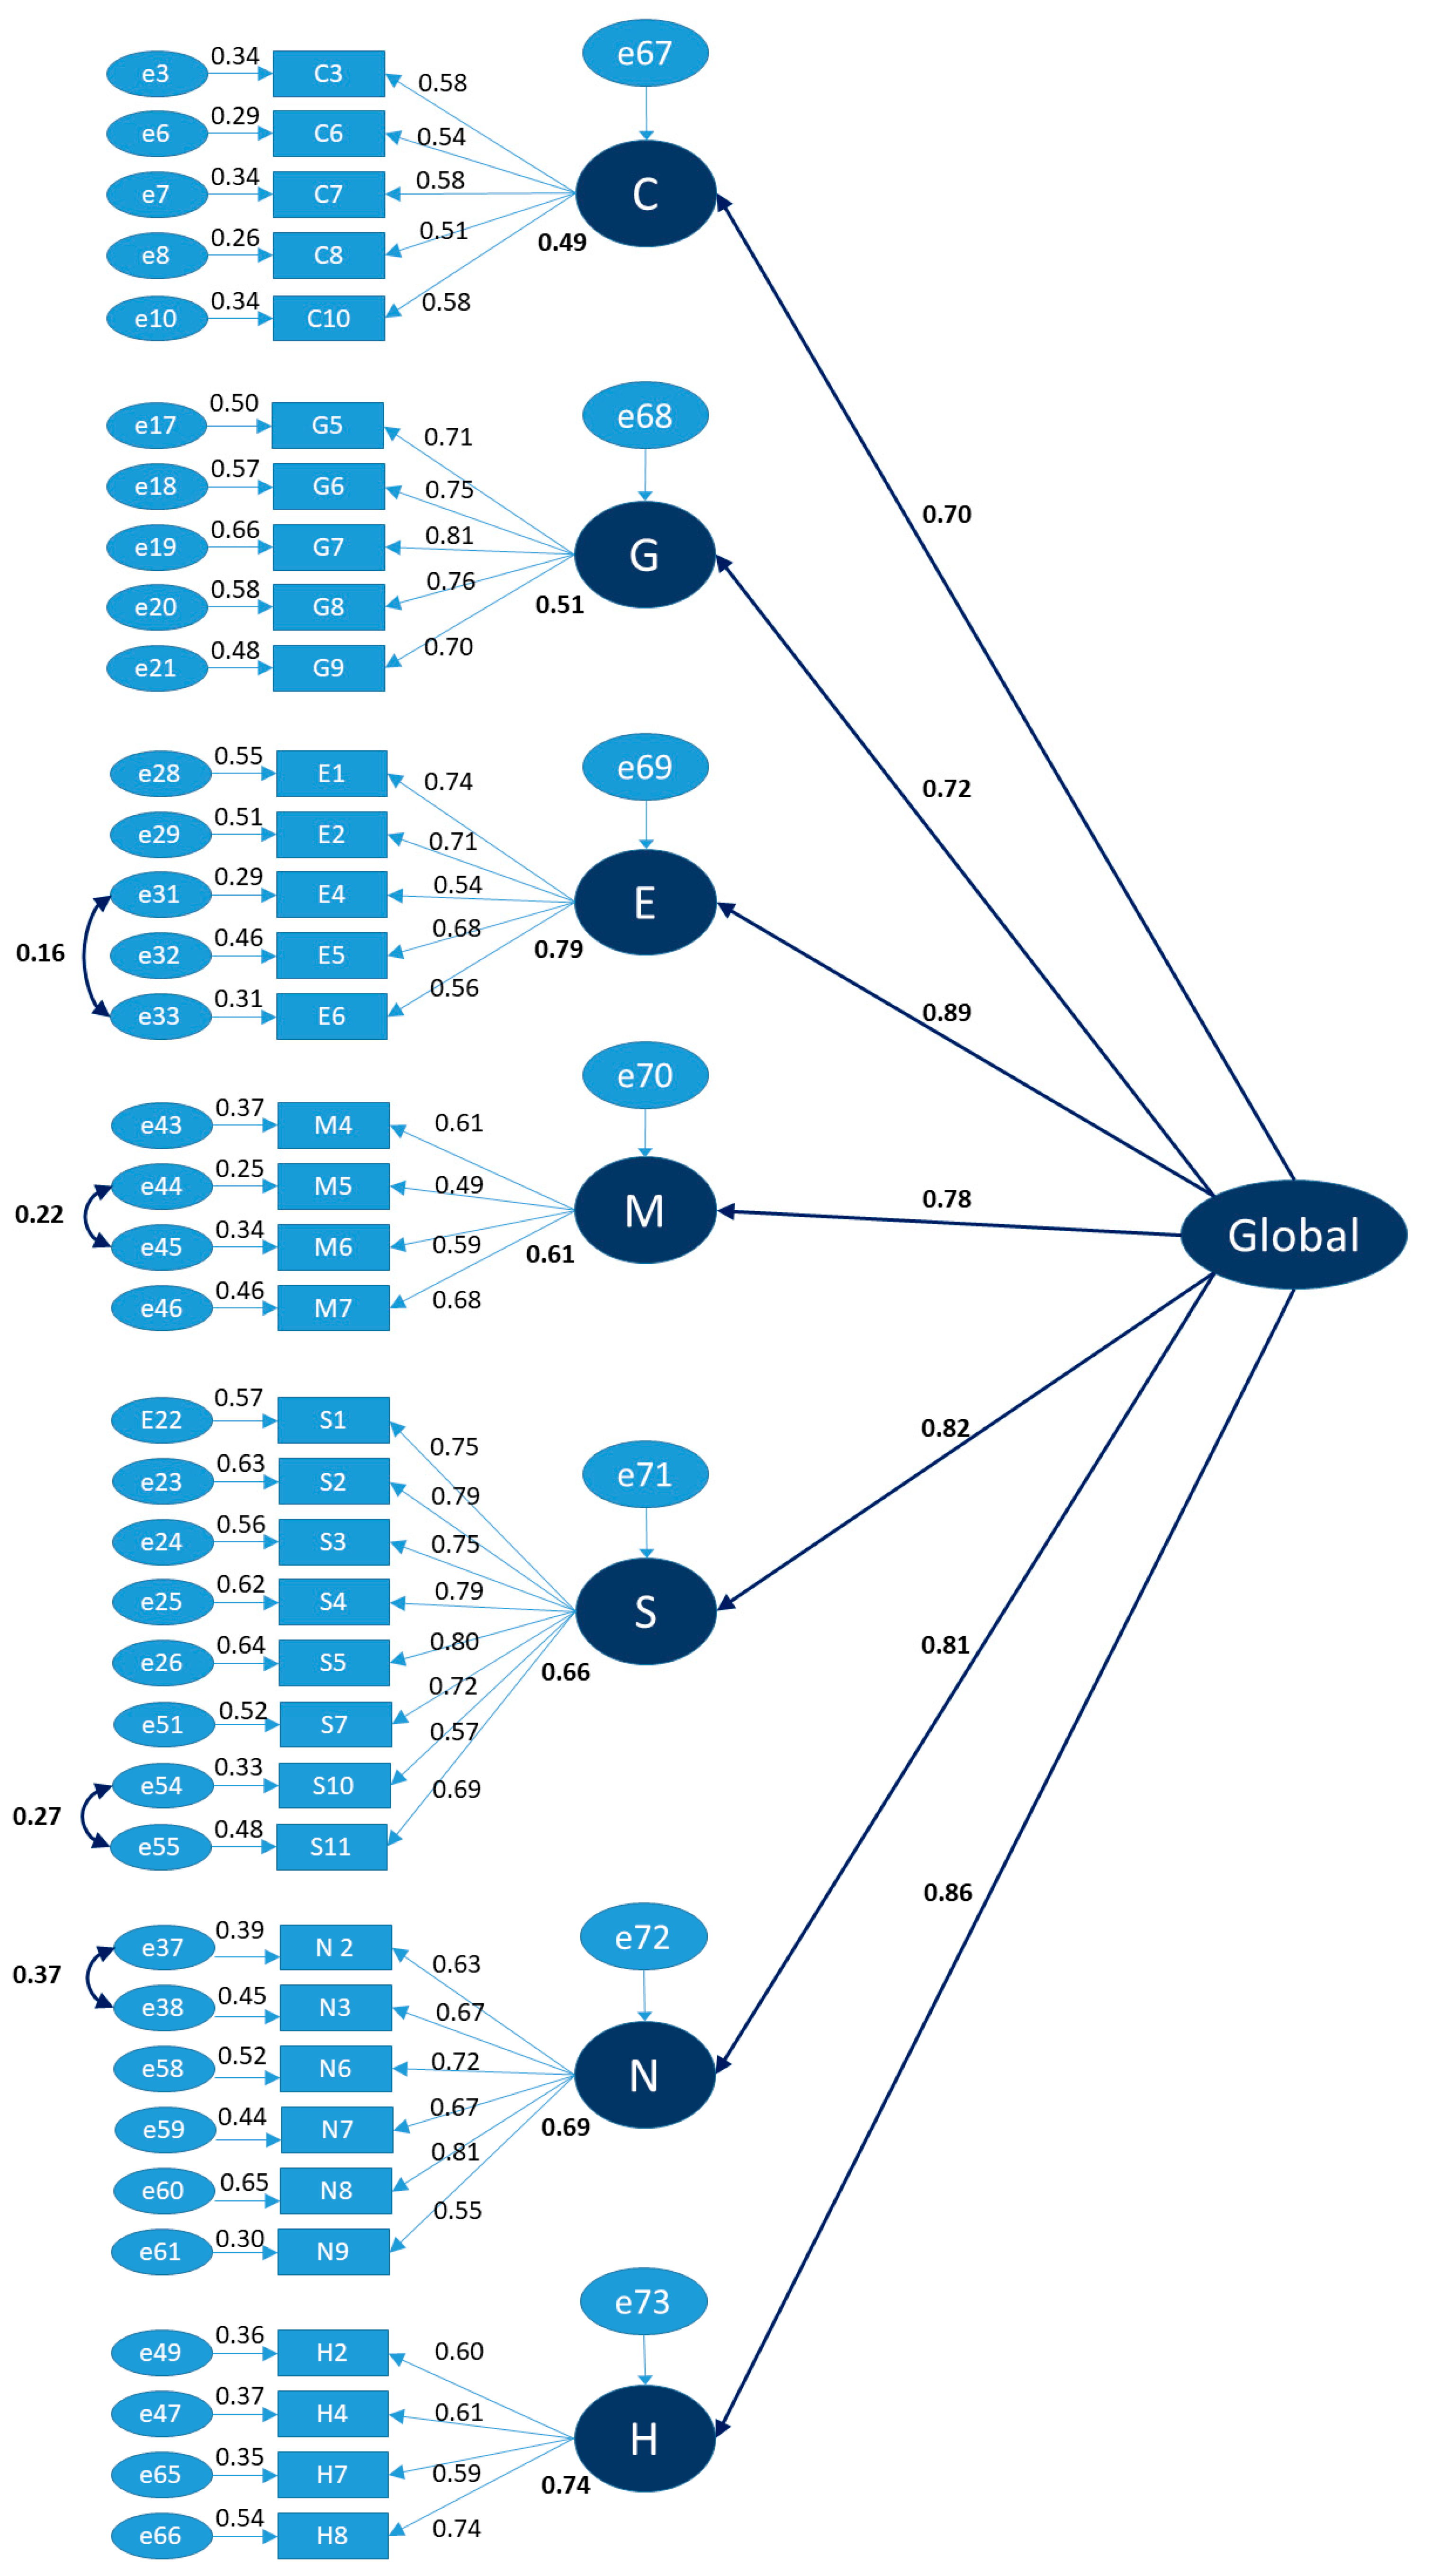
| Second-order model | 14.697 | 0.926 | 0.923 | 0.045 | 0.047 | 0.046 |
| Trajectories | Statistics 1 | ||||||
|---|---|---|---|---|---|---|---|
| E | SE | CR | p | λ | |||
| C6 | ← | CC1 | 1.068 | 0.032 | 33.543 | *** | 0.550 |
| C7 | ← | CC1 | 0.967 | 0.029 | 33.533 | *** | 0.566 |
| C8 | ← | CC1 | 0.847 | 0.028 | 30.624 | *** | 0.507 |
| C10 | ← | CC1 | 1.095 | 0.032 | 34.294 | *** | 0.594 |
| G5 | ← | GG2 | 1.000 | 0.708 | |||
| G6 | ← | GG2 | 1.128 | 0.019 | 58.493 | *** | 0.755 |
| G7 | ← | GG2 | 1.141 | 0.019 | 60.732 | *** | 0.810 |
| G8 | ← | GG2 | 1.104 | 0.020 | 56.390 | *** | 0.758 |
| G9 | ← | GG2 | 1.081 | 0.021 | 52.390 | *** | 0.696 |
| S1 | ← | SS3 | 1.000 | 0.753 | |||
| S2 | ← | SS3 | 0.959 | 0.014 | 67.649 | *** | 0.793 |
| S3 | ← | SS3 | 0.836 | 0.013 | 63.318 | *** | 0.751 |
| S4 | ← | SS3 | 0.920 | 0.014 | 66.361 | *** | 0.788 |
| S5 | ← | SS3 | 0.987 | 0.014 | 68.824 | *** | 0.801 |
| E1 | ← | EE4 | 1.000 | 0.746 | |||
| E2 | ← | EE4 | 0.975 | 0.017 | 57.302 | *** | 0.722 |
| E4 | ← | EE4 | 0.617 | 0.015 | 40.340 | *** | 0.533 |
| E5 | ← | EE4 | 0.768 | 0.015 | 52.137 | *** | 0.673 |
| E6 | ← | EE4 | 0.633 | 0.015 | 41.974 | *** | 0.550 |
| N2 | ← | NN6 | 1.000 | 0.628 | |||
| N3 | ← | NN6 | 1.007 | 0.017 | 57.968 | *** | 0.677 |
| M4 | ← | MM5 | 1.000 | 0.610 | |||
| M5 | ← | MM5 | 0.864 | 0.027 | 31.639 | *** | 0.495 |
| M6 | ← | MM5 | 0.975 | 0.027 | 36.055 | *** | 0.587 |
| M7 | ← | MM5 | 1.136 | 0.029 | 39.172 | *** | 0.675 |
| H4 | ← | HH7 | 1.089 | 0.029 | 38.075 | *** | 0.608 |
| H2 | ← | HH7 | 1.000 | 0.587 | |||
| S7 | ← | SS3 | 0.848 | 0.014 | 60.328 | *** | 0.721 |
| S10 | ← | SS3 | 0.632 | 0.013 | 47.005 | *** | 0.573 |
| S11 | ← | SS3 | 0.781 | 0.014 | 57.570 | *** | 0.693 |
| N6 | ← | NN6 | 0.897 | 0.019 | 46.658 | *** | 0.720 |
| N7 | ← | NN6 | 0.966 | 0.022 | 44.512 | *** | 0.662 |
| N8 | ← | NN6 | 1.085 | 0.022 | 50.021 | *** | 0.806 |
| N9 | ← | NN6 | 0.754 | 0.020 | 37.648 | *** | 0.543 |
| H7 | ← | HH7 | 0.886 | 0.023 | 38.404 | *** | 0.587 |
| H8 | ← | HH7 | 1.174 | 0.027 | 43.088 | *** | 0.747 |
| C3 | ← | CC1 | 1.000 | 0.577 | |||
| Factors/Dimensions | Composite Reliability CR | Mean Extracted Variance MEV |
|---|---|---|
| Factor 1/Culture and Tradition | 0.694 | 0.313 |
| Factor 2/Gastronomic Innovation and Gourmet Kitchen | 0.862 | 0.555 |
| Factor 3/Economic and Social Aspects | 0.782 | 0.423 |
| Factor 4/Commercialisation and Marketing | 0.684 | 0.354 |
| Factor 5/Environment and Sustainability | 0.904 | 0.544 |
| Factor 6/Nutritional Aspects | 0.833 | 0.459 |
| Factor 7/Health Effects | 0.728 | 0.404 |
| Stratified | 0.967 | 0.448 |
| Items | Statistics 1 | ||
|---|---|---|---|
| r | r2 | α | |
| Factor One—Culture and Tradition | 0.695 | ||
| C3 | 0.424 | 0.186 | 0.656 |
| C6 | 0.450 | 0.207 | 0.646 |
| C7 | 0.467 | 0.224 | 0.638 |
| C8 | 0.434 | 0.203 | 0.652 |
| C10 | 0.476 | 0.229 | 0.634 |
| Factor Two—Gastronomic Innovation and Gourmet Kitchen | 0.860 | ||
| G5 | 0.641 | 0.438 | 0.839 |
| G6 | 0.691 | 0.506 | 0.827 |
| G7 | 0.741 | 0.566 | 0.814 |
| G8 | 0.696 | 0.517 | 0.825 |
| G9 | 0.620 | 0.404 | 0.846 |
| Factor Three—Economic and Social Aspects | 0.787 | ||
| E1 | 0.607 | 0.423 | 0.731 |
| E2 | 0.586 | 0.396 | 0.739 |
| E4 | 0.497 | 0.272 | 0.767 |
| E5 | 0.625 | 0.395 | 0.728 |
| E6 | 0.509 | 0.286 | 0.763 |
| Factor Four—Commercialisation and Marketing | 0.706 | ||
| M4 | 0.471 | 0.228 | 0.655 |
| M5 | 0.468 | 0.237 | 0.657 |
| M6 | 0.539 | 0.296 | 0.613 |
| M7 | 0.488 | 0.248 | 0.644 |
| Factor Five—Environment and Sustainability | 0.905 | ||
| S1 | 0.696 | 0.522 | 0.893 |
| S2 | 0.751 | 0.577 | 0.888 |
| S3 | 0.697 | 0.510 | 0.893 |
| S4 | 0.749 | 0.583 | 0.888 |
| S5 | 0.747 | 0.575 | 0.888 |
| S7 | 0.691 | 0.484 | 0.893 |
| S10 | 0.565 | 0.365 | 0.903 |
| S11 | 0.679 | 0.493 | 0.894 |
| Factor Six—Nutritional Aspects | 0.832 | ||
| N2 | 0.598 | 0.447 | 0.807 |
| N3 | 0.613 | 0.471 | 0.803 |
| N6 | 0.636 | 0.445 | 0.800 |
| N7 | 0.600 | 0.381 | 0.806 |
| N8 | 0.713 | 0.538 | 0.783 |
| N9 | 0.487 | 0.276 | 0.828 |
| Factor Seven—Health Effects | 0.723 | ||
| H2 | 0.497 | 0.260 | 0.671 |
| H4 | 0.450 | 0.221 | 0.703 |
| H7 | 0.534 | 0.317 | 0.652 |
| H8 | 0.581 | 0.349 | 0.623 |
| Items | Statistics 1 | ||
|---|---|---|---|
| r | r2 | α | |
| C3 | 0.477 | 0.275 | 0.940 |
| C6 | 0.372 | 0.256 | 0.941 |
| C7 | 0.420 | 0.273 | 0.941 |
| C8 | 0.327 | 0.229 | 0.942 |
| C10 | 0.409 | 0.283 | 0.941 |
| G5 | 0.553 | 0.477 | 0.940 |
| G6 | 0.544 | 0.522 | 0.940 |
| G7 | 0.577 | 0.581 | 0.939 |
| G8 | 0.554 | 0.528 | 0.940 |
| G9 | 0.602 | 0.477 | 0.939 |
| E1 | 0.638 | 0.490 | 0.939 |
| E2 | 0.617 | 0.476 | 0.939 |
| E4 | 0.481 | 0.321 | 0.940 |
| E5 | 0.566 | 0.426 | 0.940 |
| E6 | 0.500 | 0.330 | 0.940 |
| M4 | 0.469 | 0.288 | 0.940 |
| M5 | 0.386 | 0.273 | 0.941 |
| M6 | 0.455 | 0.333 | 0.941 |
| M7 | 0.523 | 0.341 | 0.940 |
| S1 | 0.656 | 0.553 | 0.939 |
| S2 | 0.642 | 0.587 | 0.939 |
| S3 | 0.641 | 0.542 | 0.939 |
| S4 | 0.629 | 0.593 | 0.939 |
| S5 | 0.688 | 0.610 | 0.938 |
| S7 | 0.597 | 0.496 | 0.939 |
| S10 | 0.524 | 0.387 | 0.940 |
| S11 | 0.600 | 0.511 | 0.939 |
| N2 | 0.591 | 0.479 | 0.939 |
| N3 | 0.666 | 0.571 | 0.939 |
| N6 | 0.538 | 0.470 | 0.940 |
| N7 | 0.510 | 0.400 | 0.940 |
| N8 | 0.611 | 0.560 | 0.939 |
| N9 | 0.396 | 0.298 | 0.941 |
| H2 | 0.500 | 0.329 | 0.940 |
| H4 | 0.535 | 0.338 | 0.940 |
| H7 | 0.440 | 0.341 | 0.941 |
| H8 | 0.602 | 0.462 | 0.939 |
| Global KPEI scale | 0.941 | ||
Disclaimer/Publisher’s Note: The statements, opinions and data contained in all publications are solely those of the individual author(s) and contributor(s) and not of MDPI and/or the editor(s). MDPI and/or the editor(s) disclaim responsibility for any injury to people or property resulting from any ideas, methods, instructions or products referred to in the content. |
© 2023 by the authors. Licensee MDPI, Basel, Switzerland. This article is an open access article distributed under the terms and conditions of the Creative Commons Attribution (CC BY) license (https://creativecommons.org/licenses/by/4.0/).
Share and Cite
Guiné, R.P.F.; Duarte, J.; Chuck-Hernández, C.; Boustani, N.M.; Djekic, I.; Bartkiene, E.; Sarić, M.M.; Papageorgiou, M.; Korzeniowska, M.; Combarros-Fuertes, P.; et al. Validation of the Scale Knowledge and Perceptions about Edible Insects through Structural Equation Modelling. Sustainability 2023, 15, 2992. https://doi.org/10.3390/su15042992
Guiné RPF, Duarte J, Chuck-Hernández C, Boustani NM, Djekic I, Bartkiene E, Sarić MM, Papageorgiou M, Korzeniowska M, Combarros-Fuertes P, et al. Validation of the Scale Knowledge and Perceptions about Edible Insects through Structural Equation Modelling. Sustainability. 2023; 15(4):2992. https://doi.org/10.3390/su15042992
Chicago/Turabian StyleGuiné, Raquel P. F., João Duarte, Cristina Chuck-Hernández, Nada M. Boustani, Ilija Djekic, Elena Bartkiene, Marijana Matec Sarić, Maria Papageorgiou, Malgorzata Korzeniowska, Patricia Combarros-Fuertes, and et al. 2023. "Validation of the Scale Knowledge and Perceptions about Edible Insects through Structural Equation Modelling" Sustainability 15, no. 4: 2992. https://doi.org/10.3390/su15042992
APA StyleGuiné, R. P. F., Duarte, J., Chuck-Hernández, C., Boustani, N. M., Djekic, I., Bartkiene, E., Sarić, M. M., Papageorgiou, M., Korzeniowska, M., Combarros-Fuertes, P., Černelič-Bizjak, M., Martin-Hadmas, R., Straumite, E., Damarli, E., Florença, S. G., Ferreira, M., Costa, C. A., Correia, P. M. R., Cardoso, A. P., ... Anjos, O. (2023). Validation of the Scale Knowledge and Perceptions about Edible Insects through Structural Equation Modelling. Sustainability, 15(4), 2992. https://doi.org/10.3390/su15042992