
Locally Specified CPT Soil Classification Based on Machine Learning Techniques


Abstract
:1. Introduction
1.1. Data Mining in Geotechnical Engineering
1.2. CPT Data for Model Training and Testing
2. Data Mining of the CPT Test Results for the Soil Classification
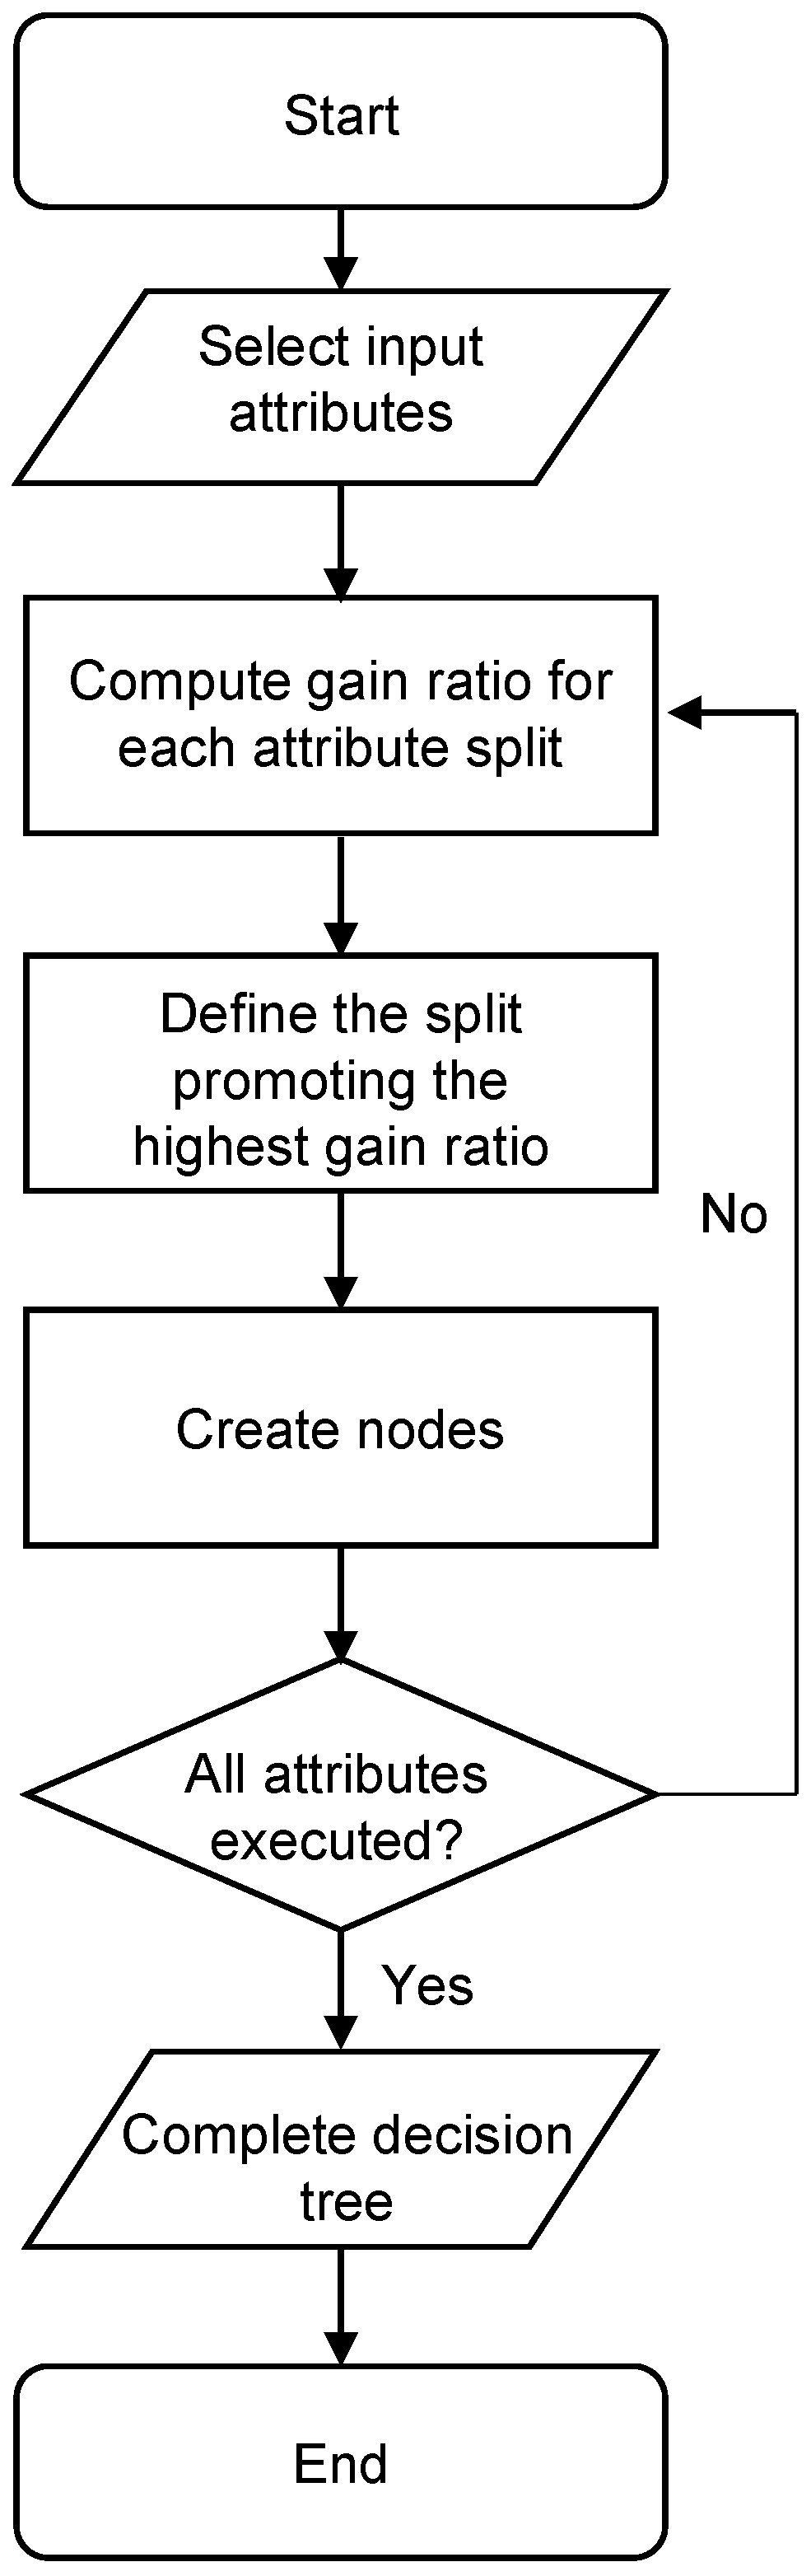
2.1. C4.5 Algorithm
2.2. Input Attribute and Training Data Selection
2.3. Analysis Results
3. Conclusions
Author Contributions
Funding
Institutional Review Board Statement
Informed Consent Statement
Data Availability Statement
Conflicts of Interest
References
- Ljung, L. Model Validation and Model Error Modeling; Linköping University Electronic Press: Linköping, Sweden, 1999. [Google Scholar]
- Opolot, E.; Yu, Y.Y.; Finke, P.A. Modeling soil genesis at pedon and landscape scales: Achievements and problems. Quat. Int. 2015, 376, 34–46. [Google Scholar] [CrossRef]
- Phoon, K.K.; Ching, J.; Shuku, T. Challenges in data-driven site characterization. Georisk Assess. Manag. Risk Eng. Syst. Geohazards 2022, 16, 114–126. [Google Scholar] [CrossRef]
- Odeh, I.O.A.; McBratney, A.B.; Chittleborough, D.J. Soil pattern recognition with fuzzy-c-means: Application to classification and soil-landform interrelationships. Soil Sci. Soc. Am. J. 1992, 56, 505–516. [Google Scholar] [CrossRef]
- Najjar, Y.M.; Basheer, I.A.; Naouss, W.A. On the identification of compaction characteristics by neuronets. Comput. Geotech. 1996, 18, 167–187. [Google Scholar] [CrossRef]
- Juang, T.C.; Wang, M.K.; Chen, H.J.; Tan, C.C. Ammonium fixation by surface soils and clays. Soil Sci. 2001, 166, 345–352. [Google Scholar] [CrossRef]
- Bhattacharya, B.; Solomatine, D.P. Machine learning in soil classification. Neural Netw. 2006, 19, 186–195. [Google Scholar] [CrossRef] [PubMed]
- Das, S.K.; Basudhar, P.K. Utilization of self-organizing map and fuzzy clustering for site characterization using piezocone data. Comput. Geotech. 2009, 36, 241–248. [Google Scholar] [CrossRef]
- Bhargavi, P.; Jyothi, S. Soil classification using data mining techniques: A comparative study. Int. J. Eng. Trends Technol. 2011, 2, 55–59. [Google Scholar]
- Wang, X.; Wang, H.; Liang, R.Y.; Liu, Y. A semi-supervised clustering-based approach for stratification identification using borehole and cone penetration test data. Eng. Geol. 2019, 248, 102–116. [Google Scholar] [CrossRef]
- Cao, Z.; Wang, Y. Bayesian approach for probabilistic site characterization using cone penetration tests. J. Geotech. Geoenvironmental Eng. 2013, 139, 267–276. [Google Scholar] [CrossRef]
- Carvalho, L.O.; Ribeiro, D.B. A multiple model machine learning approach for soil classification from cone penetration test data. Soils Rocks 2021, 44, 1–14. [Google Scholar] [CrossRef]
- Rauter, S.; Tshuchnigg, F. CPT data interpretation employing different machine learning techniques. Geosciences 2021, 11, 265. [Google Scholar] [CrossRef]
- Erharter, G.H.; Oberhollenzer, S.; Frankhauser, A.; Marte, R.; Marcher, T. Learning decision boundaries for cone penetration test classification. Comput.-Aided Civ. Infrastruct. Eng. 2021, 36, 489–503. [Google Scholar] [CrossRef]
- Taiaousi, D.; Travasarou, T.; Drosos, V.; Ugalde, J.; Chacko, J. Machine learning applications for site characterization based on CPT data. Geotech. Earthq. Eng. Soil Dyn. V 2018, 461–472. [Google Scholar] [CrossRef]
- Taluja, C.; Thakur, R. Recent trends of machine learning in soil classification: A review. Int. J. Comput. Eng. Res. 2018, 8, 25–32. [Google Scholar]
- Begemann, H.K.S. The friction jacket cone as an aid in determining the soil profile. In Proceedings of the 6th International Conference on Soil Mechanics and Foundation Engineering, Montréal, QC, Canada, 8–15 September 1965; pp. 17–20. [Google Scholar]
- Douglas, B.J.; Olsen, R.S. Soil Classification Using Electric Cone Penetrometer. In Proceedings of the Symposium on Cone Penetration Testing and Experience, Geotechnical Engineering Division ASCE, St. Louis, MO, USA, October 1981; pp. 209–227. [Google Scholar]
- Robertson, P.K.; Campanella, R.G. SPT-CPT correlations. J. Geotech. Div. 1983, 109, 1449–1460. [Google Scholar] [CrossRef]
- Robertson, P.K.; Campanella, R.G.; Gillespie, D.; Greig, J. Use of piezometer cone data. Proc. Am. Soc. Civ. Eng. 1986, 6, 1263–1280. [Google Scholar]
- Robertson, P.K. Soil classification using the cone penetration test. Can. Geotech. J. 1990, 27, 151–158. [Google Scholar] [CrossRef]
- Robertson, P.K.; Wride, C.E. Evaluating cyclic liquefaction potential using the cone penetration test. Can. Geotech. J. 1998, 35, 442–459. [Google Scholar] [CrossRef]
- Robertson, P.K. Interpretation of cone penetration tests—A unified approach. Can. Geotech. J. 2009, 46, 1337–1355. [Google Scholar] [CrossRef]
- Robertson, P.K.; Cabal, K.L. Guide to Cone Penetration Testing, 6th ed.; Gregg Drilling Inc.: Signal Hill, CA, USA, 2014. [Google Scholar]
- Dea Woo E&C. Site Investigation Report for Free Economic Zone Development at Hwajeon; Dea Woo E&C: Busan, Republic of Korea, 2006. [Google Scholar]
- ASTM D2487-17; Standard Practice for Classification of Soils for Engineering Purposes (Unified Soil Classification System). American Standards for Testing Materials. ASTM International: West Conshohocken, PA, USA, 2017.
- Quinlan, J.R. Induction of decision trees. Mach. Learn. 1986, 1, 81–106. [Google Scholar] [CrossRef]
- He, H.; Ma, Y. Imbalanced Learning: Foundations, Algorithms, and Applications; Wiley-IEEE Press: Hoboken, NJ, USA, 2013. [Google Scholar]
- Demir, S.; Şahin, E.K. Liquefaction prediction with robust machine learning algorithms (SVM, RF, and XGBoost) supported by genetic algorithm-based feature selection and parameter optimization from the perspective of data processing. Environ. Earth Sci. 2022, 81, 1–17. [Google Scholar] [CrossRef]
- Menardi, G.; Torelli, N. Training and assessing classification rules with imbalanced data. Data Min. Knowl. Discov. 2014, 28, 92–122. [Google Scholar] [CrossRef]
- Chawla, N.V.; Bowyer, K.W.; Hall, L.O.; Kegelmeyer, W.P. SMOTE: Synthetic minority over-sampling technique. J. Artif. Intell. Res. 2002, 16, 321–357. [Google Scholar] [CrossRef]


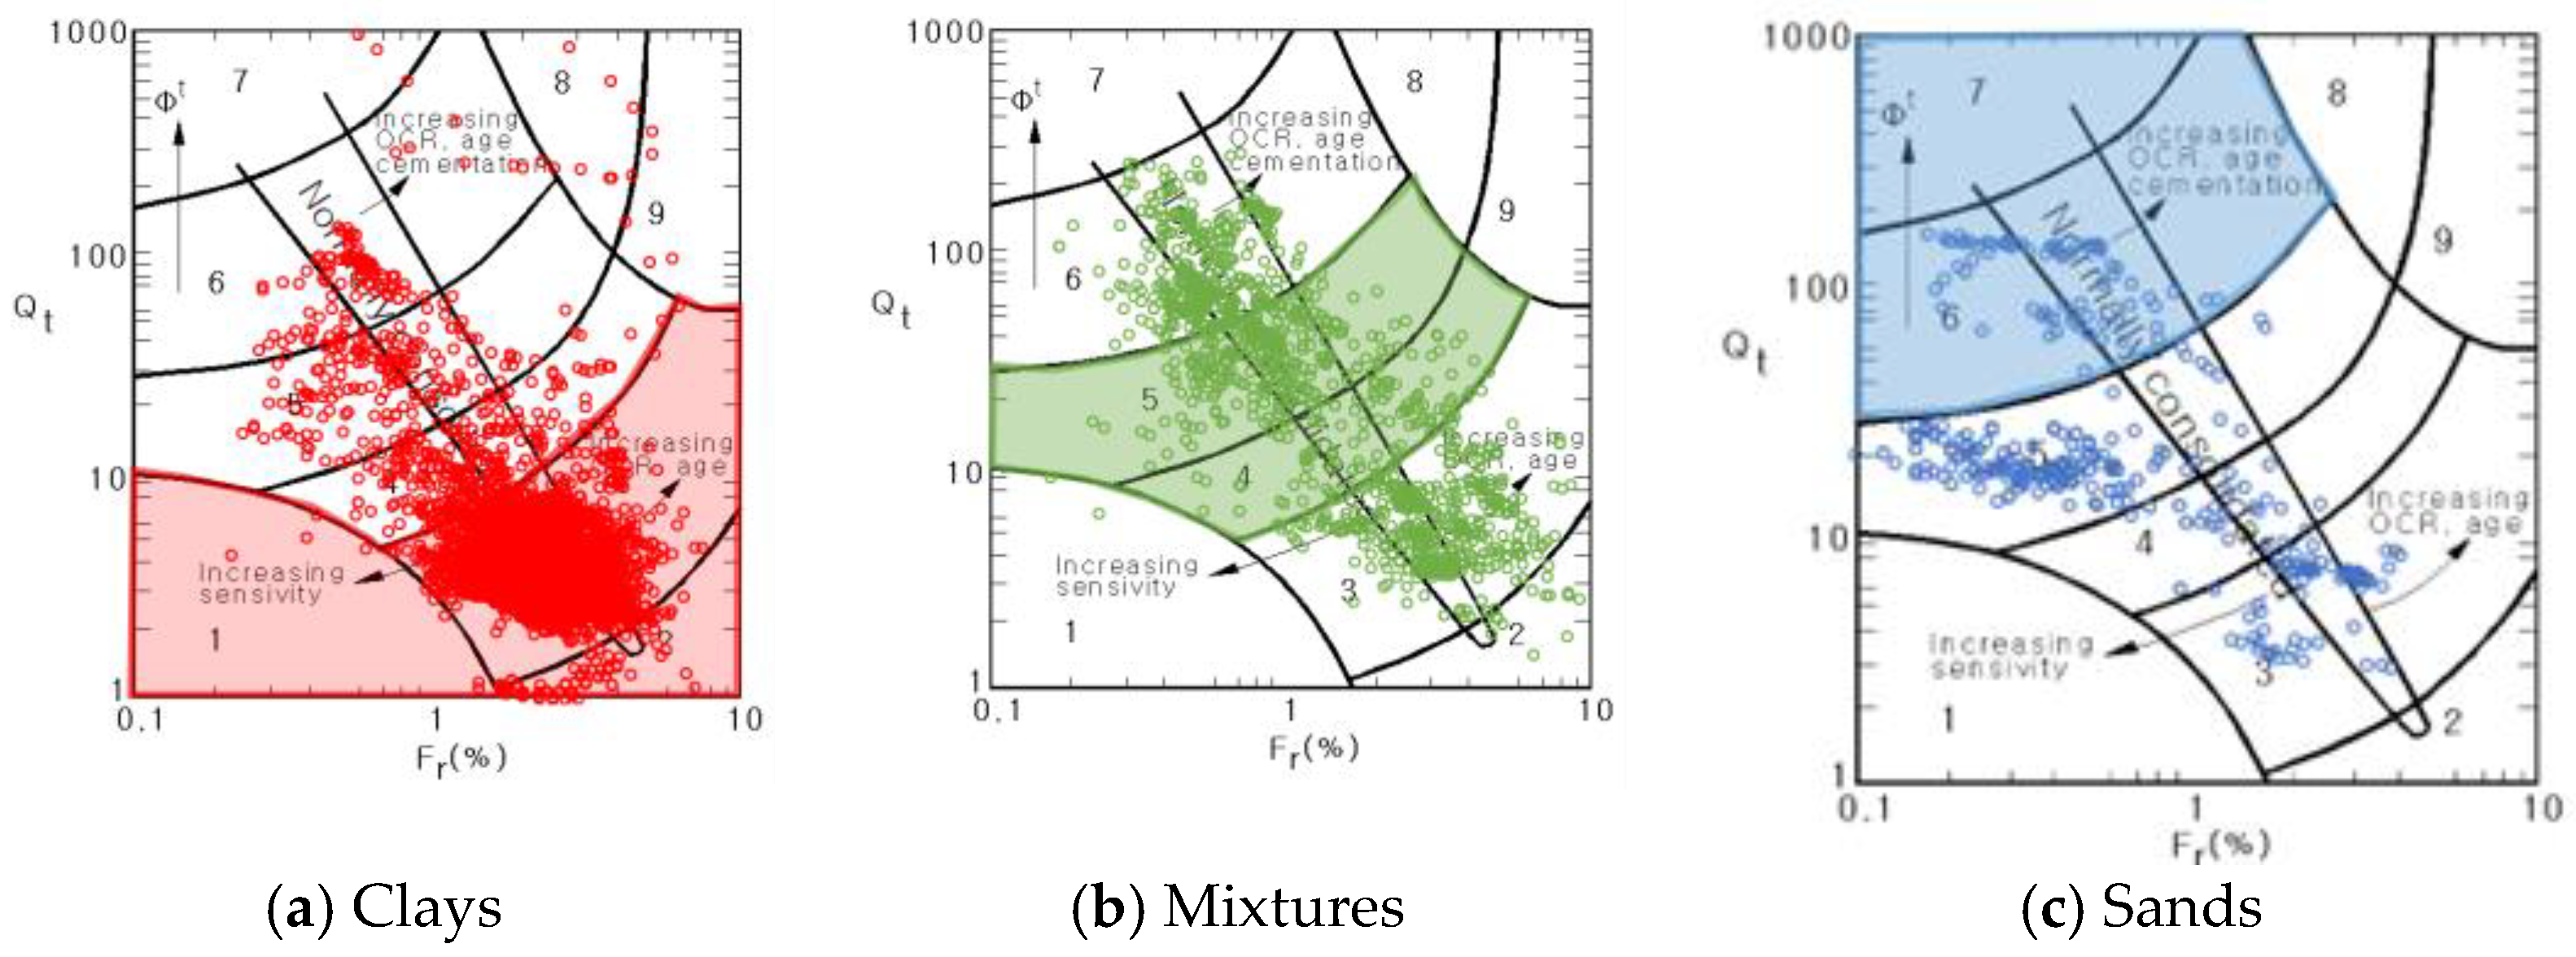
| Classification | Soil Behavior Type | |
|---|---|---|
| SBT1 | Clays (CH, CL) | Sensitive, fine grained |
| SBT2 | Organic soils—clay | |
| SBT3 | Clay—silty clay to clay | |
| SBT4 | Silt–Sand–Clay Mixtures (MH, ML, SC, SM) | Silt mixtures—clayey silt to silty clay |
| SBT5 | Sand mixtures—silty sand to sandy silt | |
| SBT6 | Sands (SW, SP) | Sands—clean sand to silty sand |
| SBT7 | Gravelly sand to dense sand | |
| SBT8 | Stiff Soils | Very stiff sand to clayey sand |
| SBT9 | Very stiff fine grained | |
| Total | Clays | Mixtures | Sands | |
|---|---|---|---|---|
| Total instances | 12,112 | 10,314 | 1411 | 387 |
| Misclassified | 1918 | 577 | 1034 | 307 |
| Accuracy | 84% | 94% | 27% | 21% |
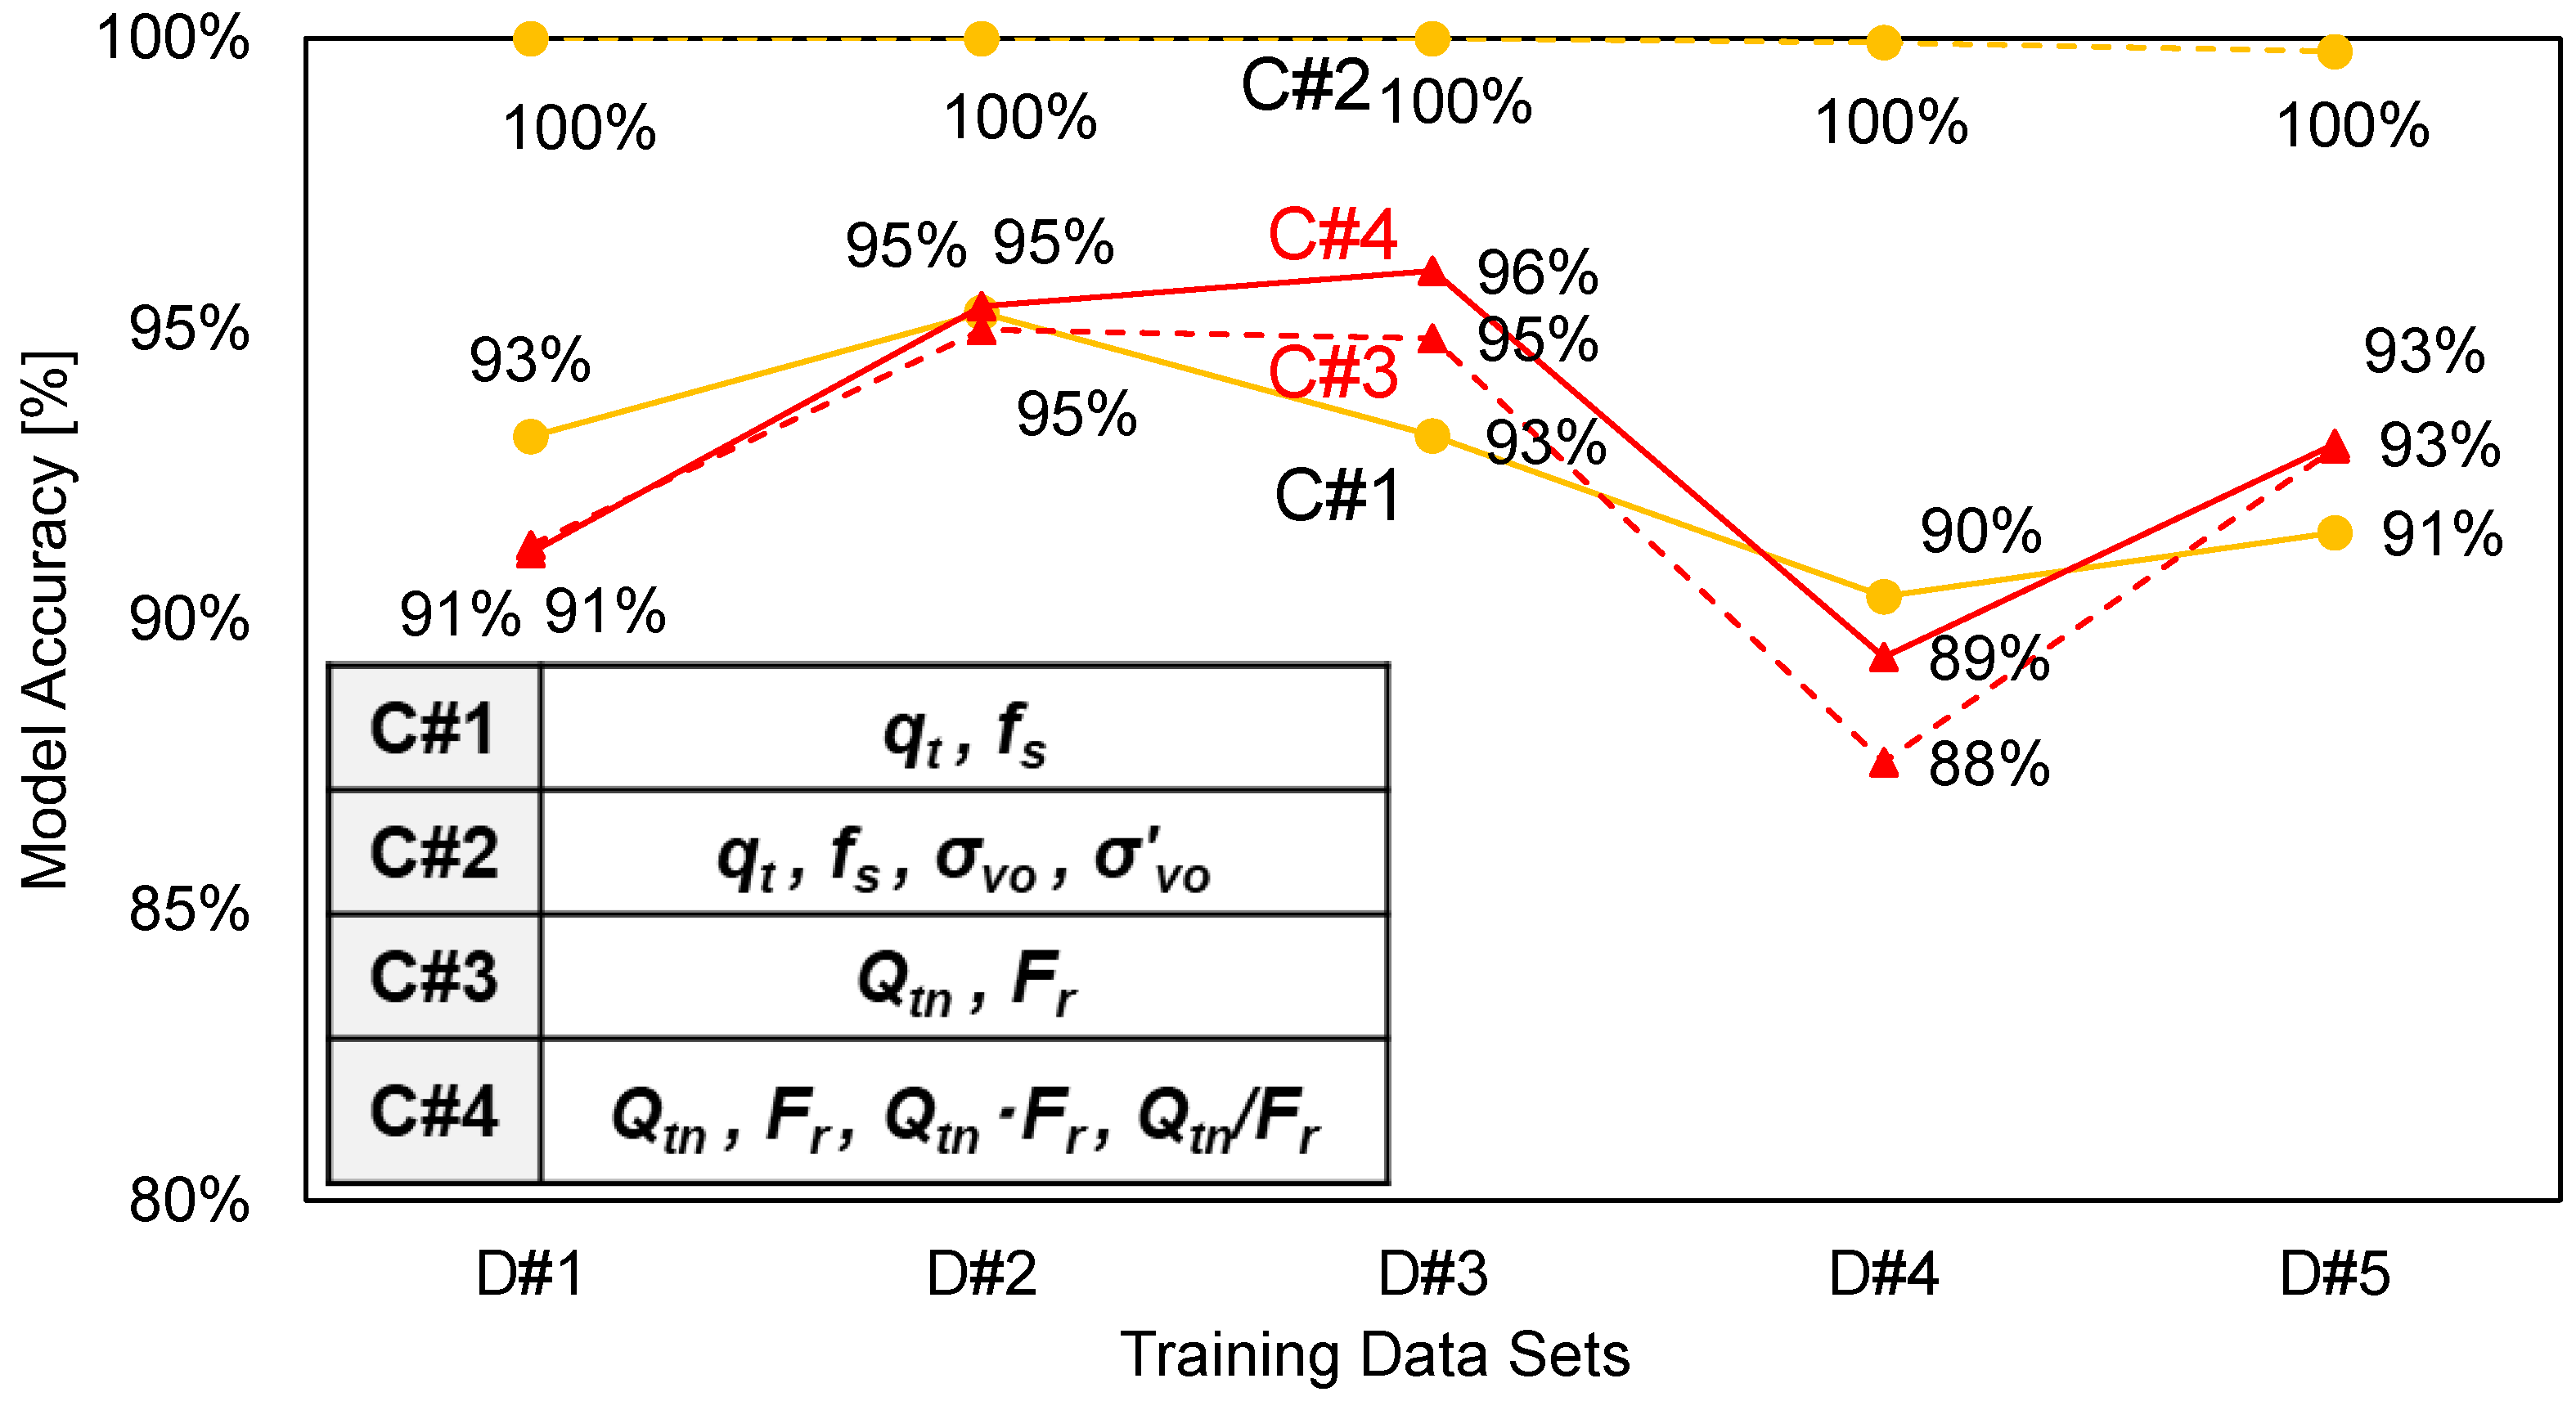
| Combination | Input Attributes |
|---|---|
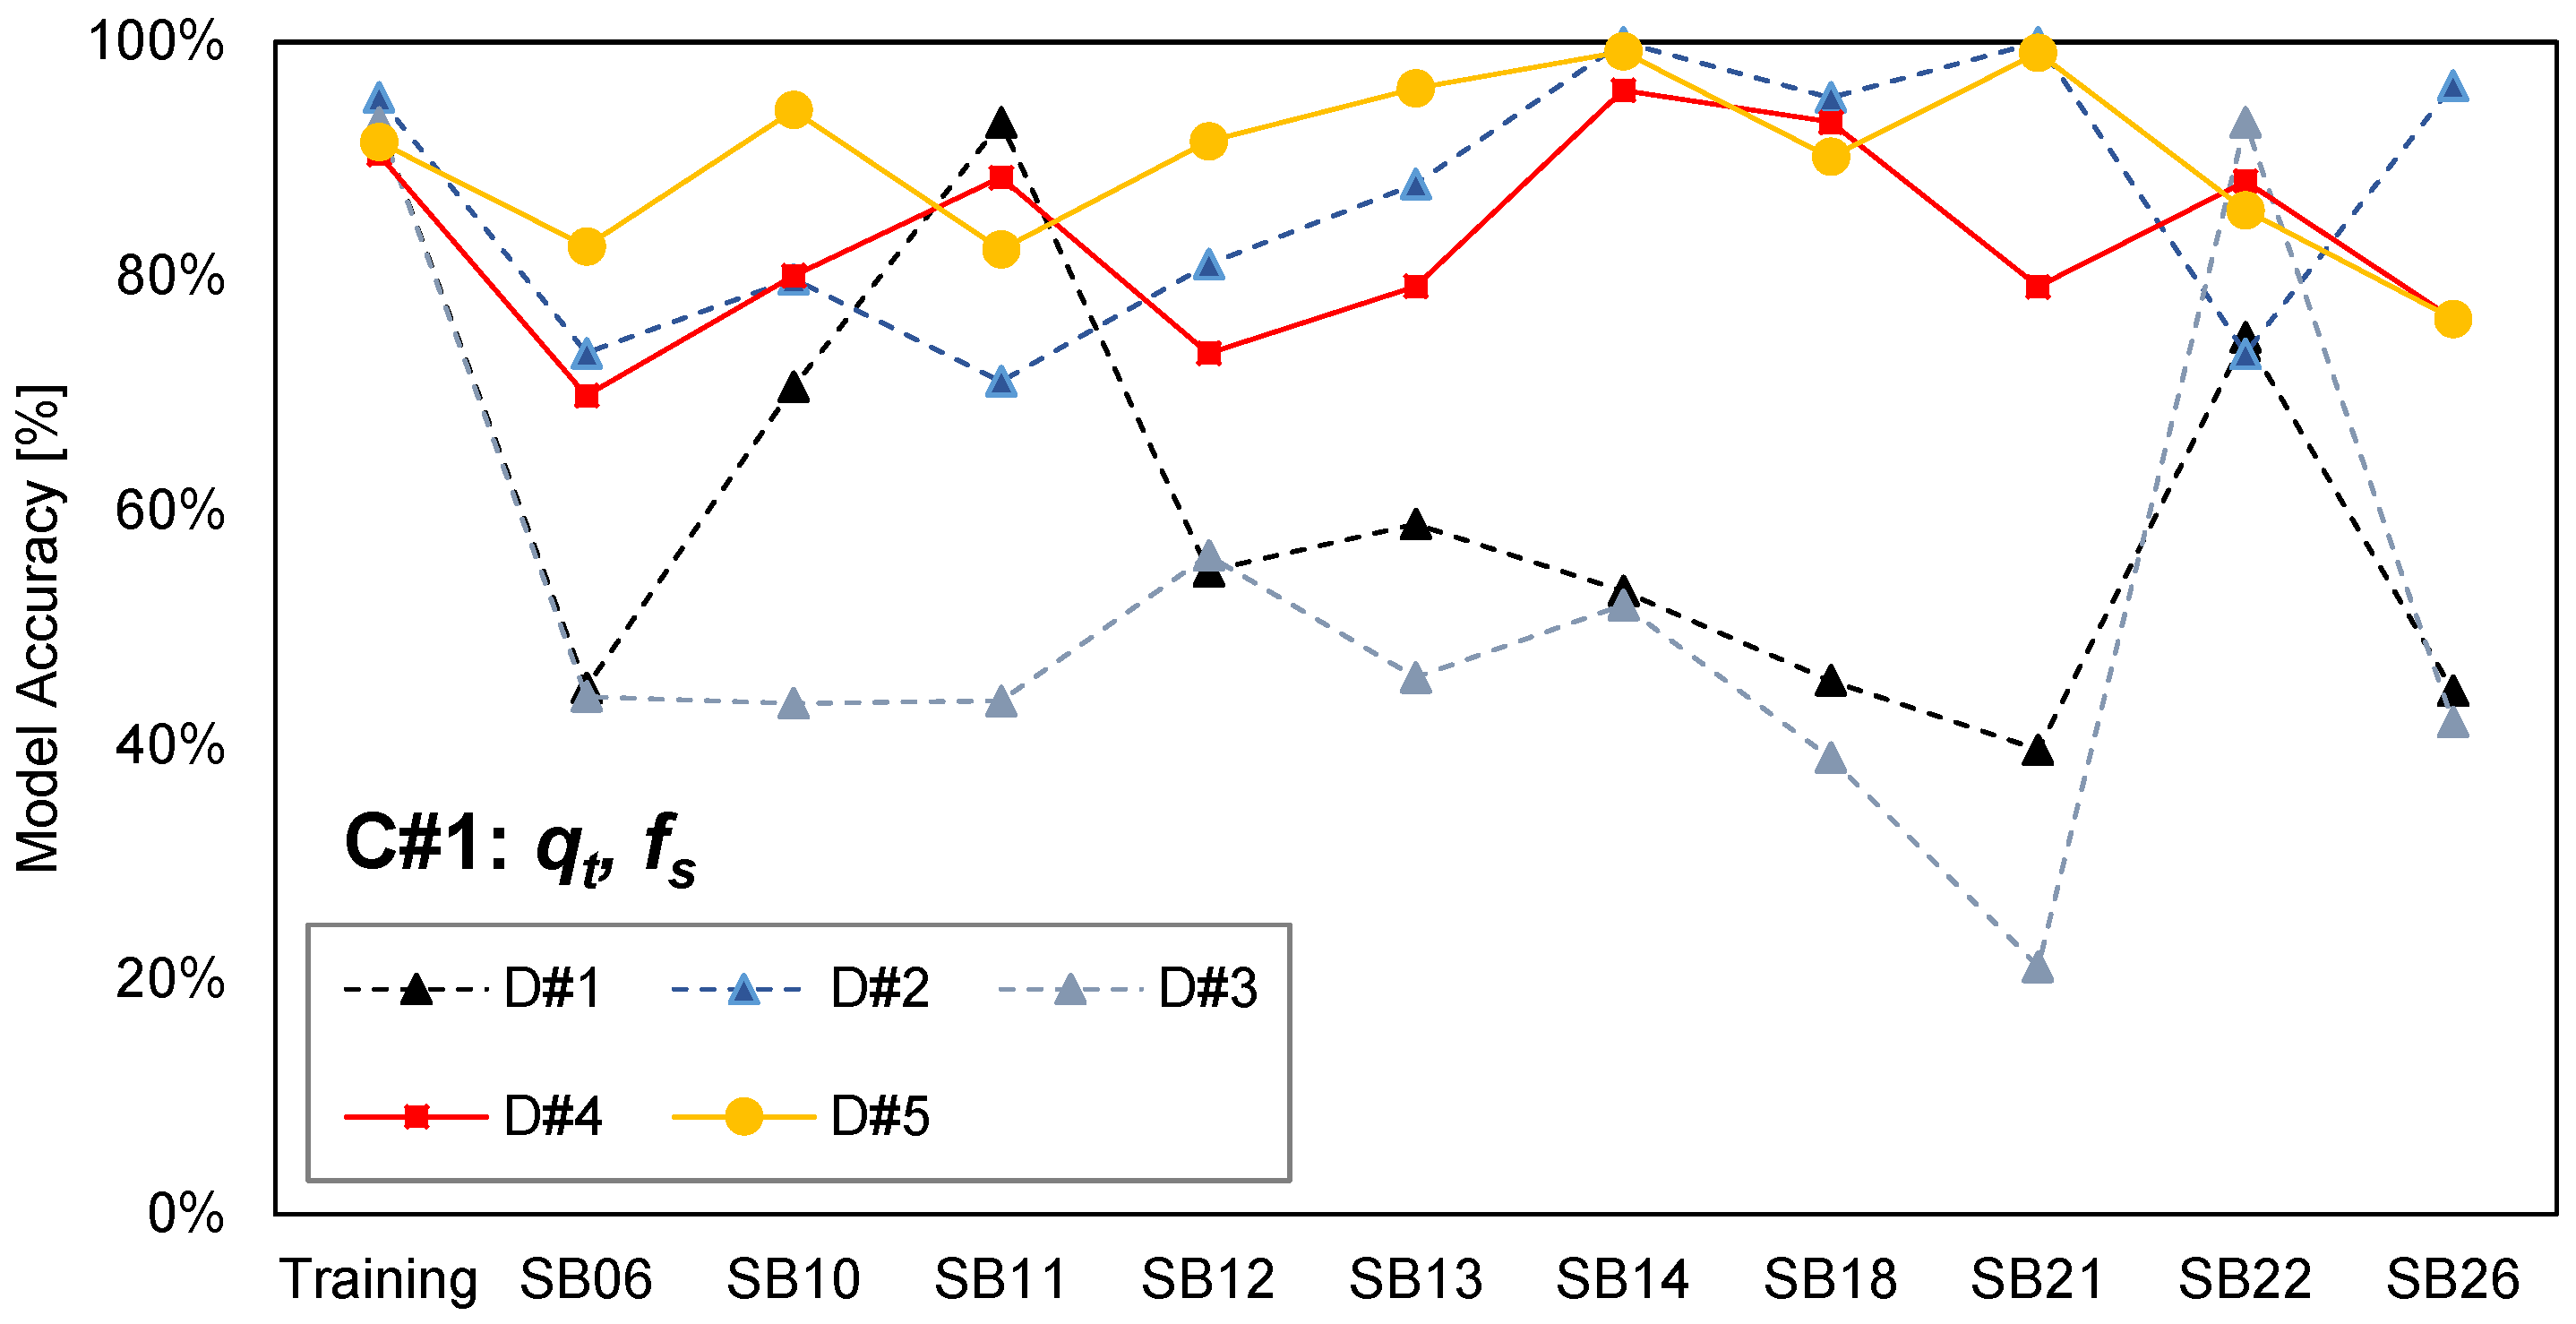
| C#1 | qt, fs |
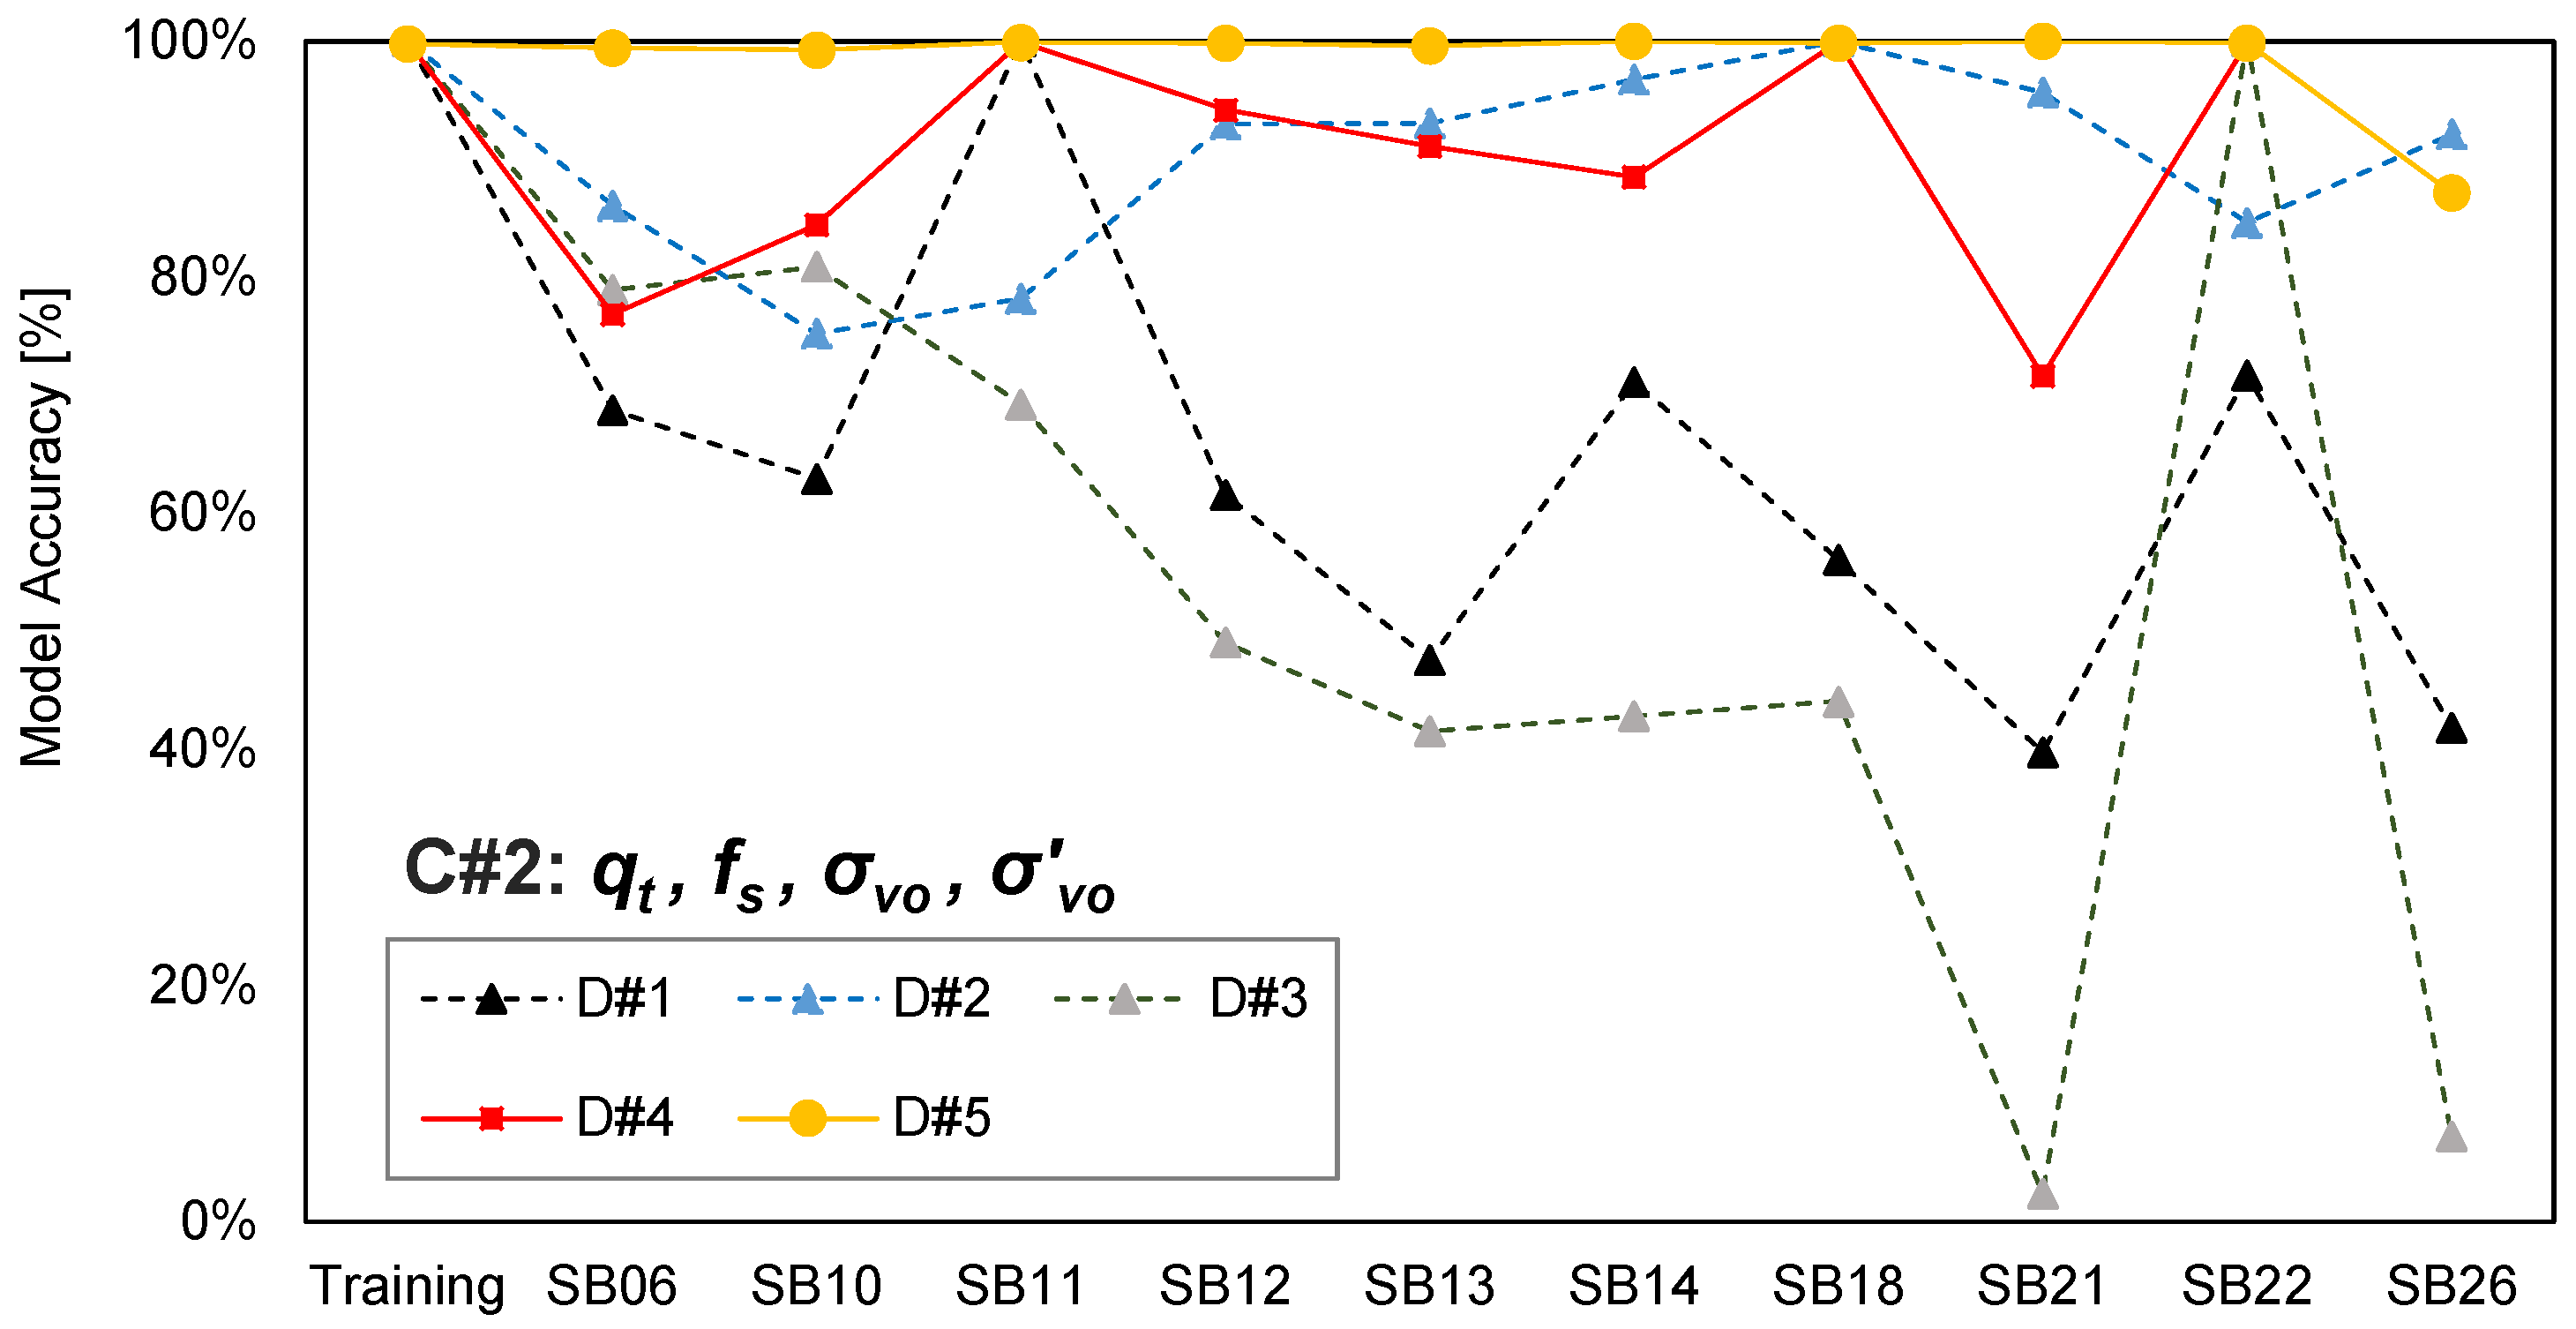
| C#2 | qt, fs, σv, σv’ |
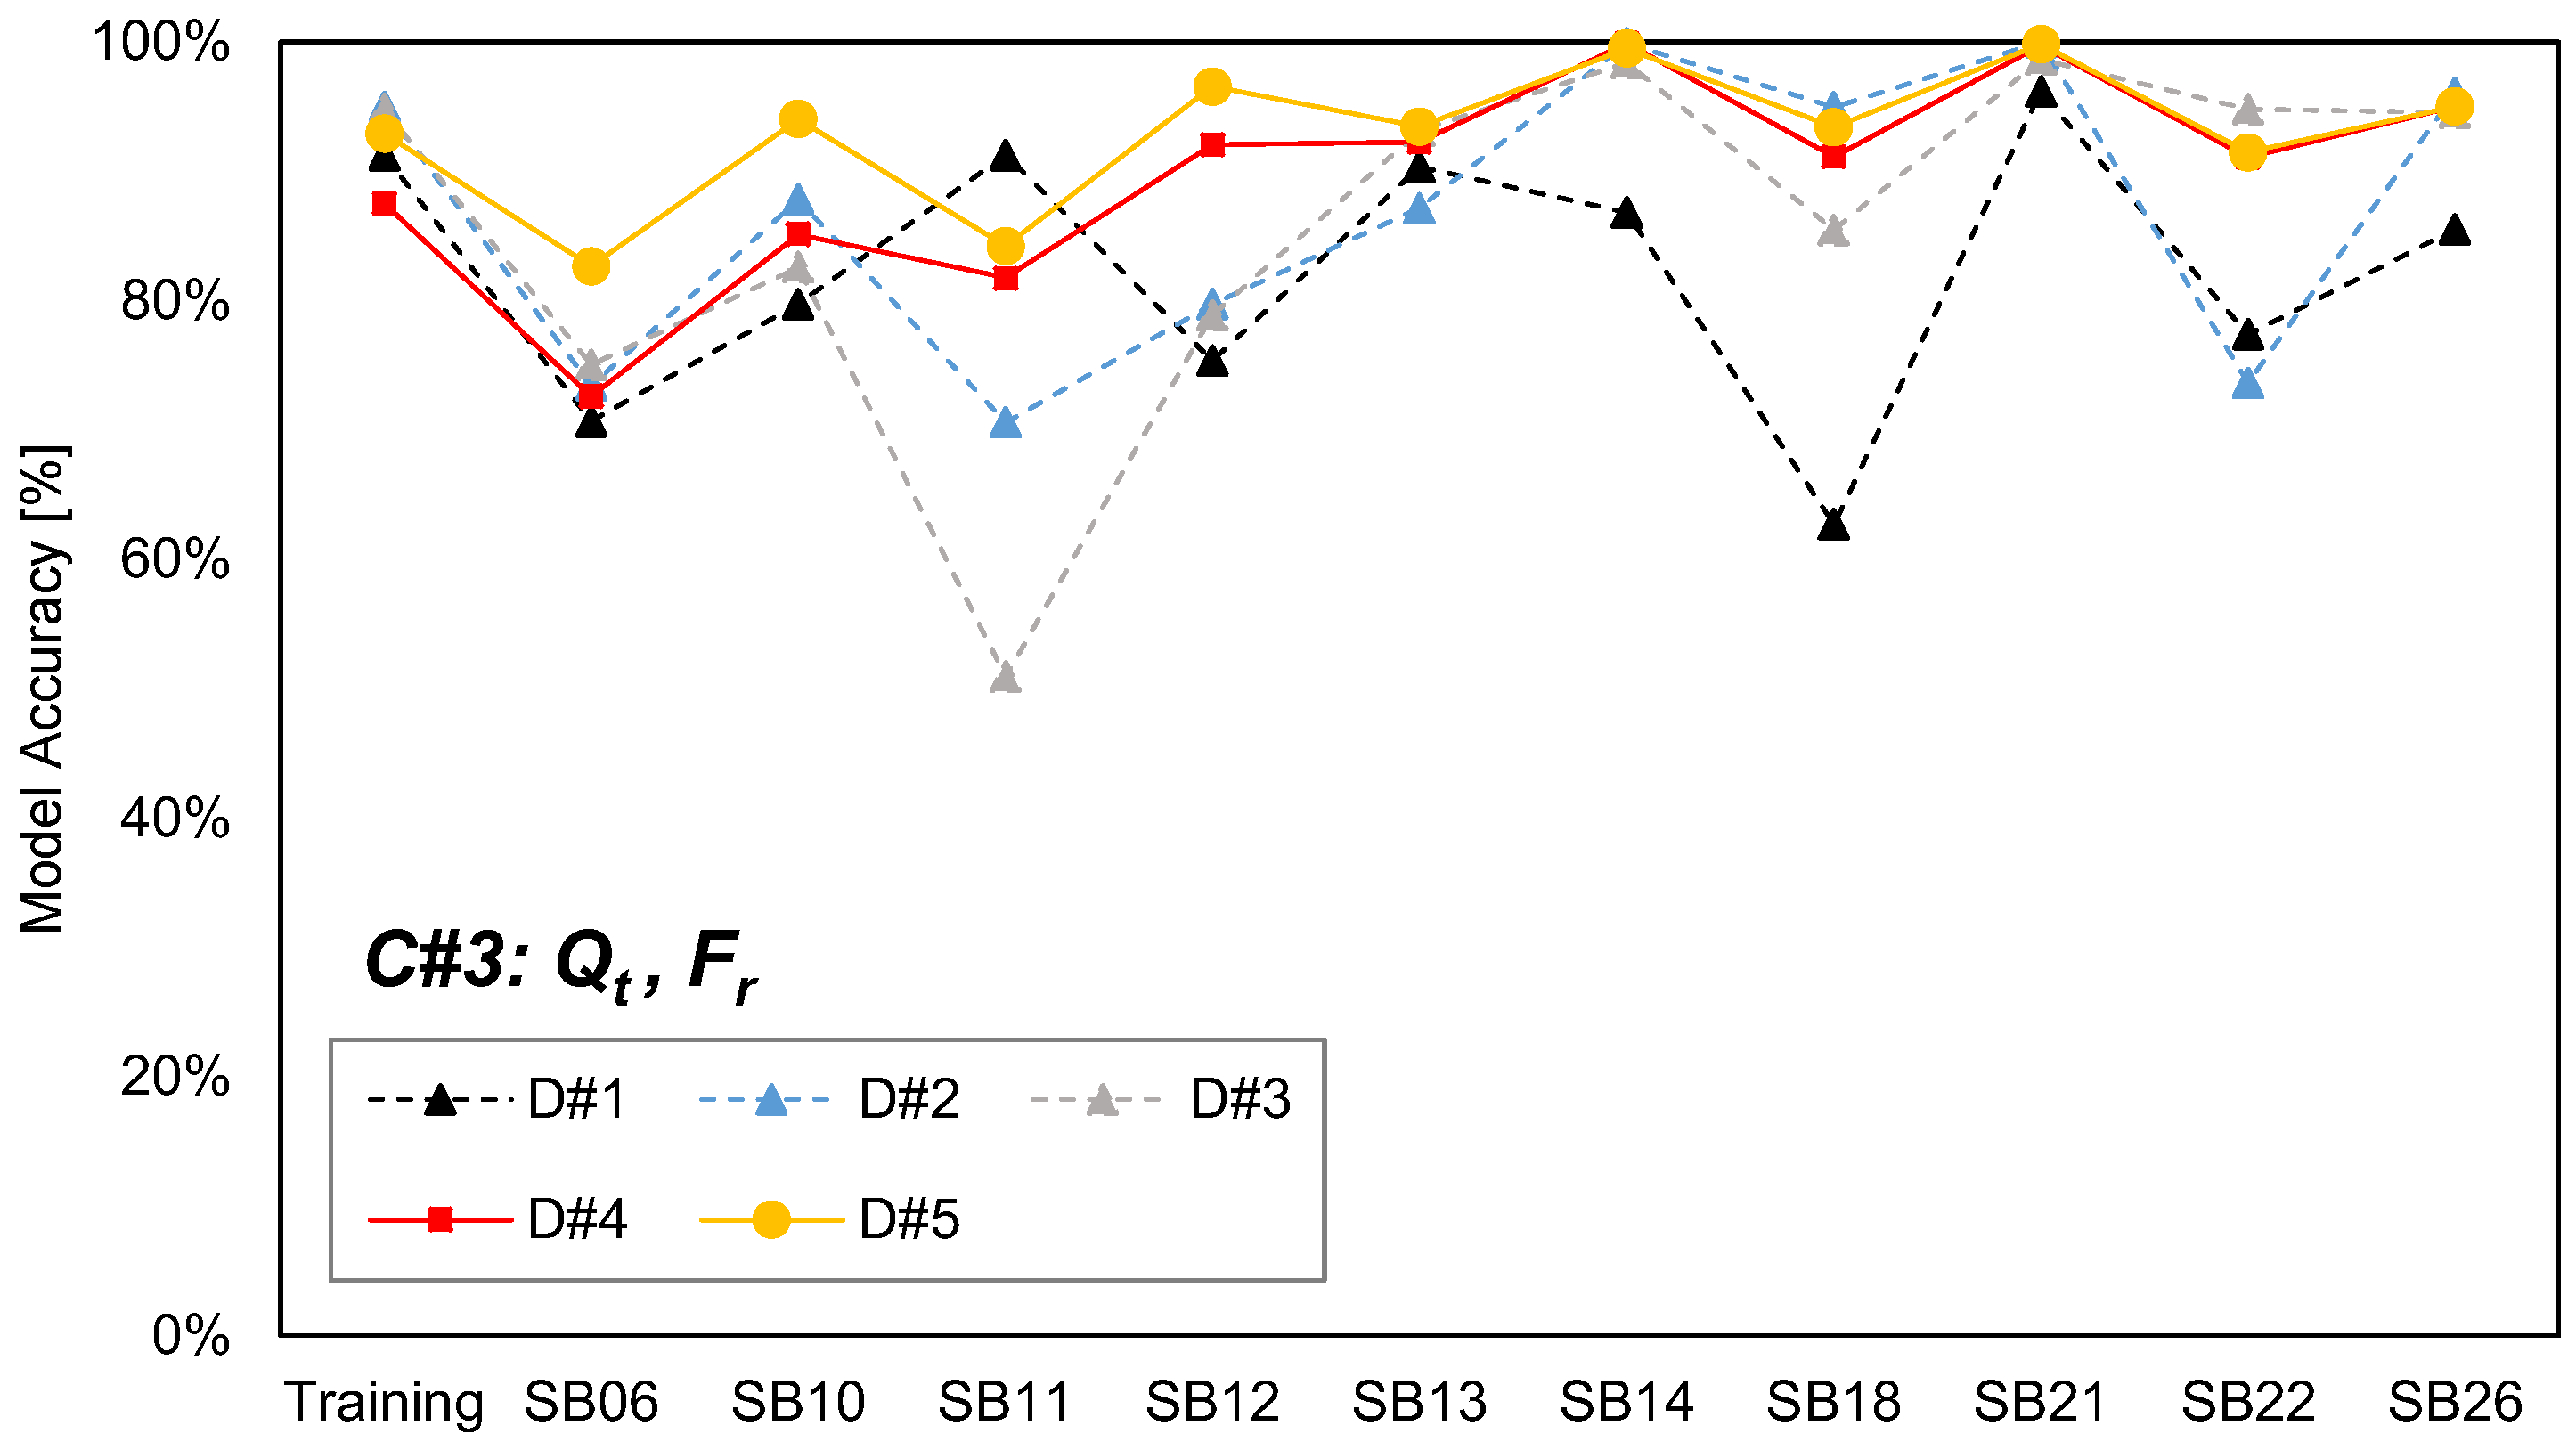
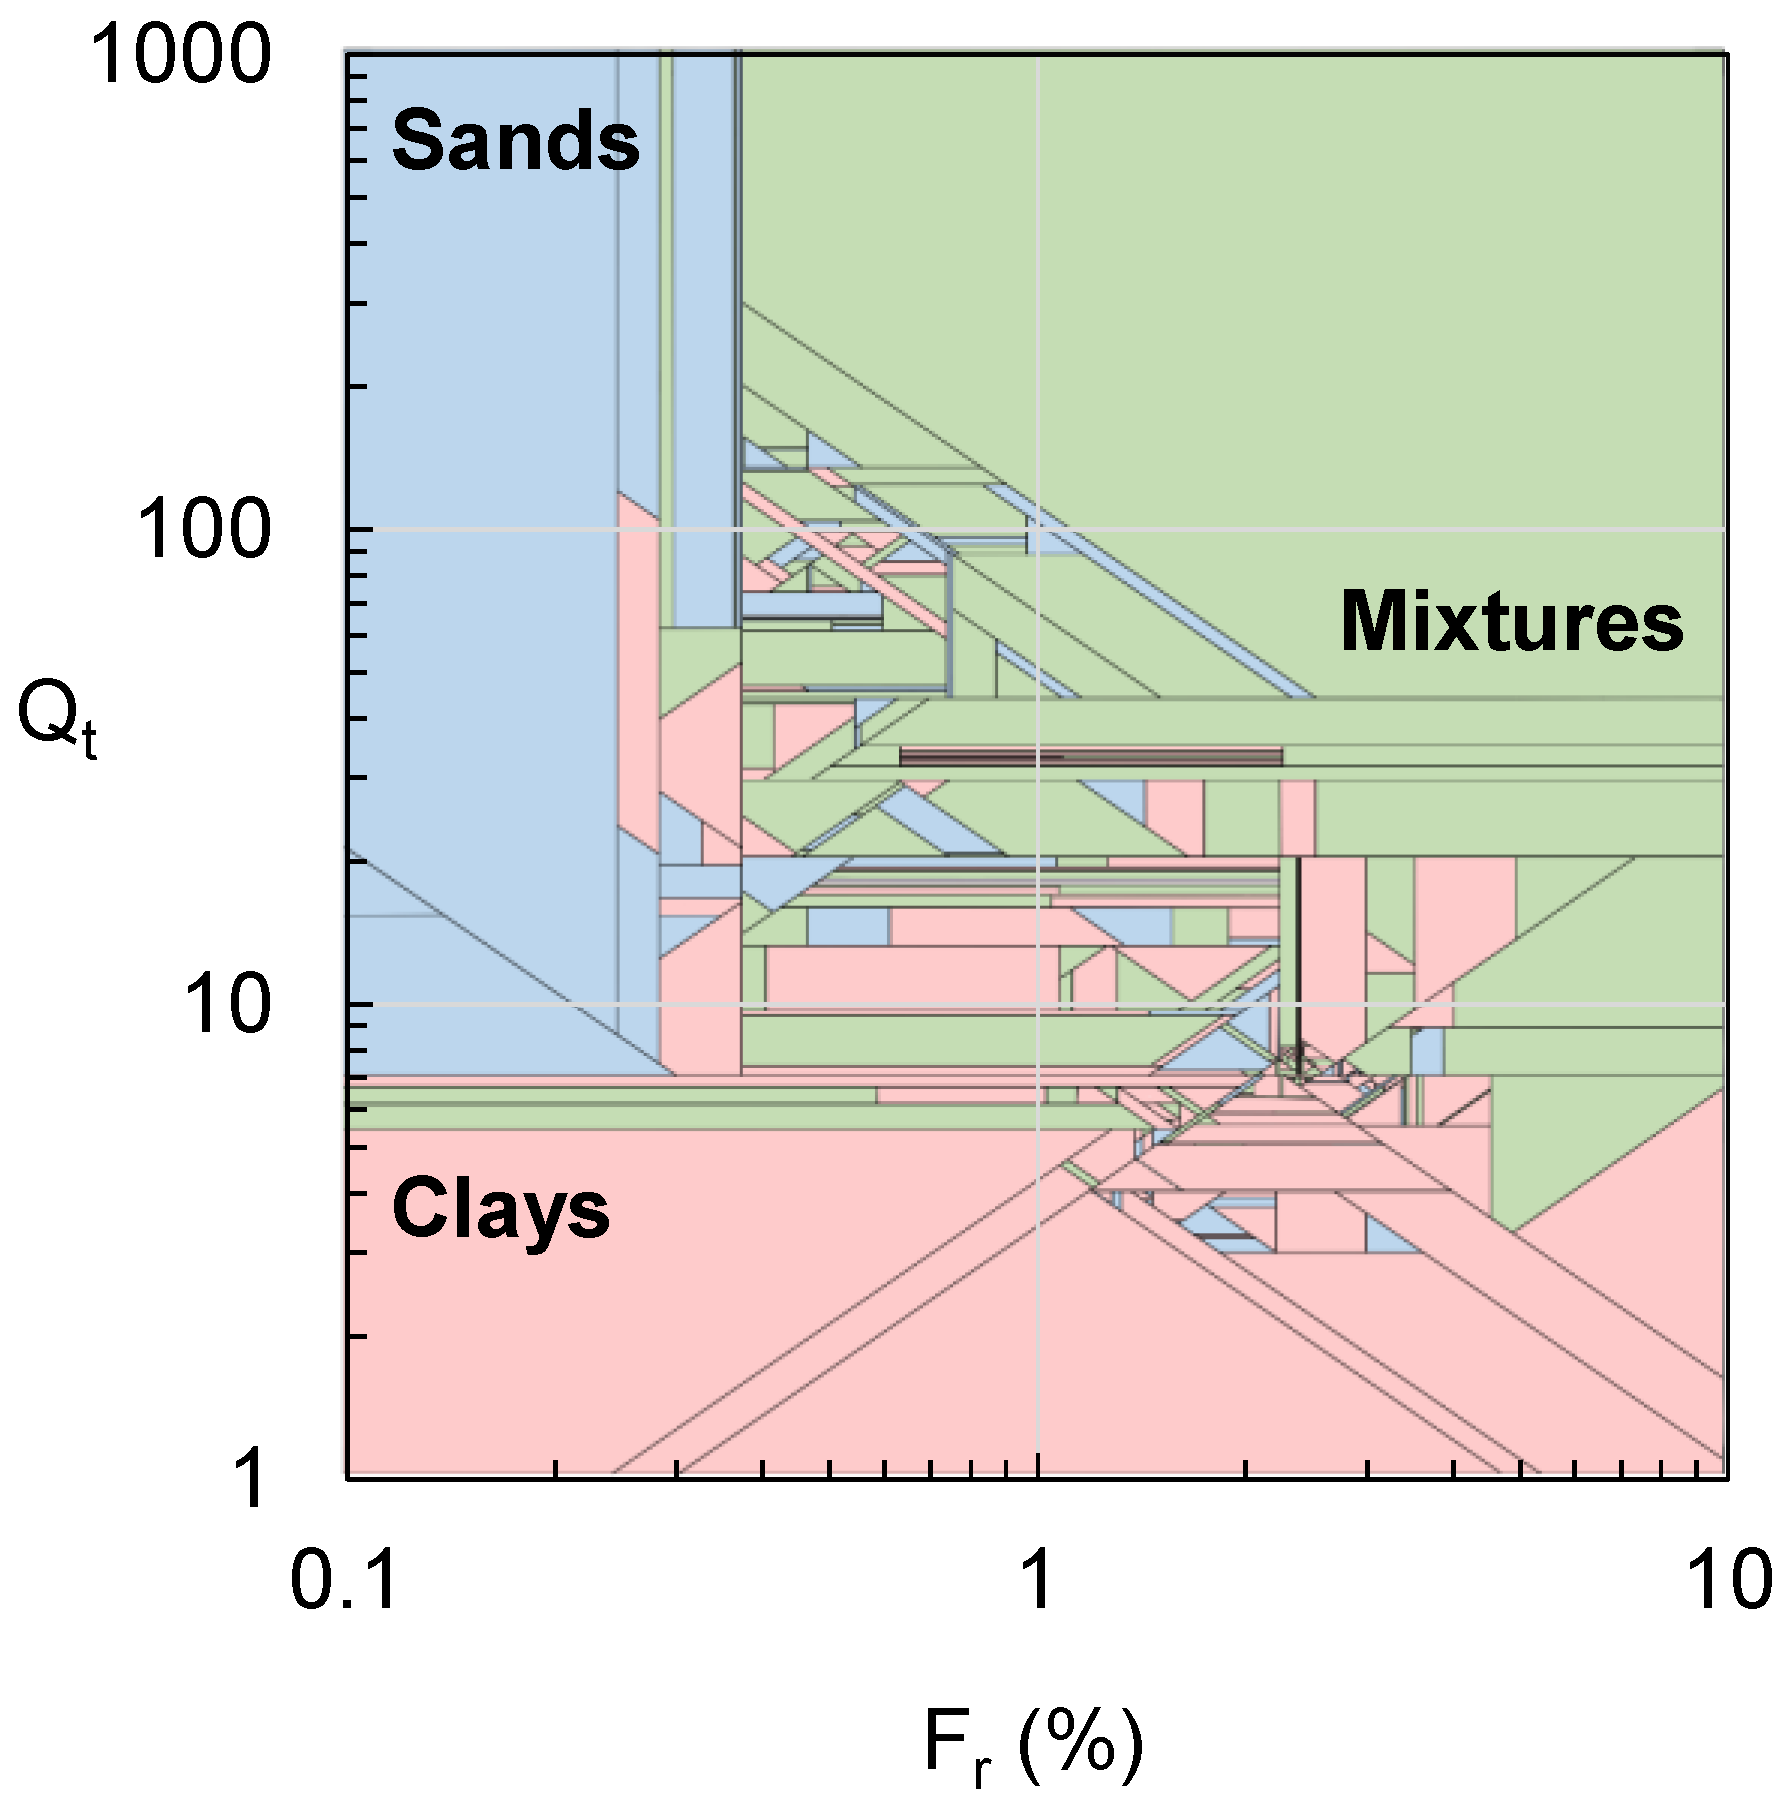
| C#3 | Qt, Fr |
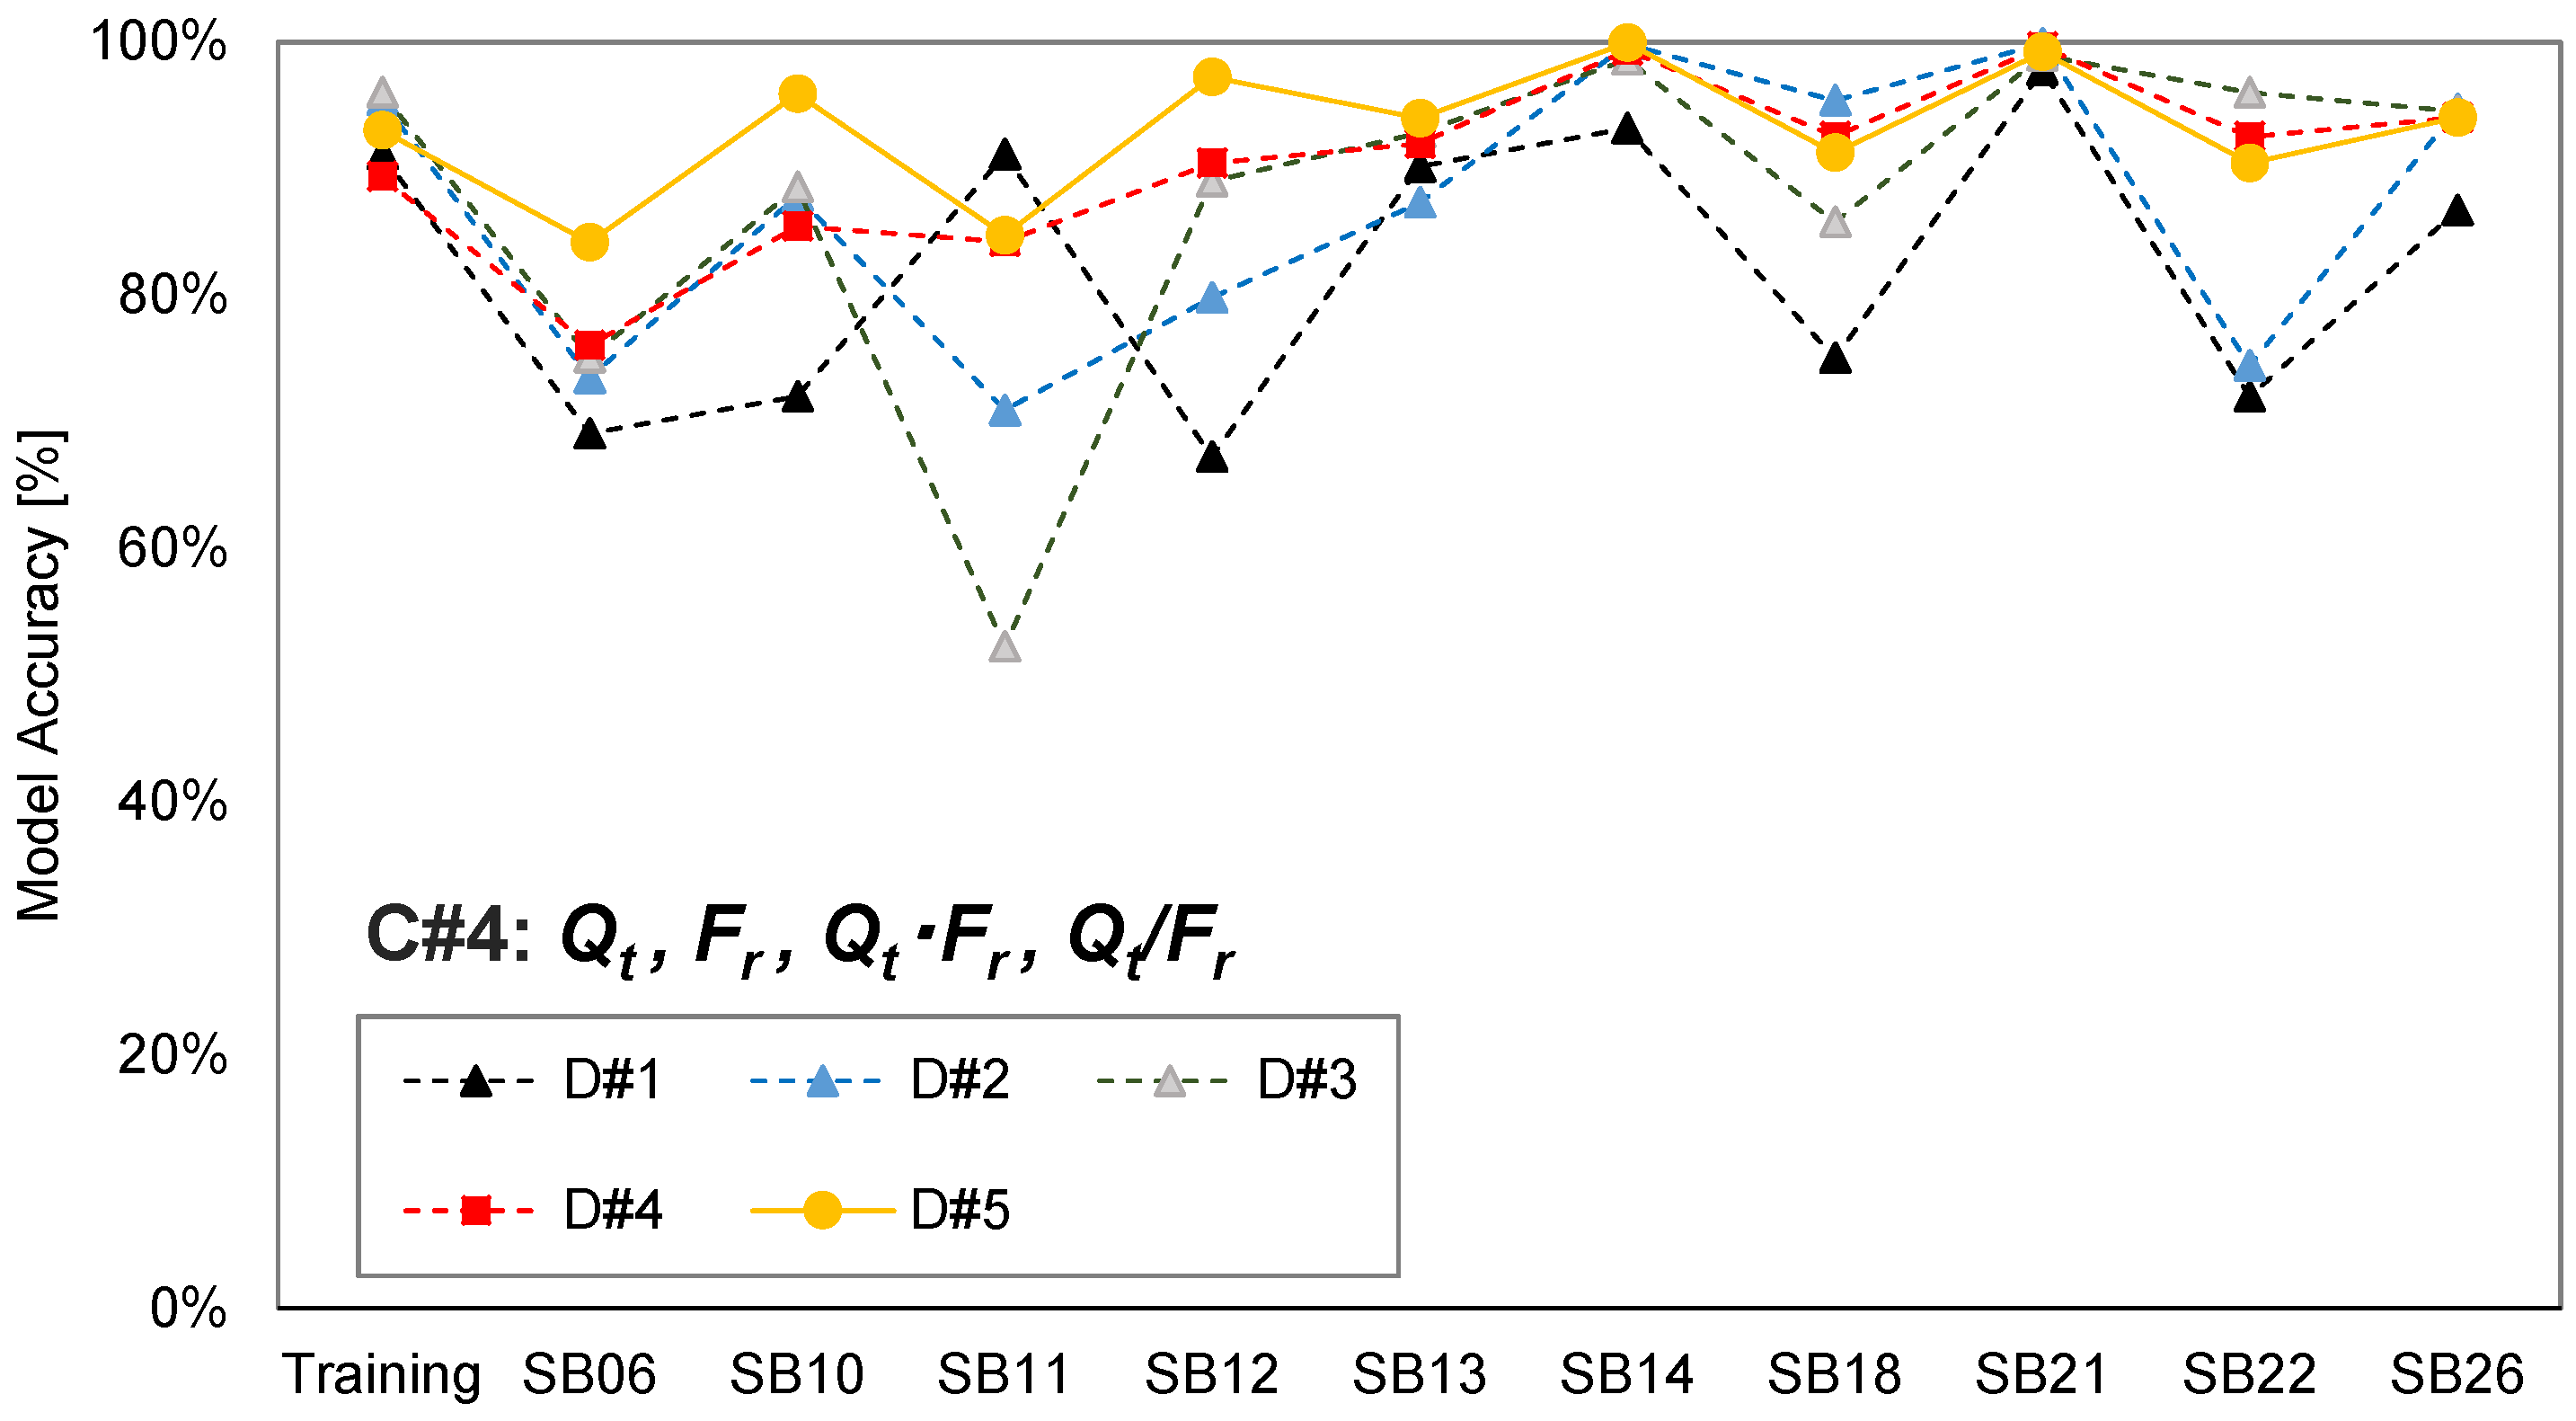
| C#4 | Qtn, Fr, Qt·Fr, Qt/Fr |
| Combination | Selected Training Data |
|---|---|
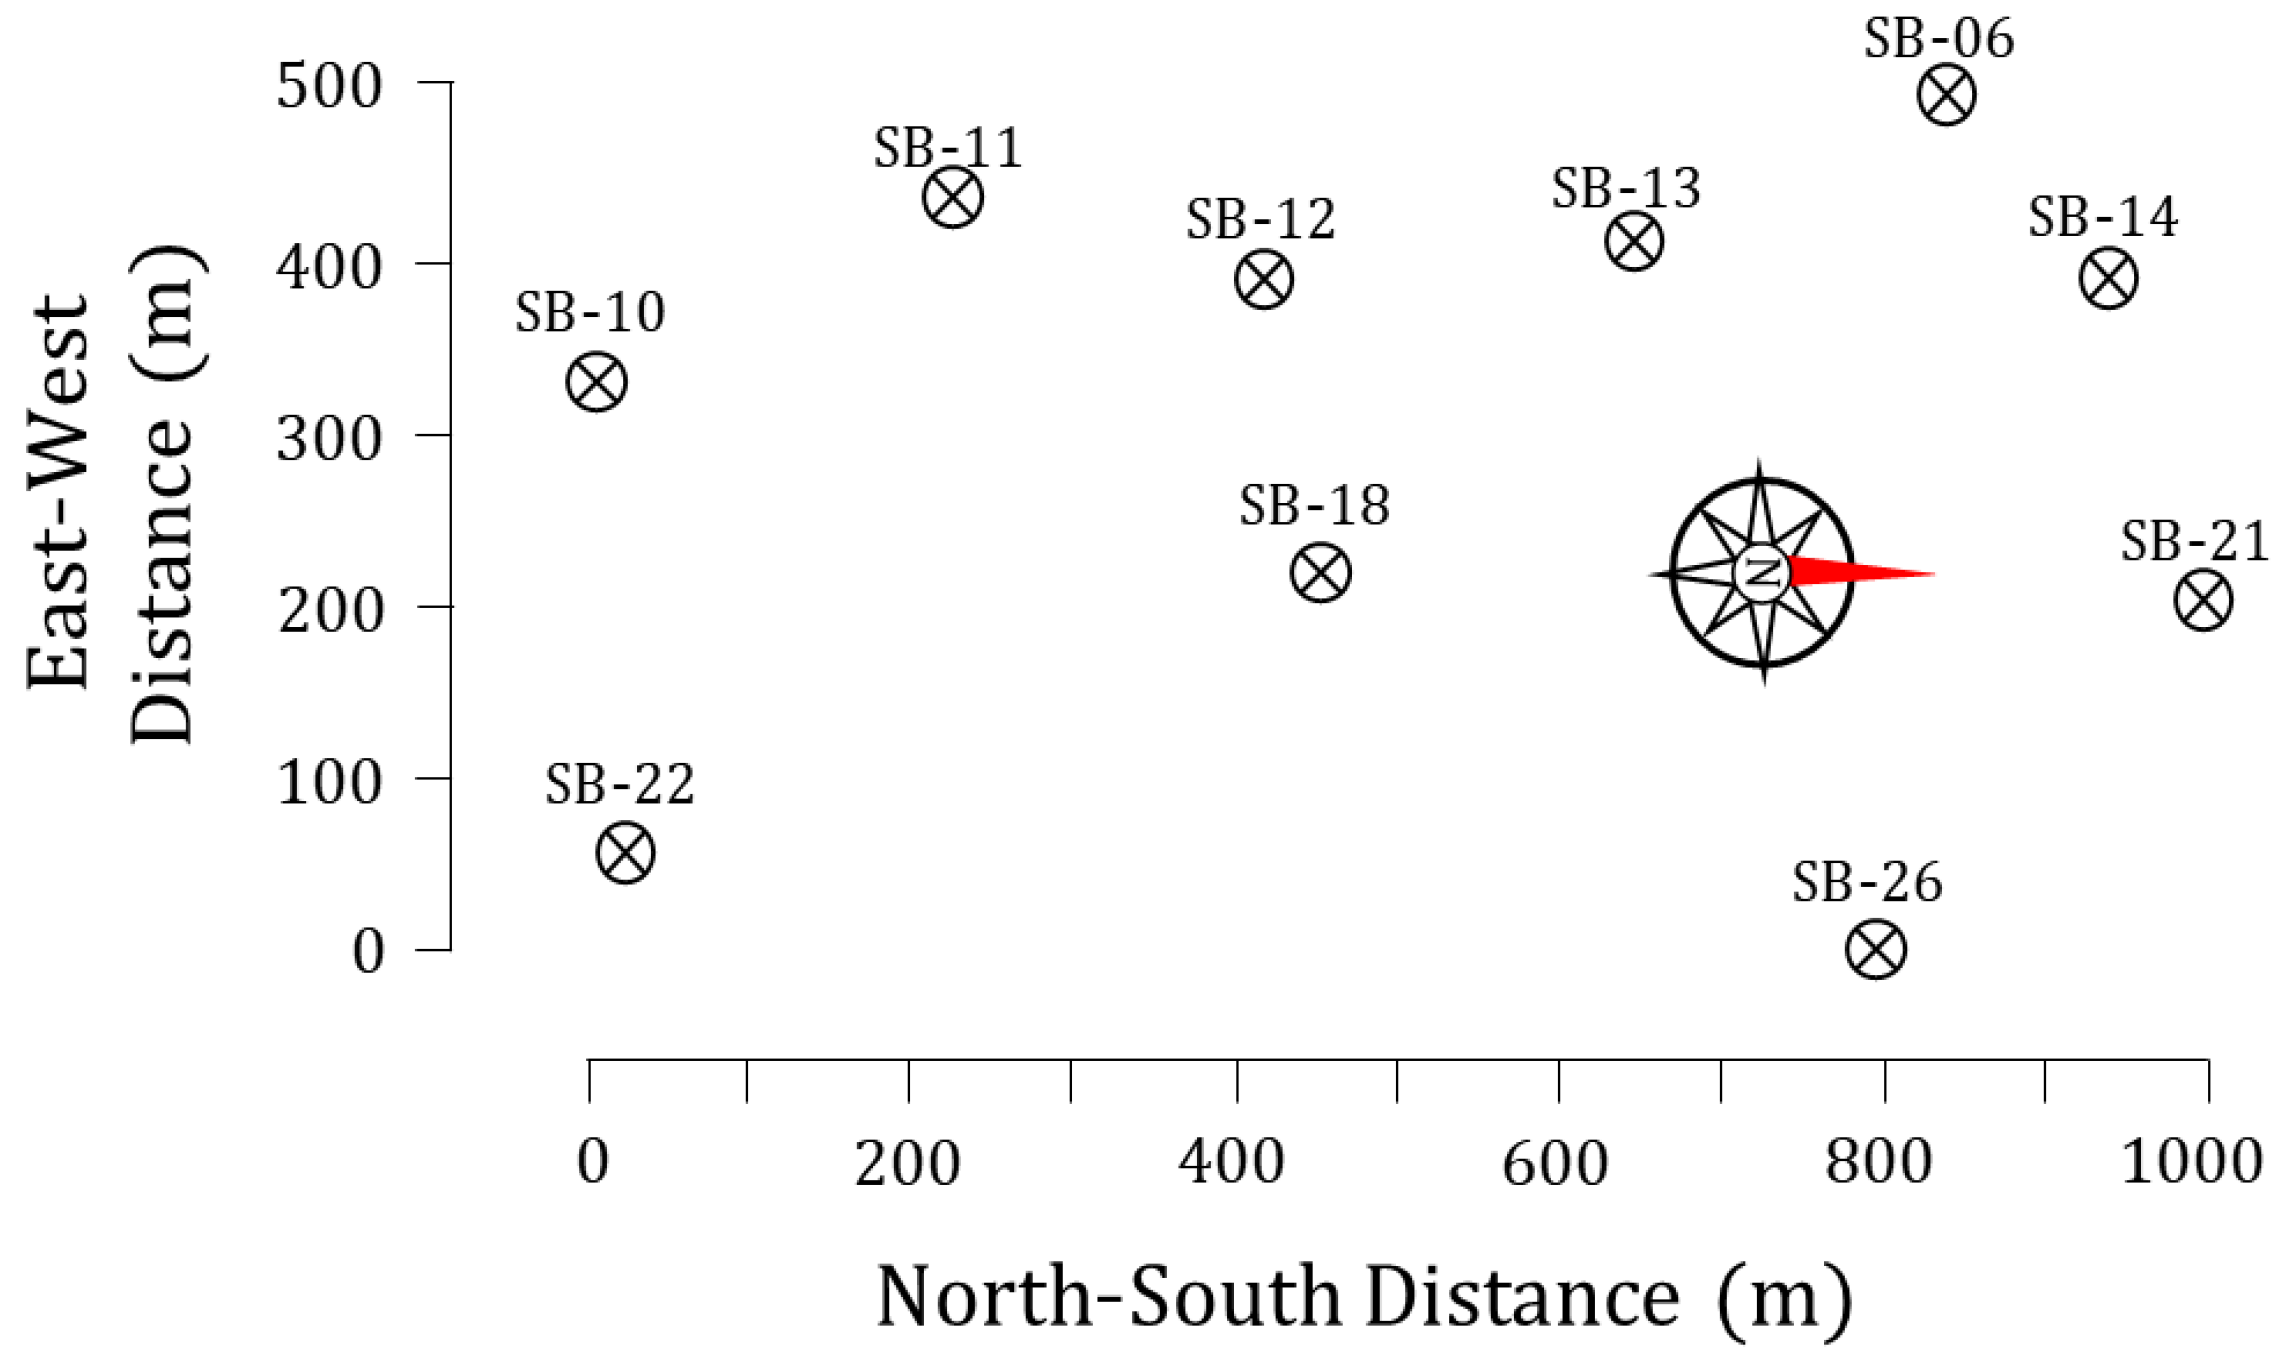
| D#1 | SB11 (1087, 297, 164) |
| D#2 | SB18 (1605, 70, 40) |
| D#3 | SB22 (555, 179, 41) |
| D#4 | SB11 and SB18 and SB22 (3247, 546, 245) |
| D#5 | All the measurements (10,314, 1411, 387) |
| C#1 | C#2 | C#3 | C#4 | |
|---|---|---|---|---|
| D#1 | 61.2% | 65.6% | 82.5% | 82.3% |
| D#2 | 86.7% | 90.4% | 87.1% | 87.2% |
| D#3 | 52.2% | 56.0% | 86.1% | 88.0% |
| D#4 | 83.1% | 90.3% | 89.9% | 90.5% |
| D#5 | 89.9% | 98.6% | 93.0% | 93.1% |
| Average | 75.5% | 81.4% | 87.7% | 88.2% |
| Soils | Clays | Mixtures | Sands | |
|---|---|---|---|---|
| total instances | 12,112 | 10,314 | 1411 | 387 |
| misclassified | 1129 | 357 | 591 | 181 |
| accuracy | 91% | 97% | 58% | 53% |
| Soils | Clays | Mixtures | Sands | |
|---|---|---|---|---|
| total instances | 12,112 | 10,314 | 1411 | 387 |
| misclassified | 1816 | 1237 | 125 | 62 |
| accuracy | 85% | 88% | 89% | 84% |
Disclaimer/Publisher’s Note: The statements, opinions and data contained in all publications are solely those of the individual author(s) and contributor(s) and not of MDPI and/or the editor(s). MDPI and/or the editor(s) disclaim responsibility for any injury to people or property resulting from any ideas, methods, instructions or products referred to in the content. |
© 2023 by the authors. Licensee MDPI, Basel, Switzerland. This article is an open access article distributed under the terms and conditions of the Creative Commons Attribution (CC BY) license (https://creativecommons.org/licenses/by/4.0/).
Share and Cite
Cho, S.; Kim, H.-S.; Kim, H. Locally Specified CPT Soil Classification Based on Machine Learning Techniques. Sustainability 2023, 15, 2914. https://doi.org/10.3390/su15042914
Cho S, Kim H-S, Kim H. Locally Specified CPT Soil Classification Based on Machine Learning Techniques. Sustainability. 2023; 15(4):2914. https://doi.org/10.3390/su15042914
Chicago/Turabian StyleCho, Sohyun, Han-Saem Kim, and Hyunki Kim. 2023. "Locally Specified CPT Soil Classification Based on Machine Learning Techniques" Sustainability 15, no. 4: 2914. https://doi.org/10.3390/su15042914
APA StyleCho, S., Kim, H.-S., & Kim, H. (2023). Locally Specified CPT Soil Classification Based on Machine Learning Techniques. Sustainability, 15(4), 2914. https://doi.org/10.3390/su15042914