1. Introduction
The strain on available water resources has increased during the past century. Nearly half of the global population, roughly 4 billion people, live in conditions of severe water stress for part of the year [
1]. In the United States, approximately 130 million people, particularly in western states, live in water-stressed conditions for at least 1–6 months out of the year [
2]. Rainwater harvesting (RWH), which includes concentrating, collecting, and storing rainwater in small schematic systems for domestic and agricultural use [
3], is a sustainable water resource that has been practiced for centuries to address water security in arid and semi-arid environments around the world [
4]. Apart from Tucson, Arizona, RWH has yet to be widely studied and implemented in much of the southwestern US, particularly in rural communities. There, RWH can be a viable and attainable solution to address water security issues in areas where connectivity to water mains is difficult due to large distances between homes and a lack of infrastructure [
5].
Rainwater harvesting requires minimal engineering and construction, low cost, and maintenance all while collecting water that can support outdoor purposes, particularly, irrigation for crop production. Studies have shown that it is feasible in arid and semi-arid climates and can improve rain-fed farming systems [
6] to help manage water demands, water scarcity, and food insecurity [
7], the last of which has been exacerbated by the COVID-19 pandemic.
The US Food and Drug Administration (FDA) determined that approximately 10.5% of Americans live in food-insecure households, which include low food security (6.6%) and very low food security (3.5%), where low food security refers to food insecurity without hunger, meaning that individuals face reduced food quality, variety, and desirability of diet, in comparison to very low food security where food insecurity is experienced with hunger, meaning individuals report disrupted eating patterns and reduced food intake [
8]. The 2000–2010 “Current Population Survey Food Security Supplement” reported that 25% of American Indians and Alaskan Natives remain food insecure compared to white Americans, highlighting the prevalence of food insecurity and the need to find ways to address food access and nutritional needs in tribal communities and rural areas. Access to healthy, beneficial, and cultural foods can lead to the strengthening of cultural identity and strengthen their relationship with their ancestral lands [
9].
This study aimed to assess the feasibility of rooftop RWH from four buildings on the Hualapai Indian Reservation in Peach Springs, Arizona, for food production. Specific questions posed in the study are as follows:
Do local climate patterns support the feasibility of RWH?
Are the existing rooftops on the four proposed buildings well-suited for rooftop RWH, and how much volume could be harvested?
How much land area can be cultivated solely using the harvested rainwater, and would a dry year still be sufficient to sustain the crops?
What is the estimated cost to implement this RWH project?
2. Materials and Methods
2.1. Study Area and Decription of Climate
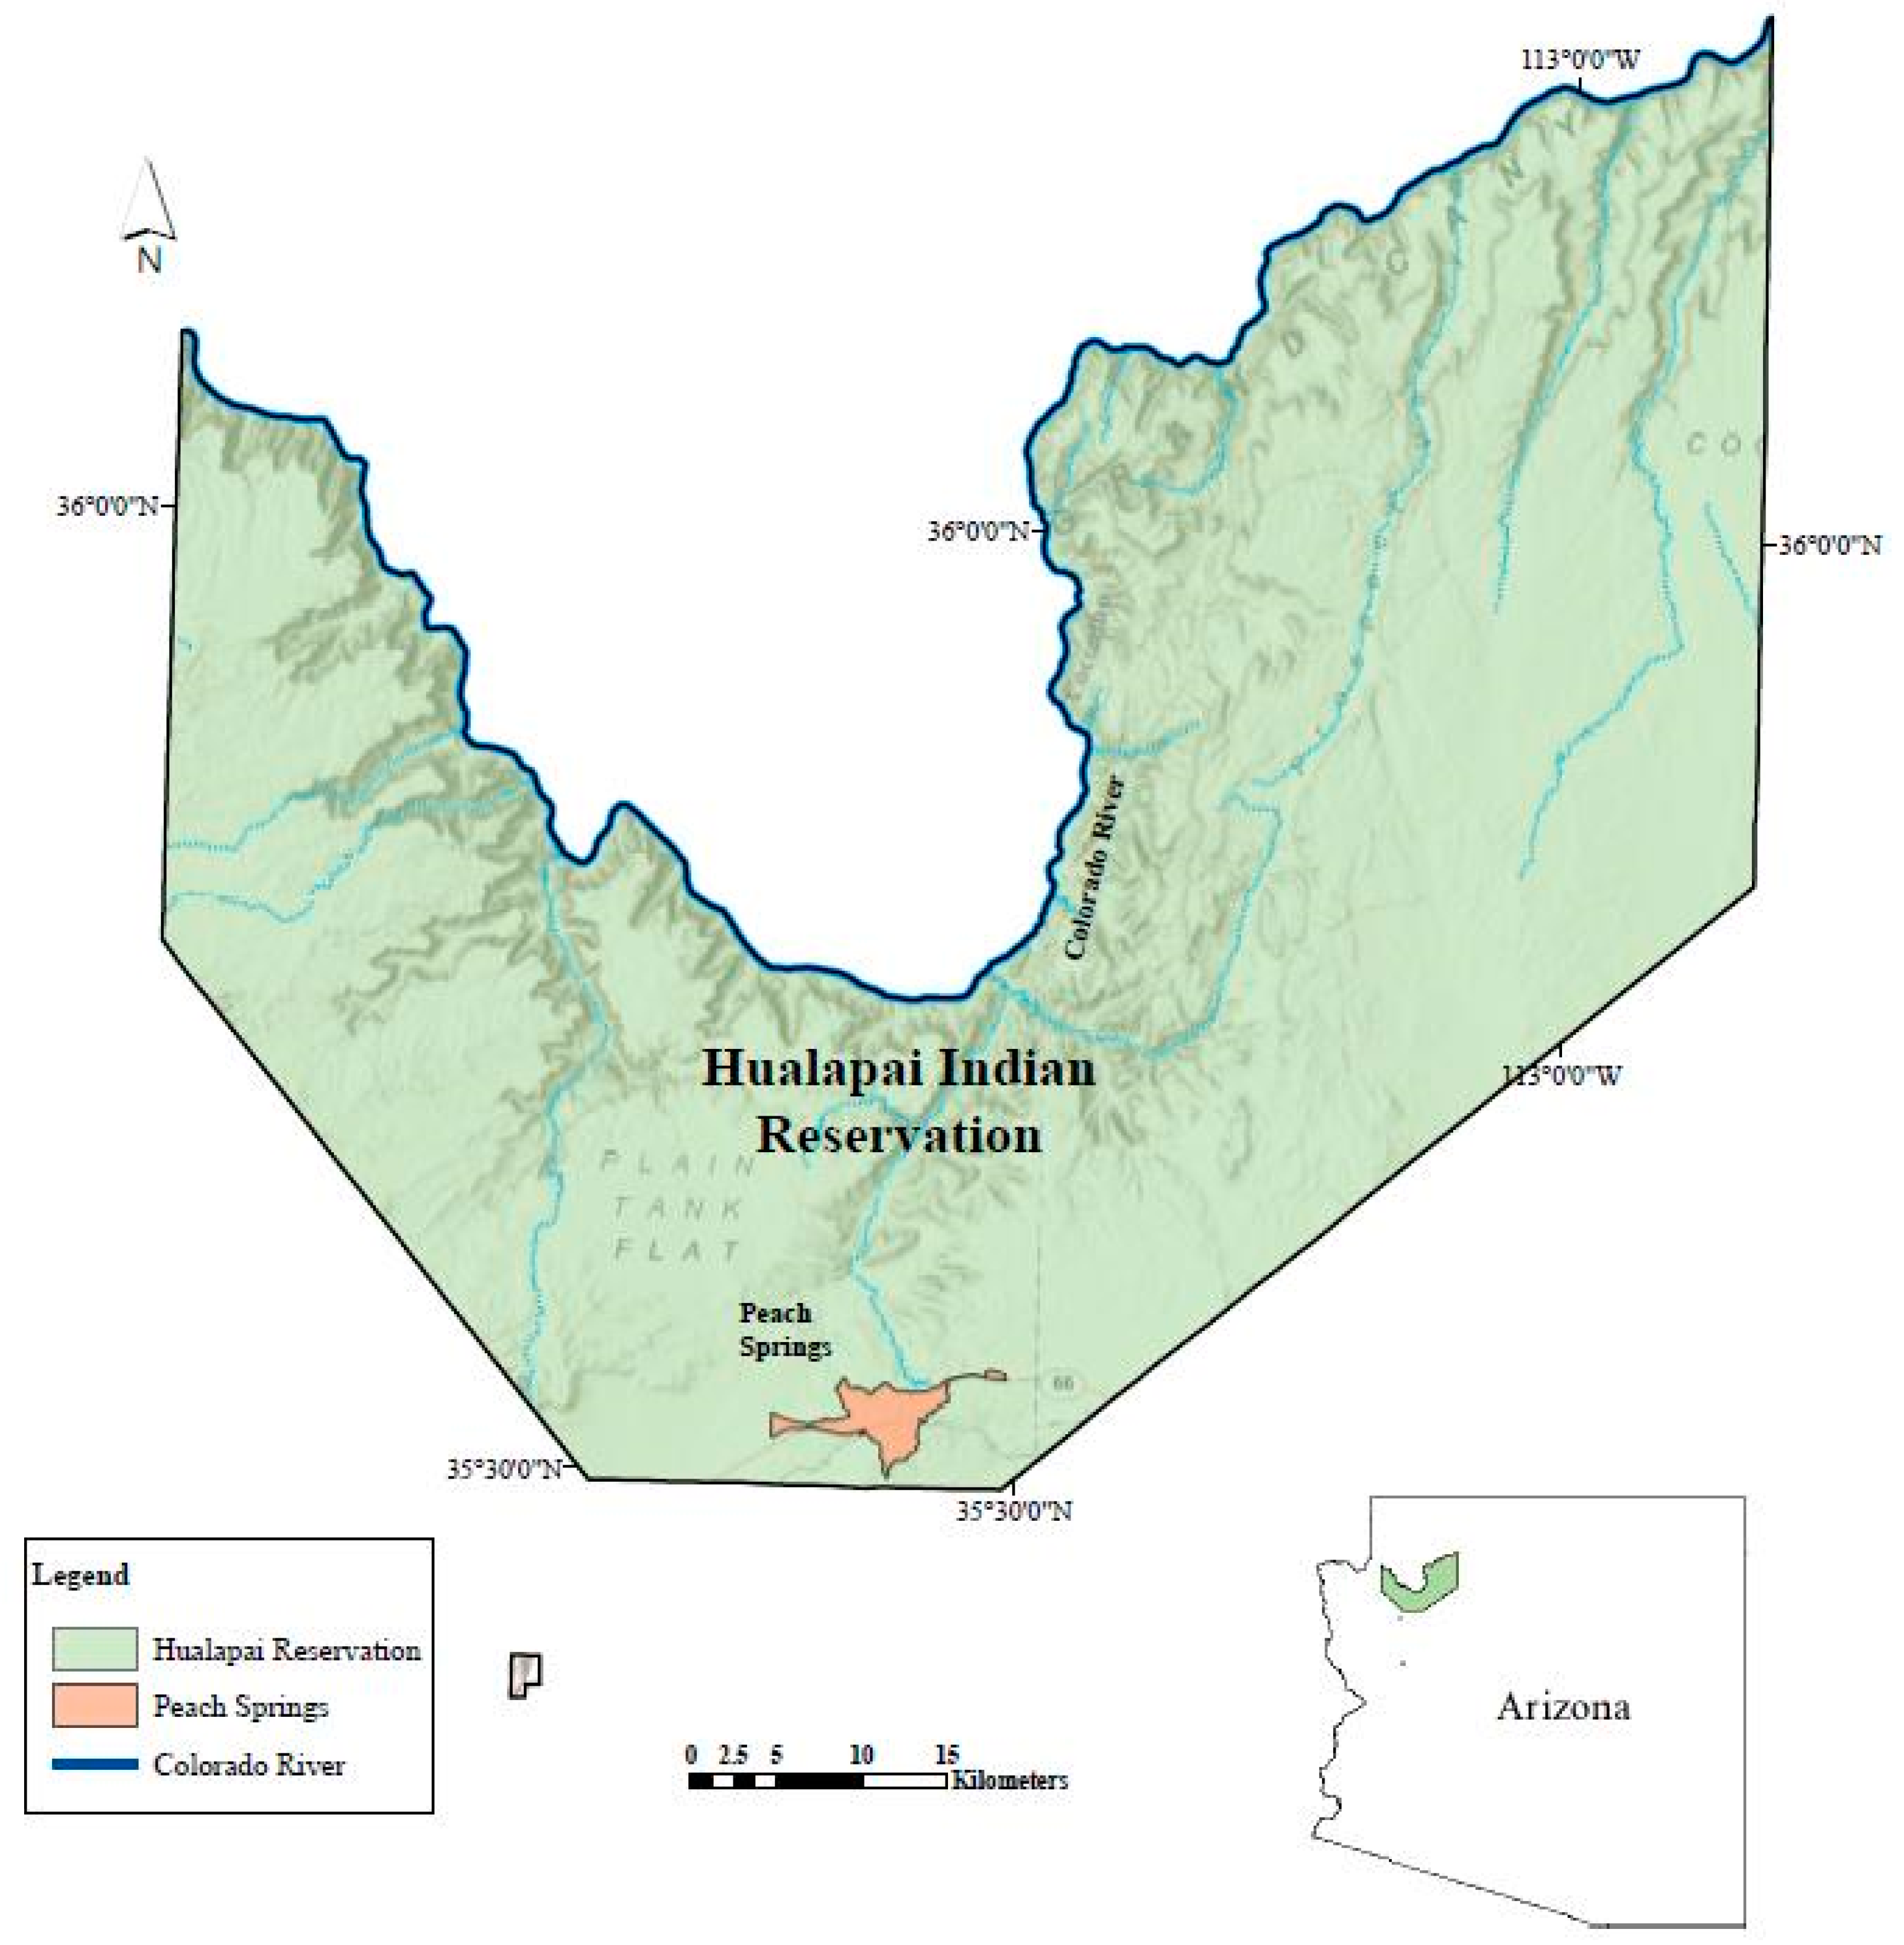
Peach Springs is about 80 km northeast of Kingman, AZ, (
Figure 1), at approximately 1457 m in elevation, and serves as the headquarters for the Hualapai Tribe. The town has an area of 20.5 km
2 and a population of 1500. Agriculture in the area mainly consists of cattle ranching and 4-H youth agricultural development programs through USDA’s Federally Recognized Tribal Extension Program (FRTEP) [
10].
The local climate is characterized as mild and arid [
11] with most of the precipitation on the reservation received during the monsoonal months of July and August and during the cooler months of December, January, and February.
2.2. Climatic Data
Observational temperature and rainfall data are available from the COOP network; however, these data are inconsistent over time and no measurements have been recorded since 2007. Therefore, both monthly and annual precipitation and temperature data from 1980 to 2020 were downloaded from the PRISM Climate Group at a 4 km resolution [
12]. Data were validated by comparing them to the existing observational dataset for Peach Springs, AZ. The PRISM climate group extrapolates from existing observations to render statistically sound spatial climatic datasets [
12]. Mean temperatures are 23 °C in the summer and 6 °C during the winter according to the PRISM climate normals from 1990–2020 (see
Figure 2). Normals are the baseline datasets that present the average monthly and annual meteorological conditions within a 30-year span.
Additionally, the reservation experiences frequent episodes of droughts that can last several years followed by shorter periods of above-normal to extreme wet weather conditions [
13]. Currently, the reservation, along with much of the southwestern US, is experiencing a long-term drought, referred to as a megadrought, which began in the late 1990s and early 2000s [
14].
The North American Monsoon (NAM), also known as the Southwest monsoon, Arizona monsoon, or the Mexican monsoon, brings an abundance of rain to northwest Mexico and the southwestern US every summer [
15,
16]. The NAM starts in western Mexico in the month of June and makes its way to the southwestern US by July, lasting as late as mid-September. The NAM is a result of various convective thunderstorms that form from surface land heating and moisture [
17]. Many variables influence the creation and intensity of the monsoon. As a result, summer precipitation patterns vary widely from year to year, which is associated with the conditions of the Pacific Decadal Oscillation and the El Nino Southern Oscillation (ENSO) [
18]. However, these summer storms can help sustain food production during the growing season through rainwater harvesting.
2.3. Field Methods
Field observations were conducted in August 2021 in Peach Springs under the guidance of the Hualapai Tribe’s Federally Recognized Tribal Extension Program (FRTEP) agent. Measurements of the 4H building, the greenhouse, the toolshed, and the tractor shed were taken with a handheld measuring tape. Additionally, a survey of the crops in the community garden was taken, which included the type of crops, the time of sowing, the time of harvesting, and the soil characteristics. Lastly, an inventory was taken of the existing material that has the potential to be used for RWH to help determine a cost budget.
2.4. Chracterizing the Climate: Dry, Normal, Wet Years
R software was used to calculate the mean annual precipitation, standard deviation, and coefficient of variation and perform a decomposition time series analysis of PRISM climate data. A locally weighted scatterplot smoothing (LOWESS) was used to discern the direction of both the precipitation and temperature trends. It allows for the averages to be calculated based on the surrounding value as opposed to the moving average that is influenced by outliers [
19] The coefficient of variation (CV) is a measure of variability relative to the mean of the dataset and calculated as:
where CV is the coefficient of variation,
Sd is the standard deviation of monthly precipitation (mm), and
Va is the mean of monthly precipitation (mm). Interannual CV was also calculated for the years from 1980 to 2020.
The CV and standard deviation indicated low-to-moderate inter-annual variability, so a metric was needed to classify a normal, dry, and wet year to evaluate the difference and potential effect on RWH. The Indian Meteorological Department’s classifications were employed: a dry year as total annual precipitation less than 20% of the long-term average; a normal year between ±20% of the long-term average; and a wet year as greater than 20% of the long-term average [
20,
21].
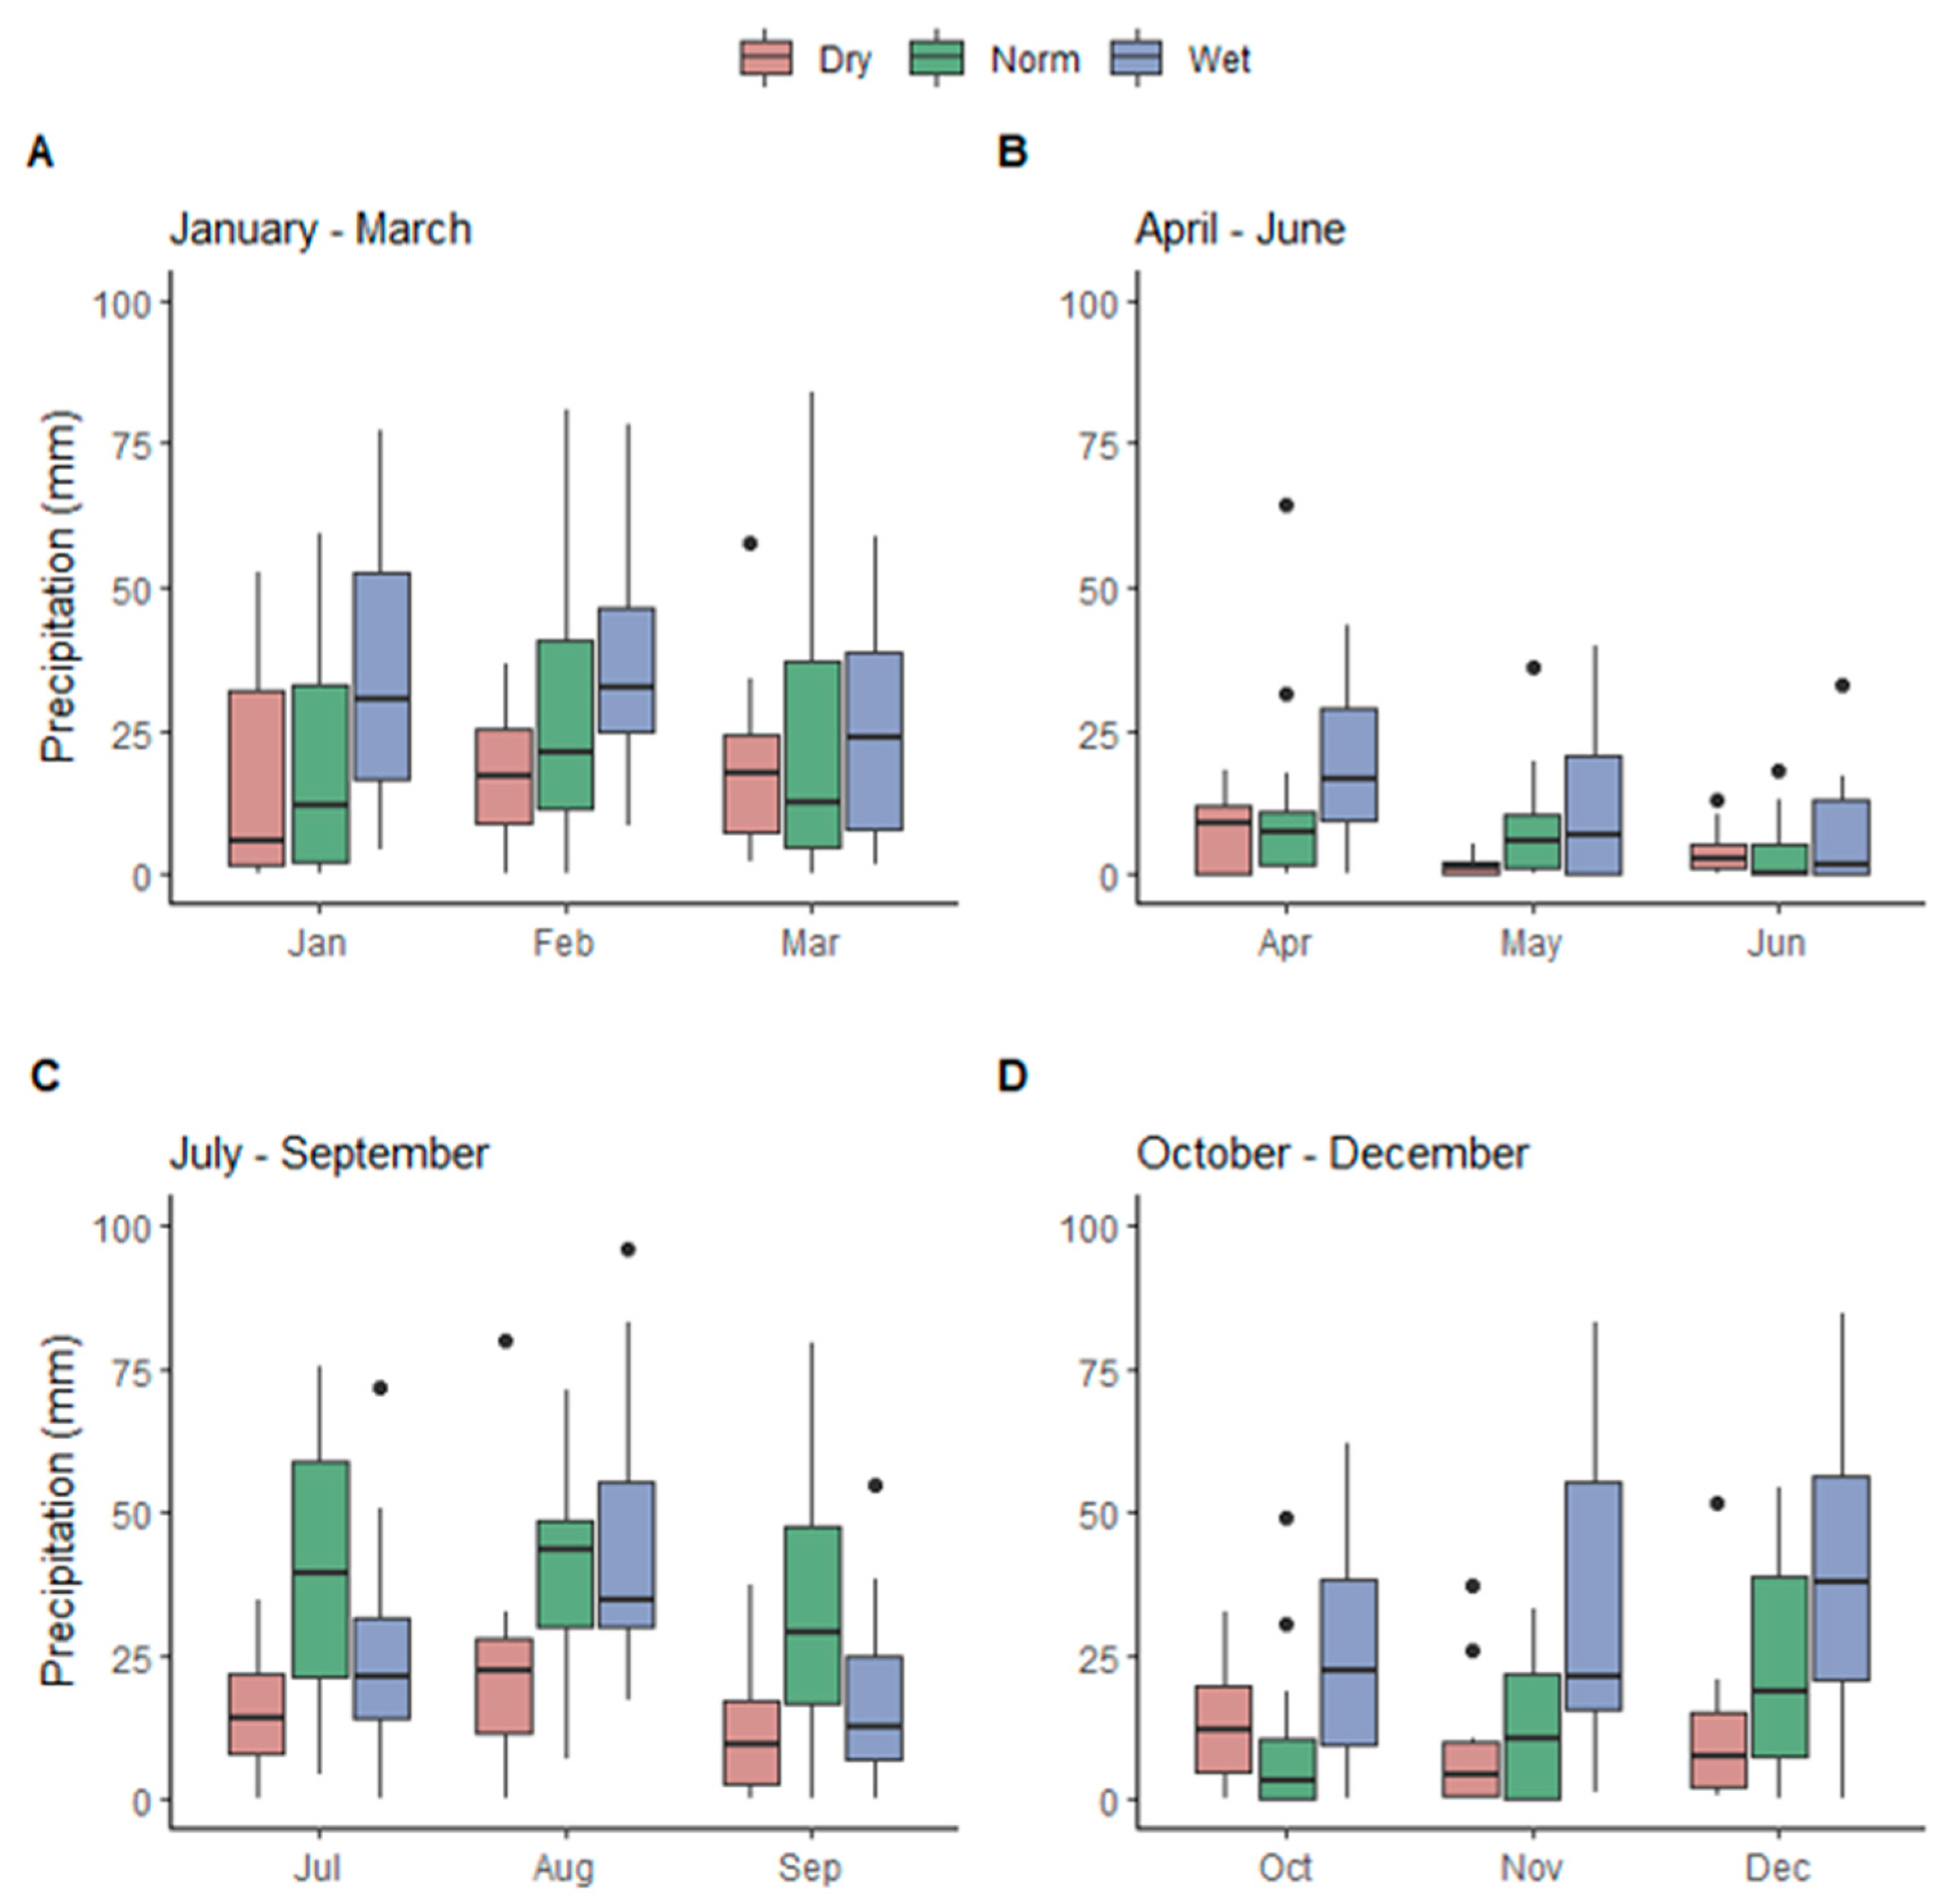
Boxplots were employed to show the variation in precipitation totals across the three scenarios stated above. The boxplots are useful in comparing the variation among the three classified precipitation years: normal, dry, and wet years. The boxplots allow for the display of the median and the variation and skewness of the data, as well displaying the presence of outliers within the dataset.
2.5. Rainwater Harvesting Equation
The volume of water that could be captured from the rooftop of the four buildings was determined by modifying the equation from Aladenola et al., which was adapted from Ghisi et al. [
22,
23], as follows:
where V is the volume of rainfall that can be harvested (m
3),
Rd is the rainfall depth (mm),
Ar is the rooftop area (m
2) of the given buildings (see
Table 1), and
Rc is the runoff coefficient determined by the rooftop material of said buildings [
24].
2.6. AquaCrop Model
The AquaCrop model was used to run “projects” that determine the net irrigation required for the dry yield of maize, potatoes, tomatoes, and sunflowers. These crops were noted in the survey of the Hualapai Community Garden. The growing season usually runs from April to September, with some cold-tolerant plants sowed in April and warmer plants sowed in May—for the purpose of this study, the growing season will be referred to as the months of April to September, while the planting period for each crop used in this simulation is from May to September. Each crop was evaluated for a dry, normal, or wet year, for a total of 12 projects. Monthly climate inputs were based on PRISM data.
The reference evapotranspiration (ETo) was calculated using the Food and Agriculture Organization’s (FAO) ETo Calculator—software developed to determine the reference evapotranspiration according to the FAO’s standards using the Penman–Monteith equation [
25]. The ETo Calculator has an extension option for the AquaCrop model, allowing the calculated ETo to be directly inputted into the desired project. Soil characteristics were inputted as fine sandy loam per observation and confirmed by the Natural Resources Conservation Service (NRCS) Soil Survey of Mohave County, Arizona [
26].
The ease of use of the AquaCrop model, minimal input parameters, and ample degree of simulation accuracy make the model a useful tool in determining the net irrigation and crop yield for this study. Further information about AquaCrop has been reported by others [
27,
28].
3. Results
The four buildings considered for RWH on the Hualapai Reservation are shown in
Figure 3. The roof materials, R
c, and individual roof area are summarized in
Table 1. The 4H building has the largest surface area and highest runoff coefficient, indicating that it is the most favorable of the four buildings for RWH. The three smaller buildings are located in close proximity; for ease, they are combined for consideration in the remainder of this study and referred to as “Community Garden buildings”.
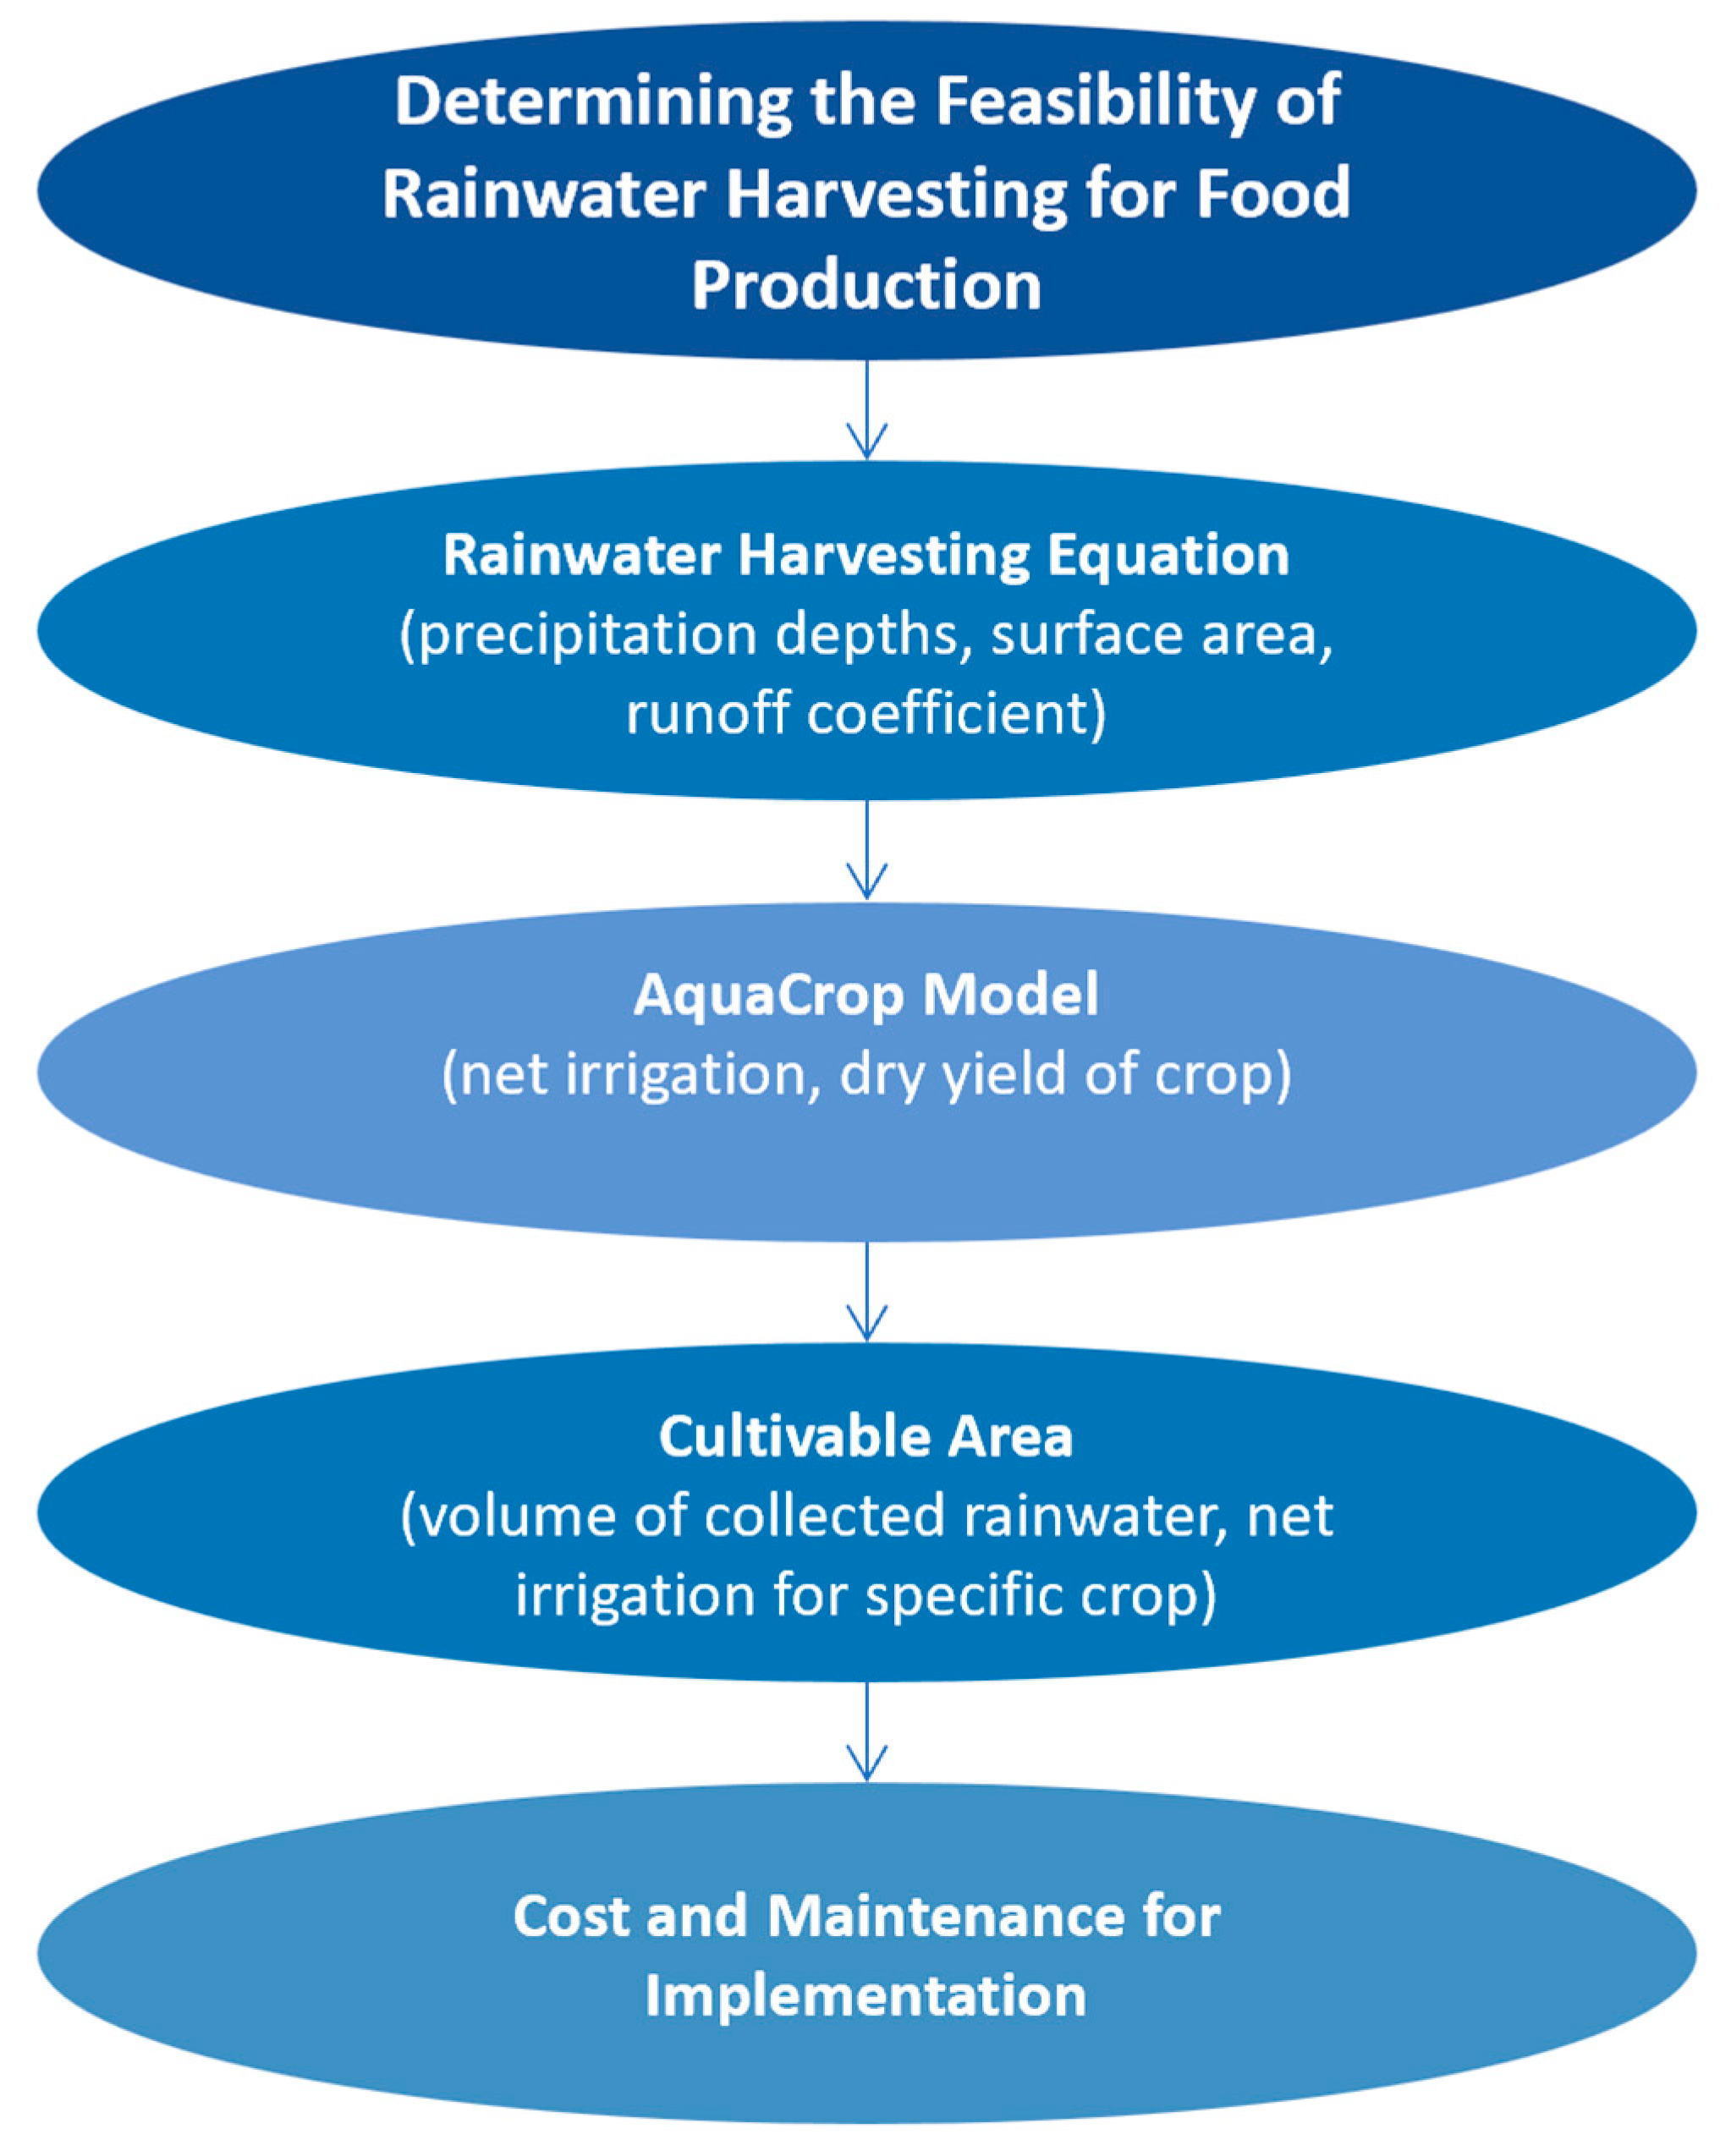
Figure 4 shows the methodology used in determining the feasibility of rainwater harvesting for food production.
3.1. Climate Characteristics
3.1.1. Precipitation and Temperature
Summary statistics of annual and monthly precipitation are listed in
Table 2. The high annual coefficient of variation or CV (0.32) suggests low-to-moderate inter-variability of precipitation between years within the 40-year dataset. Comparably, the CV for each individual month is higher suggesting that the intra-variability of precipitation is noticeably higher and less predictable for each month than in-between years. The month of June has the highest CV, which means that precipitation depths are more variable for that month. However, the months of July, August, and September have the lowest CV, suggesting that summer monsoonal rains are more consistent from year to year. The skewness represents the distribution of data about the mean. Positive values in the precipitation data indicate that the mean is greater than the median of the data. The positively skewed precipitation data also suggest that outliers in the data tend to be greater than the mean, indicating that there are more precipitation events with depths greater than the monthly average. This observation is important, since RWH requires enough precipitation for it to be feasible and cost-effective for food production.
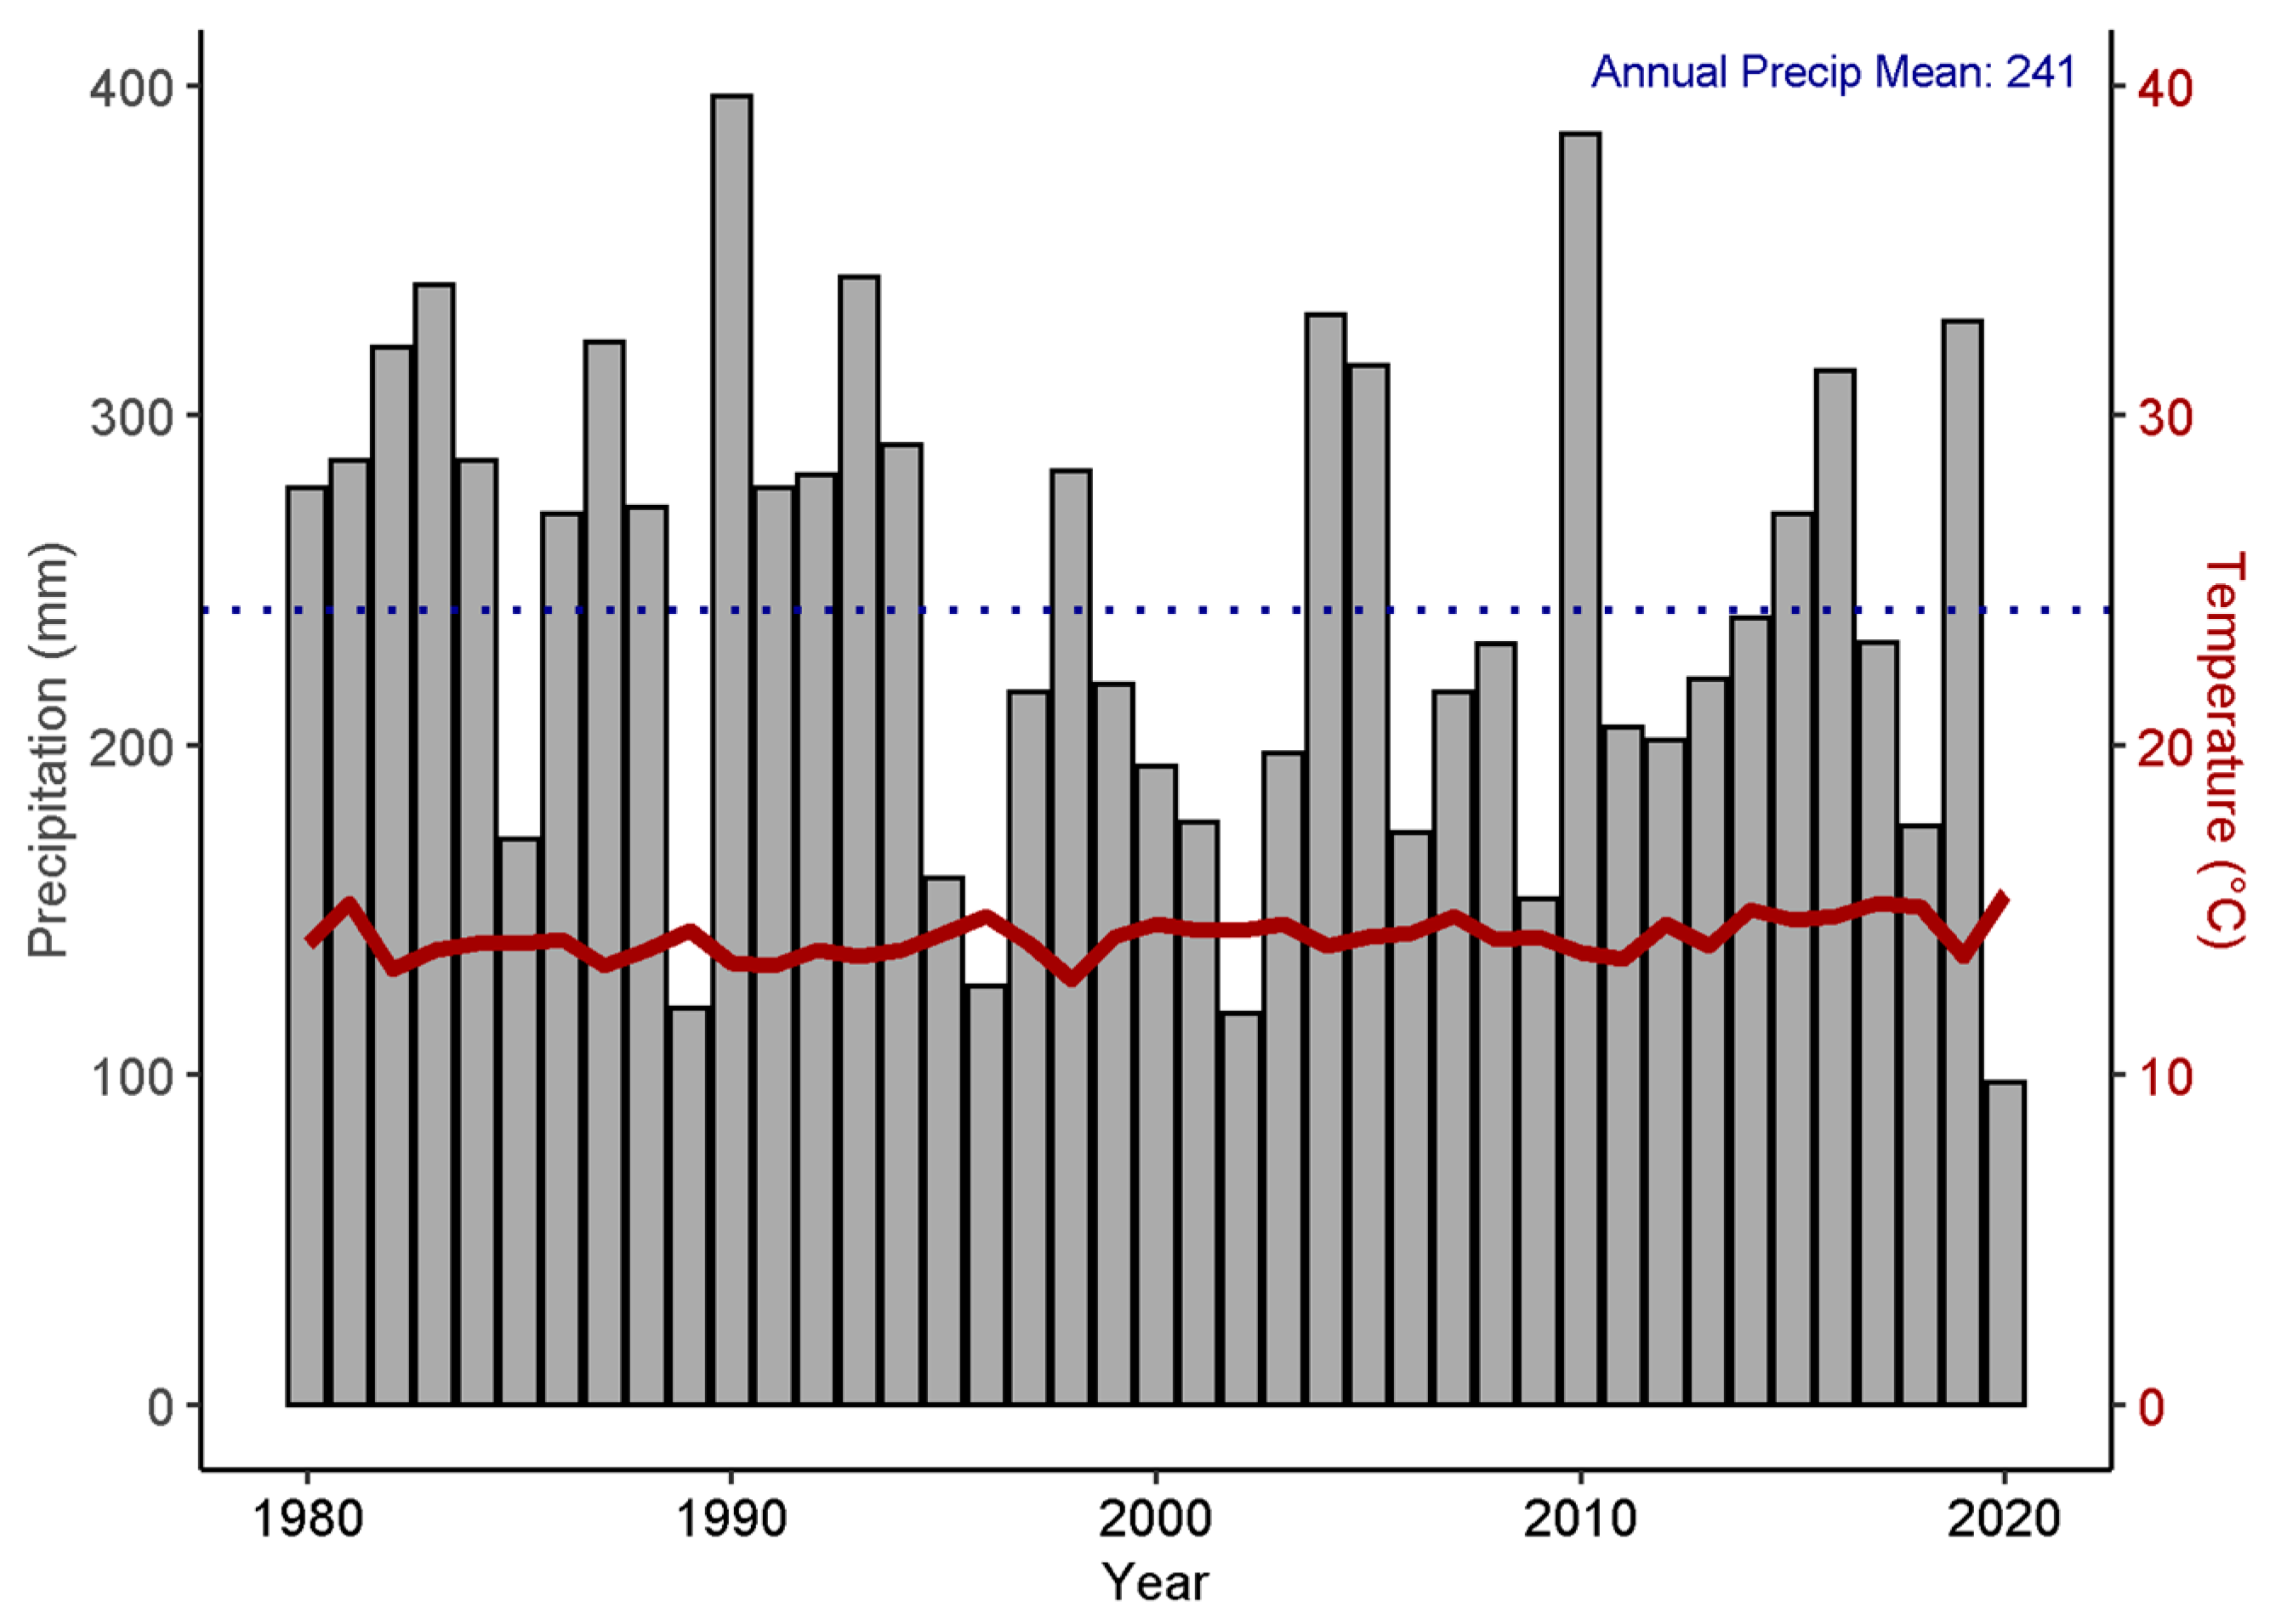
The locally weighted smoothing or LOWESS smoothing for precipitation is shown in
Figure 5a. The smoothing shows a general trend of the average monthly precipitation decreasing from 1980 until the late 2000s, with a minor increase in the early 2010s, followed by a gradual leveling off. Note that the LOWESS smoothing with a span of 2/3 smooths the series more aggressively than that with a 1/10th smoothing span to allow for a generalized view of the precipitation patterns. A decrease from 279 mm (reported in existing literature) to approximately 241 mm is noted. The decrease in average annual precipitation in Peach Springs, AZ, from 279 mm in the literature to 241 mm might be attributed to the spatial precipitation data that were used in this study due to their availability versus the observable precipitation data that were available at the end of the 20th century but discontinued in 2007. However, the decrease in monthly precipitation also coincides with the drought ongoing in the Southwest since the late 1990s. Though there are some peaks in precipitation in the mid-2000s and 2010s, there appears to be no sustained recovery to levels in the 1980s.
Figure 5b also depicts the 2020 monsoon, which was coined “the nonsoon” for its nonexistent precipitation during both the monsoon season and the winter months [
29].
The locally weighted smoothing for temperature from 1980 to 2020 is shown in
Figure 6. The high temperatures from 2000 to 2020 coincide with the ongoing drought in the Southwest, classified as the warmest and driest period on record, and 2020 was determined to be extremely arid [
14].
Figure 6a shows the high temperature and aridity observed in the study area. The data suggest an increase in the mean monthly temperature from ~13.5 °C to 15.0 °C during 1980 to 2020, as seen in
Figure 5b.
3.1.2. Classification of Normal, Dry, and Wet Precipitation Years
Table 3 shows summary statistics for the Indian Meteorological Department’s three classifications. Just over half the data fall into the normal classification, while the remaining are almost equally split between dry and wet years. The frequency of normal, wet, or dry years is important for planning purposes, i.e., a normal precipitation year occurs most commonly in the 40-year record (1980–2020).
Higher CVs during wet/dry years suggest that precipitation varies more from a wet-to-wet year and a dry-to-dry year than during normal precipitation years. With less variability and an increased frequency of normal precipitation years, the classification of the precipitation years is further solidified.
The median values (50th percentile) for August are slightly lower for the wet year than for the corresponding normal year, as seen with the centerline in the boxplot in
Figure 7. The data indicate that during a wet year, more rainfall is received during the combined winter months of December, January, and February than during the summer monsoon months of July, August, and September. A normal and dry year both receive most of the precipitation during the monsoon months of July, August, and September. Additionally, the months of July, August, and September show less variability in the precipitation depths from year to year in the dataset. This observation is significant since the collected rainwater would be used during the months of April–September.
Regardless, a wet year receives the greatest precipitation during both the winter and the summer months as compared to that in a normal and dry year. For each year, most precipitation occurs during the month of August for a normal and dry year, while a wet year receives the greatest precipitation amounts during February at an average of 52.1 mm. The lowest precipitation amounts occur during the month of May for a wet and dry year, while a normal year receives the least amount of precipitation during the month of June.
3.2. Rainwater Harvesting Potential
The monthly volumes of rainwater that can be collected from the 4H building during a classified normal, dry, and wet precipitation year are listed in
Table 4. An average of 29,285 L of rainwater can be collected from the 4H building during the growing season, with a total of up to 60,860 L for the normal precipitation year. The monthly amounts of rainfall that can be harvested from the Community Garden buildings are listed in
Table 5. Approximately 6810 L of rain can be collected during the growing season with a total of 14,160 L for a normal precipitation year.
3.3. AquaCrop Results and Cultivable Area
The AquaCrop model was run for each of the four crops for each classified precipitation years, normal, dry, and wet, for a total of 12 projects. The crops used in the simulation include maize, tomatoes, dry beans, and sunflowers. The month of April was considered for the rainwater harvesting and a part of the growing season, but not the planting period, since all the simulated crops are sown in May. Simulated ETo, rainfall, and net irrigation and the area that can be cultivated using the harvested rainfall for the 4H and Community Garden buildings are listed in
Table 6. Net irrigation considers the rainfall during the planting period of May–September and determines the existing required irrigation for a healthy crop.
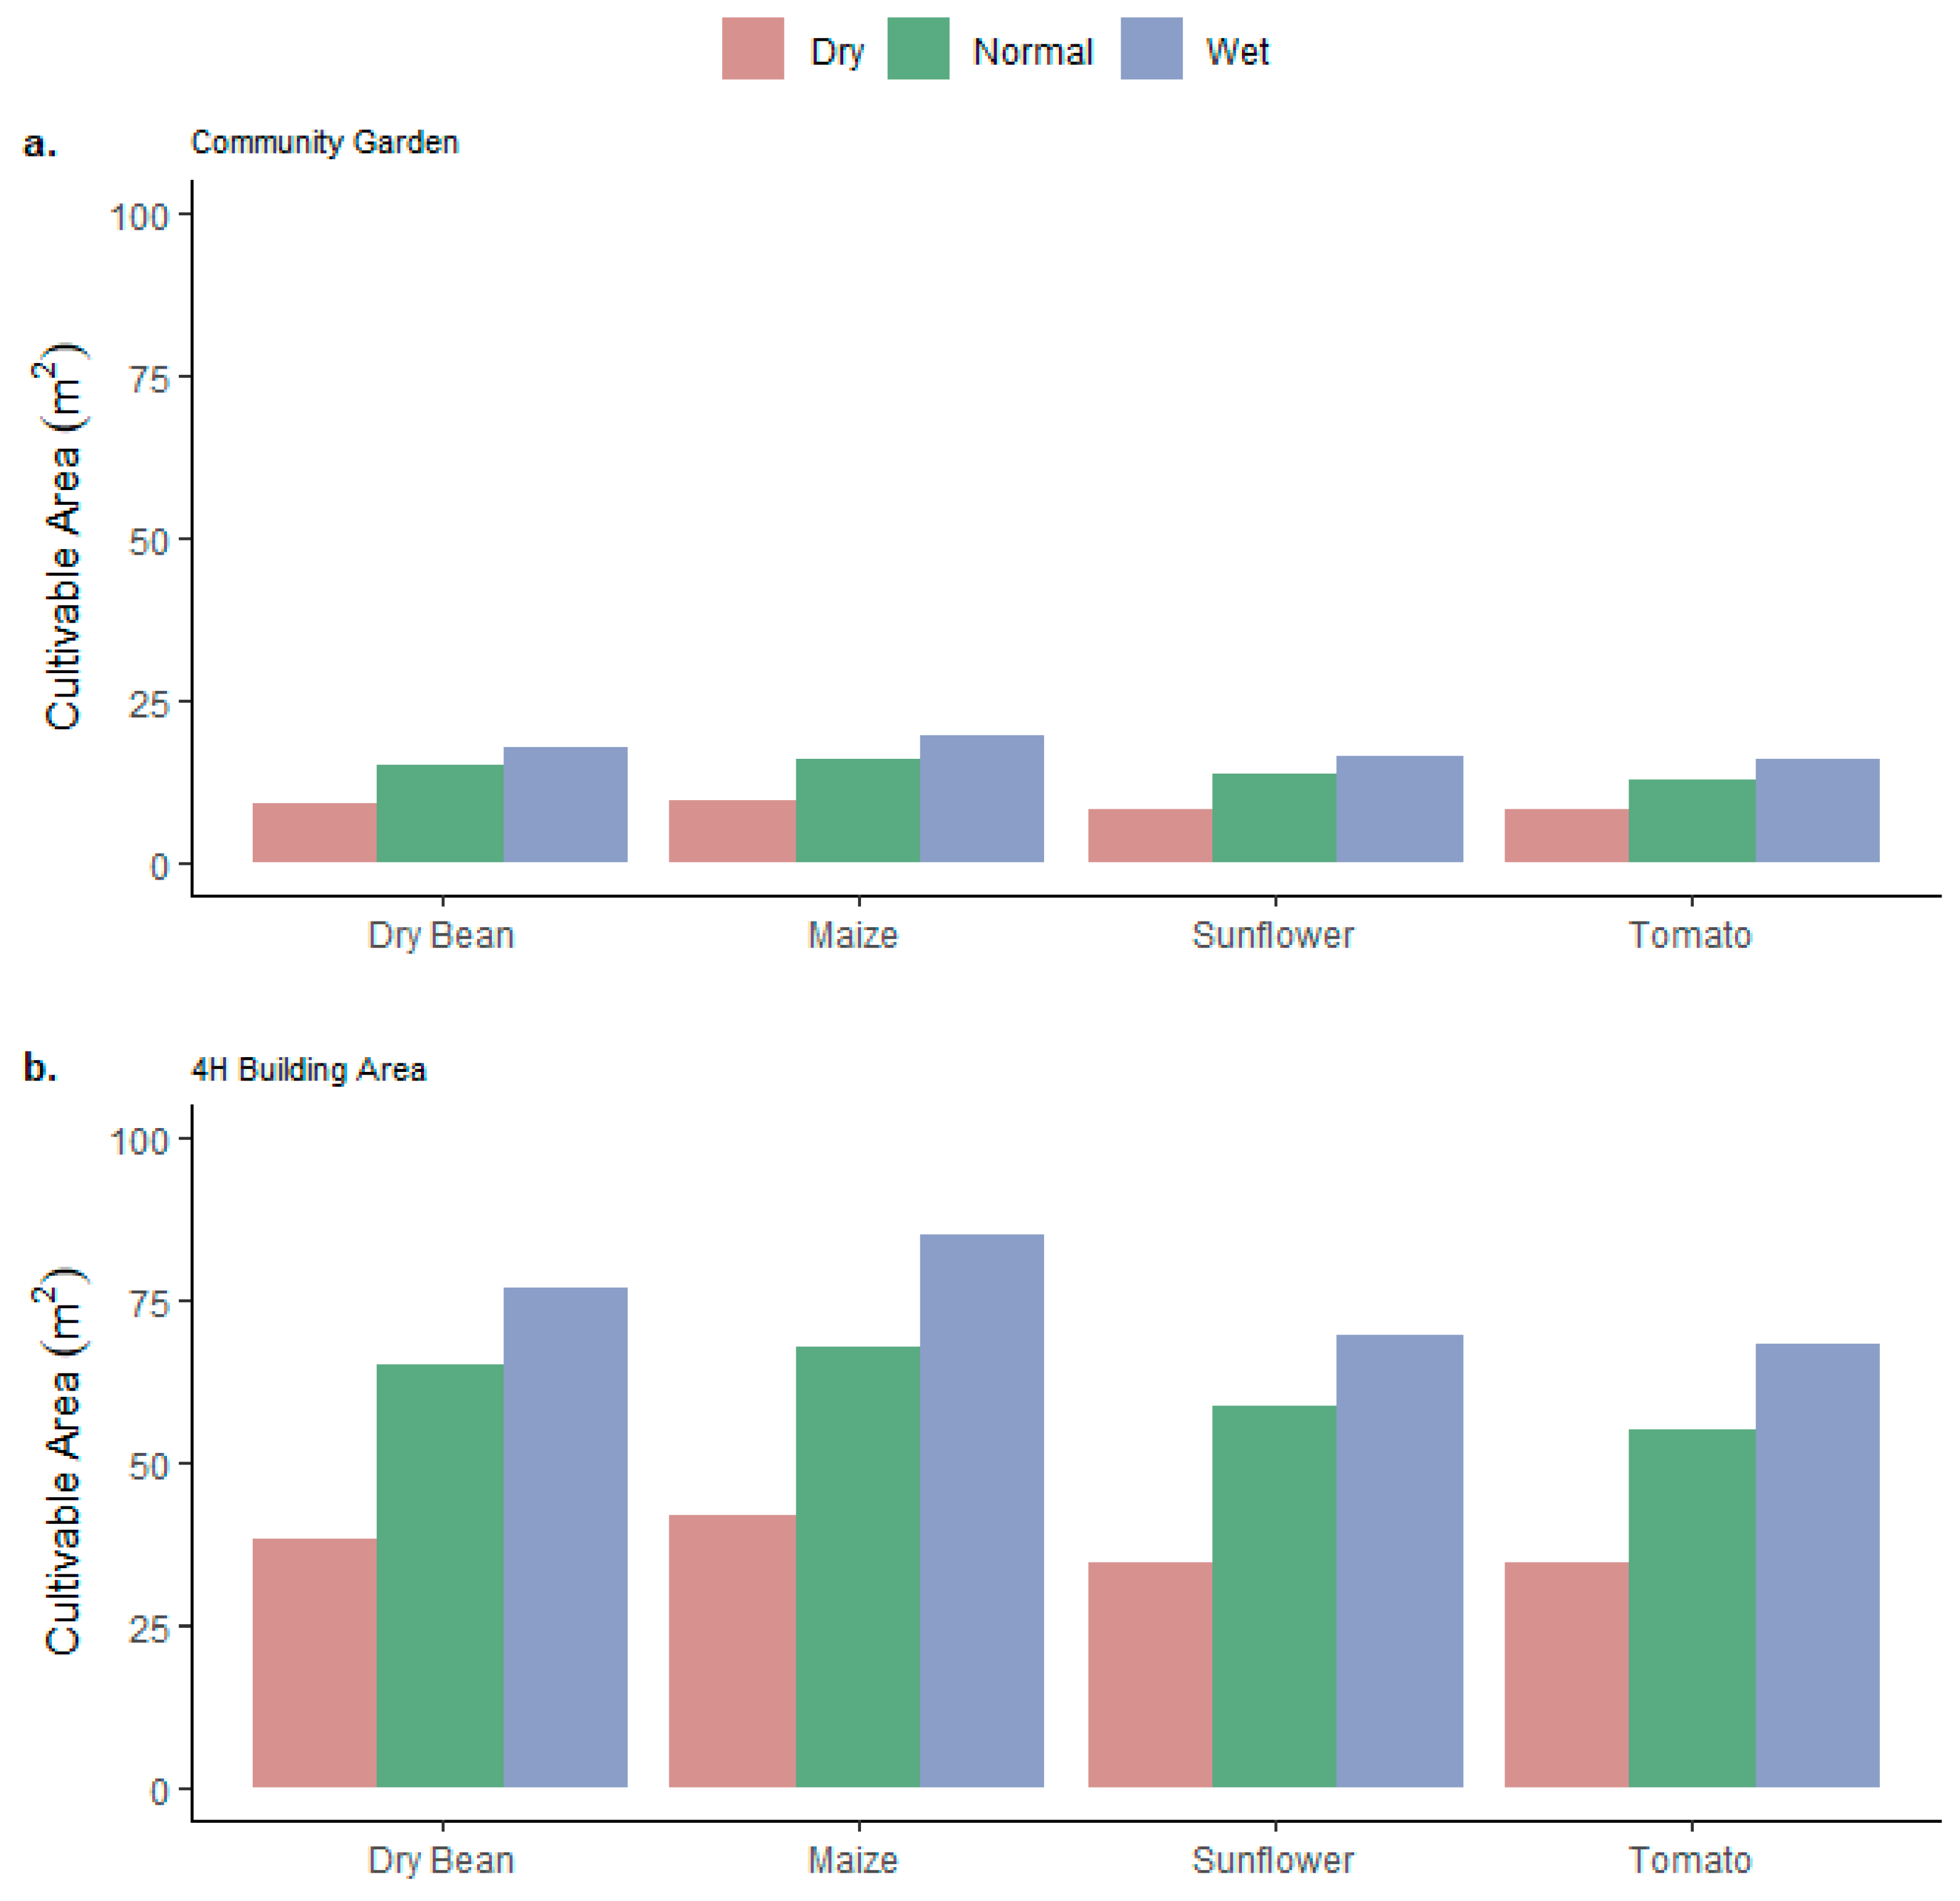
As expected, a dry year requires more RWH irrigation for each crop than a normal or wet year, since less rainfed irrigation is available. Rainfed irrigation is the direct precipitation falling onto crops. In addition, as expected, more area can be cultivated during a wet year using RWH in addition to the rainfed irrigation.
Table 6 lists summary values for the area that has the potential to be cultivated for each crop. An average area of 55 m
2 of maize can be cultivated during a normal precipitation year, while dry beans, tomatoes, and sunflowers can be cultivated in areas of 56 m
2, 65 m
2, and 59 m
2, respectively. During a wet precipitation year, approximately 15% more area can be cultivated using the harvested rainfall than that in a normal year and about 50% more than that in a dry year.
The average area that can be cultivated at the community garden is 14 m
2 during a normal precipitation year for any of the four crops. This is a small fraction of the existing garden (~4% or 1/20th of the area). Although the volume of water collected from the three buildings during the growing season is relatively minimal in terms of providing irrigation for cultivating crops, the alleviation of 4% of water used through current irrigation methods can still be beneficial.
Figure 8 shows the area that can be cultivated solely using the harvested rainwater for both the Community Garden buildings (a) and the 4H building (b).
The AquaCrop model can also simulate the crop yield that can be harvested at the end of the growing season. For maize, the harvested rainwater and rainfed irrigation for a normal precipitation year can generate a total of 18.3 kg (40 lb.) in the community garden. The area that can be cultivated during the growing season using the volume from the 4H building is averaged at an area of 60 m2 for a normal precipitation year. The volume during the growing season could help cultivate 40% or over 1/3rd of the area of the prospective garden of 150 m2 for an average of all crops. The AquaCrop model simulated a total of 81 kg (178 lb.) of maize that can be harvested at the end of the growing season during a normal precipitation year at the 4H building. The harvested rain from the 4H building could help sustain a garden in the area for food production and help increase sovereignty at this scale.
Validation of the AquaCrop model was performed by comparing simulated net irrigation to an existing study conducted in the four-corners region of the U.S., by Djaman et al. (2018), which determined the required irrigation needed for maize in the arid environment of northwestern New Mexico, with similar monsoonal patterns to that of northwestern Arizona. The study found that net irrigation for maize was between 576.6 mm and 1051.6 mm, when maize was grown under full irrigation for four consecutive years, 2011–2014, and an additional year, 2017. The AquaCrop simulated net irrigation for maize at the lower end of the Djaman et al. study [
30]. Additionally, the simulated potential evapotranspiration (683 mm) in this study was similar the actual evapotranspiration, averaging 665 mm, in the Djaman et al. study.
3.4. Cost Summary—4H Building
Implementing a rainwater-harvesting system to collect rainwater from April to September at the 4H building would require cisterns large enough to collect an average volume of 29,285 L during a normal precipitation year. A normal precipitation year is selected for the budget since it occurs most commonly. The 4H building would require the most materials since it has a larger roof catchment size. The cost to implement an RWH system is listed in
Table 7. Polyethylene cisterns are chosen, as they are the most cost effective as compared with other options on the market—for instance, metal or wooden cisterns can double in cost compared to polyethylene cisterns [
31]. The gutter system already in place on the 4H building is suitable for an RWH system; therefore, there would be no additional cost. The pump needed to deliver the water from the cistern to the garden is the most expensive component in this RWH system. Gravity can also be used to move the water from the cistern to the garden if there is an adequate amount of elevation head from the cistern to the point of delivery. Lastly, in order to “stretch” the collected water for food production, a drip irrigation system should be implemented.
The range of cost to implement a rainwater-harvesting system is dependent on the cost of the polyethylene cistern and the pump. Additional costs for RWH systems include maintenance, which would require cleaning of the gutters before the start of the rainy season, as well as a disinfecting method to ensure the prevention of bacterial growth. Note that the total cost for implementing an RWH system on the 4H building accounts for a total of two 15,000 L (3500 gal) cisterns needed to maximize the amount of rain that can be captured.
There would be a greater cost to implement an RHW system to collect water year-round. Additional cisterns would be needed to ensure that the complete volume of precipitation, nearly double, is collected. Additionally, due to the cooler temperatures during the winter months, burial or insultation of the cisterns is required. Fortunately, the cisterns can hold water for a long period of time if engineered to prevent sunlight from penetrating to avoid the growth of algae or bacteria. To start, it is suggested to implement an RWH for the growing season only; additional cisterns can be added to the system if more water is desired to be harvested throughout the year.
4. Discussion
These findings suggests that rainwater harvesting is feasible in northwestern Arizona for food production at this scale. This coincides with findings in a previous study in Mbale where RWH was found to be an imperative source to address food security [
7] and where RWH can be an effective, alternative source of water in arid and semi-arid environments, especially in Arizona [
6]. Although the locally weighted smoothing shows a decrease in precipitation amounts since the late 1990s and a temperature trajectory increase since the 1980s (the start of both datasets), a substantial amount of rainwater can still be collected during classified normal, wet, and even dry precipitation years. The decrease in average annual precipitation in Peach Springs, AZ, from 279 mm in literature to 241 mm can be attributed to the spatial data versus the observational data, but it can also be attributed to the ongoing drought that has dominated the Southwestern US in the last two decades. Further research is needed to determine the cause for the decrease.
The 4H building on the reservation is better suited for rainwater capture with the galvanized roof material having a runoff coefficient of 90% and a surface area of 278 m3. The 40-year precipitation data suggest that a classified normal precipitation year can yield approximately 60,860 L of collected rainwater annually from the 4H building and approximately 29,285 L from April to September, during the growing season in the Hualapai Indian Reservation. Additionally, during a normal precipitation year, the AquaCrop model simulated an average of 81 kg of dry maize that can be harvested at the end of the growing season solely using the harvested rainwater. The Community Garden buildings are far less suited for RWH due to a lower runoff coefficient and smaller surface area. However, an average of 14,155 L can still be collected annually during a normal precipitation year, and about 6805 L can be collected during the growing season. An average of 18 kg of maize can be harvested at the end of the growing season solely using the harvested rainwater.
The harvested rainwater from the 4H building can help irrigate an area of approximately 60 m2, while the collected rainwater from the Community Garden buildings can help irrigate an area of about 14 m2. The area that is being considered for cultivation near the 4H building is 150 m2, so the collected rainwater can help irrigate slightly more than 1/3rd of the area. The existing community garden, where the three smaller buildings are located, has an area of approximately 320 m2, meaning that the collected rainwater from the tractor shed, tool shed, and greenhouse can help irrigate a small percentage of the area at 4%.
The cost to implement a rainwater harvesting system on the 4H building that can maximize the amount rainwater that can be collected can range from
$5900 to
$23,148 USD depending on the materials that are considered for the system. Polyethylene cisterns are the most cost-effective and come in variable sizes, allowing for full capture potential [
32]. Simple engineering can be performed to modify the existing gutter system to concentrate water into the cisterns. Additionally, the cisterns can be placed on elevated platforms to help move water from the cisterns to the desired area without a costly pump. The cisterns would be the most expensive part of the RWH system for the 4H building [
30]. The community garden would require further engineering since the current buildings do not have a gutter system that is required for the concentration of rainwater into a cistern; however, existing material on the reservation is available from a former rainwater harvesting project that is no longer operating. The aluminum gutters are malleable and can be shaped to fit the three small buildings. Four polyethylene cisterns are available for use as well and can hold a total of 800 L—additional cisterns will be needed to fully capture the rainwater during any classified year. The decision of implementing a rainwater-harvesting system on the 4H building and Community Garden buildings is solely of the Hualapai Tribe. It is currently being considered.
Although the cost of maize per kilogram will not solely offset the cost to implement a rainwater harvesting system for the first few years—when accounting for fuel to drive to and from the reservation (up to 80 km) to the nearest grocery store, vehicle maintenance, and the insecurities that were exposed during a global pandemic—implementing a rainwater harvesting system, especially in areas that are located in food deserts and most vulnerable to climate change, will ensure access to secure, healthy foods that are culturally rich. As tribal communities produce their own food, there is less dependency on government food-assistant programs that may lack nutritional values [
33].
5. Conclusions
Addressing water security will be one of the many challenges that all communities will face in the impending future; however, some areas will face greater challenges than others with many of these same communities already struggling during this ongoing drought. In the Southwest, where summer precipitation occurs, rainwater harvesting can help mitigate these challenges. Capturing the water that would otherwise be lost to evaporation or evapotranspiration from unwanted plants [
34] or simply running off can help support small-scale food production, such as community or domestic gardens. Although the volume of water that can be harvested from the 4H building and the Community Garden buildings cannot fully replace the irrigation practices that are currently in place due to the high demand of water from crops [
6], the harvested rainwater can help reduce the strain on current irrigation methods for various crops. This study assessed the feasibility of rainwater harvesting from two different areas and four buildings in the town of Peach Springs, which is a fraction of the buildings in the town. Community-wide RWH can further help alleviate the stress on current irrigation methods for food production. Food security can be attained with culturally significant and nutritious foods grown in town. Attaining water security for food production is incredibly important and more so with the changing climate. By expanding water resources in rural and tribal communities, food sovereignty can be attained. The amount of food that can be grown will depend on the catchment size in Peach Spring, AZ, and other similar communities in the Southwest.
