Article

Can “Internet Plus” Enhance the Green Transition? The Moderating Roles of Environmental Regulation and Sewage Fee-to-Tax

1
School of Economics and Management, Shanghai Institute of Technology, Shanghai 200235, China
2
School of Business, East China University of Science and Technology, Shanghai 200237, China
*
Author to whom correspondence should be addressed.
Sustainability 2023, 15(4), 2854; https://doi.org/10.3390/su15042854
Submission received: 16 October 2022 / Revised: 13 January 2023 / Accepted: 1 February 2023 / Published: 4 February 2023
(This article belongs to the Section Economic and Business Aspects of Sustainability)

Abstract

:
Implementing green transition with high quality has been confirmed as a critical approach to achieve sustainable development worldwide. This study focuses on how “Internet plus” affects the green transition of manufacturing companies. Based on the research sample of A-share-listed manufacturing companies from 2015 to 2020, the study concludes that “Internet plus” can significantly improve green transition, and the reliability of the above results is confirmed through endogeneity analysis and robustness tests. The result of the heterogeneity analysis suggests that “Internet plus” has a more significant promotion effect on state-owned companies, eastern regions, and high-tech industries. The result of the in-depth analysis indicates that “Internet plus” can contribute to green transition by boosting green innovation. In addition, environmental regulation and sewage fee-to-tax have significant positive effects in regulating the above relationships, further confirming that the enactment of the Environmental Protection Tax increases the regulating effect. This study provides a new theoretical framework for the intrinsic mechanism of “Internet plus” affecting the green transition of manufacturing companies.

1. Introduction

Manufacturing is an important cornerstone for countries to participate in global competition as a symbol of national competitiveness and overall strength. Despite their contribution to our economic development, manufacturing companies also hurt the environment. Environmental pollution incidents occur frequently, thus making environmental concerns a hotspot repeatedly. Green innovation and green transition have become top priorities in China’s “peak carbon dioxide emissions, carbon neutrality” strategic goal [1]. The manufacturing industry, which consumes energy and resources and emits pollutants, should achieve high-quality development through green transition to improve its competitiveness under the “double carbon” target. Manufacturers are facing real constraints from the environment and limited resources, making the green transition a real dilemma.
In response to manufacturing companies’ struggles to achieve a green transition, the state will implement environmental tax and regulation policies. As the core subject of independent innovation, companies play a central role in enhancing innovation capability. Manufacturing companies have become increasingly focused on the green transition through green innovation [2].
In practice, green innovation and green transition have aroused extensive attention. Green transition research places a focus on macro-level policy changes and micro-level changes within companies. At the macro level, the green transition of countries and regions is analyzed primarily from the perspective of policy research [3]. There are three aspects to a micro-level corporate green transition: corporate executives [4], corporate social responsibility [1], and environmental regulation [5]. However, studies focus on the direct correlation between “Internet plus” and green transition. There is a lack of literature that examines how “Internet plus” improves the green transition of manufacturing companies and what are factors for its effectiveness.
Environmental regulation and green technology innovation can be considered from four general perspectives. First, Porter’s hypothesis states that company innovation can be fostered by appropriate environmental regulation [6]. Even after the short-term increase in costs, companies can obtain a long-term innovation compensation effect, thus facilitating innovation [7]. Second, some scholars argue that environmental regulations increase company costs, which inhibits companies from developing green technologies [8]. Third, some research has suggested that environmental regulation and technological progress are non-linear due to time-scale changes. In the short run, pollution-control investments crowd out green technology R&D investments, whereas innovation can generate additional profits to boost technological progress in the long run [9]. Fourth, some empirical research has suggested that there is no significant correlation between the two based on an analysis of the calculations [10]. Most literature on this topic focuses on the theoretical framework of “environmental regulation-green innovation-company performance” [11,12] and lacks a discussion on differentiated green transition models for companies.
Existing research on the economic consequences of sewage fee-to-tax places a focus on the “double dividend” of environmental taxes, i.e., the environmental and social dividends [13,14,15]. As a result of environmental taxes, the quality of the environment can be improved, while reducing distortions are reduced, employment is encouraged, and even economic growth is stimulated. Studies on environmental taxes have largely focused on the macro level. The effect of sewage fee-to-tax on the green transition of manufacturing companies should be investigated in depth.
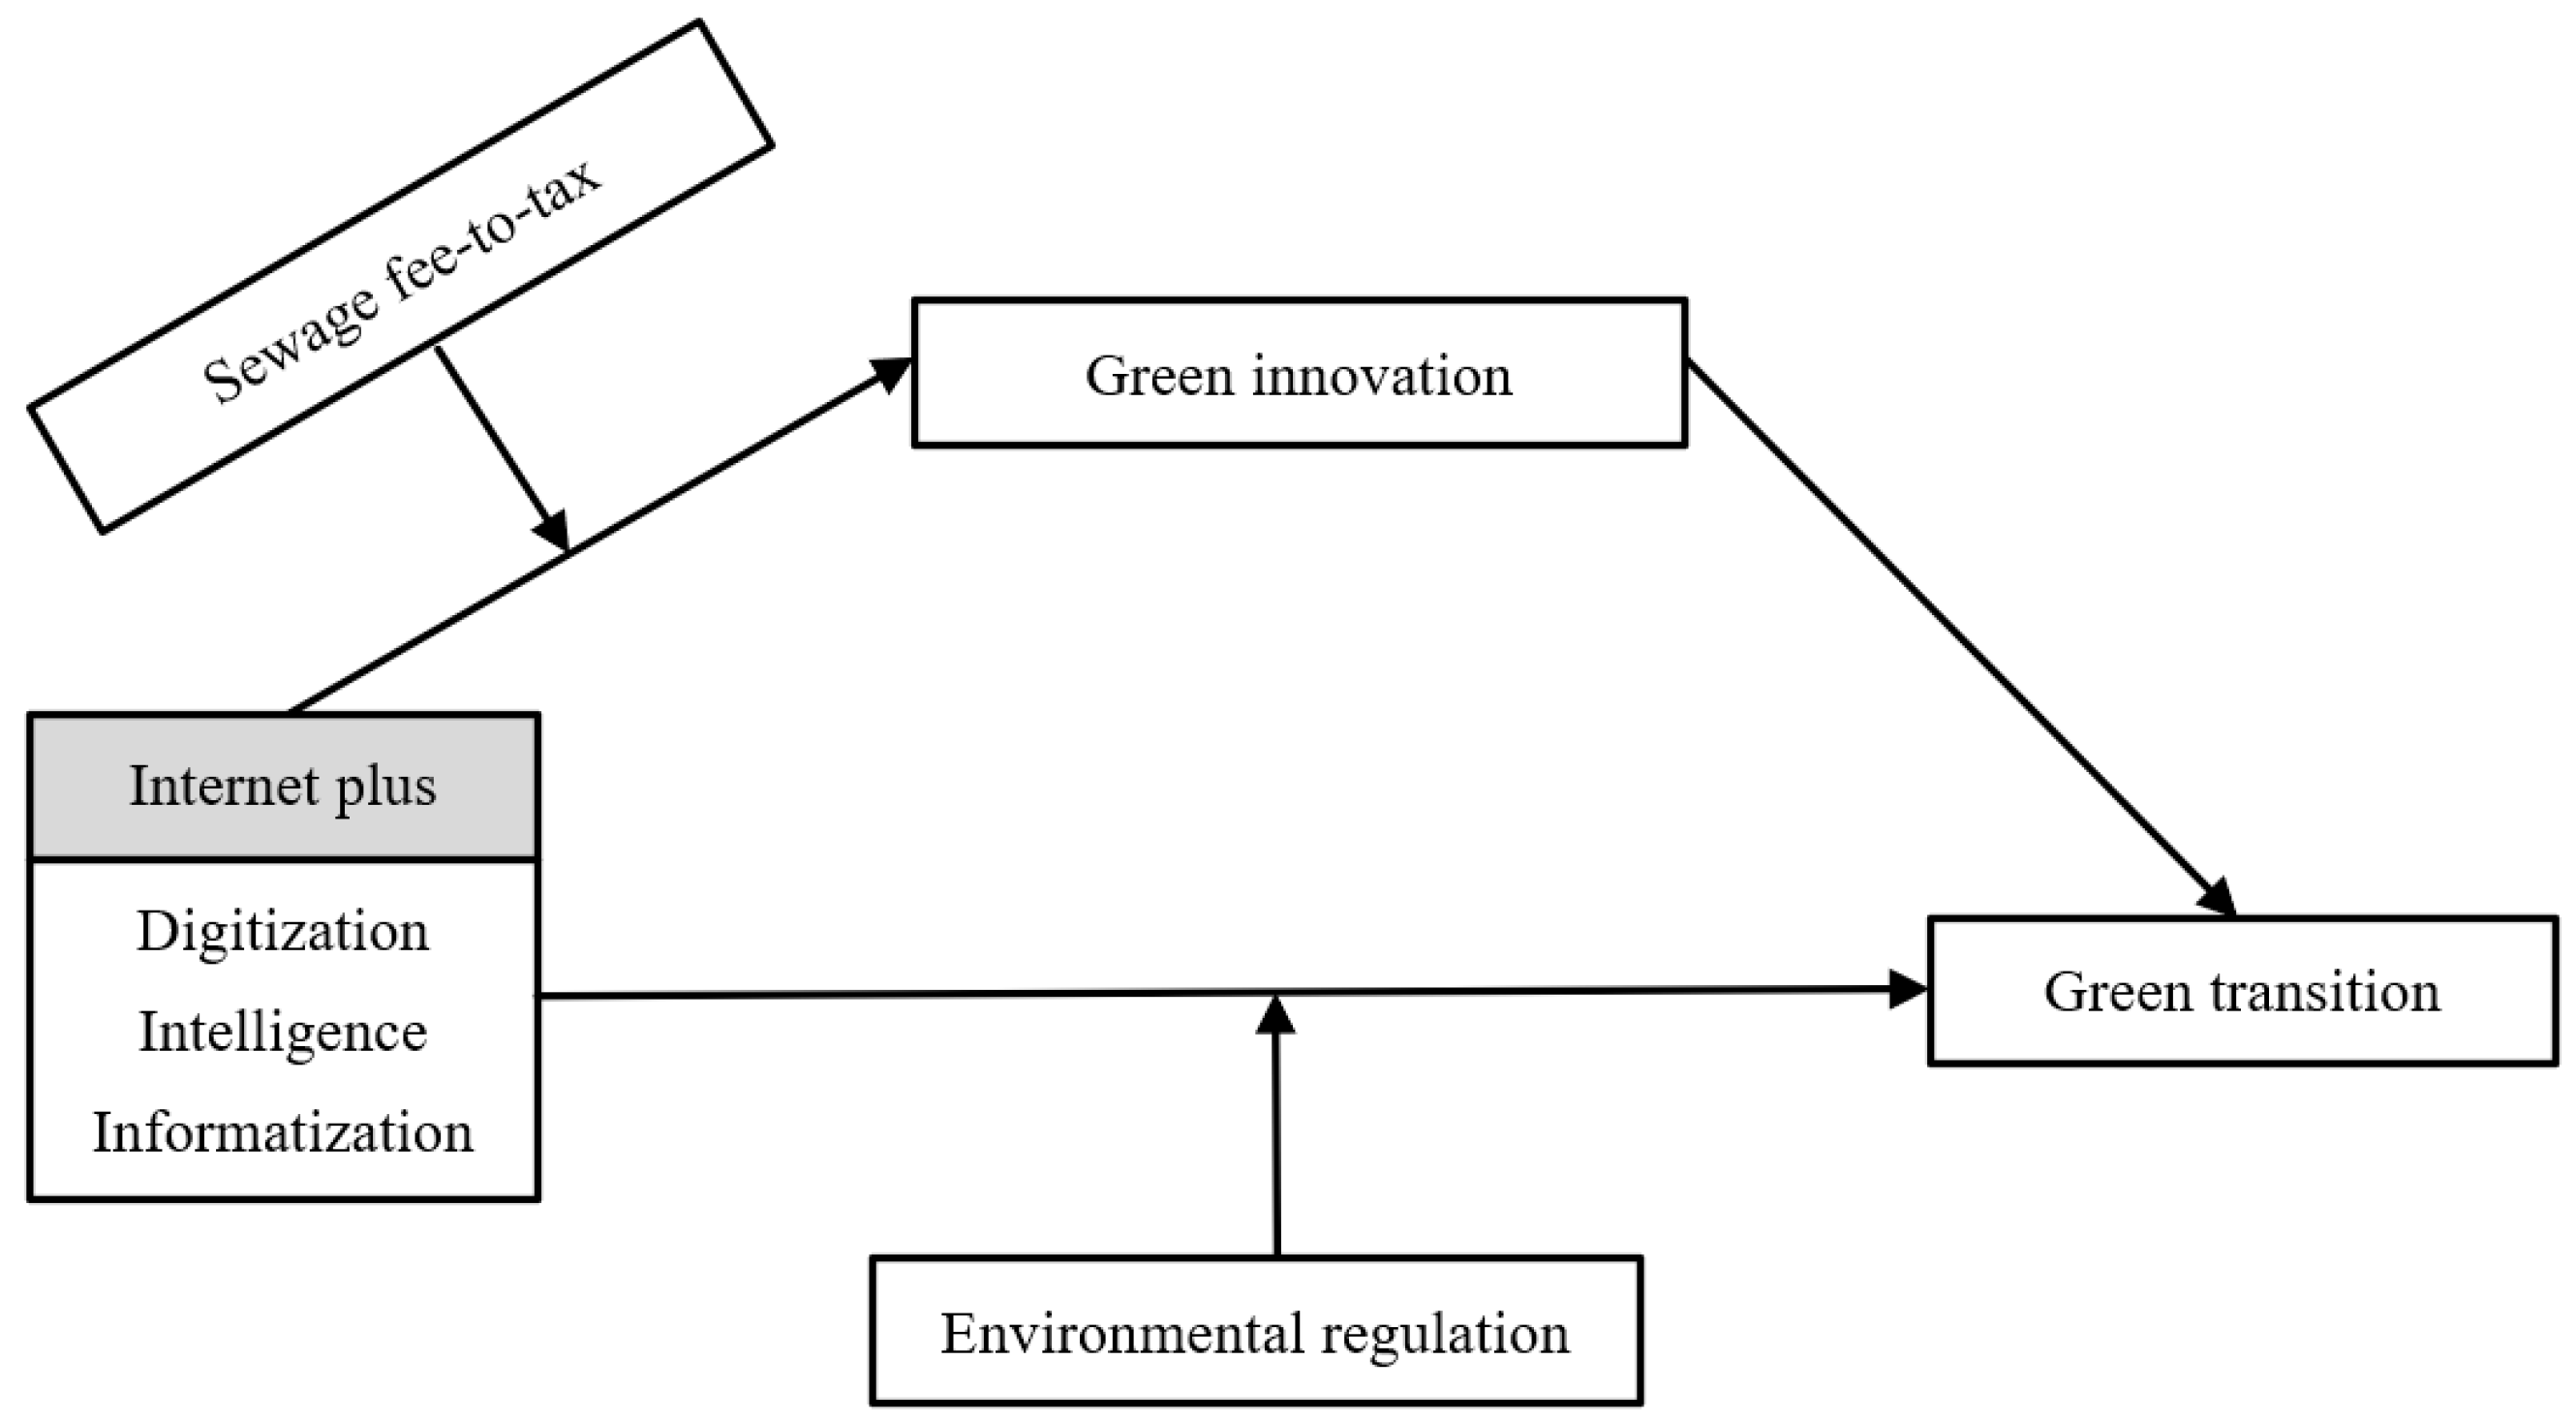
To solve the above research gaps, this study seeks to answer the following questions: Can “Internet Plus” with digitalization, intellectualization, and informatization promote the green transition of manufacturing companies? What role does green technology innovation play in the mechanism? Can environmental regulation and environmental protection taxes positively regulate the green transition of manufacturing companies?
In this study, “Internet plus” with its digitalization, intelligence, and informatization is first analyzed to facilitate the green transition mechanism of manufacturing companies from a theoretical perspective. An empirical analysis has been conducted on manufacturing companies listed on A-shares from 2015 to 2020 to verify the theoretical hypotheses. The results indicate that “Internet plus” is capable of significantly facilitating the green transition of manufacturing companies, and the reliability of the results is verified through endogeneity analysis and robustness tests. The result of the further analysis reveals that “Internet plus” with its digitalization and intelligence takes on a more critical significance in promoting green transition in private companies, while informatization is more important for state-owned companies. Moreover, there are significant regional and industry differences in the promotion effect, with a greater significance in the eastern region and high-tech industries. The result of the mechanism analysis indicates that “Internet plus” is capable of enhancing green transition through green technology innovation. Both environmental regulation and sewage fee-to-tax play a positive regulatory role. After 18 years of implementation, the environmental protection tax’s effect is stronger than before.
The main contributions of this study are as follows. First, research on green technology innovation and environmental regulation have contradictory findings (e.g., positive [14], negative [15], and U-shaped conclusions [11]). Accordingly, how “Internet plus” has affected the green transition of companies is examined using Chinese manufacturing companies as an example, and how green technology innovation plays a mediating role is examined. The second contribution of this study is to complement the literature on China’s environmental tax by evaluating the comparative effect of the policy before and after its release. Third, this study presents “Internet plus” in three dimensions: digitalization, intelligence, and information, which provides more targeted guidance on green transition than simply measuring “Internet plus” in the past. Fourth, most research has focused on the direct correlation between “Internet plus” and green transition. However, this study breaks through previous studies that fail to incorporate the process mechanism, thus enriching theoretical results concerning “Internet plus” and green transition at the mechanism level. Furthermore, this study provides Chinese evidence for Porter’s hypothesis and extends its theoretical extension from the perspective of environmental regulation, thus providing reference value for the green transition and taking on practical significance for the global green era’s development.
The rest of this study is organized as follows. In Section 2, the literature is reviewed, and the research hypotheses are proposed. In Section 3, the research methods are described, and the research models are built. In Section 4, the empirical research results are reported. In Section 5, the in-depth analysis is presented. In Section 6, a conclusion is drawn for this study.

2. Literature Review and Research Hypothesis

The concept of industrial ecology was first proposed by Frosch and Gallopoulous, who believed that industry and the ecosystem should operate as a whole [16]. The industrial ecological theory is an industrial development model from the perspective of the ecological environment. Based on the combination of industry, economy, and ecology, it realizes the transformation from restriction to the interaction between ecological environment and industrial development. The theory of industrial ecology not only lays a theoretical foundation for the study of industrial structure change, but also provides an effective analytical tool for the internal mechanism of environmental problems in the green transition of the manufacturing industry.

2.1. The Effect of “Internet Plus” on Green Transition

The existing research on the impact of “Internet plus” on the manufacturing industry mainly regards the new generation of information network technology as a general technology that affects the development of the manufacturing industry and focuses on the development status, trend, impact, and mechanism of information network technology [17,18]. Through the development level of “Internet plus” and the views of previous scholars, this study defines “Internet plus” as the penetration and integration of new-generation information technology represented by big data, cloud computing, and the Internet of Things to the Internet and other sectors of the economy, driving the digitalization, intelligence, and information transformation of manufacturing companies. However, most of the existing studies analyze “Internet plus” as a whole and lack a systematic perspective.
Green transition is guided by the concept of green development, with green innovation as the core, to achieve ecological environment improvement and high-quality economic development [19]. For the manufacturing industry, the green transition has become an important strategic development direction. About green transition, the existing research mainly focuses on the measurement of green transition [20] and the analysis of its influencing factors. Many scholars have extensively explored the influencing factors of green transition: environmental regulation, technological innovation, human capital, foreign direct investment, and other factors that have been widely concerned [21,22,23]. Although a few studies focus on the possible impact of digitalization on the green transition of manufacturing enterprises [23], they do not consider the overall impact of “internet plus” on the green transformation and its mechanism.
In general, “Internet plus” features comprise digitalization [12], intelligence [24], and informatization [25], forcing traditional manufacturing companies to change their production modes, business models, and profit models. As the digital economy has been leaping forward, “Internet plus” digitalization can be beneficial to reduce the energy consumption of the economy, while facilitating ecological environmental protection [26]. In addition, it can lead to optimized resource allocation between regions through the efficient integration of data and information [27]. Intelligent technology can add convenience for employees to acquire tacit innovation knowledge, which tends to be visible and expands the green innovation knowledge base within the company [28]. Moreover, “Internet plus” intelligence can help companies quickly identify their environmental problems and find a feasible path to achieve green transition and development by balancing economic growth with green governance [23]. “Internet plus” information can enhance mutual integration among various fields of society, improve resource allocation efficiency, and contribute significantly to the green transition of society [29]. By interconnecting information systems, companies can better integrate upstream and downstream resources in their supply chain and respond quickly to market changes. By sharing knowledge and information, companies can make communication and collaboration more environmentally friendly [23], and thus companies can transform themselves into greener economies. Focusing on the correlation between “Internet plus” and green transition, the first hypothesis is stated as follows:
Hypothesis 1.
“Internet plus” with its digitalization, intelligence, and informatization have a positive impact on green transition.

2.2. The Mediating Role of Green Technology Innovation

Green technological innovation refers to the progress of technologies that help to promote products that have no or little impact on the environment [30]. As a new type of technological innovation that considers environmental protection and green economic development, green technological innovation plays an increasingly important role in the development of the manufacturing industry. The existing research on green innovation of companies can be divided into two parts: driving mechanisms and influencing factors [31,32,33,34].
The risk, investment, and uncertainty of green innovation make investors more sensitive to information asymmetry [33], and large investments by companies in environmental management projects may crowd out financial resources in the short term [34]. Digitization is capable of driving the integration of data and information flows within the company, significantly enhancing information transparency [35], reducing the level of internal and external information asymmetry, and lowering information costs for investors. Further, digitization can significantly increase the financing efficiency of companies, thus promoting green innovation and accelerating the green transition of manufacturing companies. Intelligence can optimize the green innovation process and improve resource utilization and environmental carrying capacity. With the promotion of intelligent technology, companies can use the Internet of Things, big data, and other methods to identify customer consumption habits and preferences to identify market trends accurately [36]. Green innovation shifts from experience-driven to data-driven in the presence of environmental change, enabling companies to achieve green transition. Since green technology innovation is complex and long-term, it is imperative for companies to have strong resource integration and optimization capabilities. The information platform facilitates the formation of innovation synergy between companies and multiple innovation agents, such as external research institutions and consumers, which has a positive impact on green technology innovation [29]. Informatization stimulates the green innovation ability of companies by optimizing the allocation of internal and external resources, thus promoting the green transition of manufacturing companies. On that basis, the following hypothesis is proposed:
Hypothesis 2.
Green technology innovation mediates the correlation between “Internet plus” with its digitalization, intelligence, informatization, and green transition.

2.3. The Moderating Role of Environmental Regulation

In accordance with the industrial policy theory, it is imperative for government departments to formulate relevant policies for industrial development in circumstances where market regulation fails, which aims to stress the policy orientation [37]. Environmental regulation is regulatory measures and policies formulated by government departments to reduce environmental pollution and avoid the waste of resources [38]. Government guidance and support take on a great significance to corporate green technology innovation.
Some scholars hold that environmental regulation will increase the cost of pollution control and emission reduction, crowd out productive investment, and reduce the profits of companies [8]. However, Porter’s hypothesis holds that environmental regulation is capable of stimulating companies’ incentives to innovate, can offset the increased costs caused by the regulations, and can take advantage through the innovation compensation effect [6]. Environmental regulation is one of the important ways to realize green transition [39], and the existing studies have proved the importance of environmental regulation based on the industry [40] or company level. However, at the company level, most studies focus on the relationship between environmental regulation and green innovation [39], and some studies are based on the framework of “environmental regulation-innovation-company performance” [11,12]. This paper will discuss whether environmental regulation has an impact on the green transition of companies.
Environmental regulation boosts green innovation and provides new opportunities for companies to advance. As environmental regulations tighten, “Internet plus” digitalization can help manufacturers optimize production processes and improve pollution control technologies [23]. In the manufacturing process of products, intelligent testing and technical analysis are capable of reducing energy consumption and pollution [41]. Information technology can add convenience for manufacturing companies to allocate their value chain optimally and efficiently [42], such that the development of green technologies can be promoted. As a result, the positive effect of green transition deriving from “Internet plus” is augmented by environmental regulation. Stated more formally.
Hypothesis 3.
Environmental regulation strengthens the positive correlation between “Internet plus” with its digitalization, intelligence, informatization, and the green transition of companies.

2.4. The Moderating Role of Sewage Fee-to-Tax

There are mainly two views on the impact of an environmental protection tax on company innovation investment. First, the implementation of an environmental protection tax will increase enterprise innovation investment, thus promoting green transition [43]. Second, the environmental protection tax will inhibit the innovation of companies [44]. In 2018, China enacted the Environmental Protection Tax Law, which has proven the most effective economic incentive for corporate green innovation. An environmental protection tax is conducive to tackling the problems of the previous sewage charge system [45]. Environmental taxes are more effective in internalizing external environmental costs in production than other environmental regulation tools [45]. Moreover, environmental taxes have clear tax objects, tax items, tax rates, and policies for the increase and decrease of tax revenues. They can be implemented smoothly, and the tax revenue is accurate. Empirical evidence from developed countries supports the advantages of environmental taxes [46]. Environmental taxes, i.e., price-based instruments, are more flexible in their adjustment, thus becoming more effective in incentivizing corporate behavior. In accordance with the externality theory, the implementation of an environmental tax will result in a heavier intrinsic cost to manufacturing companies, which will be aware of the negative externality effect. To reduce the crowding-out effect of cost on revenue, manufacturing companies will prefer achieving their green innovation through “Internet plus”. Accordingly, this study proposes the following hypothesis:
Hypothesis 4.
Sewage fee-to-tax strengthens the positive correlation between “Internet plus” with its digitalization, intelligence, informatization, and the green innovation of companies.
Figure 1 illustrates the conceptual model of the hypotheses.

3. Research Design

3.1. Data Collection

In 2015, since “Internet plus” was first elevated to the level of the national strategy, “Internet plus manufacturing” has become an effective way for manufacturing companies to innovate. Manufacturing companies are selected as research samples because the scale and level of manufacturing are two of the most important indicators to measure a country’s comprehensive national strength. It also lays a foundation for China’s economic structural transformation and upgrade of the industrial structure [17]. In addition, the new Environmental Protection Law in China, known as “the most severe in history”, came into effect on January 1, 2015. Accordingly, the manufacturing companies listed on A-shares during 2015–2020 are employed in this study as the research sample, which can more intuitively observe the effect of Internet strategy implementation on the green transition of manufacturing companies.
The selection of data is divided into two steps. For the initial sample, this study excludes companies with abnormal operating conditions (e.g., ST, *ST, PT, and heart samples with missing variables). Furthermore, main variables are winsorized at the upper and lower 1% levels to eliminate outliers. Lastly, a total of 5180 observations are obtained.
The data in this paper are analyzed as follows. First, “Internet plus” measurements come from company annual reports. To be specific, the crawler searches disclosed annual reports of manufacturing companies from 2015 to 2020, removes undisclosed annual reports, and retrieves the results. The keywords are matched with the use of Python to the text of the annual reports to obtain word frequency. Secondly, data on green transition, environmental regulation, sewage fee-to-tax, and other characteristics and financial situations of the companies originate from the China Stock Market Accounting Research Database (CSMAR). It is one of the largest databases of listed companies in China. Lastly, green patents, as a proxy variable for green innovation, are acquired from the Chinese Research Data Services database (CNRDS).

3.2. Model

To verify the hypotheses, the following econometric models are built. The main effect model is expressed as follows:
G T i t = α 0 + α 1 I n t e r i t + α 2 c o n t r o l i t + i n d u s t r y + y e a r + ε i t
where the subscripts i and t represent the enterprise and the year; and the dependent variable GT represents green transition. The core independent variable Inter measures “Internet plus”, and its three aspects of digitalization, intelligence, and informatization; and control represents control variables. Furthermore, ∑industry and ∑year represent fixed industry and year effects, respectively.

3.3. Data Measurement

3.3.1. Dependent Variable

Green transition (GT): In this study, the index evaluation system is built from the seven aspects as follows: whether the company bureau has an environmental protection concept, environmental policy, environmental management organization structure, circular economy development model, green development, and so forth; whether the company has accomplished environmental protection objectives in the past and whether it has future environmental protection objectives; whether the company has formulated a series of management systems (e.g., relevant environmental management systems, systems, regulations, and responsibilities); whether the company participates in environmental protection-related education and training; whether the company participates in special environmental protection activities, environmental protection, and other social welfare activities; whether the company has established an emergency mechanism for major environmental emergencies, the emergency measures taken, and the treatment of pollutants; whether the company has received honors or awards in environmental protection; and whether the company employs the “three simultaneous” system. If there are the above behaviors, the value is 1; otherwise, it is 0, and the total score is obtained.

3.3.2. Independent Variables

“Internet plus” (Inter) with its digitalization (Dig), intelligence (Intel), and informatization (Infor): First, the collected annual reports are screened for high-frequency words relating to digitalization, intelligence, and informatization. The result indicates that words (e.g., data, digitalization, intelligence, information, and informatization) have appeared more frequently. Thus, the rationale is demonstrated for measuring “Internet plus” from three perspectives (including digitalization, intelligence, and information). During the selection process, the characteristic terms of “Internet plus” are supplemented by references to the academic and industrial fields. Second, the vocabulary is simplified by combining the number of keyword disclosures into the final index system of “Internet plus” and “Digitalization, Intelligence, and Informatization” based on the formed feature word database. Due to the “right bias” of the data frequency, the data are logarithmically processed to obtain the overall indicators describing “Internet plus” and the graded indicators of digitization and intelligence, as well as informatization.

3.3.3. Mediating Variable

Green Innovation (GI): Green innovation is measured using the number of green patents applied for by companies in the current year [31]. The number of green patents or authorizations is a more intuitive and accurate indicator of innovation than other measures. Since patent authorizations should be detected using a certain amount of time and require annual fees that lack stability and certainty, patent applications that are relatively stable, reliable, and timely are selected in this study. To be specific, this study measures the number of green utility model patent applications, which serves as a comparative indicator to measure the number of green innovations. The number of green patent applications has a certain lag period and right-skewed distribution, such that the logarithm of the number of green patent applications in the current year is taken after the addition of 1 and lags one period for measurement.

3.3.4. Moderating Variables

Environmental Regulation (ER): Pollutant emissions have usually been employed to measure the effectiveness of local environmental governance [47]. In this study, a comprehensive evaluation index is constructed with three indicators (including industrial sulfur dioxide emissions, industrial wastewater emissions, and industrial smoke and dust emissions), using the entropy value method to obtain the environmental regulation intensity.
Sewage fee-to-tax (SFT): Consider that China’s first environmental tax in 2018 is a reformulation of the former sewage charges by “tax burden shifting”. Therefore, this study adopts the sewage fee of companies before 2018 and the environmental tax in the years after 2018. The environmental protection tax is processed by adding 1 to the logarithm.

3.3.5. Control Variables

To increase the precision of the study, the following control variables are added in this study: length of time to market (Age), company size (Size), corporate governance (Cg), nature of ownership (Prn), financial leverage (Alr), and profitability (ROA), as well as two positions in one (Same). Furthermore, dummy variables for Industry and Year are controlled for in the regression analysis.
Table 1 shows the definition of the respective variables.

4. Empirical Results

4.1. Descriptive Statistics and Correlation Analysis

Table 2 depicts the descriptive statistics for the respective variables in this study. As depicted in the table, the data are relatively standardized, and the standard deviation remains within a reasonable range. Additionally, Table 3 lists the Person correlation coefficients and significance among the variables of the model. Among green transition (GT) and “Internet plus” (Inter) and its digitization (Digi), intelligence (Intel), and informatization (Infor), the correlation coefficients reach 0.200, 0.153, 0.174 and 0.179, respectively, and are of significance at a significance level of 1%. Accordingly, a positive correlation exists between green transition and “Internet plus” with its digitalization, intelligence, and informatization. Moreover, the variance inflation factor (VIF) of the variables is obtained, and the VIF of the main variables is less than 10. The above results reveal that there is no serious multicollinearity problem among the variables.

4.2. Regression Results

Table 4 depicts the OLS regression results of “Internet plus” on green transition. In the regression model, when we control the industry, annual dummy variables, and control variables, the regression coefficients of “Internet plus” reach 0.302, 0.255, 0.364, and 0.163, respectively, each of which is significant at the 1% level. The above result confirms the establishment of H1, which reveals that “Internet plus” has a significant effect in promoting green transition.

4.3. Mechanism Analysis

To verify Hypothesis 2, the correlation between “Internet plus” with its digitalization, intelligence, informatization, and green transition is examined using a stepwise regression model, and the mechanism of “Internet plus” is investigated in depth. On that basis, the following model is built based on equation (1).
G I i , t + 1 = β 0 + β 1 I n t e r i t + β 2 c o n t r o l i t + i n d u s t r y + y e a r + ε i t
G T i t = λ 0 + λ 1 I n t e r i t + λ 3 G I i , t + 1 + λ 4 c o n t r o l i t + i n d u s t r y + y e a r + ε i t
In Table 5, “Internet plus” (β = 0.088, p < 0.01) with its digitalization (β = 0.187, p < 0.01), intelligence (β = 0.231, p < 0.01), and informatization (β = 0.061, p < 0.05) have a significant contribution to green innovation and enhance the green transition (β = 0.154, p < 0.01; β = 0.239, p < 0.01; β = 0.231 p < 0.01; β = 0.375, p < 0.01). As green innovation technology improves, production, sales, and management can be made more environmentally, leading to the green transition of the company. Therefore Hypothesis 2 is verified.

4.4. The Moderating Effect of Environmental Regulation and Sewage Fee-to-Tax

To test the moderating effect, we add two interaction terms. The above terms are obtained by building interactions of Inter × ER and Inter× SFT. The Moderating Effect models are:
G T i t = b 0 + b 1 I n t e r i t + b 2 E R i t + b 3 I n t e r i t × E R i t +   b 4 c o n t r o l i t + i n d u s t r y + y e a r + ε i t  
G I i , t + 1 = c 0 + c 1 I n t e r i t + b 2 E P T i t + c 3 I n t e r i t × S F T i t +   c 4 c o n t r o l i t + i n d u s t r y + y e a r + ε i t      
On the one hand, this study suggests that the higher the level of environmental regulation, the stronger the positive correlation between “Internet plus” and green transition will be. In Model (4) of Table 6, the interaction between environmental regulation and “Internet plus” (Inter*ER) is verified. The result according to Model (4) indicates that the interaction effect is positive and significant (β = 0.767, p < 0.05; β = 2.098, p < 0.1; β = 1.471, p < 0.1; β = 1.501, p < 0.1). Thus, H3 is supported. On the other hand, the interaction between an environmental protection tax and “Internet plus” (Inter*SFT) is introduced in Model (5) of Table 7 to verify whether a sewage fee-to-tax also has a positive moderating effect. The coefficient of Inter*SFT is 0.022, which is of significance at the 0.01 level. Accordingly, H4 is also confirmed.
Moreover, as of 2018, China has implemented its first environmental tax, i.e., a “tax burden shifting” reformulation of the former sewage charges. In this study, the fees before and after 18 years are compared (Table 8). The effect is more significant after the new Environmental Protection Tax was enacted.

5. Further Analysis

5.1. Heterogeneity Analysis

The theoretical analysis indicates that “Internet plus” through digitalization, intelligence, and informatization can facilitate the green transition of manufacturing businesses. However, this mechanism of action may also be affected by external macroenvironmental factors and company microenvironmental factors. Thus, this study further analyzes the heterogeneity of the company property rights nature, regional, and industry classification.

5.1.1. The Nature of Property Rights

A company’s property rights determine how its production factors, such as resources and technology, are allocated and utilized. As is shown in Table 9, “Internet plus” (β = 0.180, p < 0.01) with its digitalization (β = 0.457, p < 0.01) and intelligence (β = 0.272, p < 0.01) have a greater impact on the green transition of non-state-owned manufacturing companies. To enhance green transition, private companies are under greater pressure to enhance digitalization and intelligence through integration with “Internet plus.” The effect of “Internet plus” informatization (β = 0.426, p < 0.01) on the green transition of state-owned manufacturing companies is greater than that of non-state-owned manufacturing companies. In the new era, state-owned manufacturing companies have become more important functional carriers to fulfill national missions than private ones. Consequently, state-owned manufacturing companies must serve as the main force under the strategic deployment of building information technology.

5.1.2. The Effect of Geographical Distribution

To better analyze the effect of “Internet plus” with its digitalization, intelligence, and informatization on the green transition in each region, this study divides the regions into East, West, and Central. As is shown in Table 10, the effect of “Internet plus” (β = 0.205, p < 0.01) and digitalization (β = 0.391, p < 0.01), intelligence (β = 0.284, p < 0.01), and informatization (β = 0.476, p < 0.01) on the green transition of manufacturing companies in the east is more pronounced. This is because there are large differences in regional development in China, with factors such as technology being more advanced in the eastern region than in the central and western regions. In contrast, the constraints of resources and technology in the central and western regions do not meet the needs of green transition in the context of “Internet plus”, which makes the effect not obvious.

5.1.3. High-Tech/Non-High-Tech Industries

In this study, the types of industries are divided into high-tech and non-high-tech industries to test the differences. Table 11 shows that “Internet plus” (β = 0.224, p < 0.01) with its digitalization (β = 0.410, p < 0.01), intelligence (β = 0.387, p < 0.01), and informatization (β = 0.475, p < 0.01) have more significant effects on the green transition in high-tech industry companies. On the one hand, due to the digital, intelligent, and informative nature of “Internet plus” [48], high-tech industries may better adapt to the development opportunities brought by “Internet plus” and carry out green transition more rationally and efficiently. On the other hand, companies in high-tech industries are more competitive than those in non-high-tech industries [49]. To survive in the industry, high-tech industries may place more emphasis on breakthrough and exploratory innovations. Moreover, as an emerging industry, the high-tech industry will place greater emphasis on green transition to maintain its competitive advantage.

5.2. Endogenous Tests and Robustness Tests

5.2.1. Endogenous Tests

There may be endogenous problems in this study. There are many factors affecting the green transition of manufacturing companies, and it is difficult to control them completely, thus causing problems such as model sample selection and omitted variables. Moreover, there may be a causal correlation between “Internet plus” and the green transition of manufacturing companies. The development of “Internet plus” has an impact on the green transition, while the process of green transition will also promote and affect the development of “Internet plus”.
In this study, interaction terms are constructed between the number of post offices per million people and the number of fixed telephones per million people in 1984 and the national IT service revenue in the previous year for 31 provinces and cities, which are denoted as IV1. Further, instrumental variables are expressed as IV2. The data originate from the China Statistical Yearbook, where the number of post offices and fixed-line telephones in Hainan are from the China Economic Statistics Library, and the number of fixed-line telephones is the sum of telephones and rural telephones in the respective province. The data for Chongqing are missing and are obtained using the data from 1985 and 1986, as well as 1987. The data of Sichuan Province are acquired by subtracting the data of Chongqing from the data of Sichuan Province in the China Statistical Yearbook.
In this study, the Heckman two-stage model is employed for testing. In the first-stage regression model, the independent variables “Internet plus” with its digitalization, intelligence, and informatization are employed as the dummy variables, which are Internet_D, Dig_D, Intel_D, and Infor_D, based on whether Internet, Dig, Intel, and Infor are larger than the median of the sample. Accordingly, 1 is taken to be higher than the median; otherwise, it is 0. Moreover, IV1 and IV2 are introduced as exogenous instrumental variables in the first-stage model, and three inverse Mills ratios (IMR) are obtained using the regression results of Probit, which are substituted into the second-stage model for fitting. The results are listed in Table 12.

5.2.2. Robustness Tests

To further verify the robustness of the research results, this study uses three methods: excluding the C39 industry, excluding companies in heavily polluting industries, and lagging the green transition by two and one stages. First, according to the China Securities Regulatory Commission’s industry classification, C39 companies are Internet-based or IT-led businesses, which may have a perturbing effect on the overall sample results. Second, industries that pollute are subject to more frequent and intense government regulation. As a result, companies in this sector are inclined to be more likely to abide by local environmental protection policies and to improve their environmental performance levels through green innovation. To avoid this level of effect, companies in heavily polluting industries are excluded from the analysis in this study. Table 13 lists the regression results. The above results indicate that the core results of this study exhibit good robustness.

6. Discussion

In the context of the rapid development of the Internet, the Internet and manufacturing companies should be integrated deeply to ensure high-quality development. Some scholars have focused on the integration between the Internet and the manufacturing industry, then studied the role of “Internet plus” in improving the competitiveness of companies. However, there is less literature that extends the research to green transition and explores the impact of “Internet plus” on the green transition of manufacturing companies. Due to this, it has become increasingly important to understand the mechanisms by which “Internet plus” can promote the green transition of manufacturing companies.
First and foremost, “Internet plus” with its digitalization, intelligence, and informatization have a significant effect in promoting green transition. In addition, “Internet plus” informatization plays a more significant role in the mechanism. Informatization technology promotes the mutual integration of all areas of society, improves the efficiency of resource allocation, and makes a significant contribution to the green transition of society. This study portrays “Internet plus” from three levels: digitalization, intelligence, and informatization, which is more comprehensive and breaks through the limitation of measuring “Internet plus” only from the overall perspective. It offers more targeted guidance in exploring the green transition of manufacturing companies and broadens the theoretical understanding of non-economic value creation in company transformation. The findings support and extend the perspectives of Peng et al. by introducing and confirming that digitalization inhibits and then promotes green transition in companies [23].
Second, from a mechanism perspective, green technology innovation is selected as a mediating variable. The results support the transmission path of “Internet plus → green innovation → green transition”. Further, it is supplemented by Sun and Guo’s findings that digital transformation can significantly boost green technology innovation [50].
Third, this study analyzes the regulatory effects of environmental regulation and sewage fee-to-tax. They have significant positive effects in regulating the above relationships. By exploring the effect of the release of China’s Environmental Protection Tax on manufacturing companies, this study complements the existing literature on environmental taxes in China by analyzing the comparative effect of the policy before and after its release. It provides evidence for Porter’s hypothesis in China [6] and extends its theoretical application. It provides a reference value for the green transition of manufacturing companies and has some practical significance for the development of a new global green era.
In further research, considering that this mechanism of action can be influenced by external macroenvironmental factors and company factors, this study analyzes the heterogeneity in the nature of property rights, regional, and industry classification.
Despite its valuable insights, this study has limitations that should stimulate further research. The listed manufacturing companies in Shanghai and Shenzhen are examined to demonstrate the problem. However, it cannot be judged if the conclusion applies to non-listed companies, and its universality must be further demonstrated. Second, in the future, we can analyze and compare the green transition of manufacturing companies in different countries. Lastly, the heterogeneity of company size can be considered to analyze more comprehensively the effect of “Internet plus” on the green transition.

7. Conclusions and Policy Implications

Using A-share listed manufacturing companies from 2015–2020 as a research sample, this study examines “Internet plus” with its digitalization, intelligence, and informatization impact on the green transition, and draws the following conclusions. First, it is confirmed that “Internet plus” with its digitalization, intelligence, and information technology is capable of significantly boosting the green transition of manufacturing companies, and the results are verified through endogeneity analysis and robustness testing.
Second, “Internet plus” with its digitalization, intelligence, and informatization can enhance the green transition through green technology innovation.
Third, results indicate that environmental regulation strengthens the positive correlation between “Internet plus” with its digitalization, intelligence, informatization, and green transition. Sewage fee-to-tax bolsters the positive correlation between “Internet plus” with its digitalization, intelligence, informatization, and green transition. Further, the effect of implementing an environmental protection tax before and after 2018 is analyzed, and it is suggested that the effect is stronger after 2018.
Lastly, heterogeneity analysis indicates that “Internet plus” with its digitalization and intelligence is more effective in promoting the green transition in private companies, while information technology is more effective in the green transition of state-owned companies. There are obvious regional and industry differences in this promotion effect, with more significant effects in the eastern region. The positive effect in high-tech industries is larger than that of companies in non-high-tech industries. The above findings offer several policy implications.
Our findings also provide important practical implications. First, manufacturing companies should be guided by the government to accelerate the integration of “Internet plus” and carry out targeted green transitions. Through a new company ecosystem, manufacturing companies should develop digital platforms to create new product experiences and social value.
Second, environmental regulations should not only focus on government action, but also consider how markets allocate resources to drive green innovation.
Third, private companies should continue to focus on resource accumulation and improve resource utilization efficiency. To improve the industrial layout, the country needs to coordinate “Internet plus” and green development processes in the eastern and non-eastern regions. To promote green transition, non-high-tech companies should also cooperate in scientific research and cite advanced green innovation technologies.
Lastly, global economic growth is further inhibited by the effect of the pandemic. In the current economic environment, the government cannot reduce the strength of environmental regulations. The findings of this study further confirm Porter’s hypothesis [6], which explains why environmental regulation should not be weakened, but rather be designed and implemented to encourage corporate green innovation.

Author Contributions

Z.L.: conceptualization, writing-reviewing and editing, supervision, funding acquisition; J.C.: writing-original draft, data curation and formal analysis; Y.Z.: writing-reviewing and editing, supervision. All authors have read and agreed to the published version of the manuscript.

Funding

This paper was funded by National Social Science Fund of China (18BGL093), the National Natural Science Foundation of China (71974130).

Institutional Review Board Statement

Not applicable.

Informed Consent Statement

Not applicable.

Data Availability Statement

The data presented in this study are openly available in the Chinese Research Data Services Database (CNRDS), the China Stock Market Accounting Research Database (CSMAR), and the China Statistical Yearbook and the China Economic Statistics Library.

Conflicts of Interest

The authors declare no conflict of interest.

References

  1. Lu, J.; Ren, L.; Zhang, C.; Rong, D.; Ahmed, R.R.; Streimikis, J. Modified Carroll’s Pyramid of Corporate Social Responsibility to Enhance Organizational Performance of SMEs Industry. J. Clean. Prod. 2020, 271, 122456. [Google Scholar] [CrossRef]
  2. Yang, Z.; Shao, S.; Yang, L.; Liu, J. Differentiated Effects of Diversified Technological Sources on Energy-Saving Technological Progress: Empirical Evidence from China’s Industrial Sectors. Renew. Sustain. Energy Rev. 2017, 72, 1379–1388. [Google Scholar] [CrossRef]
  3. Mao, W.; Wang, W.; Sun, H. Driving Patterns of Industrial Green Transformation: A Multiple Regions Case Learning from China. Sci. Total Environ. 2019, 697, 134134. [Google Scholar] [CrossRef] [PubMed]
  4. Gao, K.; Wang, L.; Liu, T.; Zhao, H. Management Executive Power and Corporate Green Innovation—Empirical Evidence from China’s State-Owned Manufacturing Sector. Technol. Soc. 2022, 70, 102043. [Google Scholar] [CrossRef]
  5. Hou, J.; Teo, T.S.H.; Zhou, F.; Lim, M.K.; Chen, H. Does Industrial Green Transformation Successfully Facilitate a Decrease in Carbon Intensity in China? An Environmental Regulation Perspective. J. Clean. Prod. 2018, 184, 1060–1071. [Google Scholar] [CrossRef]
  6. Porter, M.E.; van der Linde, C. Toward a New Conception of the Environment-Competitiveness Relationship. J. Econ. Perspect. 1995, 9, 97–118. [Google Scholar] [CrossRef]
  7. Lin, H.; Zeng, S.X.; Ma, H.Y.; Qi, G.Y.; Tam, V.W.Y. Can Political Capital Drive Corporate Green Innovation? Lessons from China. J. Clean. Prod. 2014, 64, 63–72. [Google Scholar] [CrossRef]
  8. Fang, Y.; Shao, Z. Whether Green Finance Can Effectively Moderate the Green Technology Innovation Effect of Heterogeneous Environmental Regulation. Int. J. Environ. Res. Public Health 2022, 19, 3646. [Google Scholar] [CrossRef]
  9. Li, X.; Lai, X.; Zhang, F. Research on Green Innovation Effect of Industrial Agglomeration from Perspective of Environmental Regulation: Evidence in China. J. Clean. Prod. 2021, 288, 125583. [Google Scholar] [CrossRef]
  10. Yuan, B.; Ren, S.; Chen, X. Can Environmental Regulation Promote the Coordinated Development of Economy and Environment in China’s Manufacturing Industry?–A Panel Data Analysis of 28 Sub-Sectors. J. Clean. Prod. 2017, 149, 11–24. [Google Scholar] [CrossRef]
  11. Shao, X.; Liu, S.; Ran, R.; Liu, Y. Environmental Regulation, Market Demand, and Green Innovation: Spatial Perspective Evidence from China. Environ. Sci. Pollut. Res. 2022, 29, 63859–63885. [Google Scholar] [CrossRef] [PubMed]
  12. Wu, Y.; Wu, Y.; Guerrero, J.M.; Vasquez, J.C. Digitalization and Decentralization Driving Transactive Energy Internet: Key Technologies and Infrastructures. Int. J. Electr. Power Energy Syst. 2021, 126, 106593. [Google Scholar] [CrossRef]
  13. Hu, X.; Liu, J.; Yang, H.; Meng, J.; Wang, X.; Ma, J.; Tao, S. Impacts of Potential China’s Environmental Protection Tax Reforms on Provincial Air Pollution Emissions and Economy. Earths Future 2020, 8, e2019EF001467. [Google Scholar] [CrossRef]
  14. Feng, Z.; Chen, W. Environmental Regulation, Green Innovation, and Industrial Green Development: An Empirical Analysis Based on the Spatial Durbin Model. Sustainability 2018, 10, 223. [Google Scholar] [CrossRef]
  15. Lv, C.; Shao, C.; Lee, C.-C. Green Technology Innovation and Financial Development: Do Environmental Regulation and Innovation Output Matter? Energy Econ. 2021, 98, 105237. [Google Scholar] [CrossRef]
  16. Frosch, R.A.; Gallopoulos, N.E. Strategies for Manufacturing. Sci. Am. 1989, 261, 144–153. [Google Scholar] [CrossRef]
  17. Pan, M.; Bai, M.; Ren, X. Does Internet Convergence Improve Manufacturing Enterprises’ Competitive Advantage? Empirical Research Based on the Mediation Effect Model. Technol. Soc. 2022, 69, 101944. [Google Scholar] [CrossRef]
  18. Tong, L.; Rong, Y. Internet, Green Innovation and Industrial Upgrading. Sustainability 2022, 14, 13687. [Google Scholar] [CrossRef]
  19. Chaiyapa, W.; Esteban, M.; Kameyama, Y. Why Go Green? Discourse Analysis of Motivations for Thailand’s Oil and Gas Companies to Invest in Renewable Energy. Energy Policy 2018, 120, 448–459. [Google Scholar] [CrossRef]
  20. Wang, Y.; Hu, H.; Dai, W.; Burns, K. Evaluation of Industrial Green Development and Industrial Green Competitiveness: Evidence from Chinese Urban Agglomerations. Ecol. Indic. 2021, 124, 107371. [Google Scholar] [CrossRef]
  21. Li, C.; Liu, X.; Bai, X.; Umar, M. Financial Development and Environmental Regulations: The Two Pillars of Green Transformation in China. Int. J. Environ. Res. Public Health 2020, 17, 9242. [Google Scholar] [CrossRef] [PubMed]
  22. Gong, M.; You, Z.; Wang, L.; Cheng, J. Environmental Regulation, Trade Comparative Advantage, and the Manufacturing Industry’s Green Transformation and Upgrading. Int. J. Environ. Res. Public Health 2020, 17, 2823. [Google Scholar] [CrossRef] [PubMed]
  23. Peng, C.; Jia, X.; Zou, Y. Does Digitalization Drive Corporate Green Transformation?—Based on Evidence from Chinese Listed Companies. Front. Environ. Sci. 2022, 10, 963878. [Google Scholar] [CrossRef]
  24. Tang, Q.; Yu, F.R.; Xie, R.; Boukerche, A.; Huang, T.; Liu, Y. Internet of Intelligence: A Survey on the Enabling Technologies, Applications, and Challenges. IEEE Commun. Surv. Tutor. 2022, 24, 1394–1434. [Google Scholar] [CrossRef]
  25. Li, G.; Zhang, W.; Zhang, H.; Qian, M. Research on the Development of Agricultural Informatization Based on the Background of “Internet Plus”. Fresenius Environ. Bull. 2020, 29, 7502–7509. [Google Scholar]
  26. Ha, L.T.; Huong, T.T.L.; Thanh, T.T. Is Digitalization a Driver to Enhance Environmental Performance? An Empirical Investigation of European Countries. Sustain. Prod. Consum. 2022, 32, 230–247. [Google Scholar] [CrossRef]
  27. Lu, W.-C.; Tsai, I.-C.; Wang, K.-C.; Tang, T.-A.; Li, K.-C.; Ke, Y.-C.; Chen, P.-T. Innovation Resistance and Resource Allocation Strategy of Medical Information Digitalization. Sustainability 2021, 13, 7888. [Google Scholar] [CrossRef]
  28. Yin, S.; Zhang, N.; Ullah, K.; Gao, S. Enhancing Digital Innovation for the Sustainable Transformation of Manufacturing Industry: A Pressure-State-Response System Framework to Perceptions of Digital Green Innovation and Its Performance for Green and Intelligent Manufacturing. Systems 2022, 10, 72. [Google Scholar] [CrossRef]
  29. Al-Makhadmeh, Z.; Tolba, A. SRAF: Scalable Resource Allocation Framework Using Machine Learning in User-Centric Internet of Things. Peer Peer Netw. Appl. 2021, 14, 2340–2350. [Google Scholar] [CrossRef]
  30. Bhatia, M.S.; Jakhar, S.K. The Effect of Environmental Regulations, Top Management Commitment, and Organizational Learning on Green Product Innovation: Evidence from Automobile Industry. Bus. Strategy Environ. 2021, 30, 3907–3918. [Google Scholar] [CrossRef]
  31. Chen, Z.; Jin, J.; Li, M. Does Media Coverage Influence Firm Green Innovation? The Moderating Role of Regional Environment. Technol. Soc. 2022, 70, 102006. [Google Scholar] [CrossRef]
  32. Liao, Z. Content Analysis of China’s Environmental Policy Instruments on Promoting Firms’ Environmental Innovation. Environ. Sci. Policy 2018, 88, 46–51. [Google Scholar] [CrossRef]
  33. Sun, Y.; Bi, K.; Yin, S. Measuring and Integrating Risk Management into Green Innovation Practices for Green Manufacturing under the Global Value Chain. Sustainability 2020, 12, 545. [Google Scholar] [CrossRef]
  34. Breitenstein, M.; Nguyen, D.K.; Walther, T. Environmental Hazards and Risk Management in the Financial Sector: A Systematic Literature Review. J. Econ. Surv. 2021, 35, 512–538. [Google Scholar] [CrossRef]
  35. Lukic, I.; Milicevic, K.; Kohler, M.; Vinko, D. Possible Blockchain Solutions According to a Smart City Digitalization Strategy. Appl. Sci. 2022, 12, 5552. [Google Scholar] [CrossRef]
  36. Bajari, P.; Chernozhukov, V.; Hortaçsu, A.; Suzuki, J. The Impact of Big Data on Firm Performance: An Empirical Investigation. AEA Pap. Proc. 2019, 109, 33–37. [Google Scholar] [CrossRef]
  37. Chang, H.-J.; Andreoni, A. Industrial Policy in the 21st Century. Dev. Change 2020, 51, 324–351. [Google Scholar] [CrossRef]
  38. Ren, S.; Li, X.; Yuan, B.; Li, D.; Chen, X. The Effects of Three Types of Environmental Regulation on Eco-Efficiency: A Cross-Region Analysis in China. J. Clean. Prod. 2018, 173, 245–255. [Google Scholar] [CrossRef]
  39. Du, K.; Cheng, Y.; Yao, X. Environmental Regulation, Green Technology Innovation, and Industrial Structure Upgrading: The Road to the Green Transformation of Chinese Cities. Energy Econ. 2021, 98, 105247. [Google Scholar] [CrossRef]
  40. Chen, X.; Qian, W. Effect of Marine Environmental Regulation on the Industrial Structure Adjustment of Manufacturing Industry: An Empirical Analysis of China’s Eleven Coastal Provinces. Mar. Policy 2020, 113, 103797. [Google Scholar] [CrossRef]
  41. Belhadi, A.; Kamble, S.S.; Zkik, K.; Cherrafi, A.; Touriki, F.E. The Integrated Effect of Big Data Analytics, Lean Six Sigma and Green Manufacturing on the Environmental Performance of Manufacturing Companies: The Case of North Africa. J. Clean. Prod. 2020, 252, 119903. [Google Scholar] [CrossRef]
  42. Faroukhi, A.Z.; El Alaoui, I.; Gahi, Y.; Amine, A. Big Data Monetization throughout Big Data Value Chain: A Comprehensive Review. J. Big Data 2020, 7, 3. [Google Scholar] [CrossRef]
  43. Liu, W.; Liu, T. Exploring the Impact and Path of Environmental Protection Tax on Different Air Pollutant Emissions. Int. J. Environ. Res. Public Health 2022, 19, 4767. [Google Scholar] [CrossRef] [PubMed]
  44. Cheng, Z.; Chen, X.; Wen, H. How Does Environmental Protection Tax Affect Corporate Environmental Investment? Evidence from Chinese Listed Enterprises. Sustainability 2022, 14, 2932. [Google Scholar] [CrossRef]
  45. Shang, S.; Chen, Z.; Shen, Z.; Shabbir, M.S.; Bokhari, A.; Han, N.; Klemes, J.J. The Effect of Cleaner and Sustainable Sewage Fee-to-Tax on Business Innovation. J. Clean. Prod. 2022, 361, 132287. [Google Scholar] [CrossRef]
  46. Shahzad, U. Environmental Taxes, Energy Consumption, and Environmental Quality: Theoretical Survey with Policy Implications. Environ. Sci. Pollut. Res. 2020, 27, 24848–24862. [Google Scholar] [CrossRef]
  47. Li, J.; Du, Y. Spatial Effect of Environmental Regulation on Green Innovation Efficiency: Evidence from Prefectural-Level Cities in China. J. Clean. Prod. 2021, 286, 125032. [Google Scholar] [CrossRef]
  48. Majchrzak, A.; Markus, M.L.; Wareham, J. Designing for Digital Transformation: Lessons for Information Systems Research from the Study of ICT and Societal Challenges. MIS Q. 2016, 40, 267–278. [Google Scholar] [CrossRef]
  49. Employee Mobility, Spin-outs, and Knowledge Spill-in: How Incumbent Firms Can Learn from New Ventures–Kim–2017–Strategic Management Journal–Wiley Online Library. Available online: https://onlinelibrary.wiley.com/doi/abs/10.1002/smj.2625 (accessed on 9 October 2022).
  50. Sun, S.; Guo, L. Digital Transformation, Green Innovation and the Solow Productivity Paradox. PLoS ONE 2022, 17, e0270928. [Google Scholar] [CrossRef]
Figure 1. Conceptual model.
Sustainability 15 02854 g001
Table 1. Variable definitions.
Variable TypeVariableCodeDefinition
Dependent variableGreen transformationGTFrom 7 aspects, if there are the above behaviors, the value is 1, otherwise it is 0
Independent variables“Internet plus”InterThe sum of Dig, Intel, and Infor
DigitalizationDigDigitized word frequency taking a logarithm
IntelligenceIntelIntelligent word frequency taking a logarithm
InformatizationInforInformative word frequency taking a logarithm
Mediating variableGreen innovationGIln (green utility patent applications +1), and lag 1 period
Moderating variablesEnvironmental regulationERA comprehensive evaluation index with three indicators
Sewage fee-to-taxSFTln (sewage fee) + 1, before 2018
ln (environmental protection tax) + 1, after 2018
Control variablesAgeAgeln (enterprise establishment year)
Firm sizeSizeln (total assets)
Corporate governanceCgNumber of independent directors/Number of directors
OwnershipPrnThe proportion of state-owned shares.
If the firm is state-owned, it is defined as 1, otherwise it is 0
Financial leverageAlrTotal liabilities/Total assets
Two positions in oneSameWhether the chairman and general manager are the same people.
If it is taken as 1, otherwise it is 0
ProfitabilityROANet profit/Total assets
Table 2. Descriptive statistics of variables.
VariableNMeanP50SDMinMax
GT40741.97312.01008
Dig40274.4264.4430.4830.6935.930
Intel40253.4143.4660.77006.488
Infor40182.9462.9960.69704.905
Internet401410.8010.891.6441.79215.81
GI37040.8960.6931.10706.096
SFT94313.3013.653.3672.72519.96
ER32230.08710.06750.06440.01110.511
Age40692.5392.9960.84803.401
Size360822.4922.341.32417.6427.47
Cg40740.3750.3330.05810.2500.800
Prn35950.49300.50001
Alr40740.4390.4160.5260.0084028.55
Same40070.26100.43901
ROA3646−3.306−3.1001.091−9.6882.008
Table 3. Pearson correlation coefficient matrix.
1234567
1 GT1.000
2 Dig0.153 ***1.000
3 Intel0.174 ***0.674 ***1.000
4 Infor0.179 ***0.593 ***0.541 ***1.000
5 Inter0.200 ***0.843 ***0.879 ***0.839 ***1.000
6 GTN0.239 ***0.236 ***0.325 ***0.176 ***0.302 ***1.000
7 GIQ0.254 ***0.248 ***0.375 ***0.195 ***0.339 ***0.774 ***1.000
t standard errors in parentheses, *** p < 0.01.
Table 4. Regression results.
(1)(2)(3)(4)
VariablesGTGTGTGT
Dig0.302 ***
(0.088)
Intel 0.255 ***
(0.050)
Infor 0.364 ***
(0.050)
Inter 0.163 ***
(0.024)
ControlYesYesYesYes
YearYesYesYesYes
IndustryYesYesYesYes
_cons−13.906 ***−13.091 ***−13.696 ***−13.720 ***
(0.754)(0.707)(0.704)(0.711)
N3140314031413138
r20.2890.2920.2980.296
t standard errors in parentheses, *** p < 0.01.
Table 5. The mediating effect of green innovation.
(1)(2)(3)(4)(5)(6)(7)(8)
VariablesL.GIGTL.GIGTL.GIGTL.GIGT
Dig0.187 ***0.239 **
(0.054)(0.096)
Intel 0.231 ***0.231 ***
(0.027)(0.057)
Infor 0.061 **0.375 ***
(0.029)(0.056)
Inter 0.088 ***0.154 ***
(0.012)(0.027)
L.GIN 0.116 *** 0.095 ** 0.112 *** 0.092 **
(0.042) (0.042) (0.042) (0.042)
ControlYesYesYesYesYesYesYesYes
YearYesYesYesYesYesYesYesYes
IndustryYesYesYesYesYesYesYesYes
_cons−9.002 ***−12.861 ***−8.465 ***−12.394 ***−8.716 ***−12.838 ***−8.776 ***−12.959 ***
(0.443)(0.916)(0.429)(0.859)(0.434)(0.852)(0.431)(0.865)
N26092609260926092611261126082608
r20.4110.2940.4250.2970.4120.3050.4160.301
t standard errors in parentheses, ** p < 0.05, *** p < 0.01.
Table 6. The moderating effect of environmental regulation.
(1)(2)(3)(4)(5)(6)(7)(8)
VariablesGTGTGTGTGTGTGTGT
Dig0.323 ***0.329 ***
(0.098)(0.098)
Intel 0.288 ***0.288 ***
(0.057)(0.057)
Infor 0.360 ***0.373 ***
(0.055)(0.055)
Inter 0.172 ***0.175 ***
(0.027)(0.027)
Dig * ER 2.098 *
(1.253)
Intel * ER 1.471 *
(0.769)
Infor * ER 1.501 *
(0.769)
Inter * ER 0.767 **
(0.354)
ER1.197 **1.156 **1.140 *1.137 *1.086 *1.075 *1.139 *1.126 *
(0.592)(0.589)(0.594)(0.591)(0.587)(0.582)(0.589)(0.583)
ControlYesYesYesYesYesYesYesYes
YearYesYesYesYesYesYesYesYes
IndustryYesYesYesYesYesYesYesYes
_cons−14.581 ***−14.619 ***−13.718 ***−13.778 ***−14.353 ***−14.374 ***−14.420 ***−14.494 ***
(0.859)(0.861)(0.799)(0.801)(0.797)(0.797)(0.806)(0.807)
N24792479247924792480248024772477
r20.2820.2830.2860.2870.2910.2920.2900.292
t standard errors in parentheses, * p < 0.1, ** p < 0.05, *** p < 0.01.
Table 7. The moderating effect of environmental protection tax.
(1)(2)(3)(4)(5)(6)(7)(8)
VariablesL.GINL.GINL.GINL.GINL.GINL.GINL.GINL.GIN
Dig0.1210.129 *
(0.075)(0.075)
Intel 0.216 ***0.238 ***
(0.044)(0.046)
Infor 0.104 **0.099 *
(0.052)(0.051)
Inter 0.077 ***0.080 ***
(0.022)(0.022)
Dig * EPT 0.049 **
(0.020)
Intel * EPT 0.051 ***
(0.013)
Infor * EPT 0.039 ***
(0.014)
Inter * EPT 0.022 ***
(0.006)
EPT0.005−0.0040.0130.0020.004−0.0000.007−0.003
(0.017)(0.017)(0.016)(0.016)(0.017)(0.016)(0.017)(0.017)
ControlYesYesYesYesYesYesYesYes
YearYesYesYesYesYesYesYesYes
IndustryYesYesYesYesYesYesYesYes
_cons−8.373 ***−8.337 ***−7.776 ***−7.594 ***−8.179 ***−8.149 ***−8.185 ***−8.092 ***
(0.834)(0.828)(0.808)(0.779)(0.817)(0.802)(0.813)(0.790)
N666666666666666666666666
r20.4220.4270.4360.4480.4240.4310.4300.441
t standard errors in parentheses, * p < 0.1, ** p < 0.05, *** p < 0.01.
Table 8. The moderating effect before and after 2018.
After 2018Before 2018
VariablesL.GINL.GINL.GINL.GINL.GINL.GINL.GINL.GIN
Dig0.340 *** 0.083
(0.118) (0.139)
Intel 0.432 *** 0.068
(0.073) (0.107)
Infor 0.182 ** 0.034
(0.081) (0.078)
Inter 0.163 *** 0.038
(0.035) (0.035)
Dig * EPT0.120 *** 0.052
(0.035) (0.049)
Intel * EPT 0.106 *** 0.071
(0.019) (0.046)
Infor * EPT 0.074 *** 0.041
(0.022) (0.026)
Inter * EPT 0.047 *** 0.022
(0.010) (0.014)
EPT−0.012−0.000−0.006−0.0100.0240.0240.0320.027
(0.021)(0.020)(0.020)(0.021)(0.033)(0.031)(0.034)(0.034)
ControlYesYesYesYesYesYesYesYes
YearYesYesYesYesYesYesYesYes
IndustryYesYesYesYesYesYesYesYes
_cons−9.306 ***−8.255 ***−8.717 ***−9.002 ***−6.171 ***−4.807 ***−5.926 ***−5.639 ***
(0.987)(0.931)(0.938)(0.929)(1.598)(1.398)(1.608)(1.515)
N494494494494172172172172
r20.4690.4930.4700.4890.4690.5060.4720.491
t standard errors in parentheses, ** p < 0.05, *** p < 0.01.
Table 9. Regression results of ownership.
State-Owned EnterprisesNon-State-Owned Enterprises
VariablesGTGTGTGTGTGTGTGT
Dig0.175 0.457 ***
(0.144) (0.109)
Intel 0.250 *** 0.272 ***
(0.082) (0.062)
Infor 0.426 *** 0.335 ***
(0.086) (0.060)
Inter 0.158 *** 0.180 ***
(0.039) (0.030)
ControlYesYesYesYesYesYesYesYes
YearYesYesYesYesYesYesYesYes
IndustryYesYesYesYesYesYesYesYes
_cons−15.027 ***−14.571 ***−15.576 ***−15.448 ***−11.910 ***−10.825 ***−11.507 ***−11.322 ***
(1.206)(1.083)(1.076)(1.096)(0.989)(0.960)(0.965)(0.964)
N15011501150115011639163916401637
r20.3040.3080.3160.3110.2580.2580.2640.265
t standard errors in parentheses, *** p < 0.01.
Table 10. Regression results of geographical distribution.
EastCentralWest
VariablesGTGTGTGTGTGTGTGTGTGTGTGT
Dig0.391 *** 0.161 −0.049
(0.122) (0.197) (0.287)
Intel 0.284 *** 0.106 0.149
(0.066) (0.115) (0.183)
Infor 0.476 *** 0.080 0.446 ***
(0.065) (0.124) (0.164)
Inter 0.205 *** 0.058 0.140
(0.032) (0.055) (0.087)
ControlYesYesYesYesYesYesYesYesYesYesYesYes
YearYesYesYesYesYesYesYesYesYesYesYesYes
IndustryYesYesYesYesYesYesYesYesYesYesYesYes
_cons−15.423 ***−14.228 ***−14.729 ***−14.663 ***−7.374 ***−7.011 ***−7.530 ***−7.579 ***−13.418 ***−13.859 ***−14.485 ***−14.578 ***
(1.086)(1.055)(1.049)(1.051)(1.584)(1.524)(1.605)(1.588)(2.305)(2.096)(2.022)(2.075)
N1549154915511548661661660660415415415415
r20.3450.3480.3620.3570.3030.3040.3030.3030.4530.4540.4670.458
t standard errors in parentheses, *** p < 0.01.
Table 11. Regression results of high-tech and non-high-tech industries.
High-TechNon-High-Tech
VariablesGTGTGTGTGTGTGTGT
Dig0.410 *** 0.135
(0.122) (0.132)
Intel 0.387 *** 0.118
(0.071) (0.075)
Infor 0.475 *** 0.243 ***
(0.070) (0.076)
Inter 0.224 *** 0.094 **
(0.033) (0.037)
ControlYesYesYesYesYesYesYesYes
YearYesYesYesYesYesYesYesYes
IndustryYesYesYesYesYesYesYesYes
_cons−11.047 ***−9.953 ***−10.607 ***−10.549 ***−14.803 ***−14.438 ***−14.851 ***−14.863 ***
(1.055)(1.033)(1.017)(1.033)(1.058)(0.968)(0.965)(0.978)
N14901490149114881650165016501650
r20.2150.2240.2320.2310.3500.3510.3540.352
t standard errors in parentheses, ** p < 0.05, *** p < 0.01.
Table 12. Endogenous tests.
(1)(2)(3)(4)(5)(6)(7)(8)
GTGTGTGTGTGTGTGT
Dig0.277 ***0.302 ***
(3.13)(3.45)
Intel 0.250 ***0.257 ***
(4.96)(5.10)
Infor 0.357 ***0.365 ***
(7.11)(7.28)
Inter 0.158 ***0.164 ***
(6.56)(6.80)
ControlYesYesYesYesYesYesYesYes
YearYesYesYesYesYesYesYesYes
IndustryYesYesYesYesYesYesYesYes
IMR1−1.003 **
(−2.54)
IMR2 −0.056
(−0.08)
IMR3 −1.593 **
(−2.14)
IMR4 0.362
(0.48)
IMR5 −1.390 **
(−2.37)
IMR6 0.298
(0.46)
IMR7 −1.097 **
(−2.34)
IMR8 0.277
(0.44)
_cons−10.318 ***−13.710 ***−7.008 **−14.482 ***−10.043 ***−14.485 ***−9.764 ***−14.717 ***
(−6.32)(−5.61)(−2.37)(−4.81)(−5.87)(−7.94)(−5.22)(−6.14)
N31403140314031403141314131383138
t standard errors in parentheses, ** p < 0.05, *** p < 0.01.
Table 13. Robustness tests excluding C39 industry and heavily polluting industries.
Excluding
C39 Industry
Excluding
Heavily Polluting Industries
(1)(2)(3)(4)(1)(2)(3)(4)
VariablesGTGTGTGTGTGTGTGT
Dig0.367 *** 0.177 *
(0.097) (0.101)
Intel 0.285 *** 0.240 ***
(0.055) (0.057)
Infor 0.395 *** 0.254 ***
(0.055) (0.059)
Inter 0.184 *** 0.129 ***
(0.027) (0.028)
ControlYesYesYesYesYesYesYesYes
YearYesYesYesYesYesYesYesYes
IndustryYesYesYesYesYesYesYesYes
_cons−14.473 ***−13.441 ***−14.061 ***−14.136 ***−13.780 ***−13.297 ***−13.923 ***−13.861 ***
(0.812)(0.754)(0.751)(0.757)(0.933)(0.882)(0.884)(0.893)
N28052805280628032133213321342131
r20.2980.3010.3070.3070.2510.2560.2570.257
t standard errors in parentheses, * p < 0.1, *** p < 0.01.
Disclaimer/Publisher’s Note: The statements, opinions and data contained in all publications are solely those of the individual author(s) and contributor(s) and not of MDPI and/or the editor(s). MDPI and/or the editor(s) disclaim responsibility for any injury to people or property resulting from any ideas, methods, instructions or products referred to in the content.

