Advanced Forecasting Modeling to Early Predict Powdery Mildew First Appearance in Different Vines Cultivars


 , ,
, ,  , ,
, ,  , ,
, ,
Abstract
1. Introduction
2. Materials and Methods
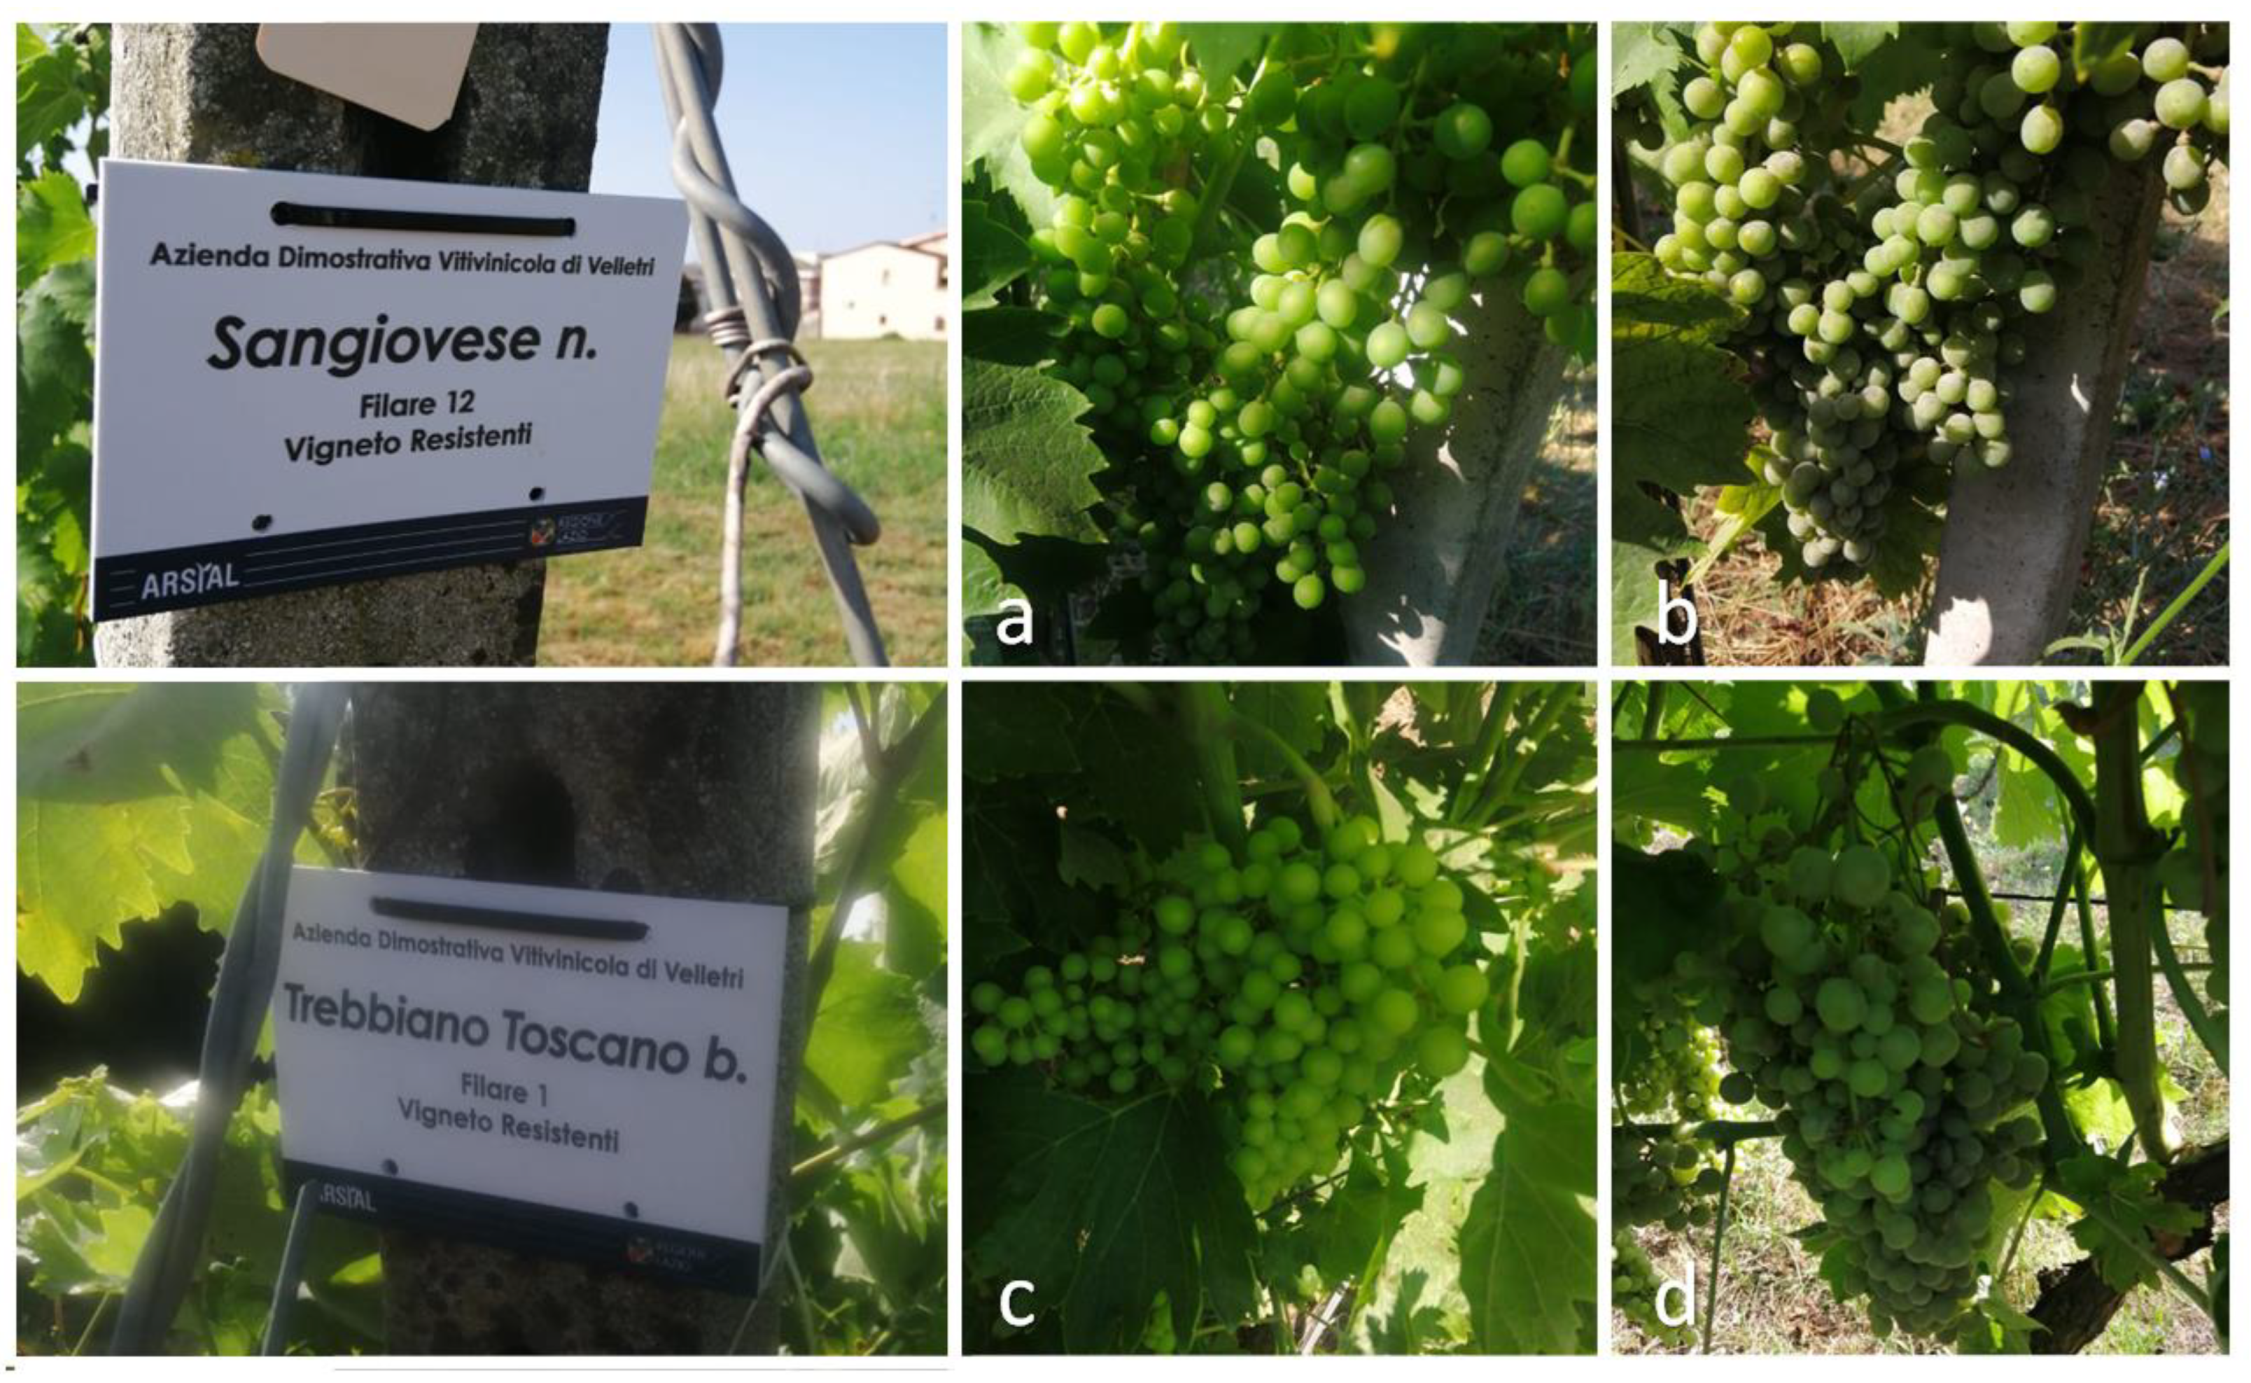
2.1. Experimental Design and Plant Materials
2.2. Climatic Data
2.3. Predictive Model Description
2.4. Barry Quality Evaluation
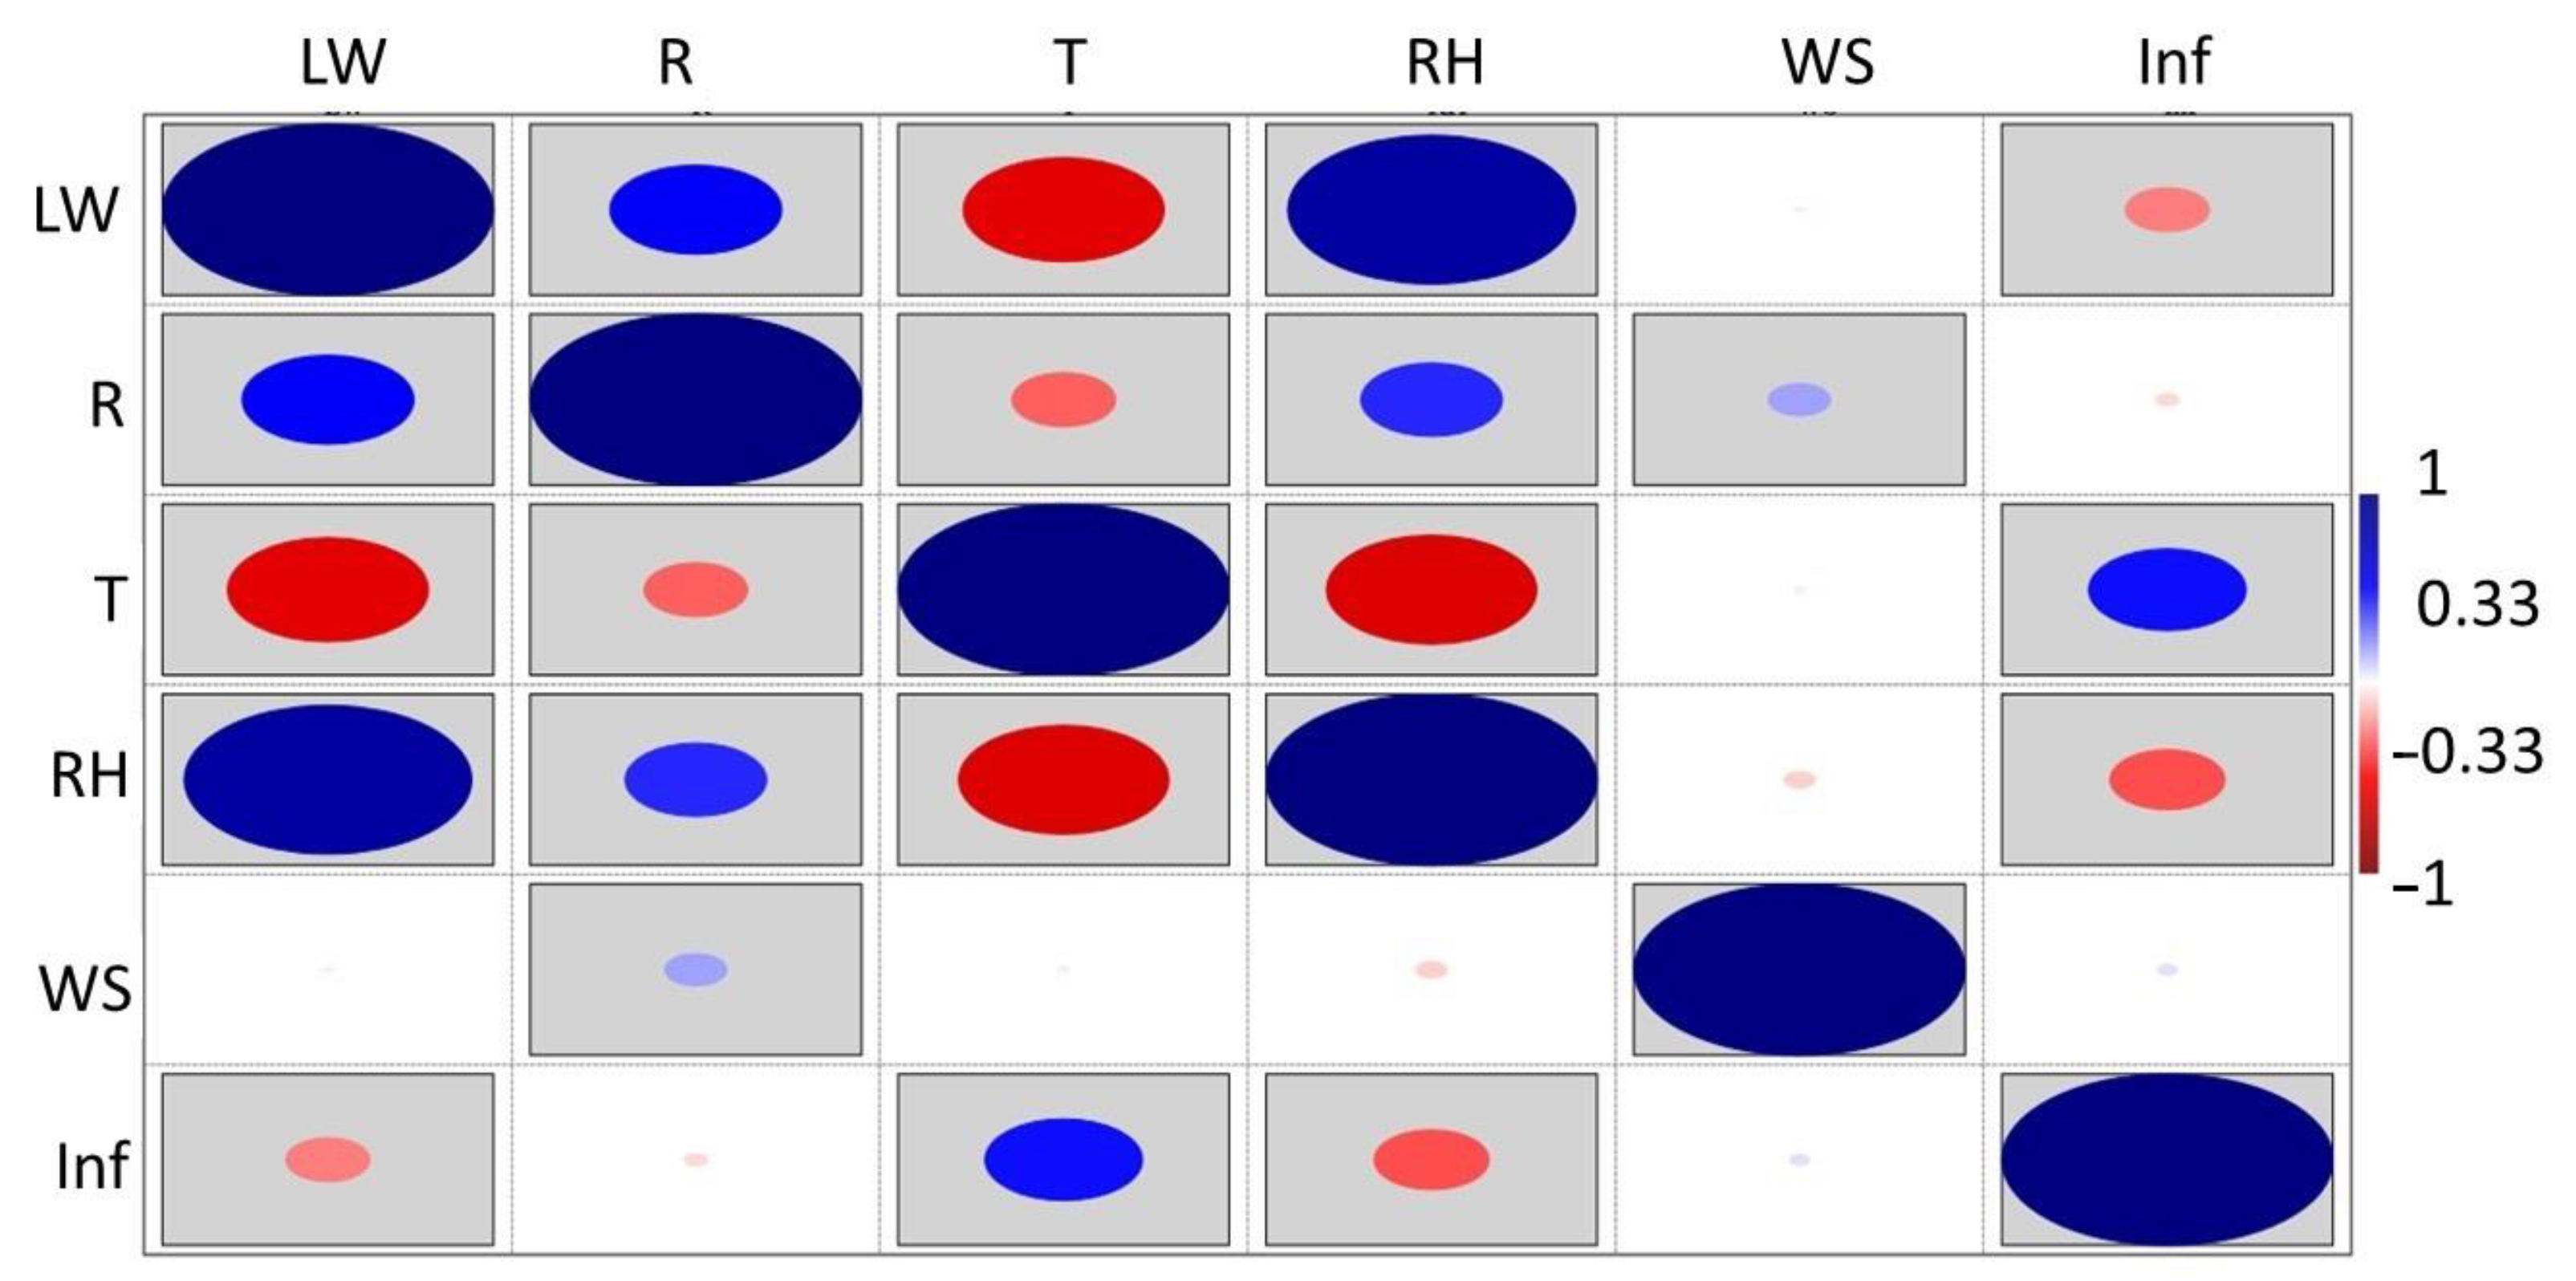
2.5. Statistical Analyses
3. Results
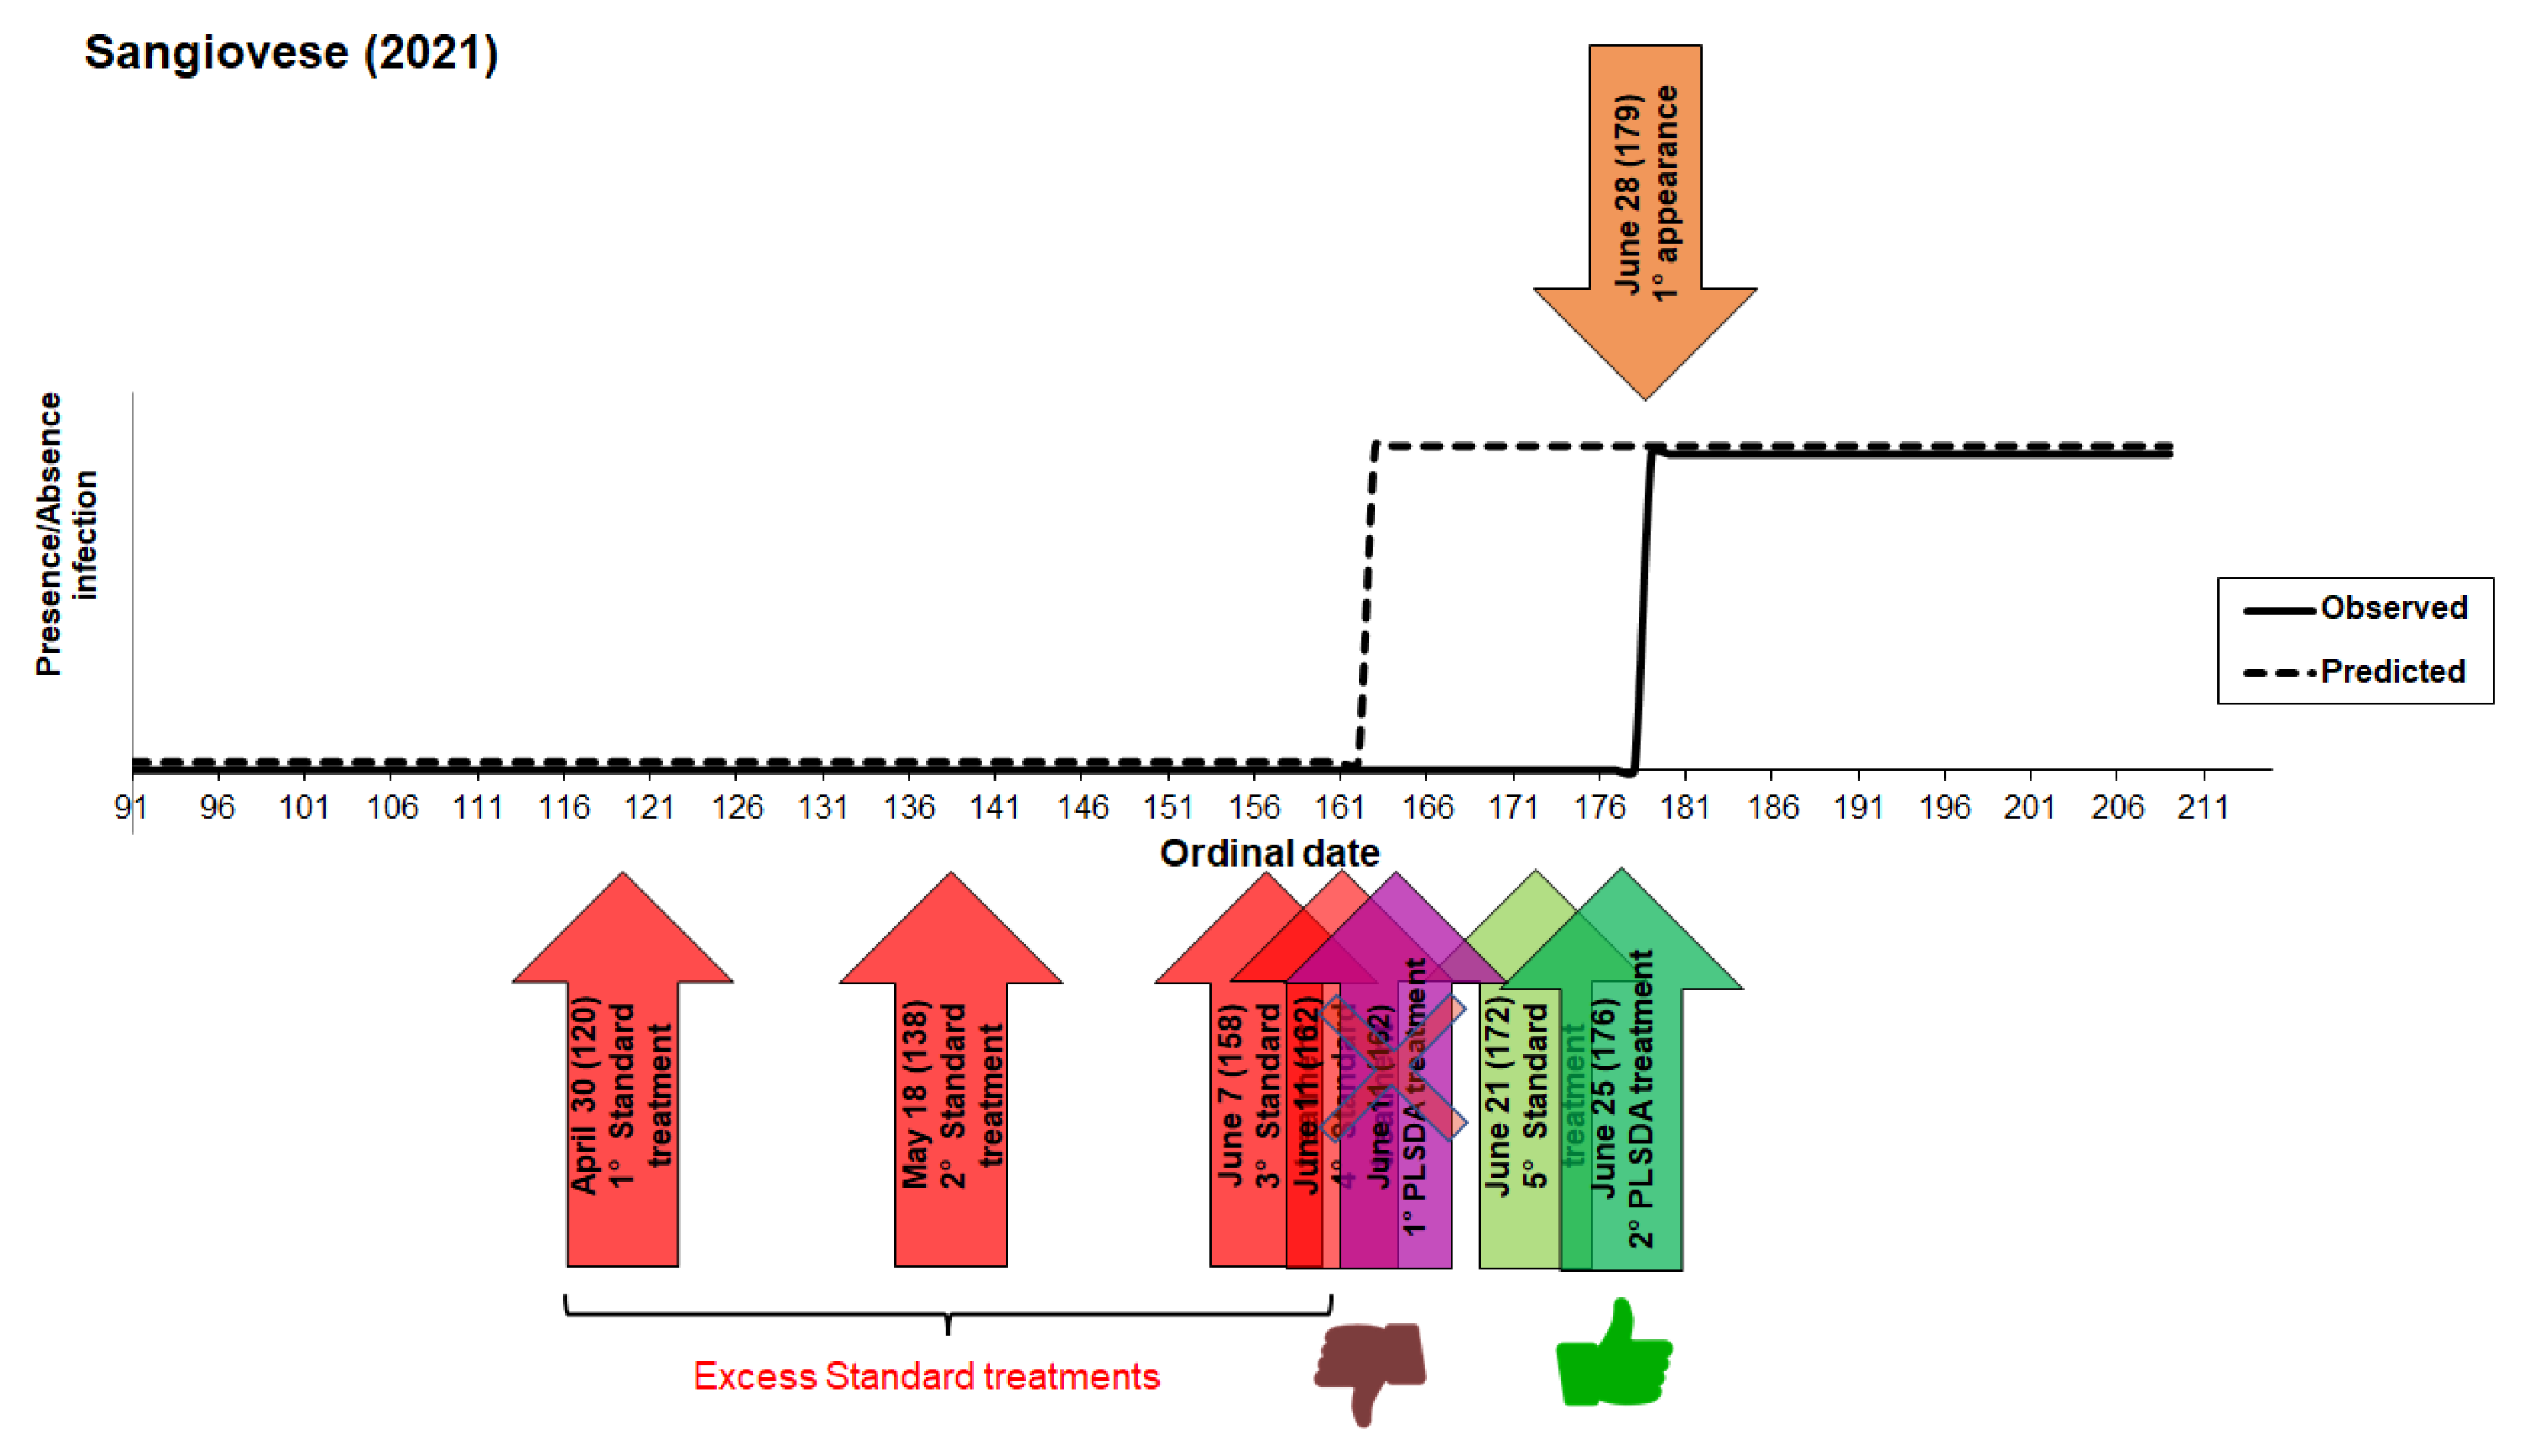
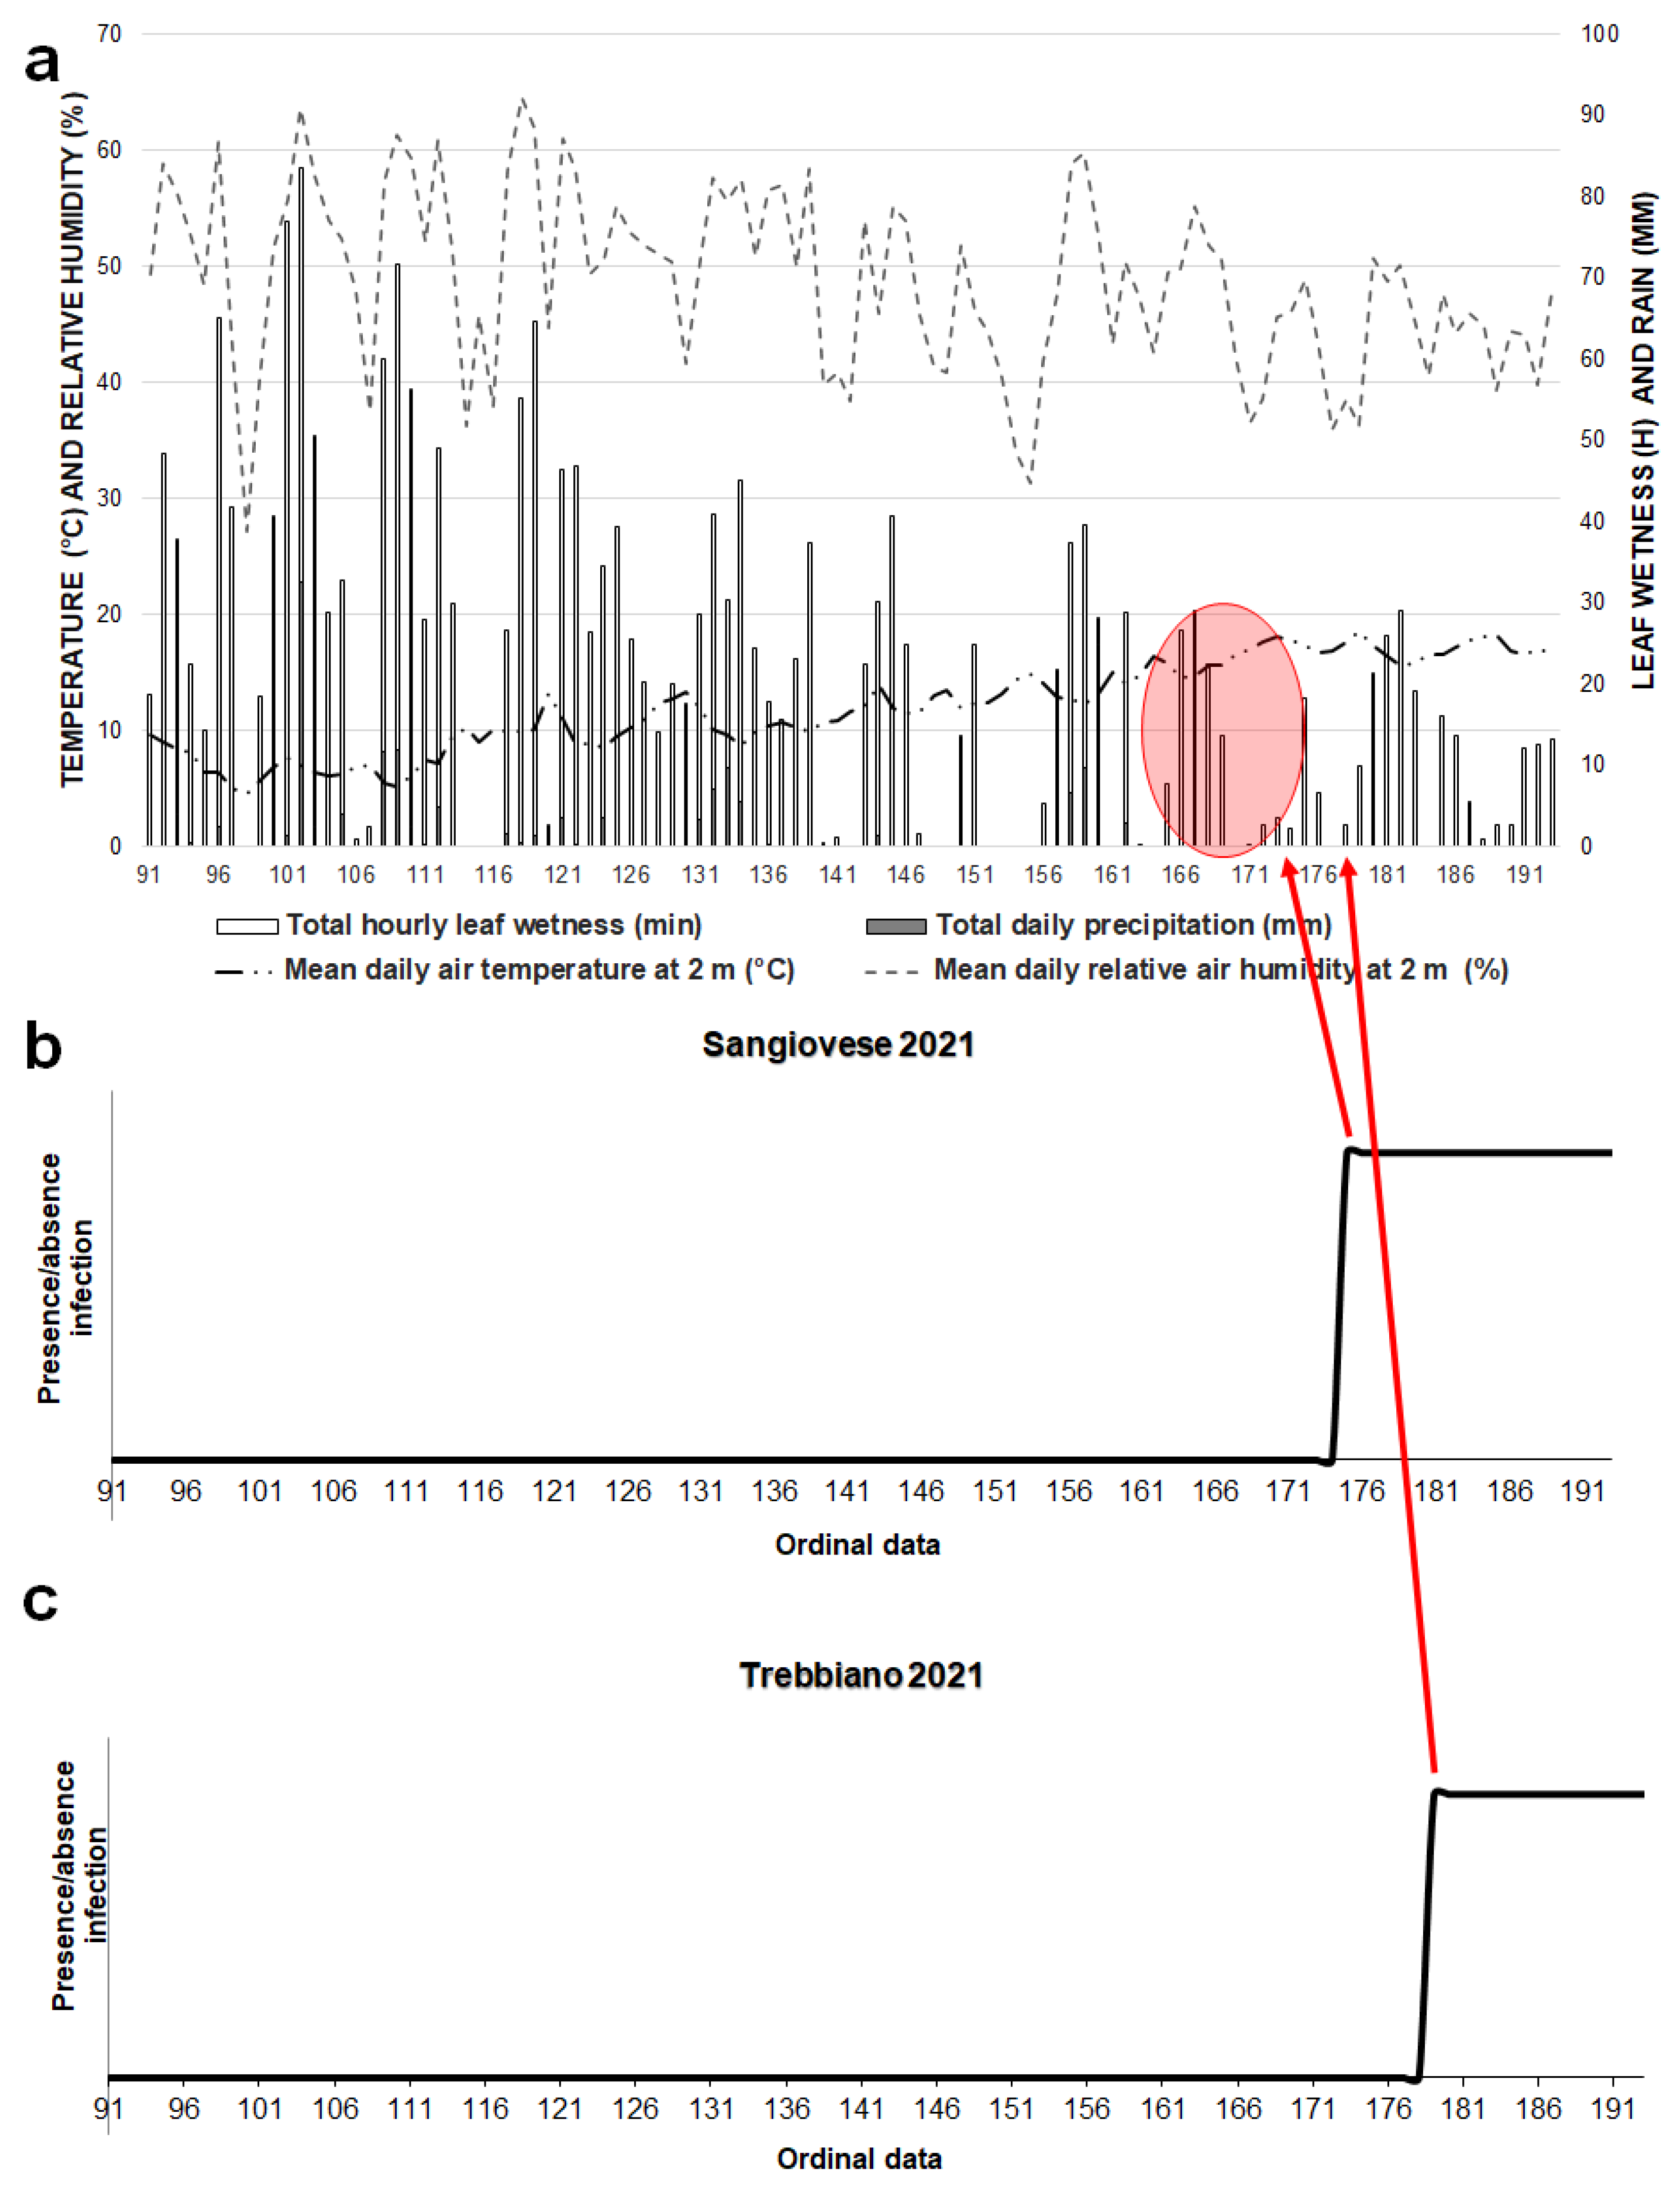
3.1. Model 2021
3.2. Model 2022
3.3. Powdery Mildew Disease Determination
3.4. Quality Assessment
4. Discussion
5. Conclusions
Author Contributions
Funding
Institutional Review Board Statement
Informed Consent Statement
Data Availability Statement
Conflicts of Interest
References
- Jaillon, O.; Aury, J.M.; Noel, B.; Policriti, A.; Clepet, C.; Casagrande, A.; Choisne, N.; Aubourg, S.; Vitulo, N.; Jubin, C.; et al. French-Italian Public Consortium for Grapevine Genome Characterization. The grapevine genome sequence suggests ancestral hexaploidization in major angiosperm phyla. Nature 2007, 449, 463–467. [Google Scholar] [PubMed]
- Gao, Y.R.; Han, Y.T.; Zhao, F.L.; Li, Y.J.; Cheng, Y.; Ding, Q.; Wang, Y.J.; Wen, Y.Q. Identification and utilization of a new Erysiphe necator isolate NAFU1 to quickly evaluate powdery mildew resistance in wild Chinese grapevine species using detached leaves. Plant Physiol. Biochem. 2016, 98, 12–24. [Google Scholar] [CrossRef] [PubMed]
- Pirrello, C.; Mizzotti, C.; Tomazetti, T.C.; Colombo, M.; Bettinelli, P.; Prodorutti, D.; Peressotti, E.; Zulini, L.; Stefanini, M.; Angeli, G.; et al. Emergent Ascomycetes in Viticulture: An Interdisciplinary Overview. Front. Plant Sci. 2019, 10, 1394. [Google Scholar] [CrossRef] [PubMed]
- Jones, L.; Riaz, S.; Morales-Cruz, A.; Amrine, K.C.; McGuire, B.; Gubler, W.D.; Walker, M.A.; Cantu, D. Adaptive genomic structural variation in the grape powdery mildew pathogen, Erysiphe necator. BMC Genom. 2014, 15, 1018. [Google Scholar] [CrossRef] [PubMed]
- Breia, R.M.G.; Conde, A.; Pimentel, D.; Conde, C.; Fortes, A.M.; Granell, A.; Gerós, H. VvSWEET7 Is a Mono- and Disaccharide Transporter Up-Regulated in Response to Botrytis cinerea Infection in Grape Berries. Front. Plant Sci. 2020, 10, 1753. [Google Scholar] [CrossRef] [PubMed]
- Fedorina, J.; Tikhonova, N.; Ukhatova, Y.; Ivanov, R.; Khlestkina, E. Grapevine Gene Systems for Resistance to Gray Mold Botrytis cinerea and Powdery Mildew Erysiphe necator. Agronomy 2022, 12, 499. [Google Scholar] [CrossRef]
- Stummer, B.E.; Francis, I.L.; Zanker, T.; Lattey, K.A.; Scott, E.S. Effects of powdery mildew on the sensory properties and composition of Chardonnay juice and wine when grape sugar ripeness is standardised. Aust. J. Grape Wine Res. 2005, 11, 66–76. [Google Scholar] [CrossRef]
- Cortesi, P.; Ottaviani, M.-P.; Milgroom, M.G. Spatial and Genetic Analysis of a Flag Shoot Subpopulation of Erysiphe necator in Italy. Phytopathology 2004, 94, 544–550. [Google Scholar] [CrossRef]
- Vallejo, A.; Millán, L.; Abrego, Z.; Sampedro, M.C.; Sánchez-Ortega, A.; Unceta, N.; Gómez-Caballero, A.; Goicolea, M.A.; Diez-Navajasc, A.M.; Barrio, R.J. Fungicide distribution in vitiviniculture ecosystems according to different application strategies to reduce environmental impact. Sci. Total. Environ. 2019, 687, 319–329. [Google Scholar] [CrossRef]
- Kunova, A.; Pizzatti, C.; Saracchi, M.; Pasquali, M.; Cortesi, P. Grapevine Powdery Mildew: Fungicides for Its Management and Advances in Molecular Detection of Markers Associated with Resistance. Microorganisms 2021, 9, 1541. [Google Scholar] [CrossRef]
- Vielba-Fernández, A.; Polonio, Á.; Ruiz-Jiménez, L.; de Vicente, A.; Pérez-García, A.; Fernández-Ortuño, D. Fungicide Resistance in Powdery Mildew Fungi. Microorganisms 2020, 8, 1431. [Google Scholar] [PubMed]
- Redl, M.; Sitavanc, L.; Hanousek, F.; Steinkellner, S. A single out-of-season fungicide application reduces the grape powdery mildew inoculum. Crop Prot. 2021, 149, 105760. [Google Scholar] [CrossRef]
- Velasquez-Camacho, L.; Otero, M.; Basile, B.; Pijuan, J.; Corrado, G. Current Trends and Perspectives on Predictive Models for Mildew Diseases in Vineyards. Microorganisms 2023, 11, 73. [Google Scholar] [CrossRef] [PubMed]
- Rodríguez, J.A.C.; González-Fernández, E.; Fernández-González, M.; Vázquez-Ruiz, R.A.; Aira, M.J. Fungal Diseases in Two North-West Spain Vineyards: Relationship with Meteorological Conditions and Predictive Aerobiological Model. Agronomy 2020, 10, 219. [Google Scholar] [CrossRef]
- Piccirillo, G.; Tarantino, P.; Carrieri, R.; Cermola, M.; Lahoz, E.; Polizzi, G. Strategies against early infections of grape powdery mildew. L’Informatore Agrar. 2017, 73, 57–61. [Google Scholar]
- Cecchini, F.; Serra, M.C.; Bevilacqua, N.; Costa, C.; Valori, R.; Pallottino, F.; Casadei, G.; Menesatti, P.; Antonucci, F. Advanced Modeling for the Identification of Different Pathogen Tolerant Vines to Reduce Fungicides and Energy Consumption. Sustainability 2020, 12, 1900. [Google Scholar] [CrossRef]
- Stauss, R. Compendium of Growth Stage Identification Keys of Mono- and Dicotyledonous Plants: Extended BBCH Scale; Ciba-Geigy AG: Basel, Switzerland, 1994. [Google Scholar]
- Calonnec, A.; Cartolaro, P.; Bailey, D.; Langlais, M.; Naulin, J.-M. A host-pathogen simulation model: Powdery mildew of grapevine. Plant Pathol. 2008, 57, 493–508. [Google Scholar] [CrossRef]
- Gadoury, D.M.; Cadle-Davidson, L.; Wilcox, W.F.; Dry, I.B.; Seem, R.C.; Milgroom, M.G. Grapevine powdery mildew (Erysiphe necator): A fascinating system for the study of the biology, ecology and epidemiology of an obligate biotroph. Mol. Plant Pathol. 2012, 13, 1–16. [Google Scholar] [CrossRef]
- Piña-Rey, A.; González-Fernández, E.; Fernández-González, M.; Lorenzo, M.N.; Rodríguez-Rajo, F.J. Climate Change Impacts Assessment on Wine-Growing Bioclimatic Transition Areas. Agriculture 2020, 10, 605. [Google Scholar] [CrossRef]
- Menesatti, P.; Antonucci, F.; Costa, C.; Mandalà, C.; Battaglia, V.; La Torre, A. Multivariate forecasting model to optimize management of grape downy mildew control. Vitis 2013, 52, 141–148. [Google Scholar]
- Lessio, F.; Alma, A. Models Applied to Grapevine Pests: A Review. Insects 2021, 12, 169. [Google Scholar] [CrossRef] [PubMed]
- Ceccarelli, D.; Antonucci, F.; Costa, C.; Talento, C.; Ciccoritti, R. An artificial class modelling approach to identify the most largely diffused cultivars of sweet cherry (Prunus avium L.) in Italy. Food Chem. 2020, 333, 127515. [Google Scholar] [CrossRef] [PubMed]
- Hammer, Ø.; Harper, D.A.; Ryan, P.D. PAST: Paleontological statistics software package for education and data analysis. Palaeontol. Electron. 2001, 4, 9. [Google Scholar]
- Fernández-González, M.; Rodríguez-Rajo, F.J.; Escuredo, O.; Aira, M.J. Optimization of integrated pest management for powdery mildew (Unincula necator) control in a vineyard based on a combination of phenological, meteorological and aero-biological data. J. Agric. Sci. 2013, 151, 648–658. [Google Scholar]
- Gadoury, D.M.; Seem, R.C.; Ficke, A.; Wilcox, W.F. Ontogenic Resistance to Powdery Mildew in Grape Berries. Phytopathology 2003, 93, 547–555. [Google Scholar] [CrossRef]
- Gaforio, L.; Garcia-Munoz, S.; Cabello, F.; Munoz-Organero, G. Evaluation of susceptibility to powdery mildew (Erysiphe necator) in Vitis vinifera varieties. Vitis 2011, 50, 123–126. [Google Scholar]
- Wicks, T.J.; Magarey, R.D.; Cirami, R.M. Susceptibility of grapevine cultivars to powdery mildew-Nuriootpa 1991-92. Aust. Grapegrow. Winemak. 1993, 352, 101–102. [Google Scholar]
- Pimentel, D.; Amaro, R.; Erban, A.; Mauri, N.; Soares, F.; Rego, C.; Martínez-Zapater, J.M.; Mithöfer, A.; Kopka, J.; Fortes, A.M. Transcriptional, hormonal, and metabolic changes in susceptible grape berries under powdery mildew infection. J. Exp. Bot. 2021, 72, 6544–6569. [Google Scholar] [CrossRef]
- Keller, M.; Rogiers, S.Y.; Schultz, H.R. Nitrogen and ultraviolet radiation modify grapevines’ susceptibility to powdery mildew. Vitis 2003, 42, 87–94. [Google Scholar]
- Petrovic, T.; Perera, D.; Cozzolino, D.; Kravchuk, O.; Zanker, T.; Bennett, J.; Scott, E.S. Feasibility of discriminating powdery mildew-affected grape berries at harvest using mid-infrared attenuated total reflection spectroscopy and fatty acid profiling. Aust. J. Grape Wine Res. 2017, 23, 415–425. [Google Scholar] [CrossRef]
- Porep, J.U.; Erdmann, M.E.; Körzendörfer, A.; Kammerer, D.R.; Carle, R. Rapid determination of ergosterol in grape mashes for grape rot indication and further quality assessment by means of an industrial near infrared/visible (NIR/VIS) spectrometer–A feasibility study. Food Control 2014, 43, 142–149. [Google Scholar] [CrossRef]
- Agudelo-Romero, P.; Erban, A.; Rego, C.; Carbonell-Bejerano, P.; Nascimento, T.; Sousa, L.; Martinez-Zapater, J.M.; Kopka, J.; Fortes, A.M. Transcriptome and metabolome reprogramming in Vitis vinifera cv. Trincadeira berries upon infection with Botrytis cinerea. J. Exp. Bot. 2015, 66, 1769–1785. [Google Scholar] [CrossRef] [PubMed]
- Bellincontro, A.; De Santis, D.; Botondi, R.; Villa, I.; Mencarelli, F. Different postharvest dehydration rates affect quality characteristics and volatile compounds of Malvasia, Trebbiano and Sangiovese grapes for wine production. J. Sci. Food Agric. 2004, 84, 1791–1800. [Google Scholar] [CrossRef]
- Matera, A.; Genovese, F.; Altieri, G.; Tauriello, A.; Di Renzo, G.C. Effects on must quality produced from sangiovese and cabernet grape frozen/withered using a forced air plant. Chem. Eng. Trans. 2017, 58, 343–348. [Google Scholar]
- Cecchini, F.; Morassut, M.; Saiz, J.-C.; Garcia-Moruno, E. Anthocyanins enhance yeast’s adsorption of Ochratoxin A during the alcoholic fermentation. Eur. Food Res. Technol. 2019, 245, 309–314. [Google Scholar] [CrossRef]
- Jarvis, W.R.; Gubler, W.D.; Grove, G.G. Epidemiology of powdery mildews in agricultural pathosystems. In The Powdery Mildews: A Comprehensive Treatise; Bélanger, R.R., Bushnell, W.R., Dik, A.J., Carver, T.L.W., Eds.; American Phytopathological Society: St. Paul, MN, USA, 2002; pp. 169–199. [Google Scholar]


| N. | Climatic Variables | Unit |
|---|---|---|
| 1 | Total hourly leaf wetness | min |
| 2 | Total daily leaf wetness | min |
| 3 | Daily evapotranspiration | mm |
| 4 | Total hourly precipitation | mm |
| 5 | Total daily precipitation | mm |
| 6 | Total hourly solar radiation | kJ/m2 |
| 7 | Daily thermal sum at 0° | °C |
| 8 | Daily thermal sum at 10° | °C |
| 9 | Minimum hourly air temperature at 2 m | °C |
| 10 | Maximum hourly air temperature at 2 m | °C |
| 11 | Mean hourly air temperature at 2 m | °C |
| 12 | Minimum daily air temperature at 2 m | °C |
| 13 | Maximum daily air temperature at 2 m | °C |
| 14 | Mean daily air temperature at 2 m | °C |
| 15 | Mean daily ground temperature at −30 cm | °C |
| 16 | Mean hourly ground temperature at −30 cm | °C |
| 17 | Minimum hourly relative humidity at 2 m | % |
| 18 | Maximum hourly relative air humidity at 2 m | % |
| 19 | Mean hourly relative air humidity at 2 m | % |
| 20 | Minimum daily relative air humidity at 2 m | % |
| 21 | Maximum daily relative air humidity at 2 m | % |
| 22 | Mean daily relative air humidity at 2 m | % |
| 23 | Mean hourly wind speed at 10 m | m/s |
| 24 | Mean daily wind speed at 10 m | m/s |
| Ordinal Date (DOY) | Mean Daily Air Temperature at 2 m (°C) | Mean Daily Relative Air Humidity at 2 m (%) | Total Daily Precipitation (mm) | Total Hourly Leaf Wetness (min) | ||
|---|---|---|---|---|---|---|
| 2019 | April | 91–120 | 12.42 | 73.27 | 93.20 | 603.58 |
| May | 121–152 | 13.31 | 82.59 | 215.40 | 903.17 | |
| June | 153–182 | 23.80 | 61.53 | 3.80 | 245.88 | |
| July | 183–193 | 25.60 | 61.44 | 19.00 | 62.08 | |
| 2021 | April | 91–120 | 10.99 | 73.72 | 81.40 | 719.17 |
| May | 121–152 | 15.81 | 72.38 | 35.00 | 499.71 | |
| June | 153–182 | 22.09 | 64.91 | 65.80 | 245.42 | |
| July | 183–193 | 24.12 | 63.58 | 0.00 | 89.29 | |
| 2022 | April | 91–120 | 12.20 | 67.73 | 67.40 | 462.06 |
| May | 121–152 | 19.18 | 62.41 | 16.40 | 312.83 | |
| June | 153–182 | 24.67 | 51.89 | 8.40 | 113.96 | |
| July | 183–193 | 25.77 | 49.67 | 17.20 | 37.67 |
Disclaimer/Publisher’s Note: The statements, opinions and data contained in all publications are solely those of the individual author(s) and contributor(s) and not of MDPI and/or the editor(s). MDPI and/or the editor(s) disclaim responsibility for any injury to people or property resulting from any ideas, methods, instructions or products referred to in the content. |
© 2023 by the authors. Licensee MDPI, Basel, Switzerland. This article is an open access article distributed under the terms and conditions of the Creative Commons Attribution (CC BY) license (https://creativecommons.org/licenses/by/4.0/).
Share and Cite
Valori, R.; Costa, C.; Figorilli, S.; Ortenzi, L.; Manganiello, R.; Ciccoritti, R.; Cecchini, F.; Morassut, M.; Bevilacqua, N.; Colatosti, G.; et al. Advanced Forecasting Modeling to Early Predict Powdery Mildew First Appearance in Different Vines Cultivars. Sustainability 2023, 15, 2837. https://doi.org/10.3390/su15032837
Valori R, Costa C, Figorilli S, Ortenzi L, Manganiello R, Ciccoritti R, Cecchini F, Morassut M, Bevilacqua N, Colatosti G, et al. Advanced Forecasting Modeling to Early Predict Powdery Mildew First Appearance in Different Vines Cultivars. Sustainability. 2023; 15(3):2837. https://doi.org/10.3390/su15032837
Chicago/Turabian StyleValori, Roberto, Corrado Costa, Simone Figorilli, Luciano Ortenzi, Rossella Manganiello, Roberto Ciccoritti, Francesca Cecchini, Massimo Morassut, Noemi Bevilacqua, Giorgio Colatosti, and et al. 2023. "Advanced Forecasting Modeling to Early Predict Powdery Mildew First Appearance in Different Vines Cultivars" Sustainability 15, no. 3: 2837. https://doi.org/10.3390/su15032837
APA StyleValori, R., Costa, C., Figorilli, S., Ortenzi, L., Manganiello, R., Ciccoritti, R., Cecchini, F., Morassut, M., Bevilacqua, N., Colatosti, G., Pica, G., Cedroni, D., & Antonucci, F. (2023). Advanced Forecasting Modeling to Early Predict Powdery Mildew First Appearance in Different Vines Cultivars. Sustainability, 15(3), 2837. https://doi.org/10.3390/su15032837