Essay

A Combinatorial Optimization Strategy for Performance Improvement of Stratum Ventilation Considering Outdoor Weather Changes and Metabolic Rate Differences: Energy Consumption and Sensitivity Analysis

1
School of Information and Control Engineering, Xi’an University of Architecture and Technology, Xi’an 710055, China
2
School of Science, Xi’an University of Architecture and Technology, Xi’an 710055, China
*
Author to whom correspondence should be addressed.
Sustainability 2023, 15(3), 2804; https://doi.org/10.3390/su15032804
Submission received: 22 December 2022 / Revised: 18 January 2023 / Accepted: 28 January 2023 / Published: 3 February 2023
(This article belongs to the Special Issue HVAC and Healthy Buildings)

Abstract

:
Since occupants spend most of their time indoors, an energy-saving and comfortable indoor environment are particularly important. The differences in the metabolic rate of occupants make them have different requirements for their thermal environment. To save energy under the comprehensive needs of occupants for thermal environment, the combinatorial optimization strategy based on NSGA-II and improved the TOPSIS method is proposed in this study. Firstly, the physical model of the CFD simulation is verified by experiments. Secondly, the specific operation cases corresponding to combinations of different levels of factors are determined via the RSM method, and the ventilation performance prediction model considering the metabolic rate differences and outdoor weather changes is established. Thirdly, supply air velocities and temperatures are optimized by using Pareto-based NSGA-II; the Pareto optimal solution set under different outdoor temperatures is obtained. Finally, based on the Pareto optimal solutions at different outdoor temperatures, the optimal strategy under dynamic outdoor air temperature is obtained by improved TOPSIS by the CRITIC method. The optimization of ventilation parameters significantly improved the ventilation performance, and the results show that the predicted mean vote, energy consumption, vertical air temperature difference between head and ankle levels and the local mean age of air for different metabolic rates decrease by 64.1%, 4.74%, 24.83% and 7.39% on average, respectively. Moreover, the relative energy saving rate increases as the metabolic rate increases, and the strategy facilitates adaptation to outdoor weather changes and meets the individual needs of occupants for the indoor environment. This has important implications for achieving the global goal of energy efficiency and emission reduction.

1. Introduction

Nowadays, more than 80% of people spend most of their time in office buildings, and the work efficiency of indoor personnel largely depends on their satisfaction with the indoor thermal environment [1,2]. However, creating a comfortable indoor thermal environment is based on a certain amount of system energy. According to statistics, 65% of the building energy consumption comes from the energy consumption of heating, ventilating and air conditioning (HVAC) [3]. Consequently, the optimal operation of the HVAC system is of great significance to energy conservation for buildings and indoor environment optimization.
In winter, the combination of supply air parameters and the air distribution system is widely used to meet the thermal requirements of occupants, while achieving energy savings. Common air distribution systems include displacement ventilation (DV) [4], mixed ventilation (MV) [5] and personalized ventilation (PV) [6]. The DV system is a ventilation method that sends air directly to the lower part of indoor personnel, and the MV system is a traditional ventilation method that supplies air directly from the top of the room. The PV systems refers to a ventilation system that arranges the air inlet near the occupant’s working area and delivers cold and warm air to the working area through control means. The stratum ventilation (SV) has the relevant characteristics of the PV systems, so it has a certain potential in improving the indoor thermal environment and saving energy. The SV systems can directly supply air to the occupants in the building, which can directly supply air to the occupants in the building and has the advantages of the small indoor vertical temperature difference and small supply air volume, and the principle of SV systems determines its applicability to winter heating [7]. Relevant research showed that the SV system can heat the occupied area more effectively than other ventilation systems and obtain a satisfactory draft rate (DR), vertical air temperature difference between ankle and head levels (°C) (ΔT) and predicted mean vote (PMV) [8]. Fong et al. [9] studied the energy consumption of different air distribution systems, and the experimental results showed that the energy consumption of the SV system was 9% and 12% lower than that of MV system and DV system, respectively. Moreover, the selection of appropriate supply air parameters is also important for the optimization of the performance of the air distribution system. Cheng et al. [10] optimized energy efficiency and thermal comfort by reasonably controlling indoor temperature and outdoor fresh air ratio and achieved good effect. Zhang and Wang et al. studied the ventilation performance of the SV system heating in winter, and the experimental results indicated that controlling supply air velocity and temperature can save energy and adapt to different thermal preferences [11,12]. Consequently, appropriate supply air parameters in the SV system can effectively improve indoor thermal environment and energy efficiency. In addition, the current climate change also brings some challenges, including the impact on crop production, social impact and economic impact. Relevant research also confirms that the corresponding energy saving options can effectively avoid the negative impact of climate change [13,14,15,16]. It is also necessary to adopt energy saving options in HVAC systems to cope with the challenges brought by climate change.
Moreover, the metabolic rate is also an important factor affecting the thermal comfort index. Relevant studies have confirmed that the difference in metabolic rate can significantly affect the thermal comfort index. In the previous process of optimizing supply air parameters, the metabolic rate was not taken into account as one of the indicators affecting ventilation performance. In this study, the metabolic rate was taken into account as a design parameter to optimize layer ventilation. Bai et al. [17] conducted an experiment to study the influence of the metabolic rate on local thermal sensations and overall thermal sensation and found that the thermal sensation of occupants with different metabolic rates were different. Wan et al. [18] showed that the difference between male and female metabolic rate was 1.22 W/m2 and, compared with the indoor air temperature required by the male group, the indoor air temperature required by the female group needs to be increased by 2.27 °C to maintain better thermal comfort, which required more energy. This indicated that considering the small difference in metabolic rates is necessary for building energy saving, and ventilation performance cannot be well optimized considering only one metabolic rate. In addition, the metabolic rate is affected by many parameters, such as age, gender and height of healthy occupants. Therefore, the actual metabolic rates are considered to be more beneficial to study thermal comfort than the assumed metabolic rate. Considering the difference in metabolic rates between healthy people and patients, there are two main methods to calculate their actual metabolic rates. For healthy people, considering the height, sex and age of sedentary healthy residents, the DuBois formula equation and the Harris-Benedict (H-B) equation were used to calculate metabolic rate [19,20,21,22]. For patients, the Ireton-Jones formula was used to obtain the metabolic rate of patients [23]. Therefore, to provide satisfactory thermal comfort for occupants and optimize energy consumption, the difference in metabolic rate shall be considered during ventilation operations.
Multiple ventilation parameters (i.e., the supply air velocity and the supply air temperature) of the SV system for heating nonlinearly determine the mutually conflicting criteria of air quality, energy efficiency and thermal comfort [24]. Previous research results revealed that multiobjective optimization algorithms could optimize environmental parameters and achieve good results [25,26,27]. Common multiobjective optimization algorithms include the nondominated sorting genetic algorithm-II (NSGA-II), simulated annealing algorithm and particle swarm optimization algorithm. Here, in this paper, the NSGA-II algorithm is applied to the optimization of supply air parameters in the SV system.

1.1. Research Tools and Methods

In this study, the Pareto-based NSGA-II is used for multiobjective optimization. When using the NSGA-II algorithm for multiobjective optimization, it is necessary to obtain the objective function of the corresponding objective. The response surface method (RSM) is one of the effective methods to construct its objective function and has high accuracy [28,29]. The RSM method is used to optimize the experimental scheme, which can reduce the cost of computational fluid dynamics (CFD) simulation. The optimization strategy put forward in this study is to consider the influence of different outdoor temperatures and metabolic rates and regulate the indoor thermal environment by integrating the data of outdoor temperatures and human metabolic rates. The purpose of this strategy is to improve the indoor environment and enhance the energy utilization efficiency. The research results show that the environmental comfort and energy utilization efficiency are significantly improved through optimization. This method can be combined with a building equipment automation system in the future to provide a better environment for indoor personnel. Compared with the traditional setting of static operating parameters, dynamic optimization, considering different outdoor temperatures and different metabolic rates, has better ventilation.

1.2. Organization of the Manuscript

The manuscript is organized as follows. In the Section 1, this paper discusses the importance of dynamically optimizing stratum ventilation parameters to achieve energy savings, explains the research question and briefly describes the contributions of solving the problem. The Section 2 discusses the dynamic energy optimization strategy based on the combination of NSGA-II and CRITIC-TOPSIS methods. The Section 3 compares the experimental data with the simulation data to prove the validity of the CFD model and analyzes the results of the parameter optimization. The Section 4 concludes this study and elaborates the research limitations.

2. Methodology

2.1. Evaluation Indices of Ventilation Performance
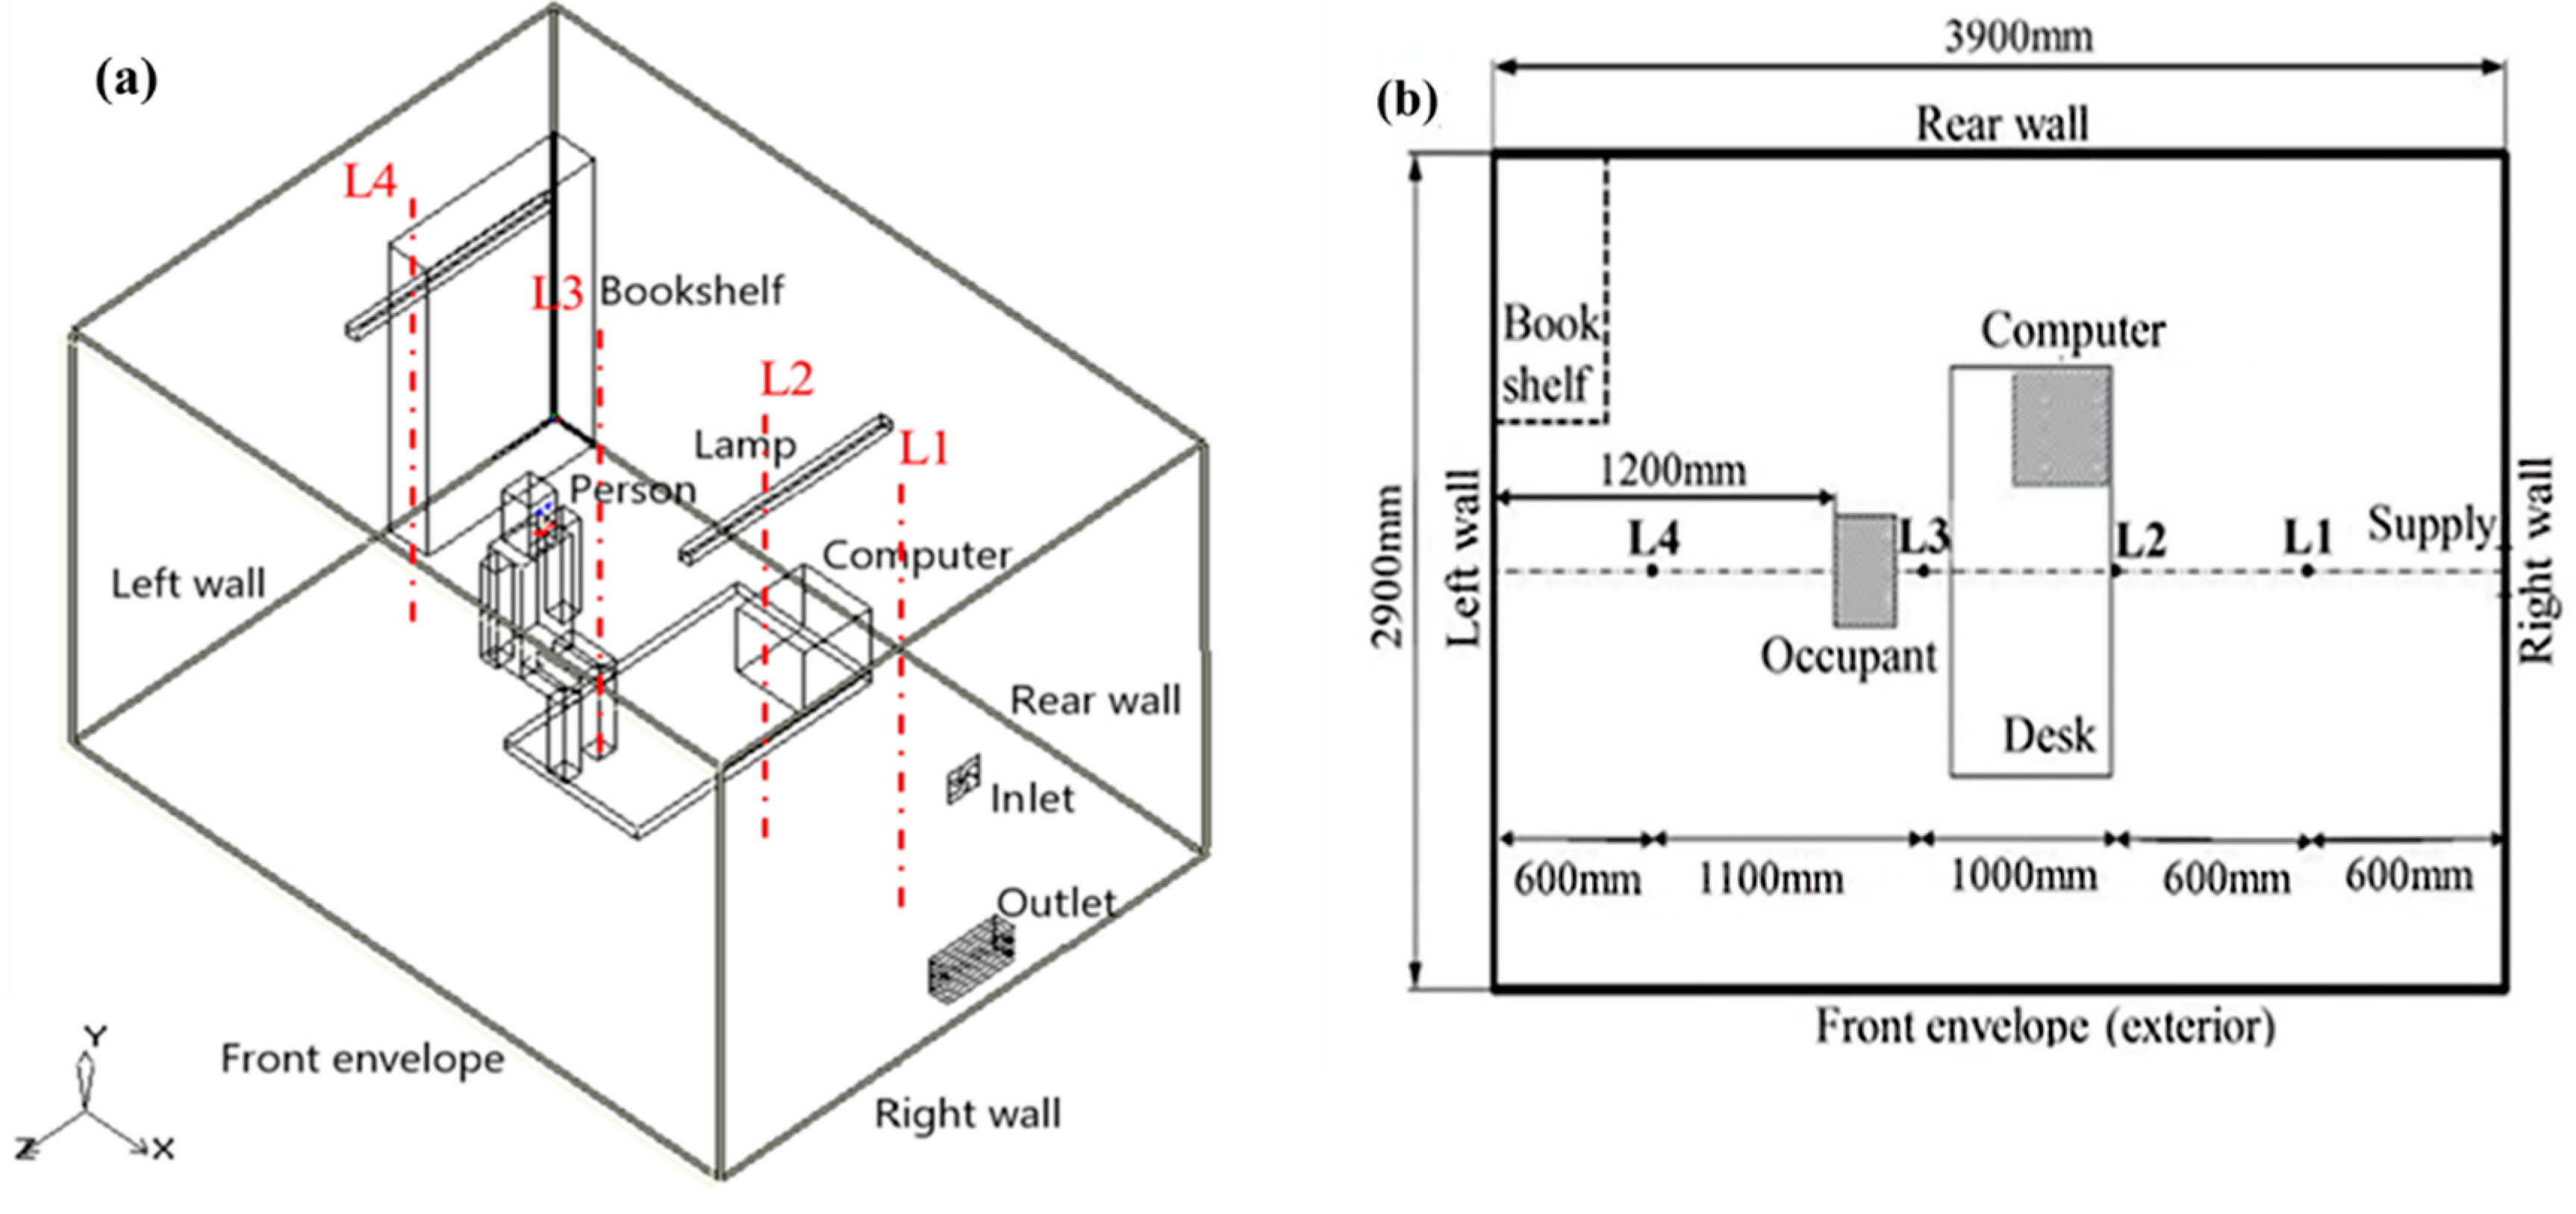
In this study, the relative operational energy consumption ( Q s ), vertical air temperature difference between ankle and head levels (ΔT), predicted mean vote (PMV) and local mean age of air (LMAA) are used to evaluate the ventilation performance. Among them, PMV is used to evaluate human thermal comfort, which is closely related to human metabolic level and heat loss, and its calculation follows Equation (1). As the PMV indicator does not represent everyone’s feelings, relevant researchers put forward the predicted percentage of dissatisfied (PPD) to represent the percentage of occupants who are dissatisfied with the indoor thermal environment for the total number of occupants [30]. The functional relationship between PPD and PMV is shown in Equation (2). Details of the PMV can be found in ASHRAE 55 [31].
P M V = [ 0.303 exp ( 0.036 M ) + 0.028 ] L
P P D = 100 95 × exp ( 0.00353 × P M V 4 0.2179 × P M V 2 )
where M is the metabolic rate of human body and L is regarded as the difference of the human thermal load between internal heat loss and heat production.
The LMAA indicates the “freshness” of air, representing the average lifetime of air at a particular location [32]. The ΔT is the air temperature difference between the ankle level and the head level [33], which can be used to estimate the local thermal comfort level. The Q s represents the relative operating energy consumption of the ventilation systems [34], and its calculation follows Equation (3).
Q s = c p ρ V ( T i T o u t )
where M is the metabolic rate of human body; L is regarded as the difference of the human thermal load between internal heat loss and heat production; P P D is predicted percentage of dissatisfied; Q s is relative operational energy consumption (W); ρ is air density (1.2021 kg/m3); C P is specific heat (1.004 J/kg·K); T i is the indoor air temperature (°C); T o u t is the outdoor air temperature (°C); and V is supply air flow rate (l/s).

2.2. Experiment

The experiment was conducted in a typical office (3.9 m (length) × 2.9 m (width) × 2.6 m (height)) in Xi’an, Shaanxi. The rectangular grille supply diffuser is located at 1.3 m on the right wall and the size is 0.2 m × 0.17 m. The perforated exhaust (0.6 m × 0.6 m) is located in the center of the ceiling and the size is 0.6 m × 0.6 m. The computer on the desk is simulated with a box of size 0.4 m × 0.4 m, which contains three 60 w light bulbs. The power of lamps on the ceiling is 72 W.
The experimental data are from another previous research project available in [8]. The supply air temperature, the supply vane angle and supply air velocity are 23 °C, 30° and 1.6 m/s, respectively. There were four sampling lines (i.e., L1, L2, L3 and L4), with sampling heights of 0.3 m, 0.5 m, 0.7 m, 0.9 m, 1.1 m, 1.3 m, 1.5 m, 1.7 m, and 2.1 m as shown in Figure 1b. The SWEMA 03 omnidirectional anemometers are used to gather the air temperature and velocity. For the air temperature, the measuring range of the instrument is 10–34 °C, and the measuring error is ±0.3 °C. For the air velocity, the measuring range of the instrument is 0.05–1.00 m/s; when it is in the range of 0.05–1.00 m/s, the measurement error is ±0.03 m/s; and when it is in the range of 1.00–3.00 m/s, the measurement error is ±3%. For each measuring point on the sampling line, the sampling frequency is 10 Hz and the measurement is continued for 15 min.

2.3. CFD Simulation

CFD simulation and experimental measurement are two main research methods to study the indoor environment. Although experimental measurement can provide real data, it is expensive and inconvenient to implement. Therefore, low-cost CFD simulation has considerable potential for a wide range of applications [28,29]. The AIRPAK 3.0.16 is used as CFD simulation software in this study [35]. The simulation is modeled according to the physical model used in experimental measurement, which has a close resemblance (Figure 1a). Additionally, the length of the office is 3.9 m, the width is 2.9 m and the height is 2.6 m. The air inlet is a rectangular grille diffuser with a size of 0.2 m × 0.184 m, which is located at a height of 1.3 m on the right wall, and the air outlet (0.4 m × 0.2 m) is located at the height of 0.3 m on the same wall because it is beneficial for this layout to provide better thermal comfort [9]. The computer on the desk is simulated by a box with a size of 0.4 m × 0.4 m × 0.4 m, and the heating power is 150 W/m2. The lights are located on the ceiling with 20 W. The thickness of the wall for heat swap is set to 0.06 m, and the related attributes can be found in [36]. The ceiling, the floor and other walls are set as adiabatic. The clothing level is set to 1.0 clo and the indoor relative humidity is set to 50%. The simulated indoor air temperature and velocity values are collected through four sampling lines (L1 to L4) as shown in Figure 1b, and the height of sampling points is 0.3 m, 0.5 m, 0.7 m, 0.9 m, 1.1 m, 1.3 m, 1.5 m, 1.7 m and 2.1 m.
The indoor gas meets following three conditions: turbulent flow in simulation process, steady inflow state and incompressible indoor air. According to previous research, the standard k-ε model is more accurate at predicting the temperature field and velocity field than the RNG k-ε model and the SST k-ω model [8,20]. The discrete ordinates (DO) model is used to calculate the radiant heat exchange between the surfaces of objects. Therefore, the standard k–ε model is used to build CFD simulation model in this study. In order to make sure the independence of the prediction results relative to the number of grids, the office model is constructed with the hexahedral grids of 202,943 (Coarse), 484,008 (Moderate) and 750,337 (Fine). Figure 2 shows that AIRPAK generates the mesh of Z = 1.45m.
Figure 2 compares the predicted indoor temperature and wind speed along sampling L1 under three grid numbers. The temperatures and velocities predicted in the coarse grid model deviate greatly from those predicted in the other two grid models; the temperatures and velocities predicted in the moderate grid model are close to those predicted in the fine grid model. As a result, taking into account the economic benefits and applicability, this study selects the moderate grid type for modeling.

2.4. Response Surface Modeling

The exceptional design operation cases are performed via CFD software. The RSM (the response surface model) is effective at determining p, the relationship between design parameters and a design response [37,38]. The design parameters consist of outdoor air temperature, two ventilation parameters (supply air temperature and supply air velocity) and the metabolic rates. The outdoor design temperature refers to the average outdoor temperature of Xi’an in January for the past five years. The four ventilation performance indexes in this study are LMAA, ΔT, Q s and PMV, and their corresponding formulas are obtained by Equation (4). The Design-Expert software [39] can make the development of the RSM model convenient, and more detailed development of RSM models can be found in [29].
y = c 0 + r = 1 n c r x r + r = 1 n c rr x r 2 + r = 1 n s > 1 r c rs x r x s
where y represents the response parameter; n represents the number of design parameters; x r and x s are design parameters; and c 0 , c r , c r r and c r s are the coefficients of the RSM model.
The Box–Behnken design is one experimental design method of the RSM model to determine the specific operation cases as the Box–Behnken design requires fewer cases than other methods to ensure the accuracy of the RSM models [29,40]. Shen et al. showed the details of developing the Box–Behnken design [27]. The specific cases determined are shown in Table 1, and the supply air velocity, the supply air temperature, the outdoor air temperature and the metabolic rate (MR) range from 0.03 m3/s to 0.05 m3/s, 22 °C to 28 °C, −1 °C to 11 °C and 0.8 met to 1.2 met, respectively. This study selects a range of metabolic rates, and the actual metabolic rates are calculated as follows. For healthy people, the calculation of BMR is followed as the Equations (5)–(7), the detailed information can be found in [23,41].
For healthy people:
F o r m e n : B M ( w ) = 3.20 + 0.66 W + 0.24 H 0.33 A F o r w o m e n : B M ( w ) = 32.22 + 0.47 W + 0.092 H 0.23 A
A D = 0.202 W 0.425 ( H / 100 ) 0.725
B M R ( w / m 2 ) = B M A D
where W represents the weight of the occupants; A is the age of the occupants; H is the height of the occupants; BM is the basal metabolism (w) of the occupants; BMR represents the basal metabolic rate (w/m2) of the occupants; and A D is the body surface area (m2).

2.5. Pareto-Based Combinatorial Optimization Model

Pareto optimal describes a state of optimal allocation of resources. Under the case of Pareto optimality, there is no way to make the other party obtain greater benefits without harming the interests of one party. If there is no decision vector in the decision space that can have more dominant advantage, the decision vector is called the Pareto optimal solution. The Pareto optimal solution set is defined as the set of all Pareto optimal solutions [42,43,44].
In this study, the NSGA-II algorithm is used to optimize the design parameters to obtain the Pareto front, and optimal design is obtained from the Pareto front by the CRITIC-TOPSIS method. NSGA-II algorithm achieves the classification of the population by nondominated sorting of the population, calculates the crowding distance of individual population to keep the diversity of the population and obtains the approximate solution when the termination condition is reached. Therefore, multiobjective optimization can usually be used to solve the problem of building Pareto frontiers and apply decision strategies to select the preferred solution for Pareto optimization solutions. Compared with the particle swarm optimization algorithm and the simulated annealing algorithm, the genetic algorithm has better solutions and fewer parameters [45,46]. In this study, the Pareto-based NSGA-II is used for multiobjective optimization. When using the NSGA-II algorithm for multiobjective optimization, it is necessary to obtain the objective function of the corresponding objective. The response surface method (RSM) is one of the effective methods to construct its objective function and has high accuracy [28,29]. The Design-Expert 11 software was used to generate 25 operation cases, and the ventilation performance prediction model of RSM was generated based on the data of 25 simulation operation cases. After obtaining the Pareto optimal solution set at different outdoor air temperatures, the weights of the four objectives are determined by the criteria importance through the intercriteria correlation (CRITIC) method [47], while the technique for order preference by similarity to ideal solution (TOPSIS) method [48] is employed to obtain the optimization strategy under dynamic outdoor air temperature from Pareto optimal solution set. The key steps and concepts are explained as follows:
Step 1: Initialize the population. The population is initialized by means of random numbers. N different random arrays will be randomly generated as the first-generation subgroup.
Step 2: Constrict nondominated sorting. All individuals are sorted, and the first N individuals are taken as parents, as follows:
For the two solutions to the decision variables X 1 and X 2 , if the objective functions F 1 and F 2 arbitrarily satisfy one of the following relationships, X 2 dominates X 1 , i.e., X 2 is considered better than X 1 :
F 1 ( X 1 ) > F 2 ( X 1 ) , F 1 ( X 1 ) > F 2 ( X 1 ) ; F 1 ( X 1 ) > F 2 ( X 1 ) , F 1 ( X 2 ) > F 2 ( X 2 ) ; F 1 ( X 1 ) = F 2 ( X 1 ) , F 1 ( X 2 ) > F 2 ( X 2 ) ;
if the relationship between objective function F 1 and F 2 satisfies any of the following conditions, X 1 and X 2 are considered to be at each other’s discretion:
F 1 ( X 1 ) > F 2 ( X 1 ) , F 1 ( X 2 ) F 2 ( X 2 ) ; F 1 ( X 1 ) > F 2 ( X 1 ) , F 1 ( X 2 ) F 2 ( X 2 ) ;
if the sorted values are the same, the individuals with a large crowding distance are selected as the parents. The size of crowding values reflects the similarity between individuals, the diversity of individuals in multiobjective optimization solutions and the distribution characteristics of the corresponding objective function values at the Pareto frontier.
Step 3: Genetic manipulation is performed by a genetic operator and includes selection, crossover, and mutation operators. Selection refers to the process of survival of the fittest according to fitness value; crossover refers to the process in which the structures of two parent individuals exchange with each other according to a certain probability to produce a new individual; mutation is the process of randomly changing an individual’s gene value from “0” to “1” or “1” to “0” with a small probability.
(1) The selection operator uses roulette selection, which is based on a proportional adaptation allocation method.
(2) The Laplace cross operator crossover process is used as follows:
The expressions of the two parents x i P 1 and x i P 2 produce two children x i c 1 and x i c 2 :
x i c 1 = x i P 1 + β i | x i P 1 x i P 2 |
x i c 2 = x i P 2 + β i | x i P 1 x i P 2 |
Among them, { β i = a b log u i ( r i 0.5 ) β i = a + b log u i ( r i 0.5 ) controls the probability of the child taking values in the parent’s adjacent interval, and u i , r i are a normalized random positive number; positional parameter a is generally taken as 0. The size of scale parameter b reflects the degree to which the child individual is close to the parent individual. It can be further obtained from Equations (8) and (9). The new children have the same distribution as their parents.
x i c 1 x i c 2 = x i P 1 x i P 2
After the power mutation operator performs mutation operation on each variable in the individual, the new individual expression is:
x i = { x i P s ( x i P x i l ) ,   t < r x i P s ( x i P x i l ) ,   t r
where s = ( s i ) p ; s and r are interval random numbers; x i u and x i l are the upper and lower limits of the variable x i , respectively; and variation index p controls the intensity of mutation; t = ( x i p x i l ) / ( x i u x i p ) .
Step 4: Elitist principle: Combine parents and children into new alternative parents to preserve elite individuals in parents and children. The main purpose of the elitist principle is to replicate the optimal solutions in each generation to the next.
Step 5: The termination condition. The termination condition is to optimize the process to reach the maximum evolutionary algebra. More details of NSGA-II can be found in [49]. In this study, NSGA-II algorithm is used to obtain the Pareto optimal solution set under different outdoor air temperatures. Subsequently, for the Pareto optimal solution set, the importance of response variables can be defined to determine the optimal supply air strategy under different outdoor air temperatures.
Step 6: Based on the undimensioned process of various indexes, construct a decision matrix E from the Pareto optimal solution set of ventilation performance:
C 1 C n B 1 B n ( a 11 a 1 n a m 1 a m n )
Step 7: Identify the positive ideal points (PIS) and the negative ideal points (NIS):
P I S = { y 1 + , y j + , y n + } N I S = { y 1 , y j , y n }
Step 8: The variability and conflict of the indices are determined according to Pareto optimal solution set:
{ a ¯ j = 1 n i = 1 n a i j S j = i = 1 n ( a i j a ¯ j ) 2 n 1 R j = i = 1 n ( 1 r i j )
where the S j represents the standard deviation of the jth indicator. In the CRITIC method, the S j is used to represent the difference and fluctuation of the internal values of each indicator; the larger the S j , and the more information it can reflect. The r i j represents the correlation coefficient between evaluation indicators i and j; the larger R j is, the smaller the correlation between indicators is and the more information is reflected. More details of the CRITIC method can be found in Ref. [50].
Step 9: Determine the weight w j :
C j = S j × R j w j = C j j = 1 n C j
Step 10: Calculate the separation from the PIS and the NIS for each alternative of operation:
D i + = w j j = 1 n ( y i j y j + ) 2 ,   D i = w j j = 1 n ( y i j y j ) 2
Step 11: Calculate the rank indexes (i.e., the overall score) of the ideal solution. The higher the rank index of a scheme, the higher the priority of the scheme. The scheme with the highest rank index is the recommended optimal supply air parameter.
D i * = D i D i + D i +
where D i * is the rank index of the ith alternative of operation.
The proposed combinatorial optimization strategy consists of three processes, as displayed in Figure 3. The goal of the first process is to build the RSM ventilation performance prediction model (i.e., the objective functions of the PMV, the Qs, the ΔT and the LMAA) through 25 sets of CFD simulation data. The second process is to obtain Pareto optimal solution sets at different outdoor temperatures through NSGA-II algorithm according to the objective functions of four ventilation performance indexes. The main steps of the NSGA-II algorithm include nondominated sorting, calculate the diversity, selection, crossover and mutation. The third process is mainly to first assign weights to the four ventilation performance indicators through the CRITIC method, and then use TOPSIS method to select the best among the Pareto optimal solutions under different outdoor temperatures and finally get the corresponding optimal supply air parameters. Finally, after obtaining the optimal ventilation operation corresponding to different outdoor temperatures, the energy consumption and sensitivity analysis are carried out.

3. Results and Discussion

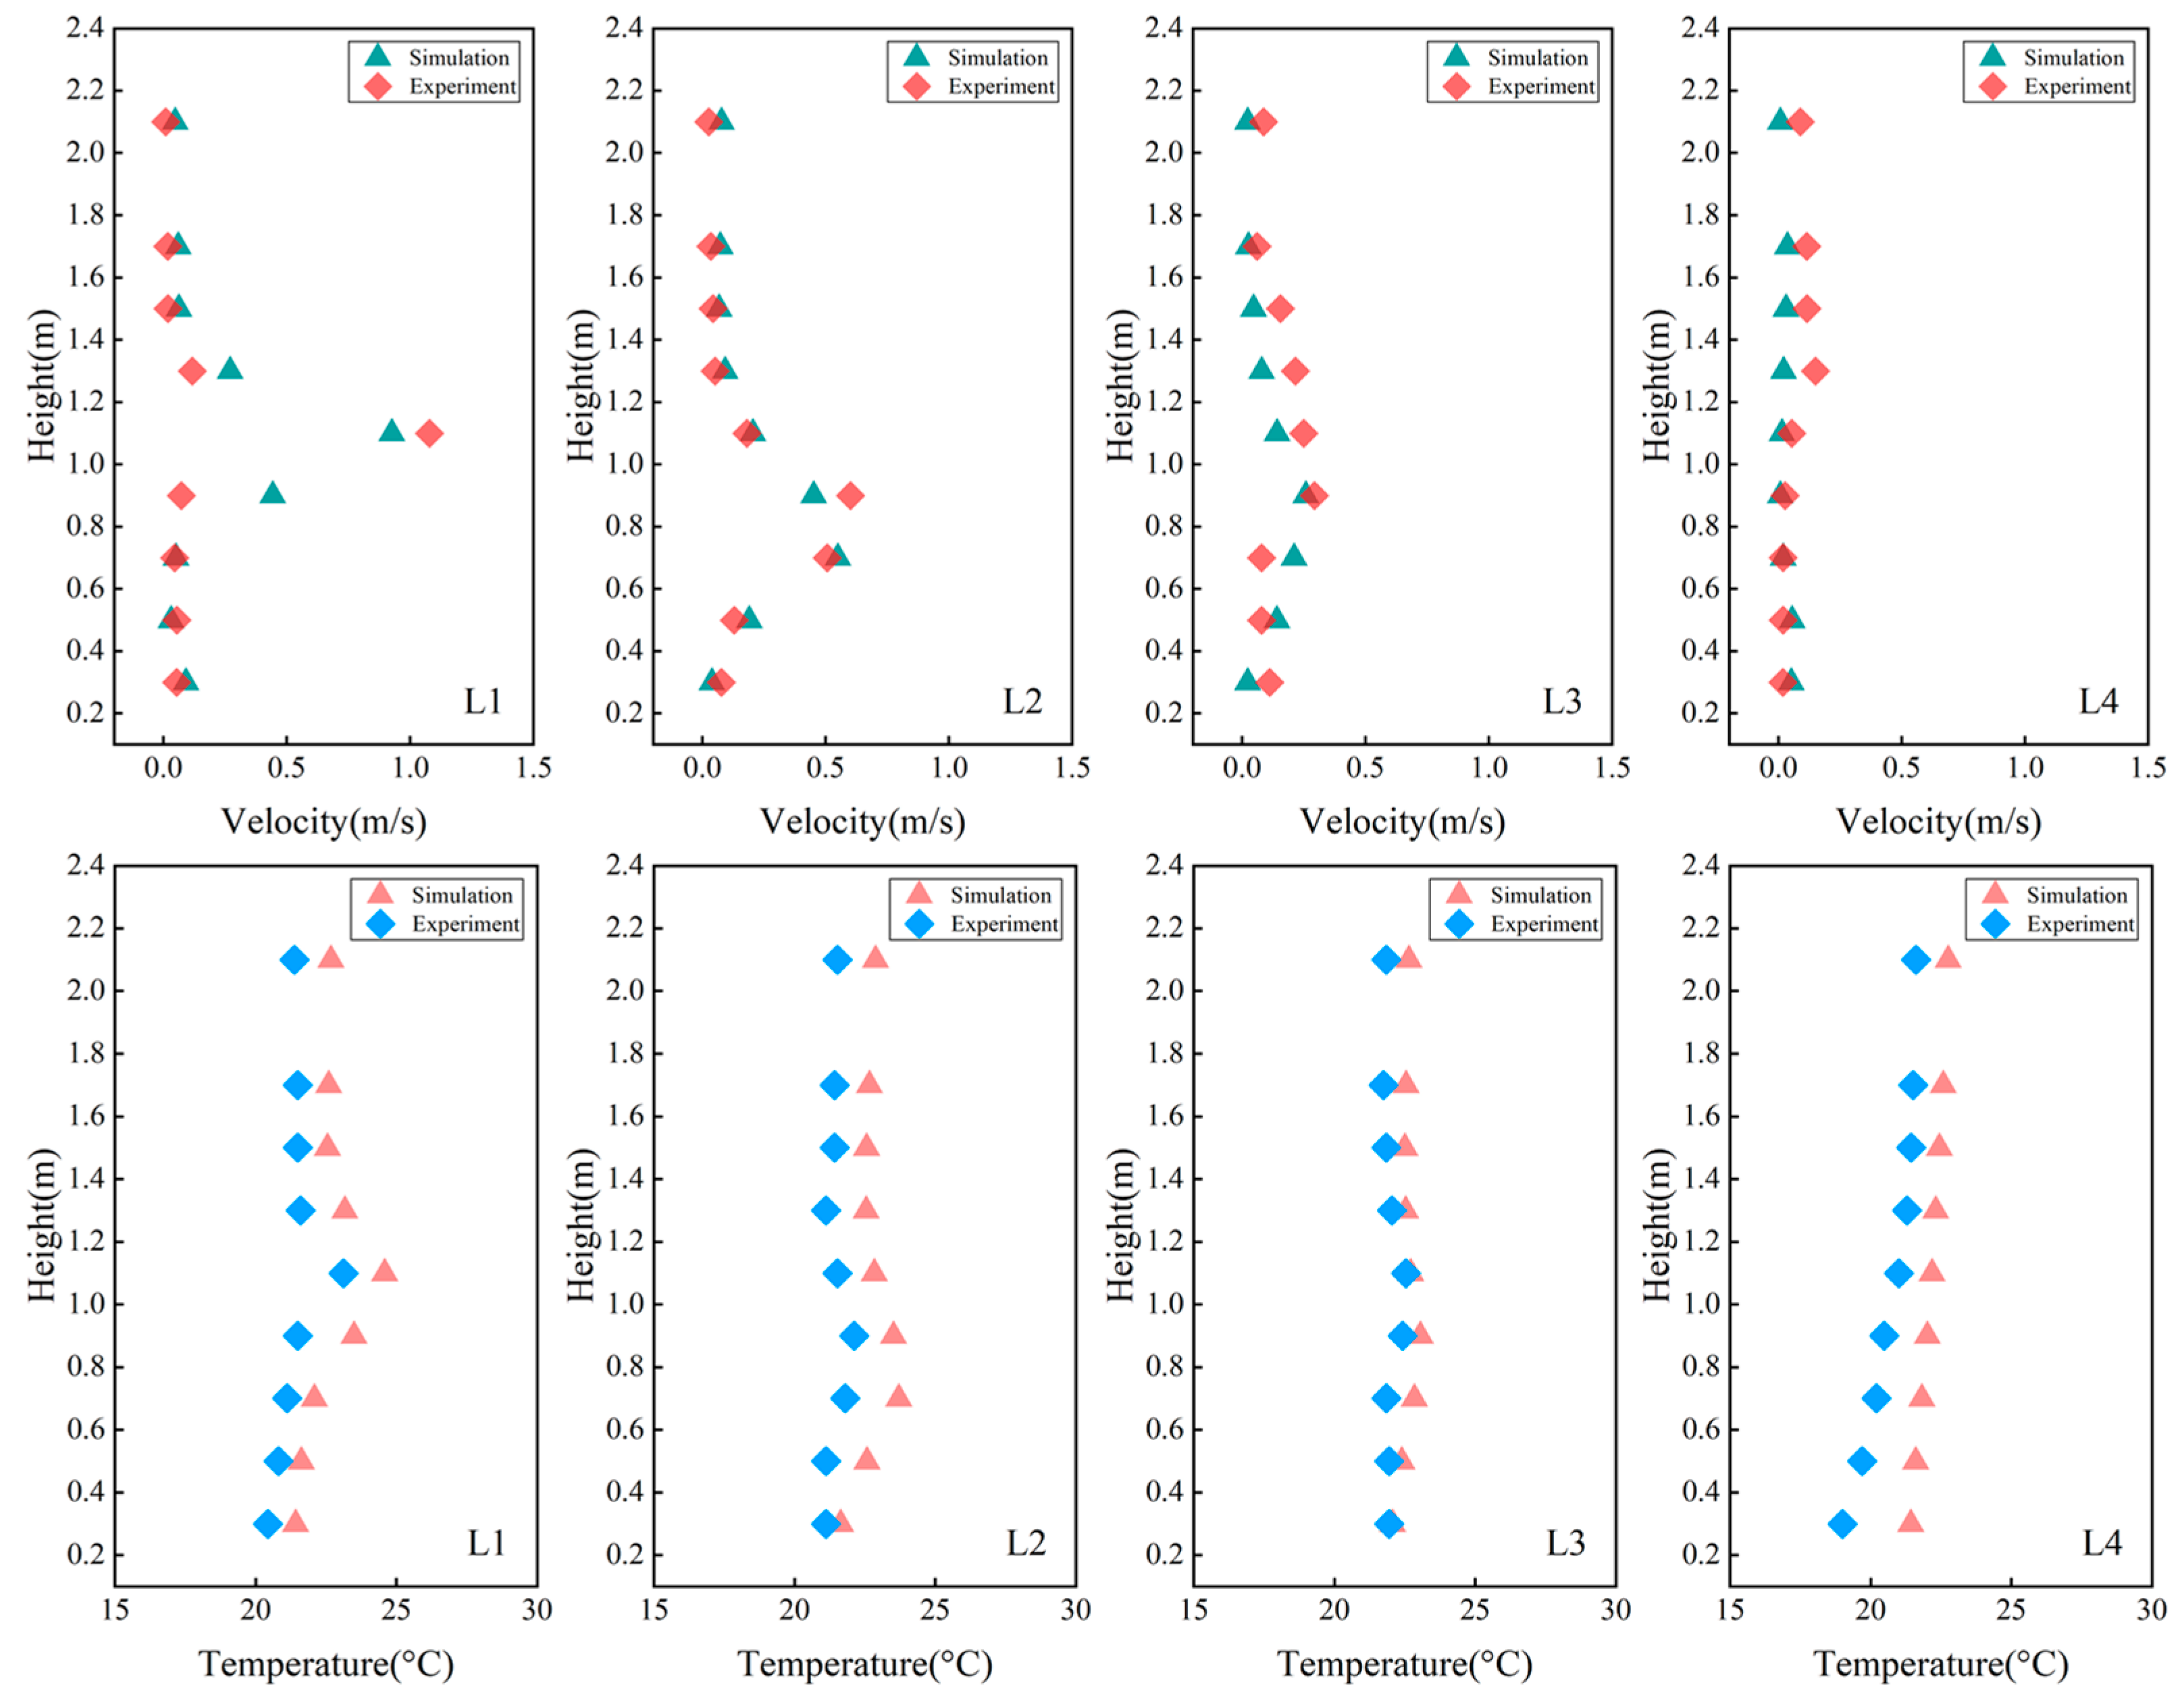
3.1. Validation of CFD Simulation

To validate the reliability of AIRPAK simulation in the application of the SV system, the indoor air velocity and temperature simulated by CFD are compared with the indoor air temperature and velocity measured experimentally, as shown in Figure 1. The experimental results on the air temperature and air velocity from collected points along four sampling lines measured by Zhang et al. [8] were used to verify the rationality of CFD simulation. Figure 4 shows the discrepancies between the experimental results and the predicted mean simulation results. These differences are due to calculation errors, error of experimental measurement results and experimental errors [51,52]. To further verify the reliability and consistency between simulations and experiments, the mean absolute differences and the correlation coefficients can be used [8,20,53]. In this study, the correlated coefficient and the mean absolute differences for air velocity between the predictions from AIRPAK simulations and experimental results are 0.07 m/s and 0.87, respectively. For indoor air temperature, the correlated coefficient and the mean absolute differences between the predictions from experimental and AIRPAK simulations results are 0.76 and 1.13 °C, respectively. This indicates that the predictions from the AIRPAK simulations have one great agreement with experimental measurement. Therefore, it is reasonable to use CFD simulation in the subsequent research, and AIRPAK simulation data is suitable for this study.

3.2. Combinatorial Optimization Modeling

The Pareto-based NSGA-II was used to obtain the Pareto optimal solutions. Four objectives (i.e., PMV, ΔT, LMAA and Q s ) were adopted as the algorithm inputs of the NSGA-II. The parameter settings of specific operation cases can be obtained in Table 1. In the simulation, the clothing level is set to 1.0 clo, which is a typical level of winter clothing, and the humidity is set to 50% [31]. Based on CFD simulation results, the objective functions of the PMV, the LMAA, the ΔT and the Qs (Equations (18)–(21)) are determined by RSM method. Moreover, the normalized design parameters (Equation (22)) are beneficial to develop for the calculation of these RSM models [54], because normalization helps to eliminate differences caused by different input scales and units [55].
P M V = 0.4935 + 0.3013 M + 0.4154 T s + 0.0591 V s + 0.5921 T o u t + 0.0277 M T s 0.0328 M V s 0.0553 M T o u t + 0.0585 T s V s + 0.0035 T s T o u t 0.0580 V s T o u t
Q s = 763.25 3.61 M + 83.05 T s + 228.14 V s 192.83 T o u t 19.89 M T s + 12.98 M V s 7.13 M T o u t + 31.75 T s V s + 1.3 T s T o u t
T = 1.85 0.102 M + 0.4637 T s 0.5030 V s 0.9463 T o u t
L M A A = 619.97 2.32 M + 30.76 T s 149.6 V s + 4.93 T o u t
where T o u t is the normalized outdoor air temperature; V s is the normalized supply air velocity; and T s is the normalized supply air temperature.
x ¯ = 2 ( x x min ) ( x max x min ) 1
where x ¯ is the normalized design parameter; x is the original design parameter; x min is the minimal original design parameter; and x max is the maximal original design parameter.
An analysis of the statistical results of the RSM prediction model can be found in Table 2, where p values are all less than 0.0001, indicating that RSM prediction model is statistically significant. Moreover, the predicted R2 value and the adjusted R2 value of the four ventilation performance indicators in Table 2 are in reasonable agreement. The adjusted R2 is calculated by the total number of the model terms and the design points of R2 [31], and the formula is followed as Equation (23).
P r e d i c t e d R 2 = 1 P R E S S S S t o t a l
where PRESS represents the variance between the predicted value of the established model and the observed value deleted from the data set; and S S t o t a l represents the total variance between the predicted and observed values of the new model.
Table 2 shows the standard deviation (SD) and mean absolute error (MAE) between the CFD simulation results and the RSM model prediction results. The standard deviation (SD) and mean absolute error (MAE) of predicted from the RSM models are obtained via Equations (24) and (25), respectively. The MAE and the SD values corresponding to the PMV prediction and CFD simulation are 0.0199 and 0.0316, respectively. The MAE and the SD values corresponding to the ΔT prediction and CFD simulation are 0.1145 and 0.1493, respectively. The MAE and the SD values corresponding to the LMAA prediction and CFD simulation are 22.2441 and 31.95, respectively. The MAE and the SD values corresponding to the Q s prediction and CFD simulation are 9.2019 and 16.57, respectively. Figure 5 shows that four criteria from the RSM models have a comparison with those from CFD simulations for 25 cases. Therefore, the development of RSM model is statistically reliable [56,57].
M A E = i = 1 N | s i m i p r e i | N
S D = i = 1 N ( | s i m i p r e i | 1 N i = 1 N | s i m i p r e i | ) 2 N 1
where MAE represents the mean absolute error between observations and predictions; | s i m i p r e i | define the absolute deviation between the CFD simulations ( s i m i ) and the prediction of the RSM ( p r e i ); and N represents the number of cases; SD represents the standard deviation between the observations and the predictions of the RSM.
According to the operation results of NSGA-II, the 30 Pareto optimal solutions at different outdoor temperatures are obtained (including the Pareto optimal solution set at various outdoor temperatures under the metabolic rate of 0.8 met, 1.0 met and 1.2 met, a total of 39 Pareto optimal solution sets). Table 3 summarizes the details of the 30 Pareto optimal solutions, when the metabolic rate is 1.0 met and the outdoor air temperature is 1 °C. Due to space constraints, more Pareto solution sets at outdoor air temperatures are not presented in this paper. This section mainly presents the prediction model of ventilation performance index and makes corresponding statistical analysis to verify the reasonable reliability of the prediction model.

3.3. Combinatorial Optimization Strategy Optimization and Analysis

The metabolic rates, outdoor air temperature, supply air velocity and supply air temperature are from 0.8 to 1.2 met, −1 to 11 °C, 0.03 to 0.05 m3/s and 22 to 28 °C, respectively. In practice, choosing a suitable combination of supply air parameters can improve energy efficiency of the HVAC systems and provide a comfortable indoor thermal environment. For the different cases in the above Pareto optimal solution set, the CRITIC-TOPSIS method is used to comprehensively consider four design responses, and the optimal supply air parameters at different outdoor air temperatures are recommended. In this process, the NSGA-II algorithm is used to obtain the Pareto optimal solution sets under different outdoor air temperatures. Since the Pareto optimal solution set cannot meet the best condition of the four indicators at the same time, in order to select a relatively excellent set of solutions, we used the CRITIC method to obtain the weight coefficients of the four indicators. The CRITIC method can effectively solve the problem of interrelatedness between indicators. After obtaining the weight coefficients of each indicator, the TOPSIS method is used to screen each set of Pareto optimal solutions, and finally the recommended supply air parameters corresponding to each outdoor temperature under different metabolic rates are obtained. Table 4 shows the optimal ventilation operation corresponding to the metabolic rate of 1 m.
Figure 6 shows the variations in the optimal operations of ventilation parameters (i.e., supply air velocity and temperature) at different outdoor air temperatures. The optimal ventilation operations are determined by the combinatorial optimization strategy based on the NSGA-II and CRITIC-TOPSIS method. The trend of change in optimal operation is different when the metabolic rate is different, and it can be seen that dynamic updates of the optimal operations can cope with different outdoor weather conditions. As shown in Figure 6a, when the metabolic rate is 0.8 met, the supply air temperature has an overall downward trend and tends to be stable when the outdoor temperature is 7 °C. The supply air velocity initially fluctuates within the range of 0.045–0.05 m3/s and finally shows a downward trend. As shown in Figure 6b, when the metabolic rate is 1.0 met, the supply air temperature tends to be stable when the outdoor temperature is 5 °C, and the supply air velocity decreases overall. As shown in Figure 6c, when the metabolic rate is 1.2 met, the supply air temperature tends to be stable when the outdoor temperature is 1 °C, and the supply air velocity fluctuates up and down. Moreover, the higher the metabolic rate, the lower the corresponding supply air velocity and supply air temperature; this is because in winter heating, the occupants with a higher metabolic rate are more likely to reach a comfortable state, and the supply air temperature and supply air velocity required by occupants with lower metabolic rate are lower.
Moreover, a benchmark is defined to more comprehensively quantify the performance improvement achieved by the combinatorial optimization strategy. The parameter of the benchmark is set as the median value of supply air temperature and velocity to maintain reasonably good ventilation performance [8]. There are conflicting interest relationships among various ventilation performance indicators. The TOPSIS method has been used in relevant studies to achieve a great improvement in ventilation performance, but a certain indicator may become worse. Compared with previous studies, this study has achieved a comprehensive improvement in ventilation performance. Compared with the benchmark, the PMV, the Q s , the ΔT and the LMAA for different metabolic rates decreased by 64.1%, 4.74%, 24.83% and 7.39% on average, respectively. Figure 7 shows the average optimization efficiency of each ventilation performance index at different outdoor air temperatures. As shown in Figure 7, at different outdoor temperatures, the optimization efficiency of the four ventilation performance indicators is mostly above the red dotted line in the figure (i.e., the optimization efficiency is greater than 0). This shows that the combined optimization strategy has achieved a certain improvement in ventilation performance. In addition, it can be seen from the figure that the optimization efficiency of the four ventilation performance indicators is ranked as PMV > ΔT > LMAA > Qs. The weight refers to the relative importance of the indicator in the overall evaluation. The greater the weight of the indicator, the more important the indicator will be in the optimization process. Figure 8 shows the weight coefficients of the four indicators obtained by the CRITIC method at different outdoor air temperatures when the metabolic rate is 1 met. As shown in Figure 8, the weight of Qs at different outdoor temperatures shows an upward trend, while the other three ventilation performance indicators show a downward trend. When the outdoor air temperature is −1 °C to 4 °C, the weight of the four indexes is Qs > PMV > LMAA > ΔT; when the outdoor air temperature is 4 °C to 11 °C, the weight of the four indexes is Qs > LMAA > ΔT > PMV. Considering the weights change at different outdoor air temperatures, it is necessary to dynamically optimize the SV systems.
The combinatorial optimization strategy based on the NSGA-II and CRITIC-TOPSIS method proposed in this study takes into account the change of the metabolic rate. The relationship between metabolic rate and energy consumption was rarely related in previous studies. In this study, the relationship between metabolic rate and energy consumption was analyzed. The results show that the energy saving effect can be better achieved by considering the metabolic rate in the optimization process, and metabolic rate can affect the thermal sensation of occupants and thus affect the system energy consumption. Figure 9 shows the change in energy consumption with outdoor temperature under different metabolic rates. After the combinatorial optimization strategy is optimized, the higher the metabolic rate is, the higher the energy consumption will be, and the energy consumption will decrease as the outdoor temperature increases. This is because occupants with a high metabolic rate have lower requirements for the thermal environment than those with a low metabolic rate, and creating a comfortable indoor thermal environment is based on a certain amount of system energy. In addition, when the outdoor temperature rises in winter, the occupants are more likely to reach a thermal neutral state to meet their own thermal requirements. When the outdoor temperature is 4 °C, the difference in energy consumption under different metabolic rates can reach up to 441.55 W, and the average difference in energy consumption between 0.8 metabolic rate and 1.2 metabolic rate is 213.74 W. Moreover, the energy consumption also varies widely at different outdoor air temperatures, and the maximum difference can be 740.84 W. Therefore, considering the dynamic change of outdoor temperature and the difference of metabolic rate is necessary to save energy.
In summary, the proposed combinatorial optimization strategy based on the NSGA-II and CRITIC-TOPSIS method can achieve a comprehensive improvement in ventilation performance, and adding CRITIC method can help to solve the problem of correlation between indicators and can dynamically determine the weight coefficient of energy consumption according to outdoor temperature changes. Members with different metabolic rates have certain differences in energy consumption at different outdoor temperatures. Considering this, the metabolic rates are beneficial to meet the thermal needs of different populations and adopting the combinatorial optimization strategy for occupants with different metabolic rates can help save energy. Moreover, the dynamic change of outdoor temperature has a great influence on the indoor thermal environment and energy consumption. Considering this, the change of outdoor temperature is more conducive to the dynamic energy saving of the combinatorial optimization strategy. Compared with previous studies, this study discussed the influence of metabolic rate on the optimal air supply operation. The results showed that, compared with the previous studies, the metabolic rate of different personnel was considered in this study, which was conducive to the dynamic optimization of air supply parameters under the change of outdoor temperature.

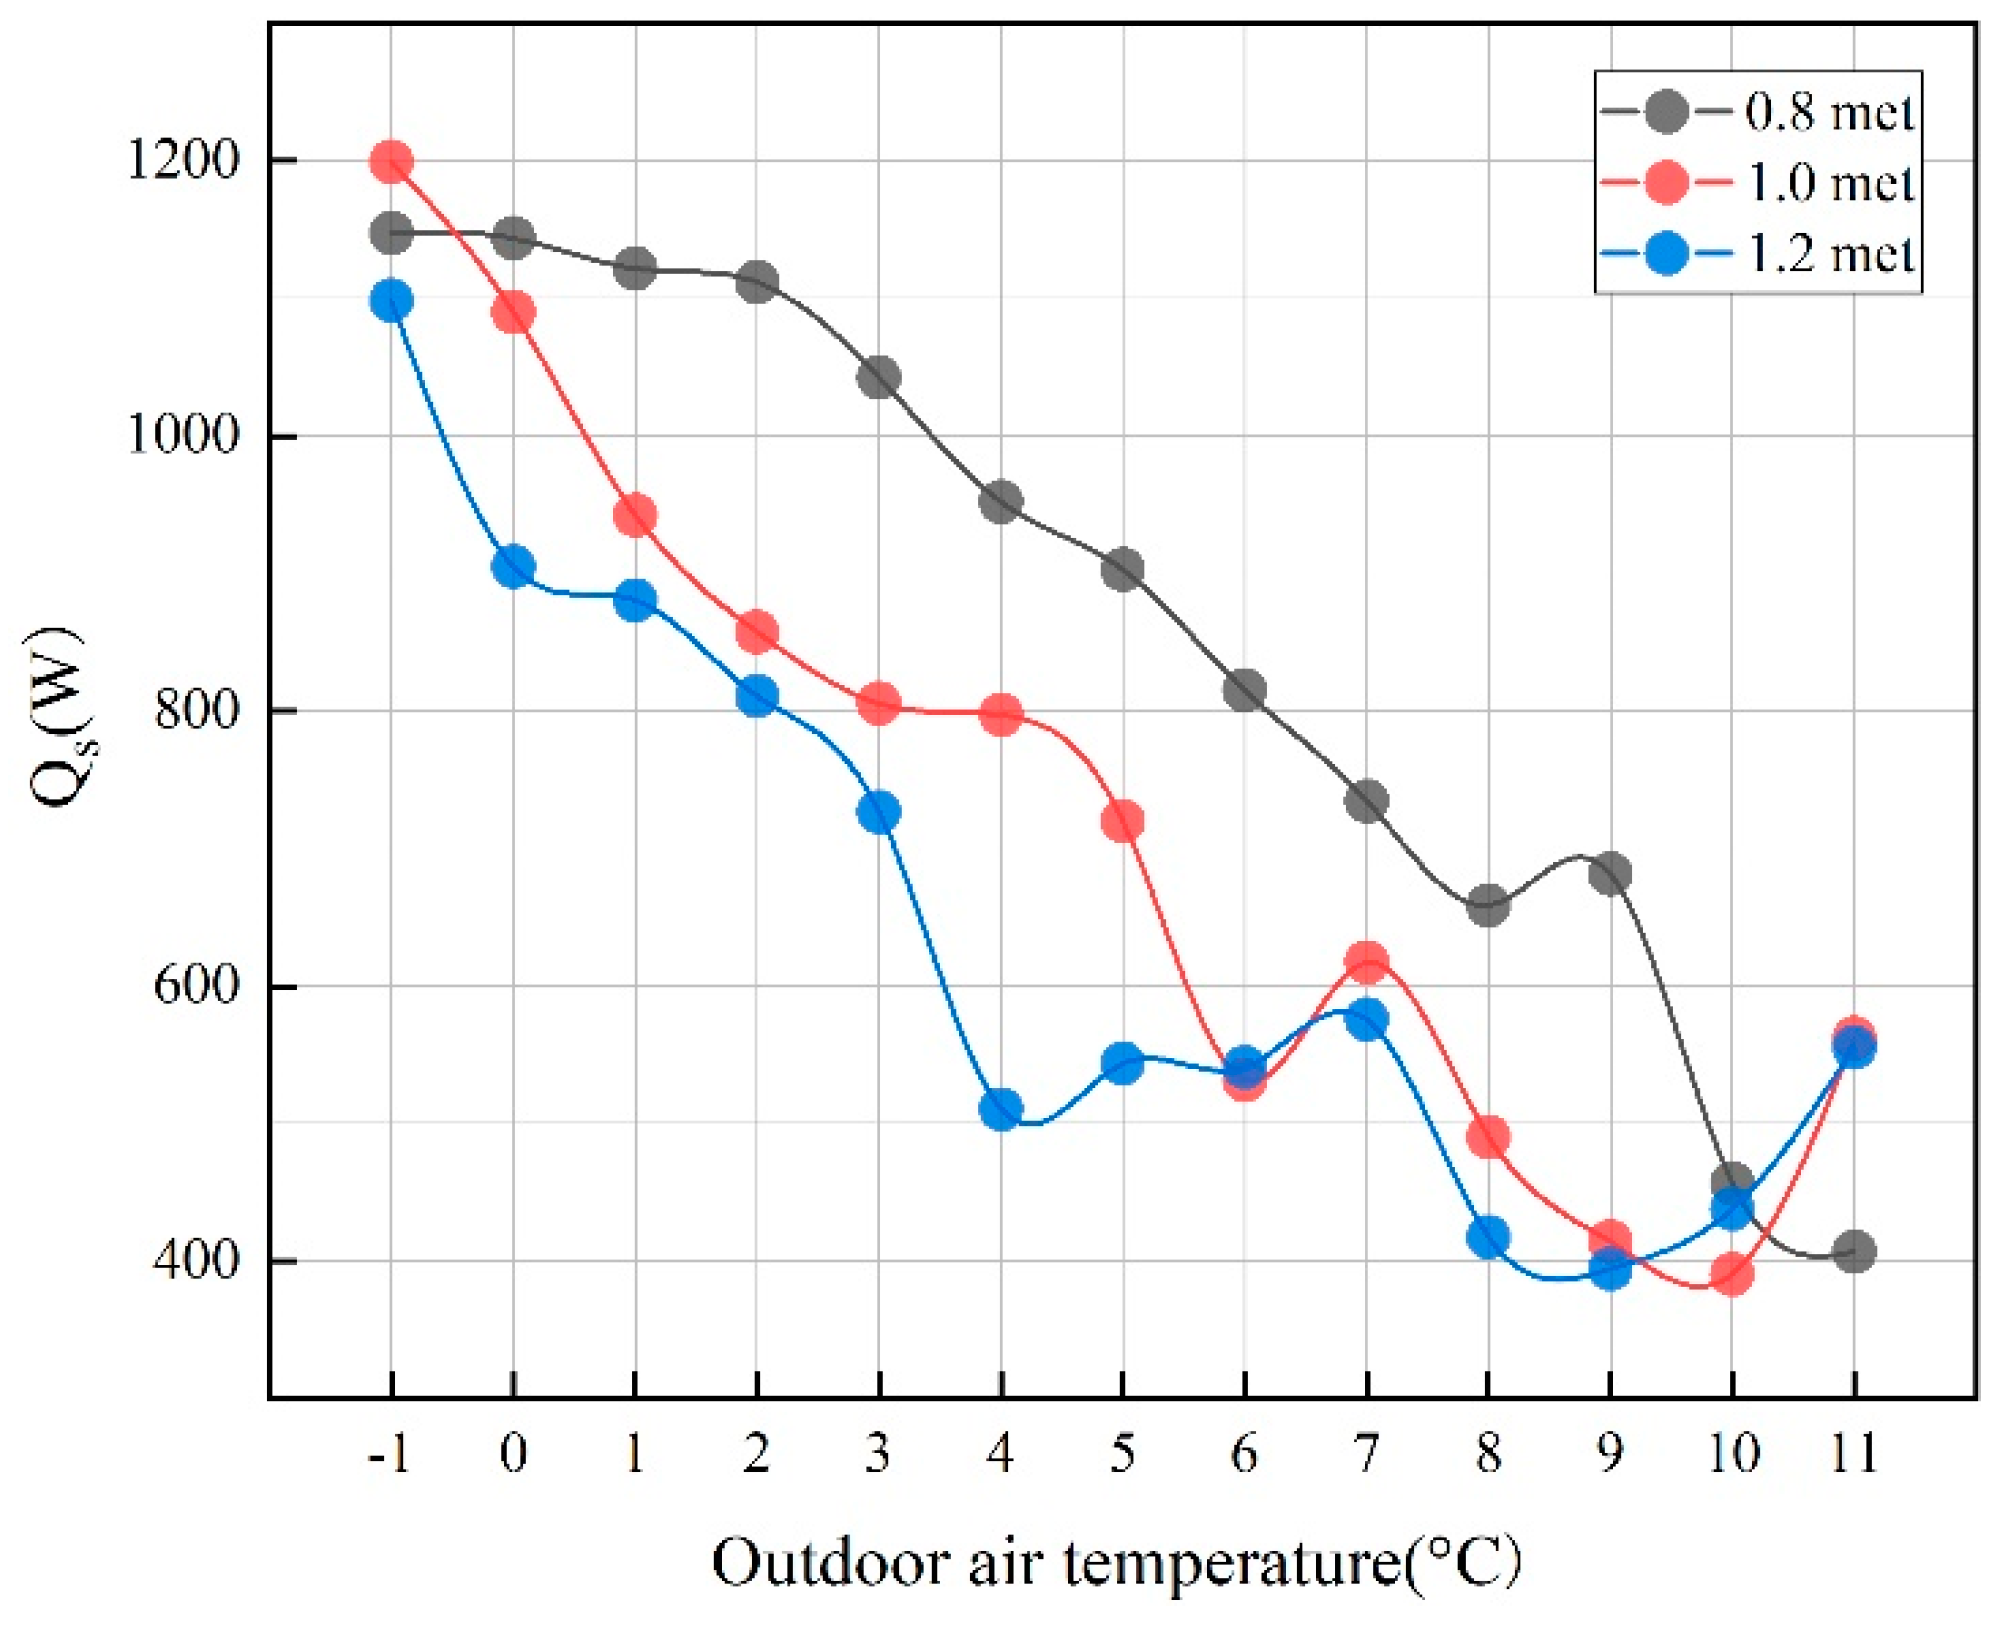
3.4. Sensitivity Analysis

This study shows that the sensitivity of optimal operation to supply air parameters is different, and the sensitivity of supply air parameters varies with the outdoor air temperature. Compared with previous studies, this study explores the sensitivity of metabolic rate to optimal air supply operation, which has certain guiding significance for personalized air supply. As presented in Figure 6, it is apparent that the sensitivity of the optimal operation to ventilation parameters is different when the metabolic rate is different. When the metabolic rate is 0.8 met, the sensitivity of supply air temperature is higher, and the supply air temperature does not change significantly when the outdoor air temperature reaches 7 °C. When the metabolic rate is 1.2 met, the supply air temperature did not change significantly, and the supply air velocity sensitivity is higher. This shows that the difference in metabolic rate has a significant impact on the supply air parameters. For occupants with a high metabolic rate, the supply air velocity can be adjusted appropriately to improve ventilation performance. The mean sensitivity of ventilation performance is quantified by the average proportion of the variation interval of the optimal ventilation parameters in the entire range (Figure 10). In the outdoor temperature range studied, the optimal operation is consistently more sensitive to supply air velocity. When the outdoor air temperature is different, the sensitivity of supply air parameters is different, and the sensitivity of supply air temperature gradually decreases and finally tends to be stable. Therefore, in practice, the supply air velocity or the supply air temperature is to be most closely monitored and adjusted based on the metabolic rate of occupants and changes in outdoor weather conditions.

4. Conclusions

This study proposes an efficient combination strategy of the NSGA and CRITIC-TOPSIS method based on RSM to optimize the ventilation performance of the SV system in heating applications. The influence of some highly correlated indicators can be eliminated by improving the TOPSIS through the CRITIC method. The main novelty of this study is to put forward the combined optimization strategy of the NSGA-II and CRITIC-TOPSIS method to optimize the ventilation parameters of the SV system under the premise of considering the changes of metabolic rate and outdoor air temperature and to analyze the energy consumption and sensitivity of the optimal ventilation operation under different outdoor air temperatures and metabolic rates. This method can be combined with building equipment automation system in the future to provide a better environment for indoor occupants. In many previous studies, The TOPSIS method was used to optimize supply air parameters, but the continuity of supply air parameter interval was not taken into account. In this study, the combination optimization strategy was used to optimize supply air parameters, and the whole range of supply air parameter was directly taken into consideration, which was conducive to obtaining more reliable optimization results. The combination optimization strategy is based on the RSM model of the PMV, LMAA, ΔT and Q s to reduce the cost of simulation calculation, and the predicted values of the RSM model reasonably agree with the CFD simulation values verified by experiments. Previous studies on thermal environment optimization rarely consider changes in metabolic rate and outdoor air temperature, which can affect indoor thermal environment and energy consumption. To understand the relationship among the indoor/outdoor environment, occupant’s thermal requirements and system energy consumption, taking the metabolic rate as one of the important influencing factors in the combination optimization strategy, the ventilation performance of the SV system and its optimal heating operations are analyzed at different outdoor weather conditions with consideration of different metabolic rates. The main findings were the following:
(1) The optimization results show that the combined optimization strategy has the potential to improve indoor thermal comfort and energy saving. The PMV, Q s , ΔT and LMAA for different metabolic rates decreased by 64.1%, 4.74%, 24.83% and 7.39% on average, respectively.
(2) Differences in metabolic rate are beneficial in meeting the thermal requirements of different occupants. The addition of the metabolic rate in the optimization process can achieve a certain degree of energy saving; the results show that the higher the metabolic rate, the higher the relative energy saving rate, and the maximum energy consumption difference under different metabolic rates can reach 441.55 W, with the average energy consumption difference reaching up to 213.74 W.
(3) The combinatorial optimization strategy can dynamically control the ventilation parameters and has the ability to adapt to the change of outdoor air temperature. Moreover, the sensitivity of ventilation parameters is different under different outdoor air temperatures; taking into account changes in outdoor air temperature facilitates further adjustment of the operation parameters of the HVAC system.
This research optimizes the supply air parameters of the stratum ventilation by the combined optimization strategy of the NSGA-II and CRITIC-TOPSIS method but does not apply this optimization method to other air distribution systems, such as mixed ventilation. The optimization of other air distribution systems by the proposed combined optimization strategy will become the focus of the next step, taking into account the differences in occupant behavior and clothing thermal resistance.

Author Contributions

Z.W. designed the experiment and analyzed the data; Z.W. wrote the paper; and Y.B. revised the paper. All authors have read and agreed to the published version of the manuscript.

Funding

This study was supported by the 13th Five Year Plan Project of Education Science in Shaanxi Province (No. SGH18H111), the Science and Technology Project of Housing and Urban-Rural construction of Shaanxi Province (No. 2019-K34) and Anhui Province Key Laboratory of Intelligent Building and Building Energy Saving of Anhui University of Architecture (No. IBES2020KF04).

Conflicts of Interest

The authors declare no conflict of interest.

Nomenclature and Abbreviations

A Age of occupant (year)
A D The nude body surface area (m2)
a Positional parameter
B B is diagnosis of burn (present = 1, absent = 0)
B M The basal metabolism (w)
B M R The basal metabolic rate (w/m2)
C ρ Specific heat (J/kg · K)
C O , C r Coefficients of the response
C r r , C r s surface model
H Height of occupants (cm)
M A E The mean absolute error betweenpredictions and observations
p Variation index
p r e i Prediction of the RSM
ρ Air density (kg/m3)
Q S Relative operational energyconsumption (W)
S The nude body surface area (m2)
S S Sex (male = 1, female = 0)
s i m i CFD simulations
S j The standard deviation of thejth indicator
S , r Interval random numbers
T o u t Outdoor air temperature
T s Supply air temperature (°C)
u i , r i Normalized random positive number
V s Supply air velocity (m3/s)
V Supply air flow rate (l/s)
w j Weight coefficient
x P 1 , x P 2 Expressions of parents
x c 1 , x c 2 Expressions of children
x ¯ Normalized design parameter
x min , x max The minimal and maximal original values of the design parameter
CFDComputational fluid dynamics
CRITICCriteria importance though intercriteria correlation method
DVDisplacement ventilation
FCEFuzzy comprehensive evaluation
MVMixing ventilation
PMVPredicted mean vote
PPDPredicted percentage dissatisfied
SVStratum ventilation
TOPSISThe technique for order preference by similarity to ideal solution
NSGA-IINon-dominated sorting genetic algorithm-II
RSMResponse surface model

References

  1. Staveckis, A.; Borodinecs, A. Impact of impinging jet ventilation on thermal comfort and indoor air quality in office buildings. Energy Build. 2021, 235, 163–170. [Google Scholar] [CrossRef]
  2. Wu, J.; Hou, Z.; Shen, J.; Lian, Z.W. A method for the determination of optimal indoor environmental parameters range considering work performance. J. Build. Eng. 2021, 35, 101976. [Google Scholar] [CrossRef]
  3. Li, S.; Li, Z. Requirements of HVAC for Green Building. Constr. Conserv. Energy 2011, 39, 20–24. [Google Scholar]
  4. Lin, Y.J.P.; Lin, C.L. A study on flow stratification in a space using displacement ventilation. Int. J. Heat Mass Transf. 2014, 73, 67–75. [Google Scholar] [CrossRef]
  5. Amai, H.; Novoselac, A. Experimental study on air change effectiveness in mixing ventilation. Build. Environ. 2016, 109, 101–111. [Google Scholar] [CrossRef]
  6. Chludzinska, M. An indoor environment evaluation by gender and age using an advanced personalized ventilation system. Build. Serv. Eng. Res. Technol. 2017, 5, 505–521. [Google Scholar]
  7. Lin, Z.; Zhou, T.T.; Tang, C.F. Stratum ventilation: A conceptual introduction. In Proceedings of the 10th International Conference on Indoor Air Quality and Climate, Beijing, China, 4–9 September 2005; pp. 3260–3264. [Google Scholar]
  8. Zhang, S.; Lin, Z.; Ai, Z.T.; Huan, C.; Cheng, Y.; Wang, F.H. Multi-criteria performance optimization for operation of stratum ventilation under heating mode. Appl. Energy 2019, 239, 969–980. [Google Scholar] [CrossRef]
  9. Fong, M.L.; Lin, Z.; Fong, K.F.; Chow, T.T.; Yao, T. Evaluation of thermal comfort conditions in a classroom with three ventilation methods. Indoor Air 2011, 3, 231–239. [Google Scholar] [CrossRef]
  10. Luis, A.R.; Cesar, C. Numerical study and optimization of air-conditioning systems grilles used in indoor environments. Int. J. Energy Environ. Eng. 2021, 12, 787–804. [Google Scholar]
  11. Zhang, L.N.; Mao, Y.H.; Tu, Q.; Wu, X.G.; Tan, L.Y. Effects of Supply Parameters of Stratum Ventilation on Energy Utilization Efficiency and Indoor Thermal Comfort: A Computational Approach. Math. Probl. Eng. 2021, 2021, 1–16. [Google Scholar] [CrossRef]
  12. Wang, C.H.; Liu, J.J.; Yu, C.W.; Xie, D. Numerical analysis for the optimization of multi-parameters stratum ventilation and the effect on radon dispersion. J. Build. Eng. 2022, 62, 39–47. [Google Scholar] [CrossRef]
  13. Diana, I.; John, B.; Dominik, W.; Biljana, M.; Max, C.; Felix, C. Quantifying the potential for climate change mitigation of consumption options. Environ. Res. Lett. 2020, 15, 093001. [Google Scholar]
  14. Ehsan, E.; Zainab, K.; Muhammad, Z.T.; Zhang, H.X.; Xing, L.R. Extreme weather events risk to crop-production and the adaptation of innovative management strategies to mitigate the risk: A retrospective survey of rural Punjab, Pakistan. Tecnovation 2022, 117, 102255. [Google Scholar]
  15. Sanna, M.; Annela, A.K. Social impacts of climate change mitigation policies and their implications for inequality. Clim. Policy 2019, 19, 827–844. [Google Scholar]
  16. Ehsan, E.; Zainab, K. Estimating smart energy inputs packages using hybrid optimization technique to mitigate environmental emissions of commercial fish farms. Appl. Energy 2022, 326, 119602. [Google Scholar]
  17. Bai, Y.; Wan, T.C. The SPA-TOPSIS-Based evaluating approach on thermal sensation model at different vane angles in UFAD–DV system. Arab. J. Sci. Eng. 2021, 46, 1787–1802. [Google Scholar] [CrossRef]
  18. Wan, T.C.; Bai, Y.; Wu, L.L.; He, Y.E. Multi-criteria decision making of integrating thermal comfort with energy utilization coefficient under different air supply conditions based on human factors and 13-value thermal comfort scale. J. Build. Eng. 2021, 39, 102249. [Google Scholar] [CrossRef]
  19. Frankenfield, D.C.; Muth, E.R.; Rowe, W.A. The Harris-Benedict studies of human basal metabolism: History and limitations. J. Am. Diet. Assoc. 1998, 98, 439–445. [Google Scholar] [CrossRef]
  20. Rao, Z.; Wu, X. Difference between predictive and measured resting energy expenditure in healthy subjects. Chin. J. Tissue Eng. Res. 2010, 14, 8707–8711. [Google Scholar]
  21. Hasson, R.E.; Howe, C.A.; Jones, B.L.; Freedson, P.S. Accuracy of four resting metabolic rate prediction equations: Effects of sex, body mass index, age, and race/ ethnicity. J. Sci. Med. Sport 2011, 14, 344–351. [Google Scholar] [CrossRef]
  22. DuBois, D. A formula to estimate approximate surface area, if height and weight are known. Arch. Int. Med. 1916, 17, 63–71. [Google Scholar]
  23. Ireton-Jones, C.; James, D.J. Improved equations for predicting energy expenditure in patients: The Ireton Jones Equations. Nutr. Clin. Pract. 2005, 17, 29–31. [Google Scholar] [CrossRef] [PubMed]
  24. Zhang, S.; Lin, Z.; Ai, Z.; Wang, F.; Cheng, Y.; Huan, C. Effects of operation parameters on performances of stratum ventilation for heating mode. Build. Environ. 2019, 145, 55–66. [Google Scholar] [CrossRef]
  25. Arnaud, L.; Mathias, C.; Benjamin, K.; Olivier, L.M. Optimization principle and application of forced ventilation in railway tunnels based on improved TOPSIS theory and CFD simulations. Adv. Mech. Eng. 2021, 235, 168781402110176. [Google Scholar]
  26. Liang, S.S.; Li, B.Z.; Tian, X.; Cheng, Y.; Liao, C.H.; Zhang, J.H.; Liu, D. Determining optimal parameter ranges of warm supply air for stratum ventilation using Pareto-based MOPSO and cluster analysis. J. Build. Eng. 2021, 37, 102145. [Google Scholar] [CrossRef]
  27. Talib, R.; Nassif, N. Heating Ventilation and Air Conditioning Systems Performance Optimization Using a Two-Level Optimization Ap-proach. ASHRAE Trans. 2021, 1, 505–513. [Google Scholar]
  28. Jung, D.H.; Kim, H.J.; Kim, J.; Lee, T.S. Design Optimization of Proportional Plus Derivative Band Parameters Used in Greenhouse Ventila-tion by Response Surface Methodology. Ecol. Restor. 2020, 38, 187–200. [Google Scholar]
  29. Turkane, S.D.; Chouksey, S.K. Application of response surface method for optimization of stabilizer dosages in soil stabilization. Innov. Infrastruct. Solut. 2022, 7, 106. [Google Scholar] [CrossRef]
  30. UNE-EN ISO 7730-2006; Ergonomics of the Thermal Environment-Analytical Determination and Interpretation of Thermal Comfort Using Calculation of the PMV and PPD Indices and Local Thermal Comfort Criteria. International Standard Organization: Brussels, Belgium, 2006; pp. 1–25.
  31. ASHRAE. Thermal Environmental Conditions for Human Occupancy, ASHRAE Standard 55-2013; American Society of Heating, Refrigerating and Air-conditioning Engineers: Atlanta, Georgia, 2017. [Google Scholar]
  32. Cheng, Y.; Fong, M.L.; Yao, T.; Lin, Z.; Fong, K.F. Uniformity of stratum ventilated thermal environment and thermal sensation. Indoor Air 2014, 24, 521–532. [Google Scholar] [CrossRef]
  33. Chen, H.; Moshfegh, B.; Cehlin, M. Computational investigation on the factors influencing thermal comfort for impinging jet ventilation. Build. Environ. 2013, 66, 29–41. [Google Scholar] [CrossRef]
  34. Yang, W.X. Analysis on Operational Regulation of Heat Metering Systems; Tianjin University: Tianjin, China, 2012. [Google Scholar]
  35. Li, Y.; Miao, Y.; Bao, J.H. AIRPAK simulation research on residential indoor air quality. Sci. Total Environ. 2014, 472, 1137–1144. [Google Scholar]
  36. Mao, N.; Hao, J.Y.; He, T.B.; Song, M.J.; Xu, Y.J.; Deng, S.M. PMV-based dynamic optimization of energy consumption for a residential task/ambient air conditioning system in different climate zones. Renew. Energy 2019, 142, 41–54. [Google Scholar] [CrossRef]
  37. Ren, F.; Du, J.; Cai, Y.F. Solidification performance analysis of bionic spider web vertical latent heat system based on response surface method optimization. J. Energy Storage 2022, 55, 122–134. [Google Scholar] [CrossRef]
  38. Zhou, L.; Wang, Z.; Shi, J. Optimization Design of the Integral Inertial Particle Separator Based on Response Surface Method. J. Appl. Fluid Mech. 2020, 13, 133–145. [Google Scholar] [CrossRef]
  39. Design Expert Version 8.0.6. User’s Guide; Stat-Ease Inc: Minneapolis, MN, USA, 2007.
  40. Mulay, A.; Rathod, V.K. Ultrasound-assisted synthesis of ethyl hexanoate using heterogeneous catalyst: Optimization using Box-Behnken design. J. Indian Chem. Soc. 2022, 99, 100573. [Google Scholar] [CrossRef]
  41. Yu, J.; Zhang, H.L. Thermal Comfort of The Patients and Its Influence about Evaluating of Thermal Environment. Refrig. Air Cond. 2015, 29, 505–508. (In Chinese) [Google Scholar]
  42. Ali, P.; Konstadinos, H. Security/stability-based Pareto optimal solution for distribution networks planning implementing NSGAII/FDMT. Energy 2020, 192, 116644. [Google Scholar]
  43. Scherbakov, A.; Butyrin, A.; Stativa, E.; Larkina, A.; Verbova, N. Structural optimization of a mobile rope transport system hydro pipe based on pareto-optimal solutions. Transp. Res. Procedia 2022, 63, 1489–1497. [Google Scholar] [CrossRef]
  44. Federico, P.; Elisa, B.; Loris, V. A multi-objective optimization approach for FE model updating based on a selection criterion of the pre-ferred Pareto-optimal solution. Structures 2021, 33, 916–934. [Google Scholar]
  45. Joshua, C.; Laura, M.; James, T. Comparison of genetic algorithm to particle swarm for constrained simulation-based optimization of a geothermal power plant. Adv. Eng. Inform. 2014, 1, 81–90. [Google Scholar]
  46. Jia, F.; Lichti, D. A comparison of simulated, genetic algorithm and particle swarm optimization in optimal first-order design of indoor tells networks. In Proceedings of the ISPRS Annals of Photogrammetry, Remote Sensing and Spatial Information Sciences, Wuhan, China, 18–22 September 2017. [Google Scholar]
  47. Shi, H.T.; Li, Y.F.; Jiang, Z.N.; Zhang, J. Comprehensive power quality evaluation method of microgrid with dynamic weighting based on CRITIC. Meas. Control. 2021, 54, 5–6. [Google Scholar] [CrossRef]
  48. Behzadian, M.; Otaghsara, S.K.; Yazdani, M.; Ignatius, J. A state-of the-art survey of TOPSIS applications. Expert Syst. Appl. 2012, 17, 51–69. [Google Scholar] [CrossRef]
  49. Kannan, S.; Baskar, S.; McCalley, J.D.; Murugan, P. Application of NSGA-II algorithm to generation expansion planning. IEEE Trans. Power Syst. 2008, 24, 454–461. [Google Scholar] [CrossRef]
  50. Pan, B.H.; Liu, S.R.; Xie, Z.J.; Shao, Y.; Li, X.; Ge, R.C. Evaluating operational features of three unconventional intersections under heavy traf-fic based on CRITIC method. Sustainability 2021, 113, 4098. [Google Scholar] [CrossRef]
  51. Gilani, S.; Montazeri, H.; Blocken, B. CFD simulation of stratified indoor environment in displacement ventilation: Validation and sensi-tivity analysis. Build. Environ. 2016, 95, 299–313. [Google Scholar] [CrossRef]
  52. Melikov, A.; Popiolek, Z.; Silva, M.C.G.; Care, I.; Sefker, T. Accuracy limitations for low velocity measurements and draft assessment in rooms. HVAC R Res. 2007, 13, 971–986. [Google Scholar] [CrossRef]
  53. Davardoost, F.; Kahforoushan, D. Evaluation and investigation of the effects of ventilation layout, rate, and room temperature on pollu-tion dispersion across a laboratory indoor environment. Environ. Sci. Pollut. Res. 2019, 26, 5410–5421. [Google Scholar] [CrossRef]
  54. Zhang, S.; Sun, Y.; Cheng, Y.; Huang, P.; Oladokun, M.O.; Lin, Z. Response-surface-model based system sizing for nearly/net zero energy buildings under uncertainty. Appl. Energy 2018, 228, 1020–1031. [Google Scholar] [CrossRef]
  55. Bai, Y.; Wang, T.X.; Wan, T.C. Multi-criteria performance dynamic optimization for heating operation of stratum ventilation considering different metabolic rates. Arab. J. Sci. Eng. 2022, 14, 542–554. [Google Scholar] [CrossRef]
  56. Ahmed, F.; Abdul, A.M.S.; Mohd, A.Z.M.R.R.; Yee, K.C.; Shaik, F.; Che, H.D.S.; Mohd, S.M.A.A.; Kheimi, M. Design, Modelling and Optimization of a Novel Concentrated Solar Powered (CSP) Flash Desalination System Involving Direct Heating and Pressure Modulation Using Response Surface Methodology (RSM). Sustainability 2022, 14, 11558. [Google Scholar] [CrossRef]
  57. Aminia, R.; Ghaffarianhoseinib, A.; Berardi, U. Numerical investigation of indoor thermal comfort and air quality for a multi-purpose hall with various shading and glazing ratios. Therm. Sci. Eng. Prog. 2021, 22, 2–13. [Google Scholar] [CrossRef]
Figure 1. (a) Physical model of a typical office; (b)Setup of the test office.
Sustainability 15 02804 g001
Figure 2. Grid-independent tests.
Sustainability 15 02804 g002
Figure 3. Framework for determining the combinatorial optimization strategy.
Sustainability 15 02804 g003
Figure 4. Comparisons of velocities and temperatures between CFD simulations and experiments.
Sustainability 15 02804 g004
Figure 5. Comparisons between ventilation performance from response surface models (RSM) and CFD simulations; (a) comparison of PMV data; (b) comparison of energy consumption data; (c) comparison of ΔT data; (d) comparison of LMAA data.
Sustainability 15 02804 g005
Figure 6. The optimal operations of supply air velocity and supply air temperature at different outdoor air temperatures for different metabolic rates; (a) Optimal air supply operation at 0.8 met; (b) Optimal air supply operation at 1.0 met; (c) Optimal air supply operation at 1.2 met.
Sustainability 15 02804 g006
Figure 7. The optimized efficiency on average of four criteria of ventilation performance at different outdoor air temperature.
Sustainability 15 02804 g007
Figure 8. The weight coefficients of the four indicators.
Sustainability 15 02804 g008
Figure 9. Energy consumption changes under different outdoor air temperatures.
Sustainability 15 02804 g009
Figure 10. The average proportion of the variation interval of the optimal ventilation parameters in the entire range.
Sustainability 15 02804 g010
Table 1. Cases determined by Box–Behnken design and related ventilation performance from the CFD simulations.
CasesDesign ParametersDesign Responses
M (m)Ts (°C)VS (m3/s)Tout (°C)PMV (−)QS (W)ΔT (°C)LMAA (s)
10.8250.0350.0649541.5322.5712769.264
21280.04−10.3331046.913.5101654.23
31.2280.0451.24784.9592.1234640.965
41250.0450.52766.4511.7568625.036
51280.04111.52669.3441.4474642.562
61250.05−10.0011246.032.1721441.689
71250.05111.12740.9930.5249463.341
81220.04110.678486.1730.3126562.581
91.2250.0550.8121007.871.2172524.109
101220.0350.066487.0351.8743686.5
111280.0551.021118.721.836445.451
121.2220.0450.368688.5971.4861608.267
130.8250.0550.246987.9141.527523.726
141250.03−1−0.241676.2243.415778.392
151220.0550.062873.6510.8011420.369
160.8280.0450.608843.9662.1915637.416
171.2250.0350.762509.5772.3996779.837
181220.04−1−0.495868.9512.2121539.563
191280.0350.79605.1192.5352809.483
201250.03111.11418.0161.3184790.363
210.8250.04110.8569.0381.191637.09
221.2250.04−10.262967.8452.6326626.56
230.8250.04−1−0.448949.9833.001622.618
240.8220.045−0.153668.0431.3934643.663
251.2250.04111.289558.3650.79253626.245
Table 2. Statistical analyses of the developed response surface models.
Thermal ComfortEnergy Consumption
PMVΔTLMAAQs (W)
p<0.0001<0.0001<0.0001<0.0001
R20.99810.97370.93210.9967
Adjusted R20.99680.96840.91850.9944
Predicted R20.99390.95840.89210.9890
MAE0.01990.114522.24419.2019
SD0.03160.149331.9516.57
Note: MAE represents the mean absolute error (Equation (24) from RSM; SD represents the standard deviation (Equation (25)) from RSM.
Table 3. Pareto optimal solution set for outdoor air temperature of 1 ℃.
CasesM
(m)
Tout
(°C)
Ts
(°C)
Vs
(m3/s)
PMV
(−)
Qs
(W)
ΔT
(°C)
LMAA
(s)
11123.8090.0490.0001097.2971.830465.727
21122.0000.030−0.360572.0662.520735.531
31122.0000.050−0.2781047.2681.513436.319
41122.0000.030−0.360572.0452.520735.532
51122.0050.041−0.314832.5191.969571.627
61123.1940.030−0.219592.2882.705747.693
71124.6550.0380.025819.8772.545648.324
81125.0450.0300.001623.3892.990766.703
91122.8660.034−0.235677.7582.468689.160
101124.1570.032−0.089652.2242.768732.412
111122.0000.050−0.2781047.3071.514436.318
121123.7780.0500.0011114.7761.788454.553
131122.6010.039−0.241800.3632.163607.879
141123.7650.044−0.046959.7202.090544.624
151122.5500.037−0.255760.0172.235631.330
161124.4630.0450.0661013.1032.138534.000
171122.4850.050−0.2041054.0841.612448.439
181124.2280.0470.0491061.1941.994499.604
191122.8300.046−0.174972.4481.860509.321
201123.3040.041−0.130880.6232.148578.282
211124.0220.043−0.016942.2112.179562.061
221122.2830.045−0.259929.3381.827519.210
231123.0110.049−0.1241068.1391.705457.217
241124.5450.0410.045917.1082.338590.643
251123.0390.042−0.161893.1072.066563.491
261122.3100.031−0.319596.8772.527726.537
271124.4580.0450.0641009.0372.144536.157
281124.0610.030−0.111619.3512.814749.363
291125.0450.0300.001623.3892.990766.703
301122.0050.039−0.322786.1192.068600.845
Table 4. Optimal supply air parameters under different outdoor air temperatures.
Tout (°C)−101234567891011
Ts (°C)24.6024.6224.0223.4823.1122.0522.0122.0022.0022.0022.0022.0022.01
Vs (m3/s)0.0490.0460.0420.0420.0320.0480.0500.0490.0500.0470.0500.0500.048
Disclaimer/Publisher’s Note: The statements, opinions and data contained in all publications are solely those of the individual author(s) and contributor(s) and not of MDPI and/or the editor(s). MDPI and/or the editor(s) disclaim responsibility for any injury to people or property resulting from any ideas, methods, instructions or products referred to in the content.

