Article

Experimental and Finite Element Study on the Shear Performance of Existing Super-Span Concrete T-Beams Retrofitted with Glass Fiber-Reinforced Plastic

1
Construction Engineering Department, Shenyang University, Shenyang 110044, China
2
Liaoning Provincial Transportation Planning and Design Institute Co., Ltd., Shenyang 110057, China
*
Author to whom correspondence should be addressed.
Sustainability 2023, 15(3), 2768; https://doi.org/10.3390/su15032768
Submission received: 25 December 2022 / Revised: 31 January 2023 / Accepted: 31 January 2023 / Published: 3 February 2023

Abstract

:
Super-span, reinforced concrete, T-shaped cross-section beams (T-beams) with a service life of more than 30 years are widely used in highway bridges in China. Most of these beams have been retrofitted with glass fiber-reinforced plastic (GFRP) to prevent performance degradation. However, the actual shear performance, ultimate state, and failure mechanism of the existing retrofitted super-span concrete T-beams are currently unclear for many inextricable problems. To fill these gaps, in this study, one super-span concrete T-beam, in service for 31 years and retrofitted with GFRP, was extracted from a highway bridge to conduct shear experimentation in a structural laboratory. To assess the particularity of the specimen, finite element analysis was also conducted using ABAQUS software as a supplement to the shear tests. The failure procedure of the specimen was investigated, and the influence of the loading mode on the shear performance of a super-long and old T-beam was also studied. It is concluded that the failure of the super-span T-beam begins with small cracks at the bottom of the mid-span, rather than a loading point.

1. Introduction

With its recent economic and societal development, China has entered a period of high-speed development in civil engineering and infrastructure construction. Several bridges essential for the promotion of the Chinese economy have been built since the beginning of the 1980s. However, the general level of technology in the construction of this infrastructure was relatively low in the early period, and many engineering documents and design concepts from the former Soviet Union were applied. These bridges are generally characterized by their large size and super spans, including the kind of super-span, non-prestressed, T-shape concrete beams (T-beams) commonly seen in Chinese bridges.
The T-beam, with a thin web and relatively lightweight, is one of the main members of super-span bridges. The performance, particularly the shear performance, of T-beams is usually the principal focus of engineers and researchers. Shear failure is the most common type of brittle fracture, which is a complex mechanism. Research on the shear performance of concrete T-beams has been ongoing for a long time [1]. According to previous research, the shear bearing capacity of T-beams mainly comes from its web. However, recent studies have also found that the shear capacities of concrete T-beams calculated using design codes are generally lower. Most of the literature attributes this phenomenon to the neglect of the flange’s function [2,3,4]. The contribution of the flange to shear strength is determined by the effective width, which is also dependent on the section geometry and longitudinal reinforcement ratio [5]. It cannot be denied that shear failure appears to be more likely in T-beams with thin webs. The web of a T-beam affects its shear-bearing capacity.
However, for reinforced concrete (RC) beams, performance degradation is unavoidable in their service life. Service reliability is usually ensured by adding fiber-reinforcing polymers (FRPs) or other equivalent methods [6,7]. The excellent effects of retrofitting concrete T-beams with FRPs on their shear performance have been demonstrated by numerous studies [8,9,10,11,12,13,14,15,16,17,18,19], and the U-wrapping anchor method has also demonstrated more obvious effects [10,11]. In addition to the method used for FRP retrofitting, the amount of retrofitting needed is another critical problem. An optimal amount of shear FRP reinforcement exists for each T-beam [10]. Many researchers believe that integral reinforcement with FRP lamination has a better effect than FRP strips, potentially improving the ductility of concrete T-beams [10,12]. However, in the opinion of other researchers, the width of the strengthened strips should be harmonized with the inner shear reinforcement [13]. A literature review indicated that although FRP strips usually reinforce the web in the 90° fiber direction, the 45° fiber direction exhibits better reinforcement results [14]. The length of strip reinforcement is also a critical factor in the shear performance of T-beams, particularly for deep beams with a large height to thickness ratio [15]. The U-wrapped FRP strips attached at 45° onto the surface of the web enhanced the shear performance of the concrete T-beam to the greatest extent. Further studies indicated that U-wrapped FRP strips tended to undergo sudden brittle rupture or integral debonding under loading. Some studies have suggested that U-wrapped FRP strips should be anchored [16,17,18,19]. In fact, the effective functioning of the FRP is the key factor in ensuring effective shear reinforcement.
In addition to the studies mentioned above, finite element analysis has also proven to be an effective method for studying the shear performance of reinforced concrete (RC) beams [20,21,22,23], especially for old T-beams. The shear performance of old T-beams is typically predicted by finite element methods. For example, proxy finite element analysis (PFEA) provides an enhanced prediction of the shear performance of old beams [24].
Generally speaking, the shear performances of different kinds of concrete T-beams have been widely studied in previous research. Many important findings have been recognized by researchers. However, most of the existing studies executed experiments, usually using small-scale specimens in the laboratory because of the limitations of the testing site and specimen properties. Studies focusing on the actual service states and ultimate failure processes of original FRP-reinforced super-span concrete T-beams under shear loading are rare.
To fill this gap, in this research, a 20 m GFRP-retrofitted concrete T-beam was selected and removed from a 31-year-old highway bridge, and a shear test was performed on it in a structural laboratory. Many important patterns were discovered in our experiment. As a supplement to the test, finite element analysis was then carried out. After the bearing capacity, the stress state of the numerical model was verified to be accurate, and the strain distribution of the inner steel bars was studied. The influence of single-point and double-point loading on the shear performance of the super-span T-beam was investigated.

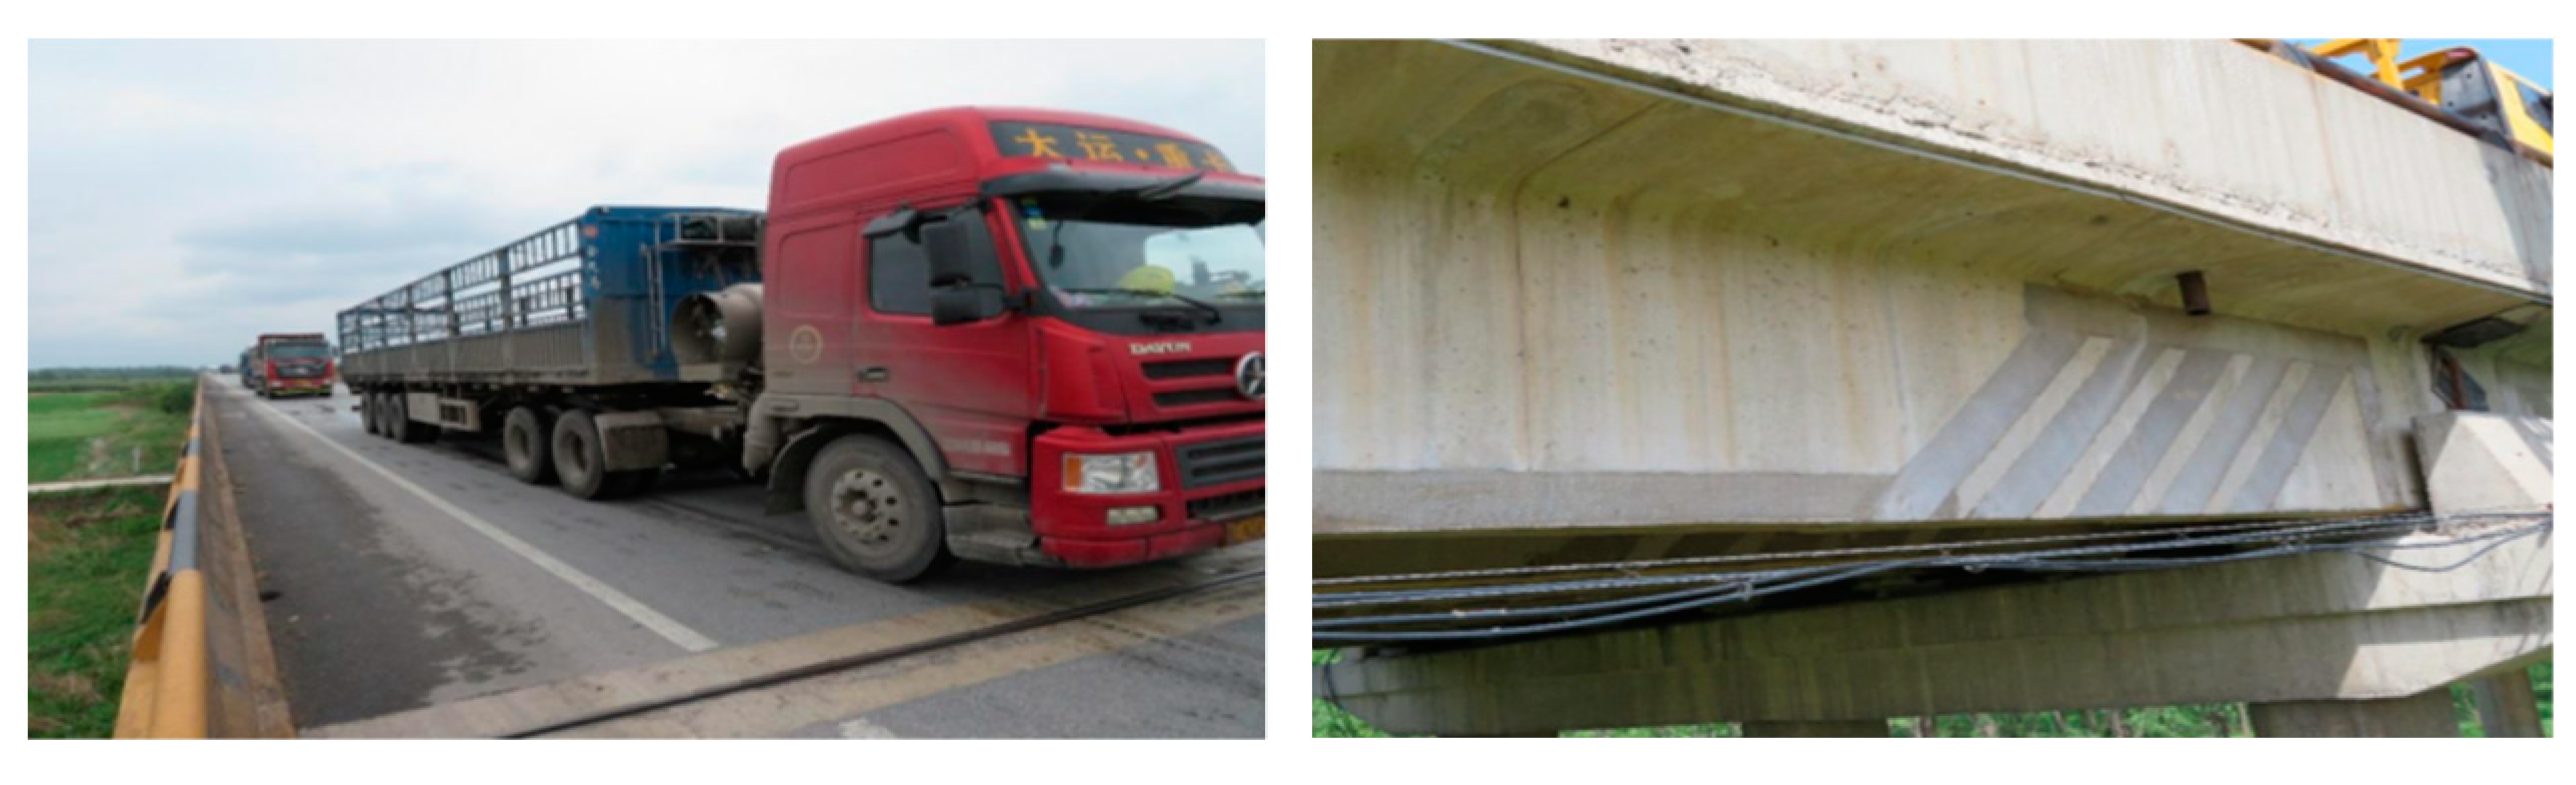
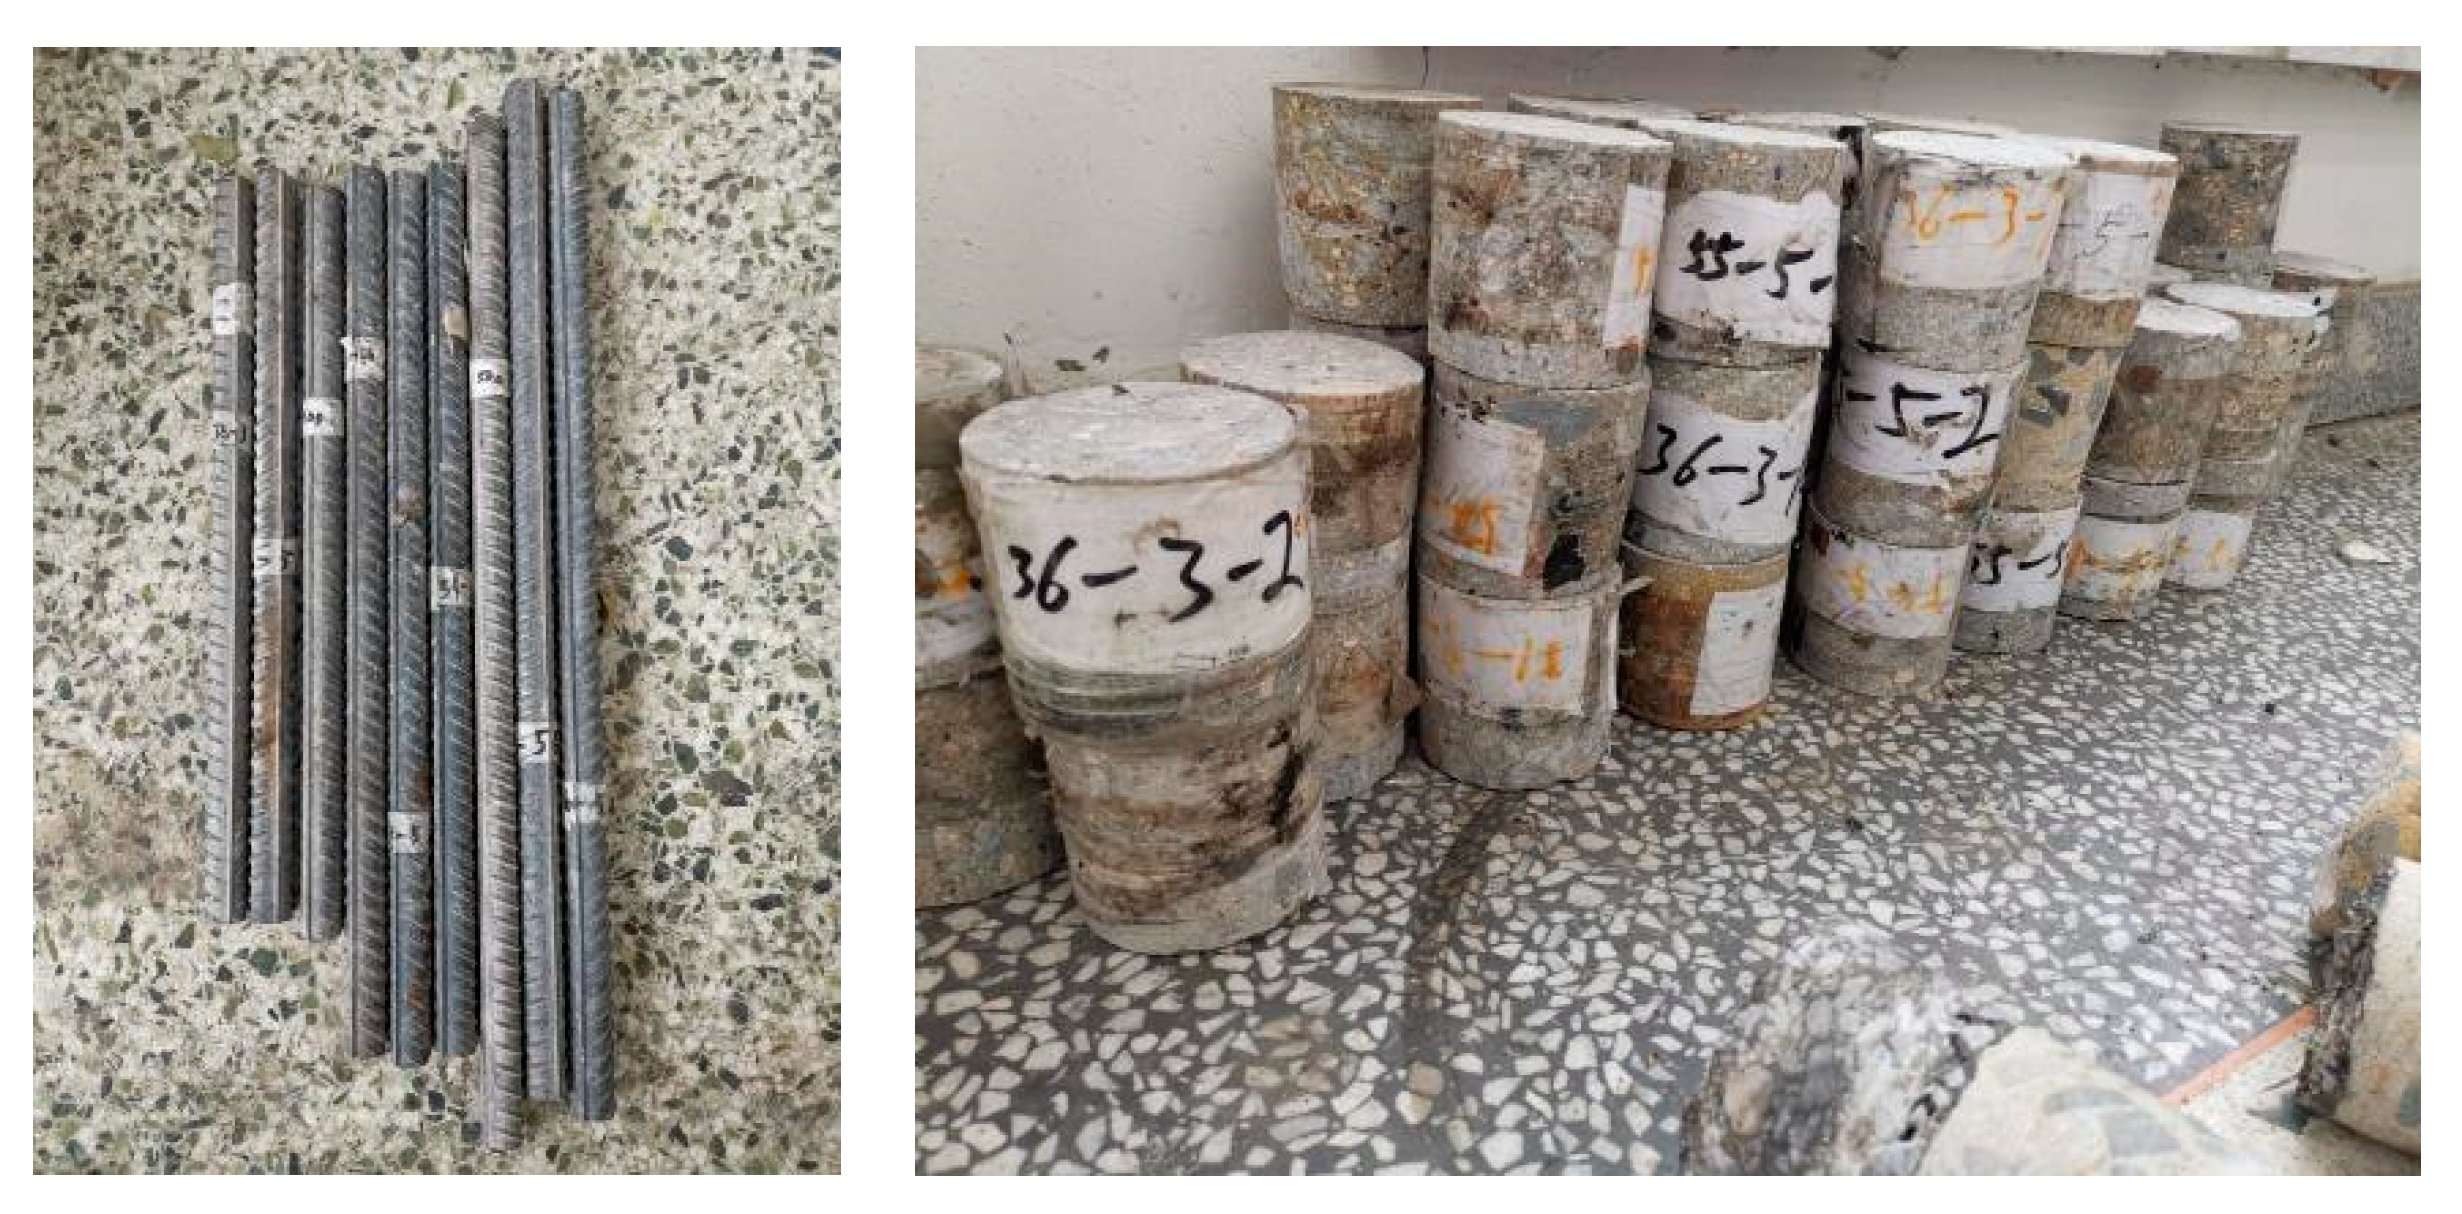
2. Experimental Research

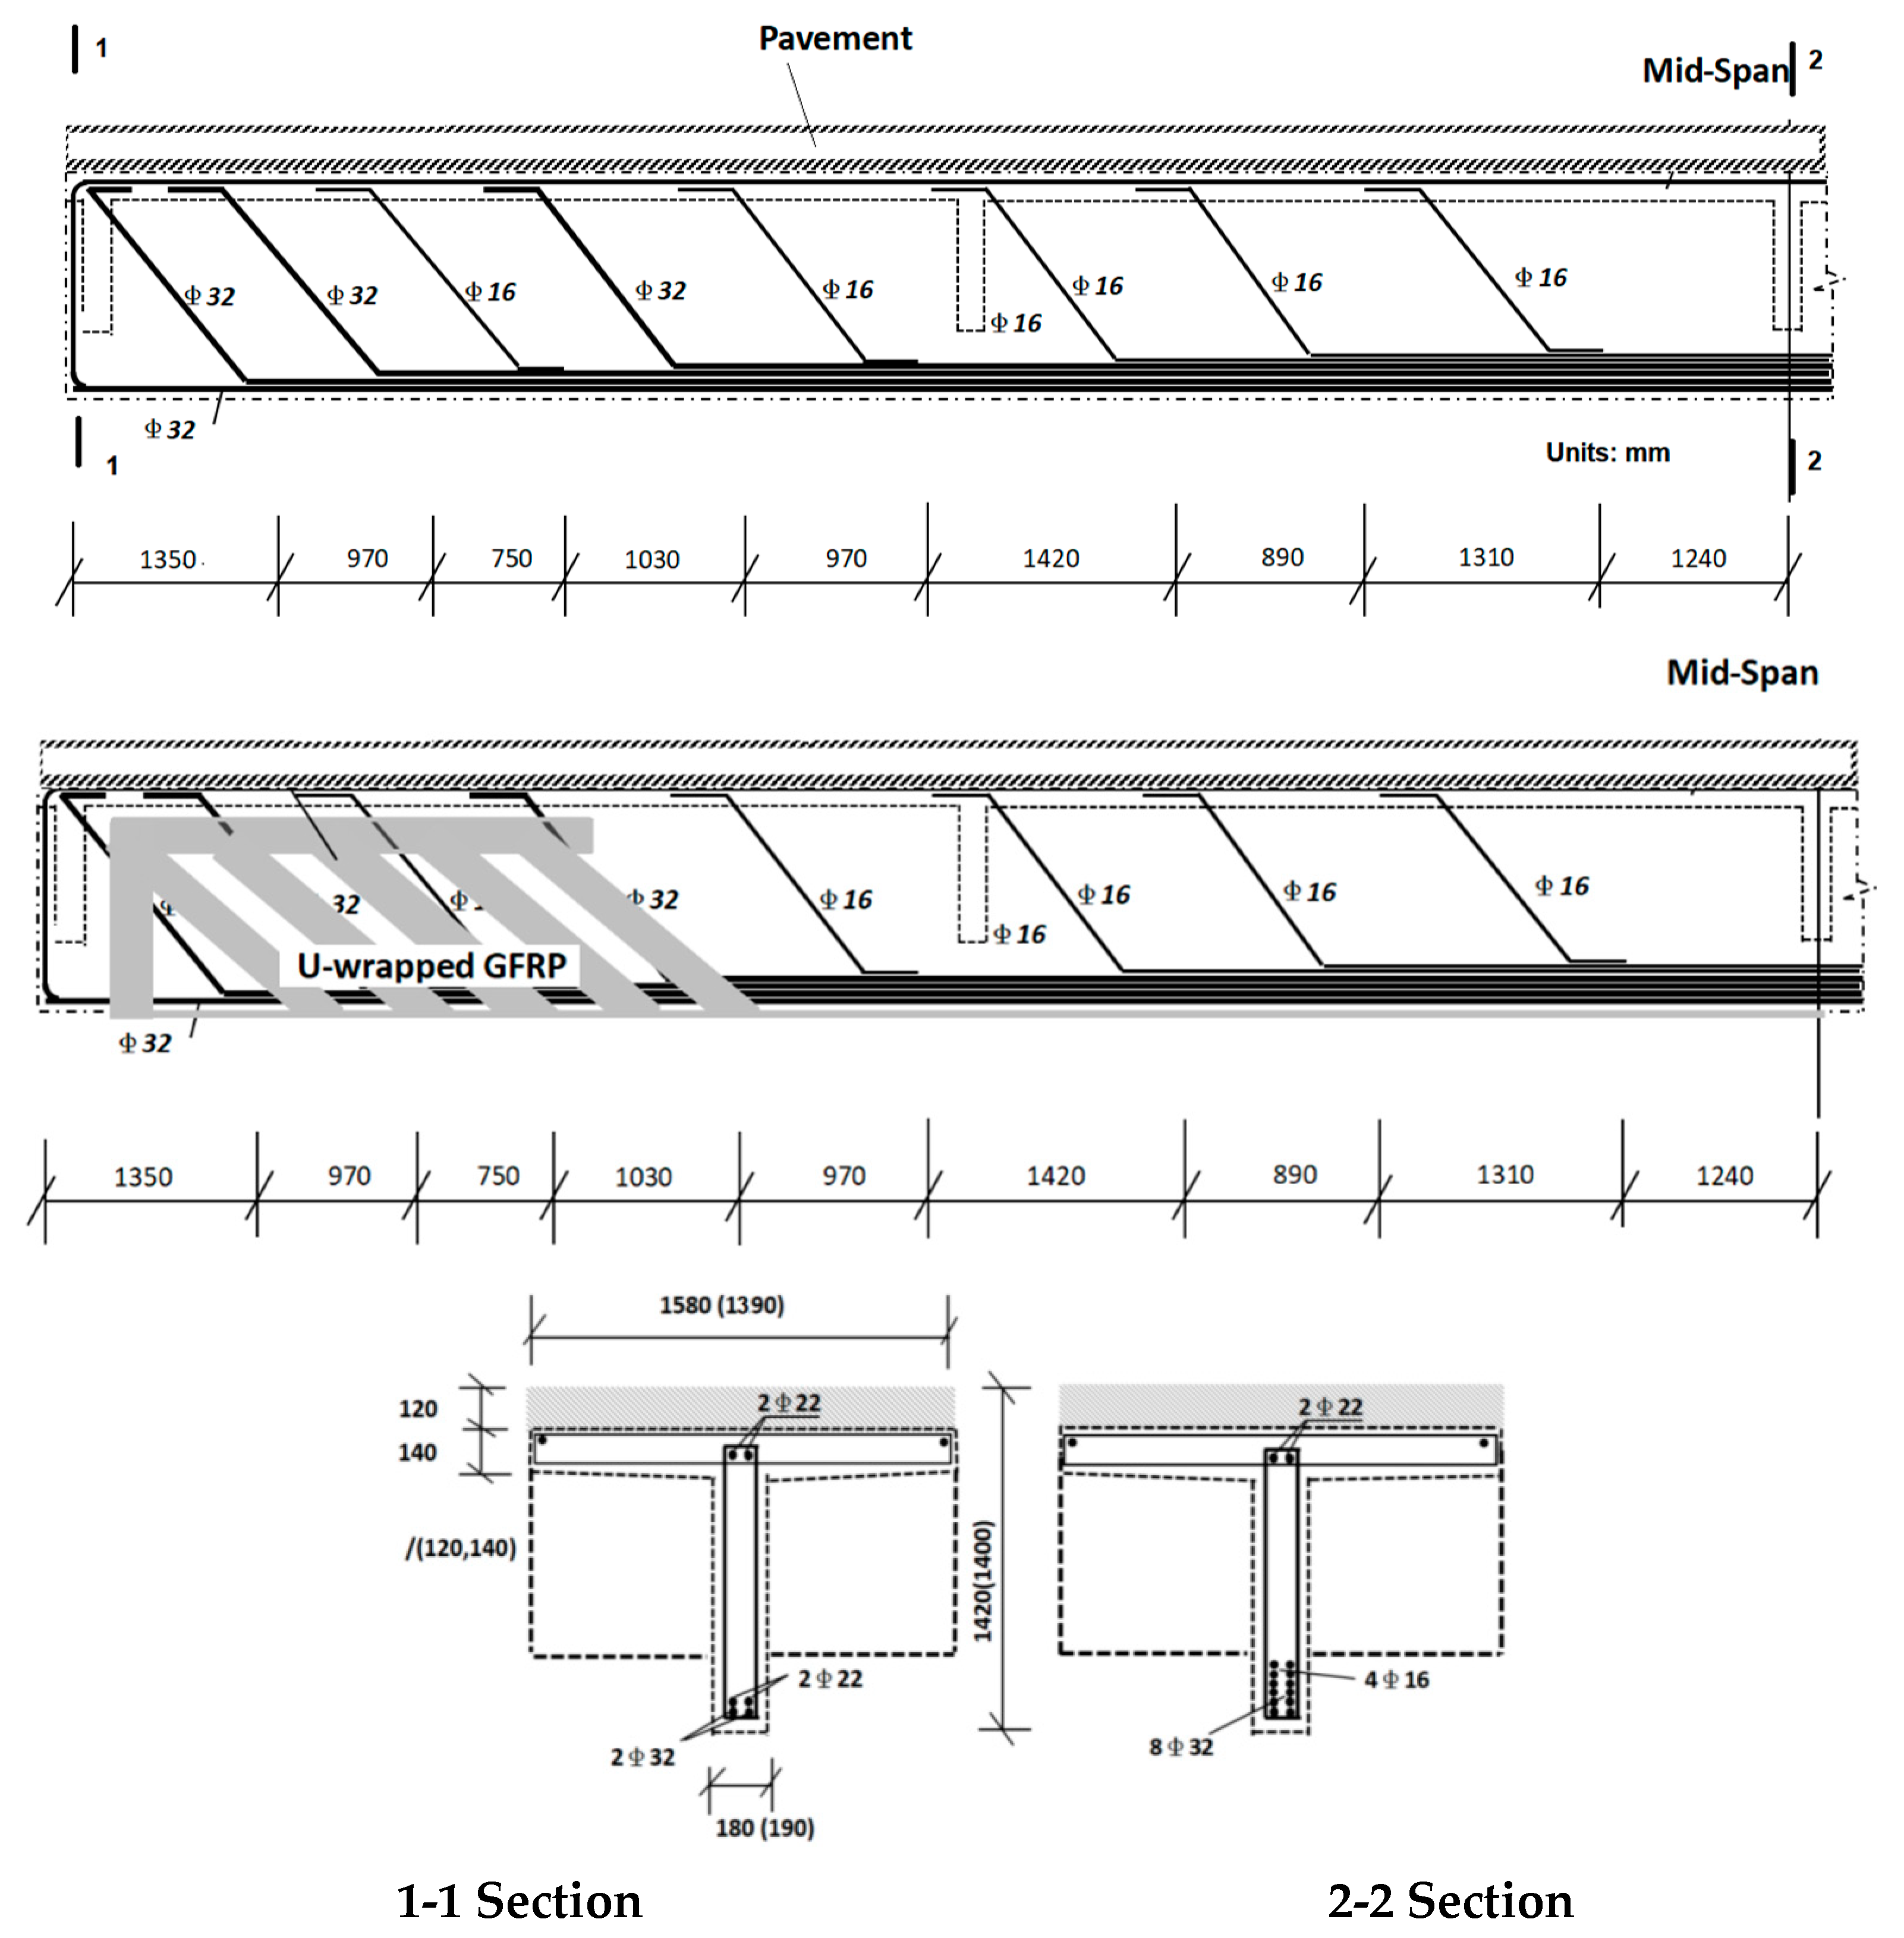
2.1. Detail of Specimen

The super-span concrete T-beam was obtained from a highway bridge in Liaoning Province of China, with a service life of 31 years. The bridge consists of RC T-beams with a 20 m span. GFRP strips were used to reinforce the T-beam to improve its shear performance, and a 120 mm-thick concrete pavement was recast on the top of the specimen in 2005. The bridge bears the heavy load of modern traffic.
Sufficient preparation was required to overcome the difficulties associated with transporting the super-span retrofitted concrete T-beam to the laboratory for shear testing, as shown in Figure 1. The detailed dimensions of the specimen, the internal reinforcement arrangement, and the arrangement of the external GFRP retrofitting are shown in Figure 2. The values outside the parentheses in Figure 2 are the nominal sizes of the specimen, and the values inside the parentheses are the actual sizes of the specimen in mm. As shown in Figure 2, the GFRP strip is 300 mm wide, spaced at 300 mm, and 1 mm thick. Table 1 lists the main parameters of the materials.
The standard values of the beam and pavement concretes’ compressive strengths were determined by compressive testing of core-drilled samples. The properties of the main reinforcement bars were determined by tensile testing. In total, 50 concrete samples and 27 steel bar samples were obtained from other beams under the same exact conditions, as shown in Figure 3. However, since GFRP strips cannot be removed from the specimen, the properties of the GFRP strips could not be obtained directly through material experimentation.

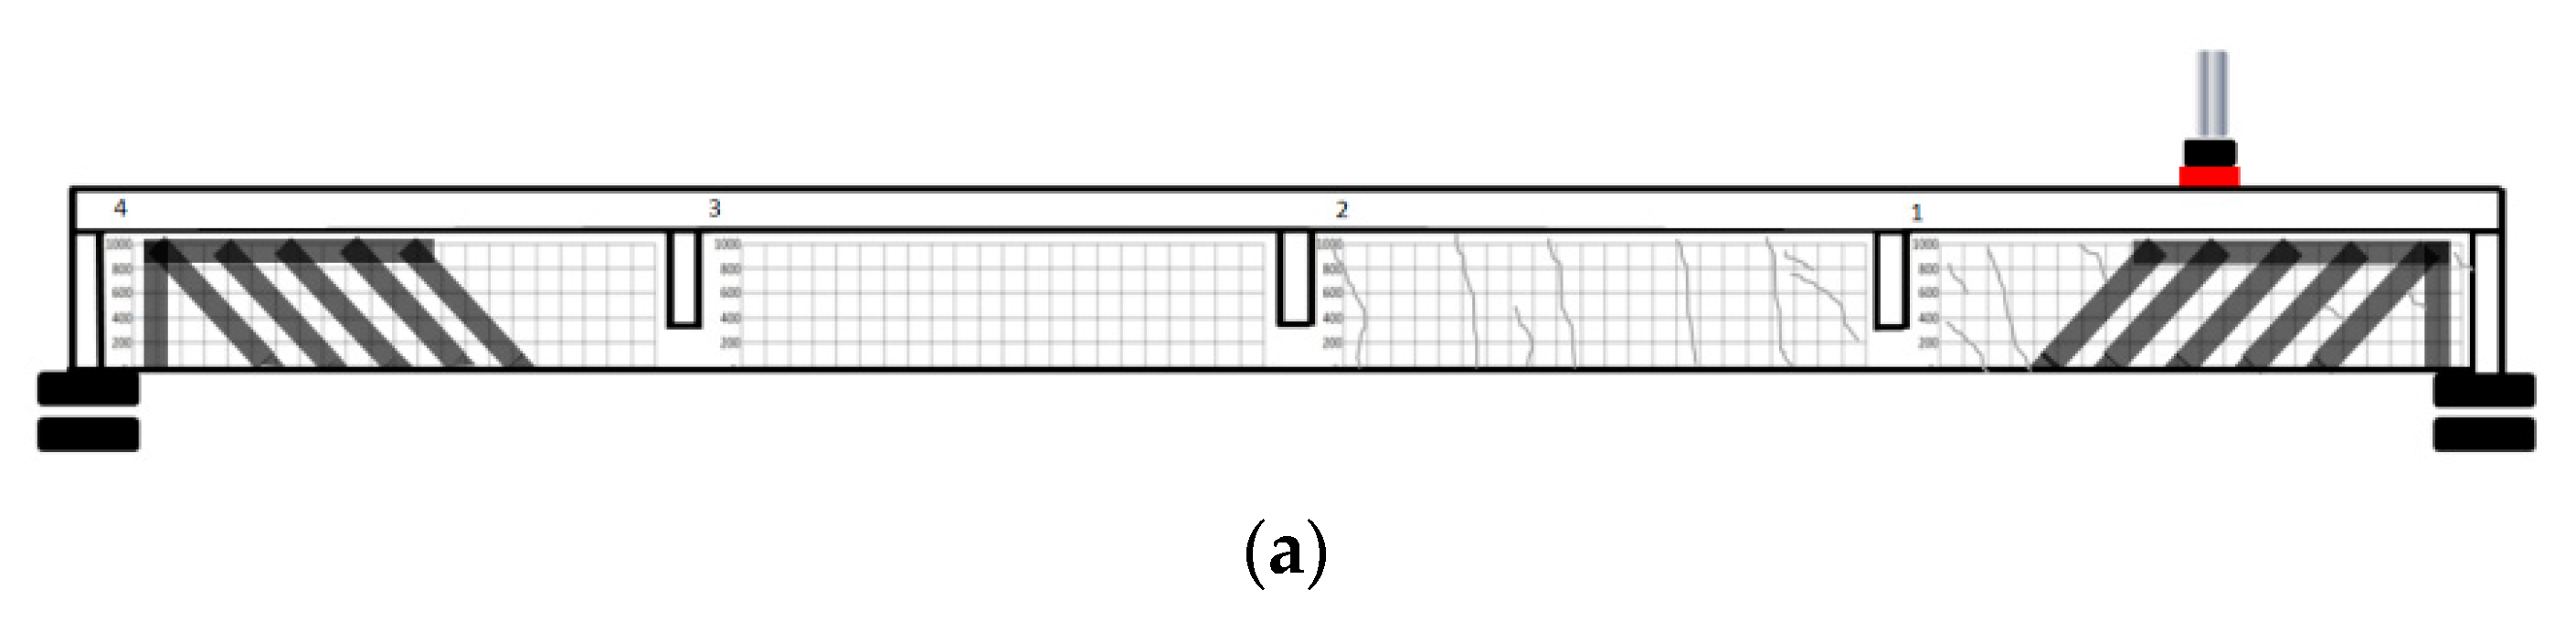
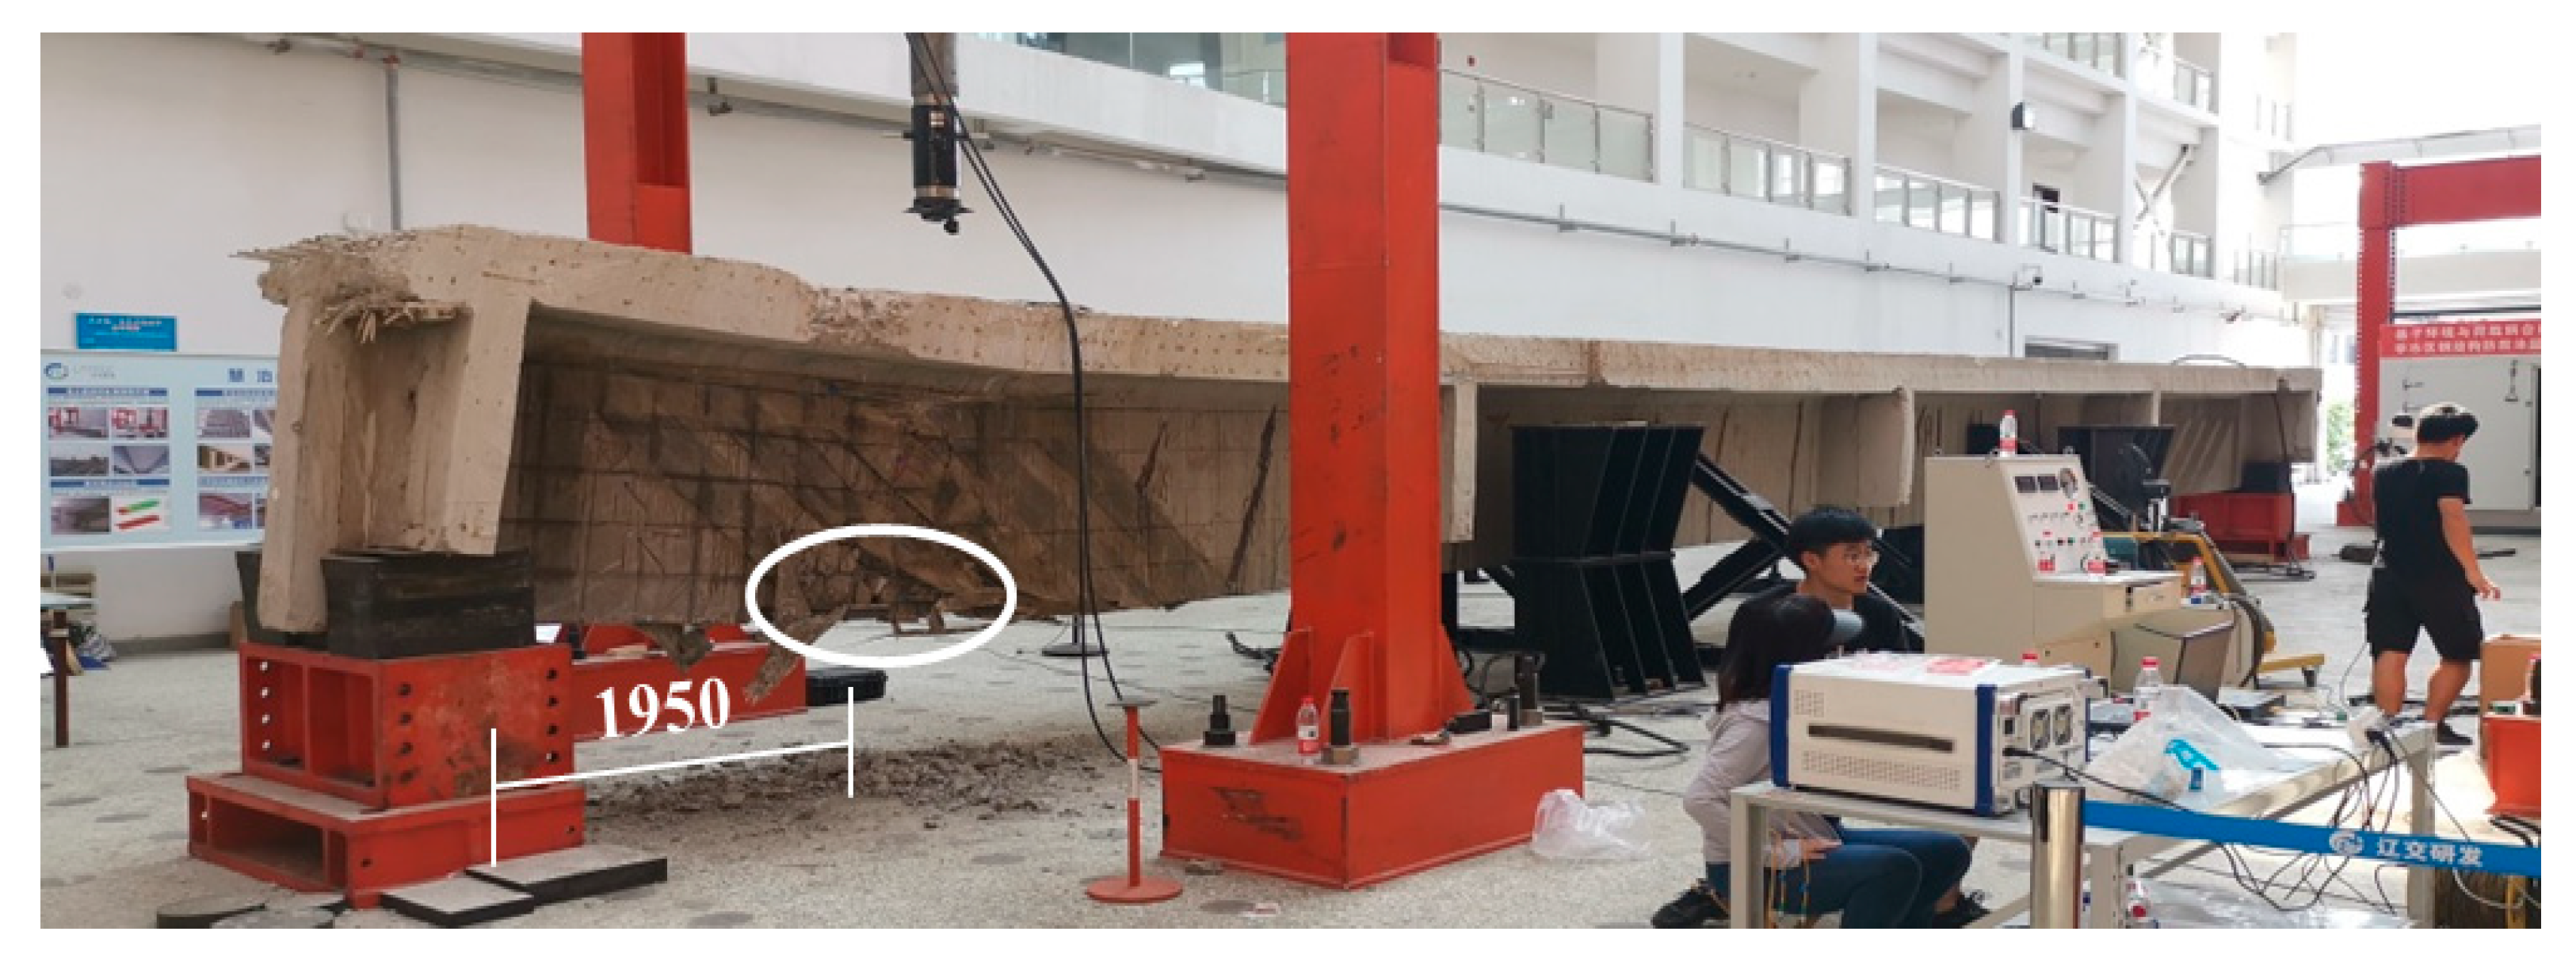
2.2. Experimental Setup

Reinforced T-beam specimens have super-long spans. It was difficult to carry out shear testing according to the four-point method. Therefore, unilateral shear loading was performed on the specimens according to the service conditions in practice. The loading point was set at a location 2250 mm away from the center of the support, and the pre-set shear span ratio λ was 1.58. The test device is shown in Figure 4a. The hydraulic jack with a maximum loading range of 2000 kN was fixed to the center of the crossbeam of the reaction frame. The load sensor was connected to the hydraulic jack. The loading head of the sensor was fixed to the steel loading plate. The loading plate was in contact with a standard rubber pad and placed on the surface of the pavement of the specimen. The supports of the specimen consisted of an upper rubber pad and lower rigid piers. The rigid piers were anchored to the ground. A pair of protective angle frames was placed on both sides of the 1/4 span and 3/4 span to ensure the specimen’s safety during the experiment. There was 50 mm of space existing between the specimen and the protective angle frame.
The gauges measuring the strain of the specimen were divided into two groups. Group I included nine strain rosettes, each of which consisted of three strain gauges with angles of 0°, 45°, and 90° within the shear span of the web at the end of the beam. The strain rosettes were all fixed on four parallel oblique axes, as shown in Figure 4b,c. Group Ⅱ included three longitudinal strain gauges, spaced 100 mm apart and located on the surface of the web below the loading point. The strain of each measured point was monitored by these strain gauges. A VIC-3D strain monitor was adopted on the opposite side to ensure the accuracy of the measured results. In addition, four dial indicators were mounted on the bottom of the web, located at the loading point, quartile span, and middle span.

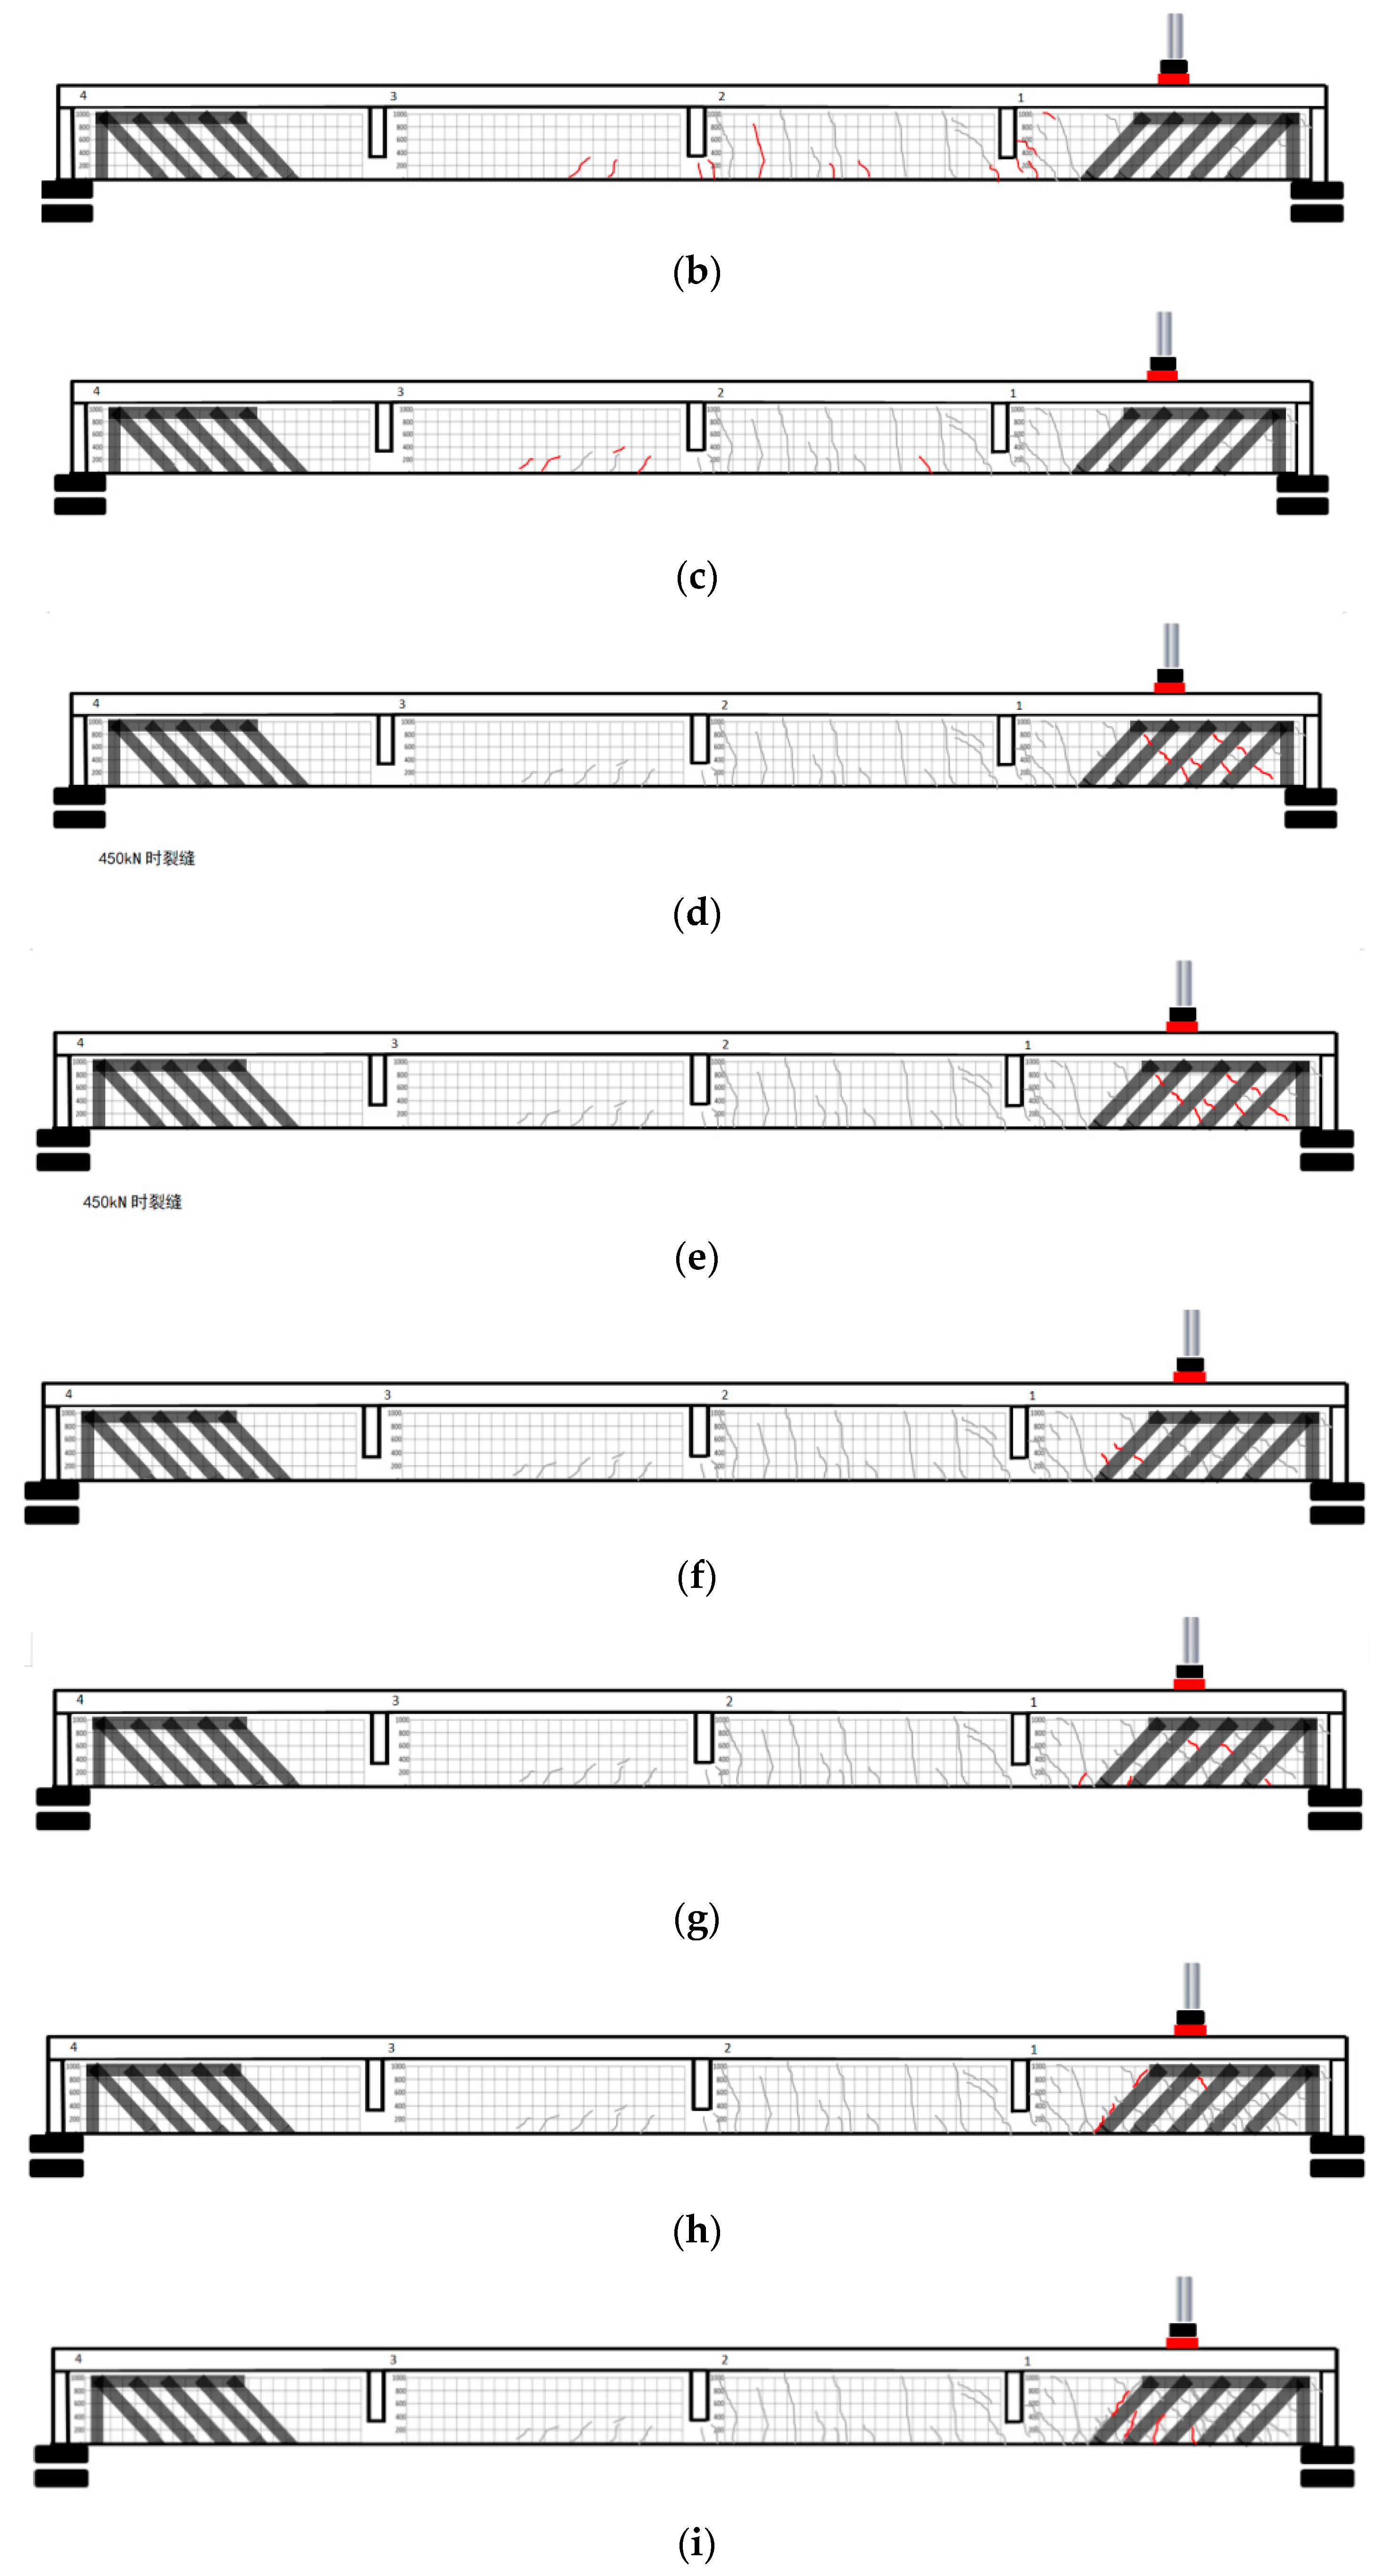
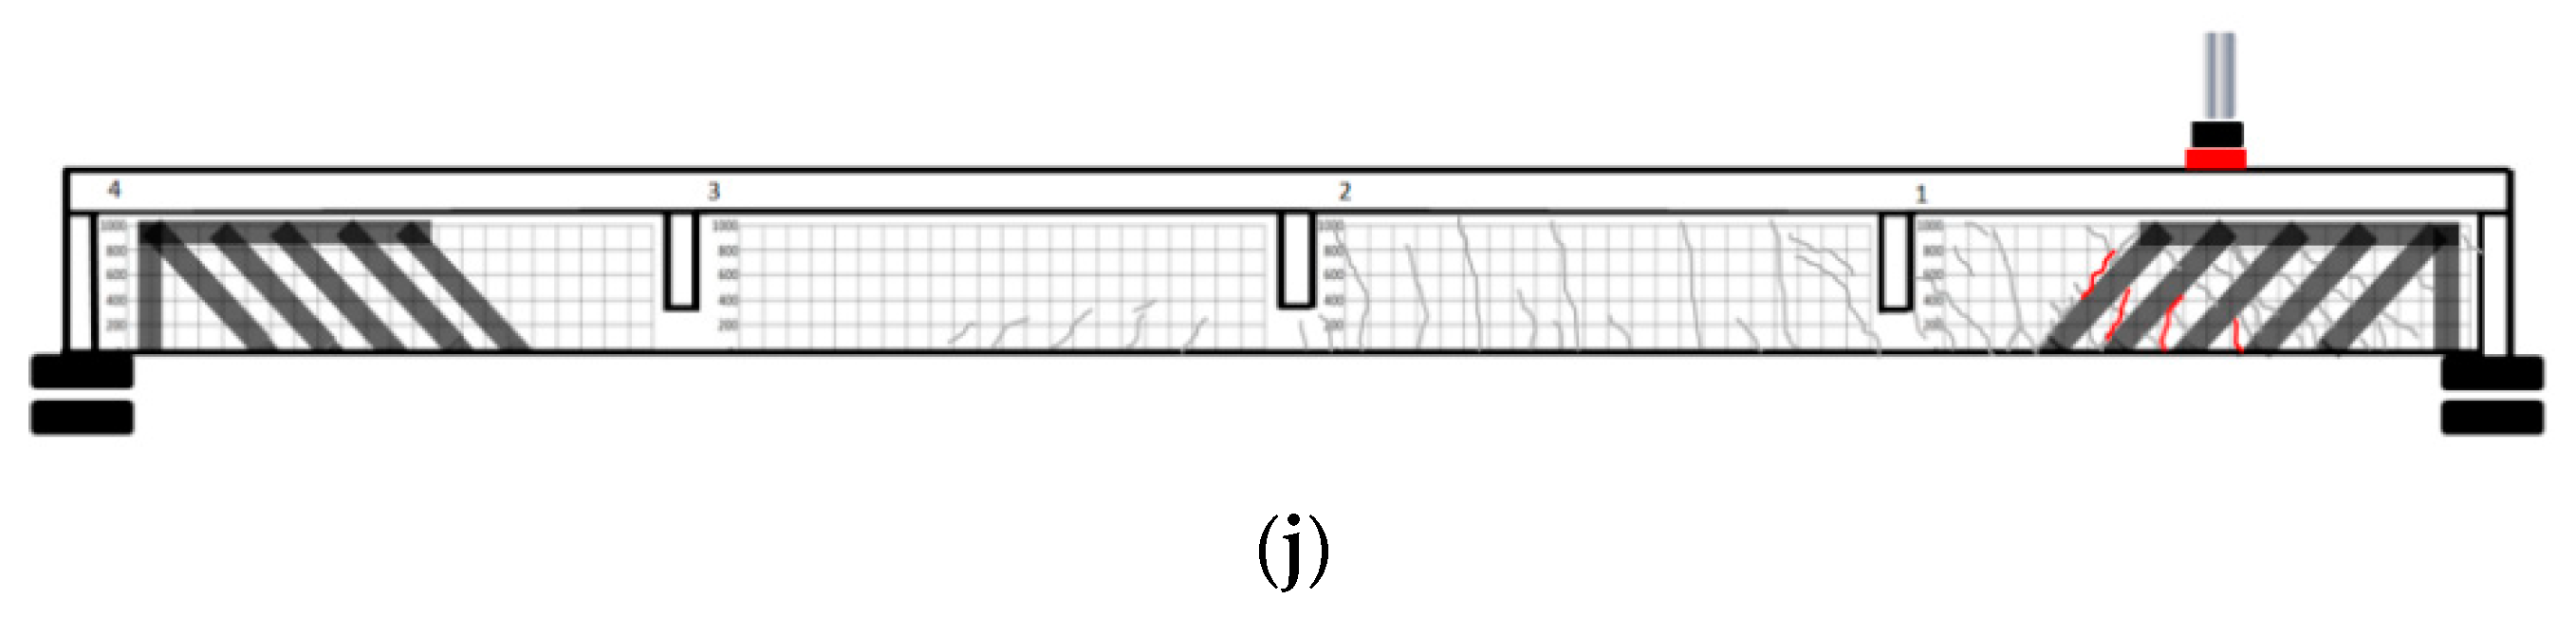
2.3. Experimental Process

The detailed distribution of the cracks in the process of failure of the specimen is shown in Figure 5. Surprisingly, under the action of unilateral shear, cracks first appeared at the mid-span of the reinforced super-span T-beam rather than at the loading point.
As shown in Figure 5, several new micro-cracks appeared near the bottom of the web at the mid-span section at 150 kN, and most of the cracks extended up to 200 mm. When the load reached 300 kN, the cracks on the webs at zones 2# and 3# expanded further, and the maximum crack width was 0.32 mm. The cracks on the bottom of the webs in zone 2# increased, and the maximum crack width was less than 0.2 mm. In the 450–600 kN load range, oblique cracks appeared in the area between the support and loading point along zone 4# on the web, and the maximum crack width was 0.24 mm. Most of the oblique cracks were restrained by GFRP strips, and a connected crack network did not form. In the 700–800 kN load range, the original cracks continued to develop, and new cracks were mainly located at the edge of the GFRP. The direction of the crack formation was the same as that of the line from the loading point to the end fulcrum, and the cracks were connected below the GFRP strips. A small number of 135° cracks perpendicular to the strips appeared at the edge of the GFRP (Figure 6a). In the 1100–1400 kN range, additional inclined cracks developed at 45° and 135° in the shear spans of zones 3# and 4#. The original cracks tended to expand further, and the cracks connected and extended under the GFRP. In the 1400–1550 kN range, the specimen exhibited obvious deformation, a viscose cracking sound frequently came from GFRP strips, and clear cracks in the GFRP strip gap developed almost parallel to the fiber direction (135°) (Figure 6b). In the 1600–1700 kN range, the fissures continued to expand and extend, with fibrous band gaps spreading across the fissures. Some fractures were connected to each other along the strip to form a fracture network. The deformation of the specimen increased, continuous brittle sounds were made by the fibers, and some of the fibers were stripped off. At 1910 kN, the specimen lost complete bearing capacity, accompanied by a loud noise, and the GFRP strips gradually debonded with the increase in deformation.
As seen from the failure pattern of the specimen, the loading ends of the specimen went up (Figure 7), and the self-loading points of cracks on the web presented an umbrella-shaped distribution in the downward direction (Figure 8a). Numerous GFRP strips debonded, and large sections of concrete broke and fell. After removing the GFRP and concrete protective layers from the surface of the specimen, the web crack’s morphology was found to be centered at the cross-section of the loading point, and the shear cracks spread diagonally on both sides. The crack near the edge of the support extended from the loading point to the support. The damage to the specimen resulting from the bent longitudinal reinforcement at the flex point was cut off (Figure 8b). The reinforcement’s shear-off point was located 1950 mm away from the end of the support, where the 32 longitudinal reinforcement bent upward and changed to the bending reinforcement.
The final reinforcement failure was that of the two 32 steel bars at the end of the span, which sheared. The left section of the two steel bars at both ends was long at the top and short at the bottom, whereas the right one was short at the top and long at the bottom. The lower two steel bars were the fracture points caused by shear (Figure 8c).

2.4. Analysis of Experimental Results

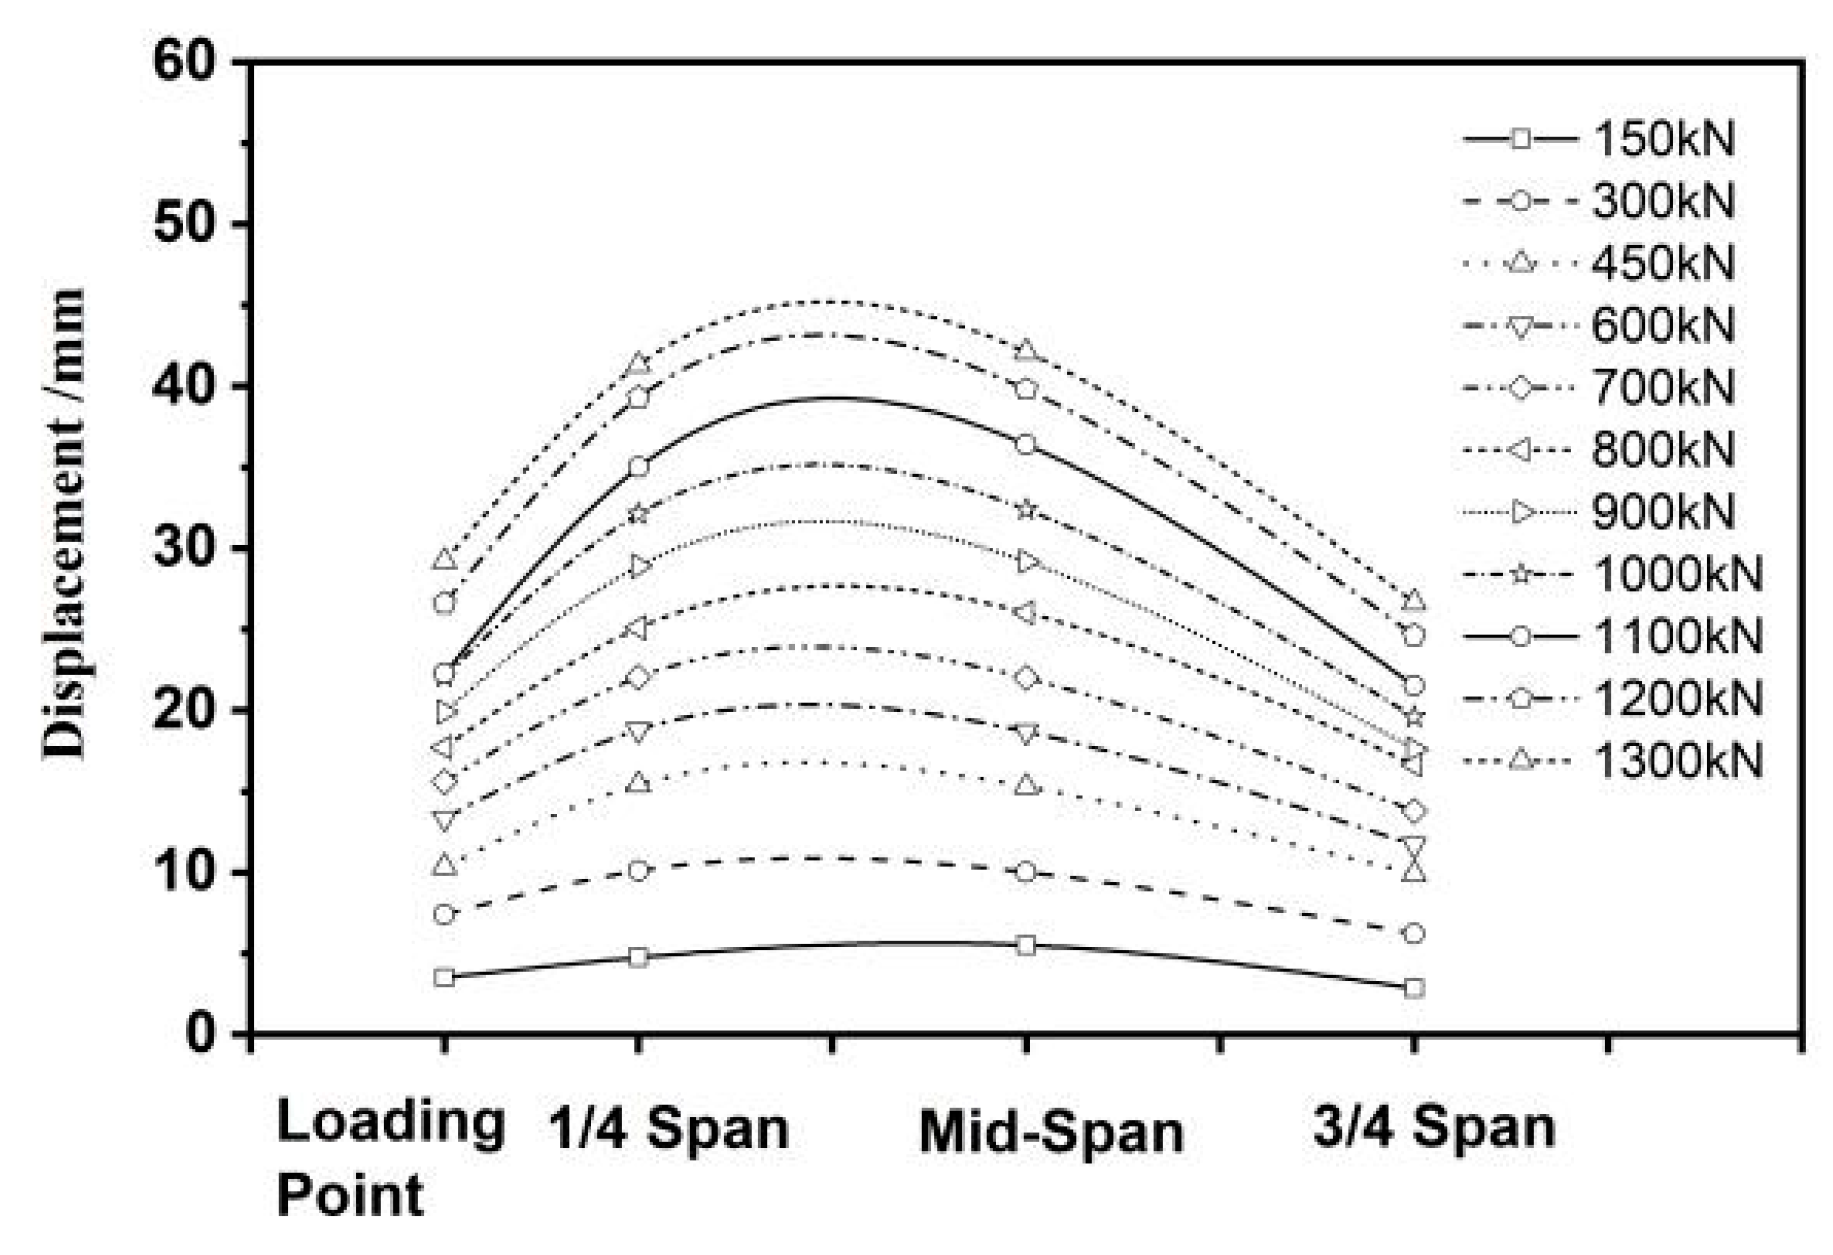
2.4.1. Load–Displacement Curve

Figure 9 shows the load displacement curve of the specimen, which shows that the ultimate shear-bearing capacity of the specimen in the ultimate state was 1910 kN and that the maximum deflection of the loading point was 181 mm. However, an interesting phenomenon was discovered through the test: during the loading process, the maximum deflection point of the specimen was not the loading point but at the location of the loading point slightly away from the support. The deflection value of each monitoring point was measured before 1300 kN in the test (the value after 1300 kN was not obtained for the reason of protecting the devices in large deflection). As shown in Figure 10, before 1300 kN, maximum displacement always occurred at the quadrants near the loading side of the specimen. The displacement at the mid-span did not differ much from the quadrants on the loading side, and the average displacement was 1.4 times that of the loading point. Figure 9 indicates that 1300 kN is the approximate turning point of the load–displacement curve. It can be concluded that the maximum displacement occurs not at the loading point but at the section far from the loading point toward the mid-point direction.

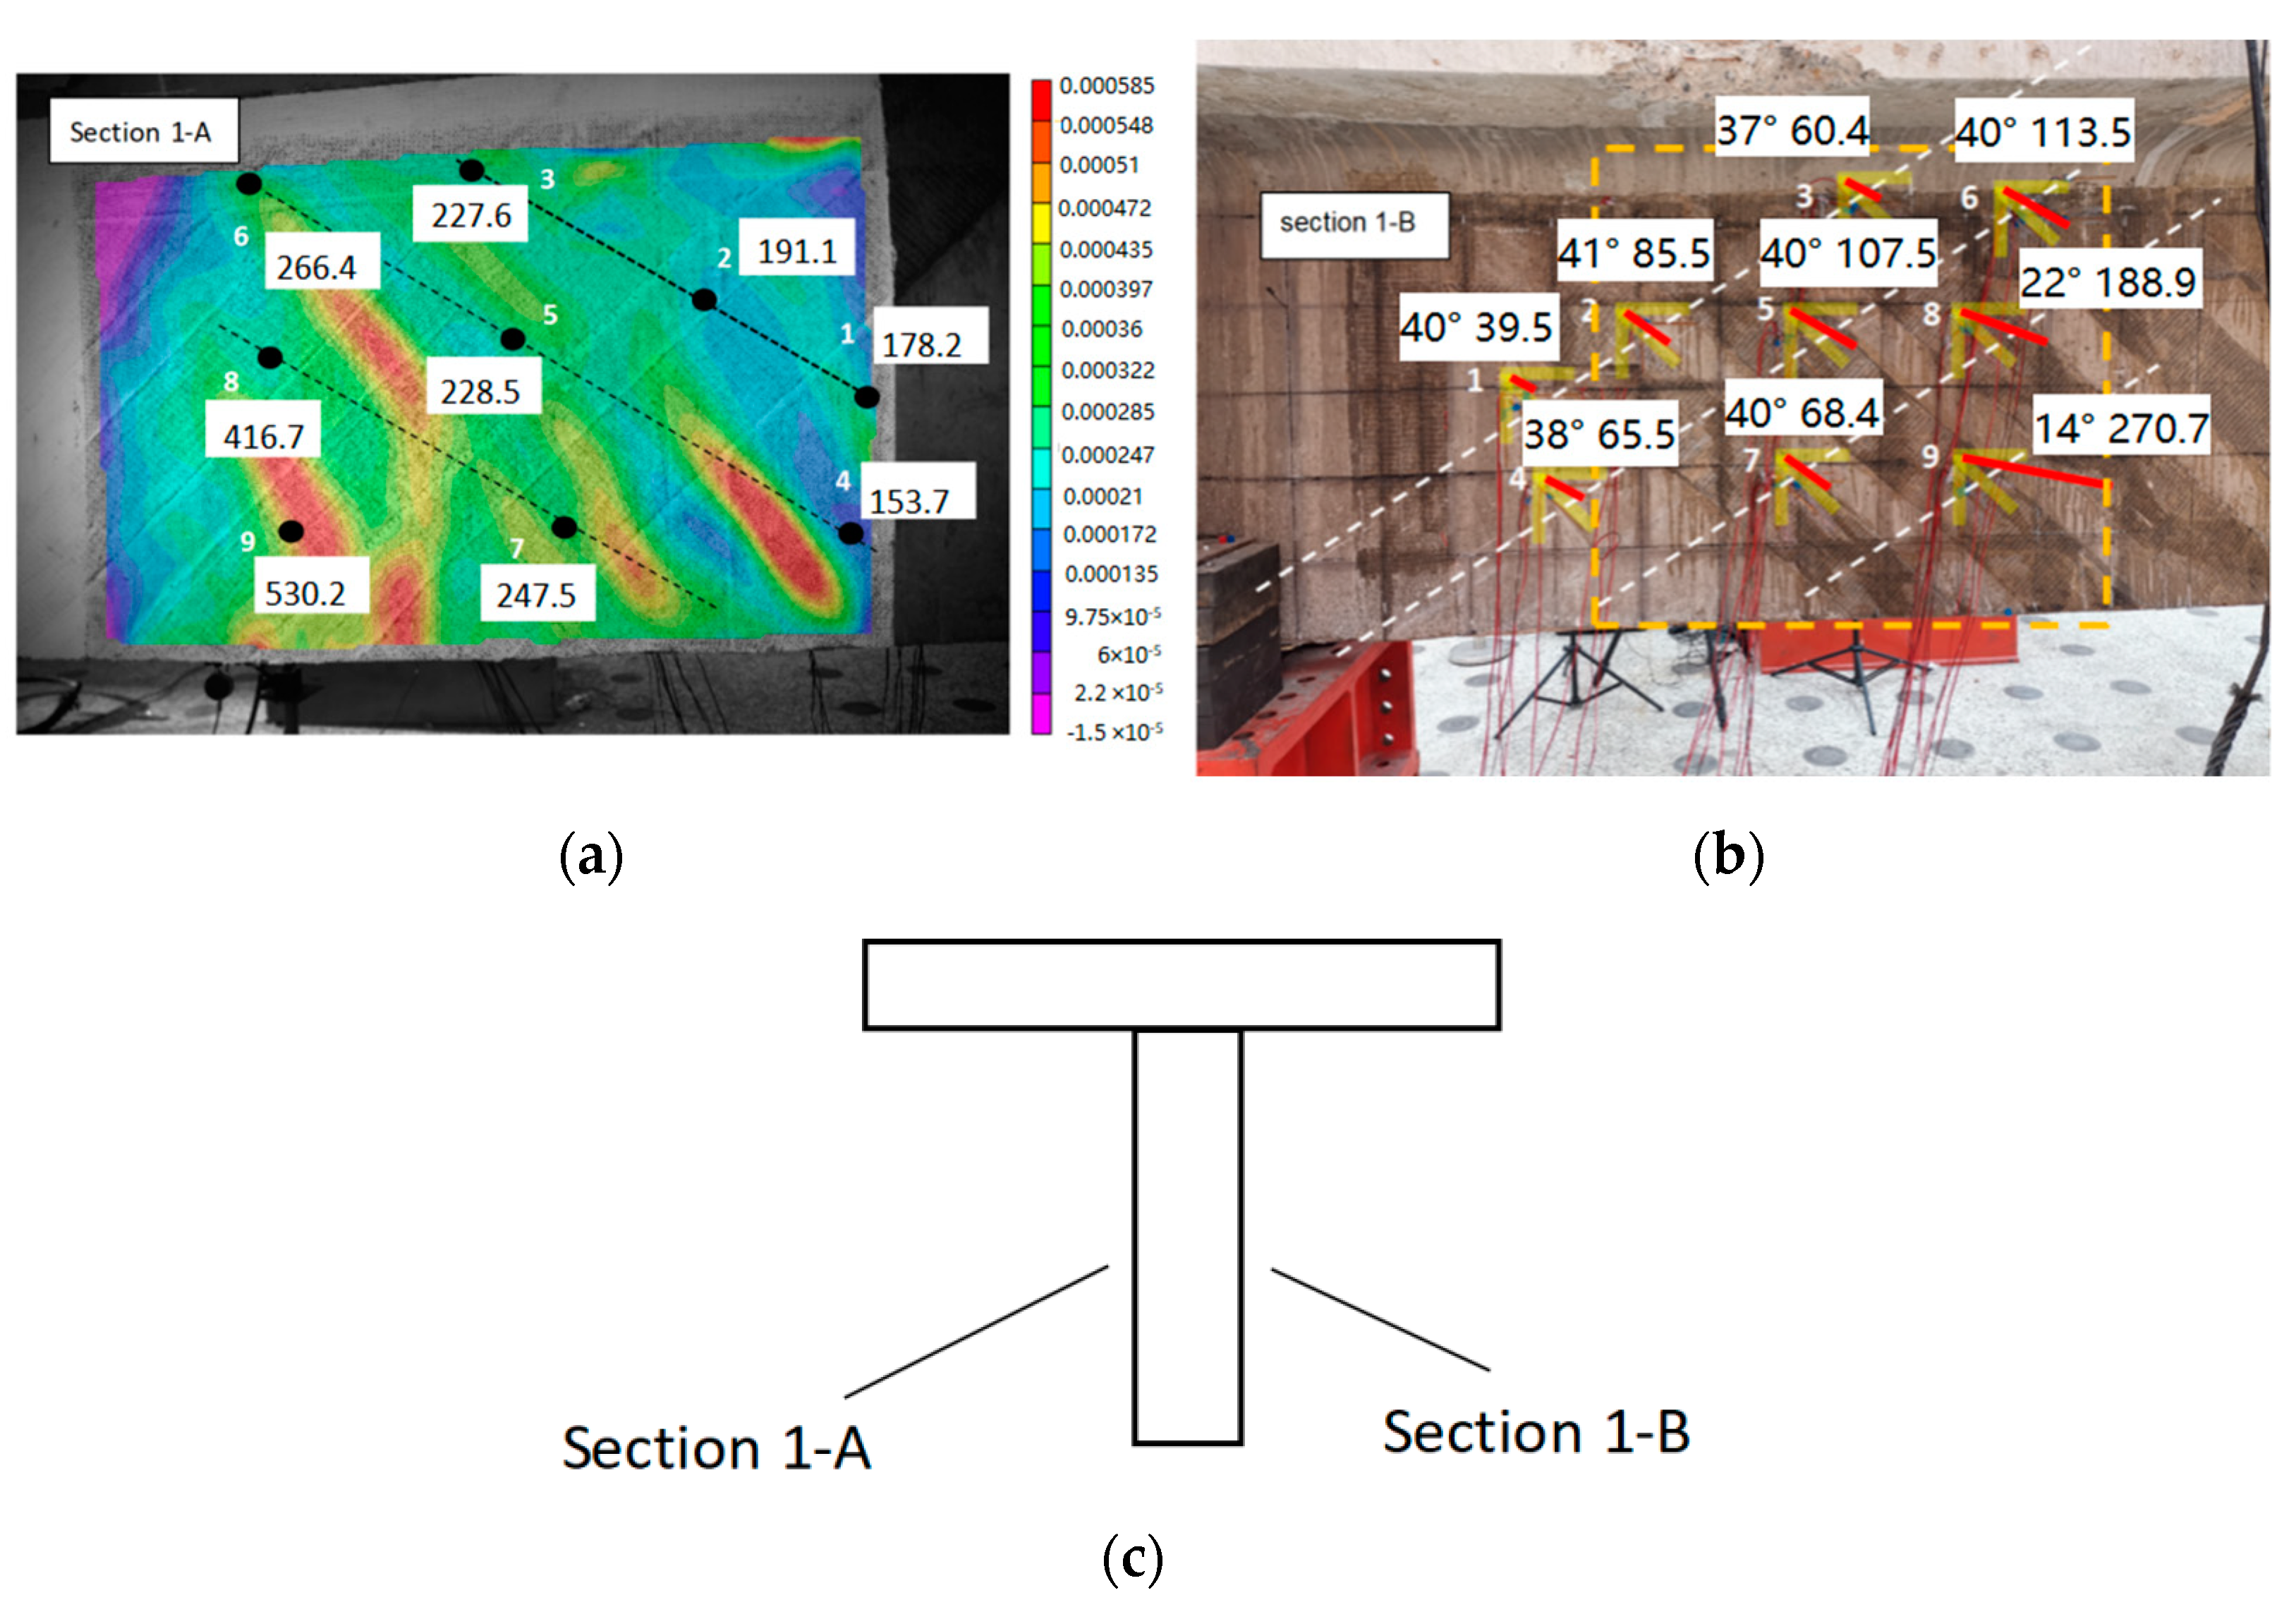
2.4.2. Distribution of Shear Strain

As mentioned above, the strain distribution on both sides of the web in the shear span was monitored by strain gauges and an electronic VIC device. As shown in Figure 11a–c, there is little difference between the measured results on both sides (Section 1-A and Section 1-B) of zone #1 of the web, which indicates that the strain distribution on both sides of the web is nearly symmetrical and that the original beam undergoes almost no distortion during the shear test. The strain distribution of the Group Ⅱ gauges is shown in Figure 12. Figure 12 shows that the strains of point 21 and point 23 are very close before 700 kN, and the difference gradually becomes larger after 700 kN. Point 22 has a larger strain compared to the other two points, which is attributed to the initial crack occurring at this point. However, the strain of the three measuring points increases rapidly at about 1500 kN.

3. Finite Element Analysis (FEA)

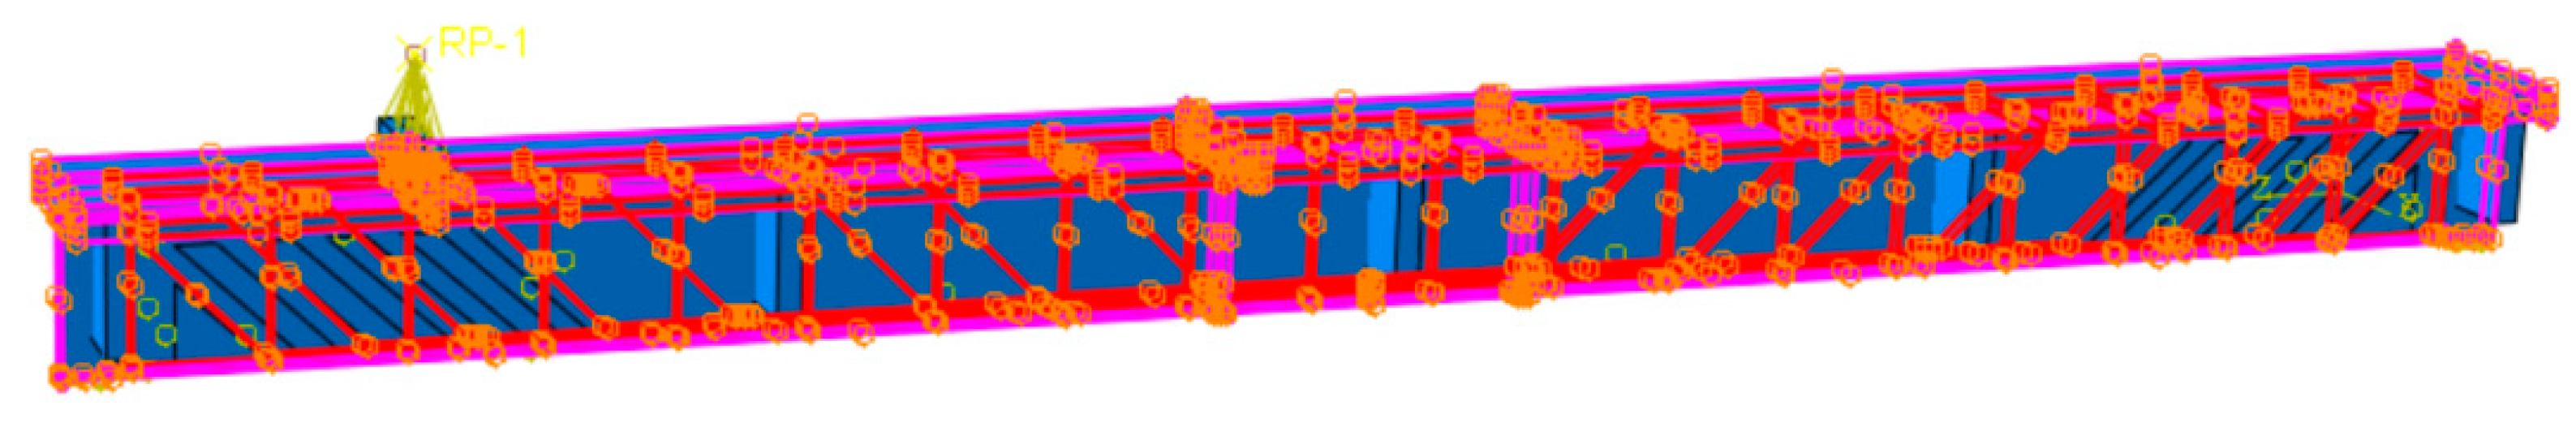
3.1. Establishing an FEA Model

Although the shearing test of the original super-span T-beam introduced above was conducted carefully, some gaps still existed in the test. For example, for old T-beams, it was difficult to arrange strain gauges directly on the inner reinforced bars to monitor the yield state of the inner steel bars of the T-beam’s thin–thick web. Meanwhile, for super-span beams, it is not practical to carry out shear tests according to the traditional two-point loading pattern. Thus, it was necessary to carry out a finite element analysis as a supplement to the experiment for further study.
In this study, finite element analysis was conducted by means of the commercial software ABAQUS. The dimensions and reinforcement configuration of the numerical model were set according to the actual size and structural layout of the original beam, as shown in Figure 2. An eight-node solid element was adopted to simulate the beam, concrete pavement, and loading plate. The regular shape of these entities is convenient for grid division. More accurate results can be obtained with less calculation cost by using an eight-node solid element.
A plastic damage model was adopted to simulate the material properties of the concrete of the beam’s body, pavement, and loading plate. The model was created by the research of Lublinear [25]. The measured value of the concrete’s strength was used in the FEA. The constitutive model of concrete materials adopted the model used in the Code for the Design of Concrete Structures GB50010-2010 (2015 version) [26], as shown in Equations (1)–(7).
f c = ( 1 d c ) E c ε
d c = 1 ρ c n n 1 + x n               x 1
d c = 1 ρ c α c ( x 1 ) 2 + x           x > 1
E c = 4750 f c
ρ c = f c , r E c ε c , r
n = E c ε c , r E c ε c , r f c , r
x = ε ε c , r
where Ec is the elastic modulus of concrete related to the ultimate strength of concrete fc’, which can be calculated according to Equation (1). ε is the strain of concrete. dc, called the compressive damage coefficient of concrete, is determined by Equations (2) and (3). In Equation (3), αc is the descending coefficient, fc,r and εc,r are the compressive strength and corresponding strain of the peak point on the constitutive curve of the concrete, respectively. The ultimate compressive strain of concrete can be obtained from the table in GB50010. For the specific interpretation of the parameters in Equations (1)–(7), refer to GB50010. The classic damage model of Birtel [27] was adopted to define damage in concrete by the degradation of stiffness, which is suitable for RC beams with shear failure. The other parameters and settings are in accordance with the previous literature [27,28].
For steel bars, the hardness bilinear model was adopted to describe the mechanical properties of the reinforcement. The measured values of the yield strength and tensile strength of the steel bars were used in the FE model. A two-node truss element was used to simulate the longitudinal steel bars and stirrups. The loading plate on the top of the beam was set as a rigid body, and the contact relationship between the steel bars and concrete was ‘embedded’, as shown in Figure 13.
The external GFRP was simulated by a membrane element. The GFRP was integrally tied to the concrete body. The loading plate was coupled to a load reference point, and a load (displacement) was applied to the load reference point, as shown in Figure 13. The constitutive model of GFRP adopted a linear model, and the standard values of the elastic modulus were computed according to the nominal value. The loading system adopted the displacement loading method, which was consistent with the field test and was performed in two steps: pre-loading and loading.
In the FEA, to avoid local stress concentrations affecting the convergence effect, a rigid loading beam whose width was equal to the flange pavement was used for loading. The concentrated load acted directly on the loading reference point RP-1 at the upper center of the rigid beam body section. The point was coupled with the three-dimensional freedom of the steel beam, and the rotational freedom was not limited to simulating the hinged effect. The model adopted a linear integral method and used a tetrahedral-type grid to divide the components. Considering the complexity of the model and calculation efficiency, the minimum size of the component grid was 200 mm. The simulation is terminated when the GFRP reaches the nominal limit strain, determined by the nominal tensile strength and elastic modulus.

3.2. Model Verification

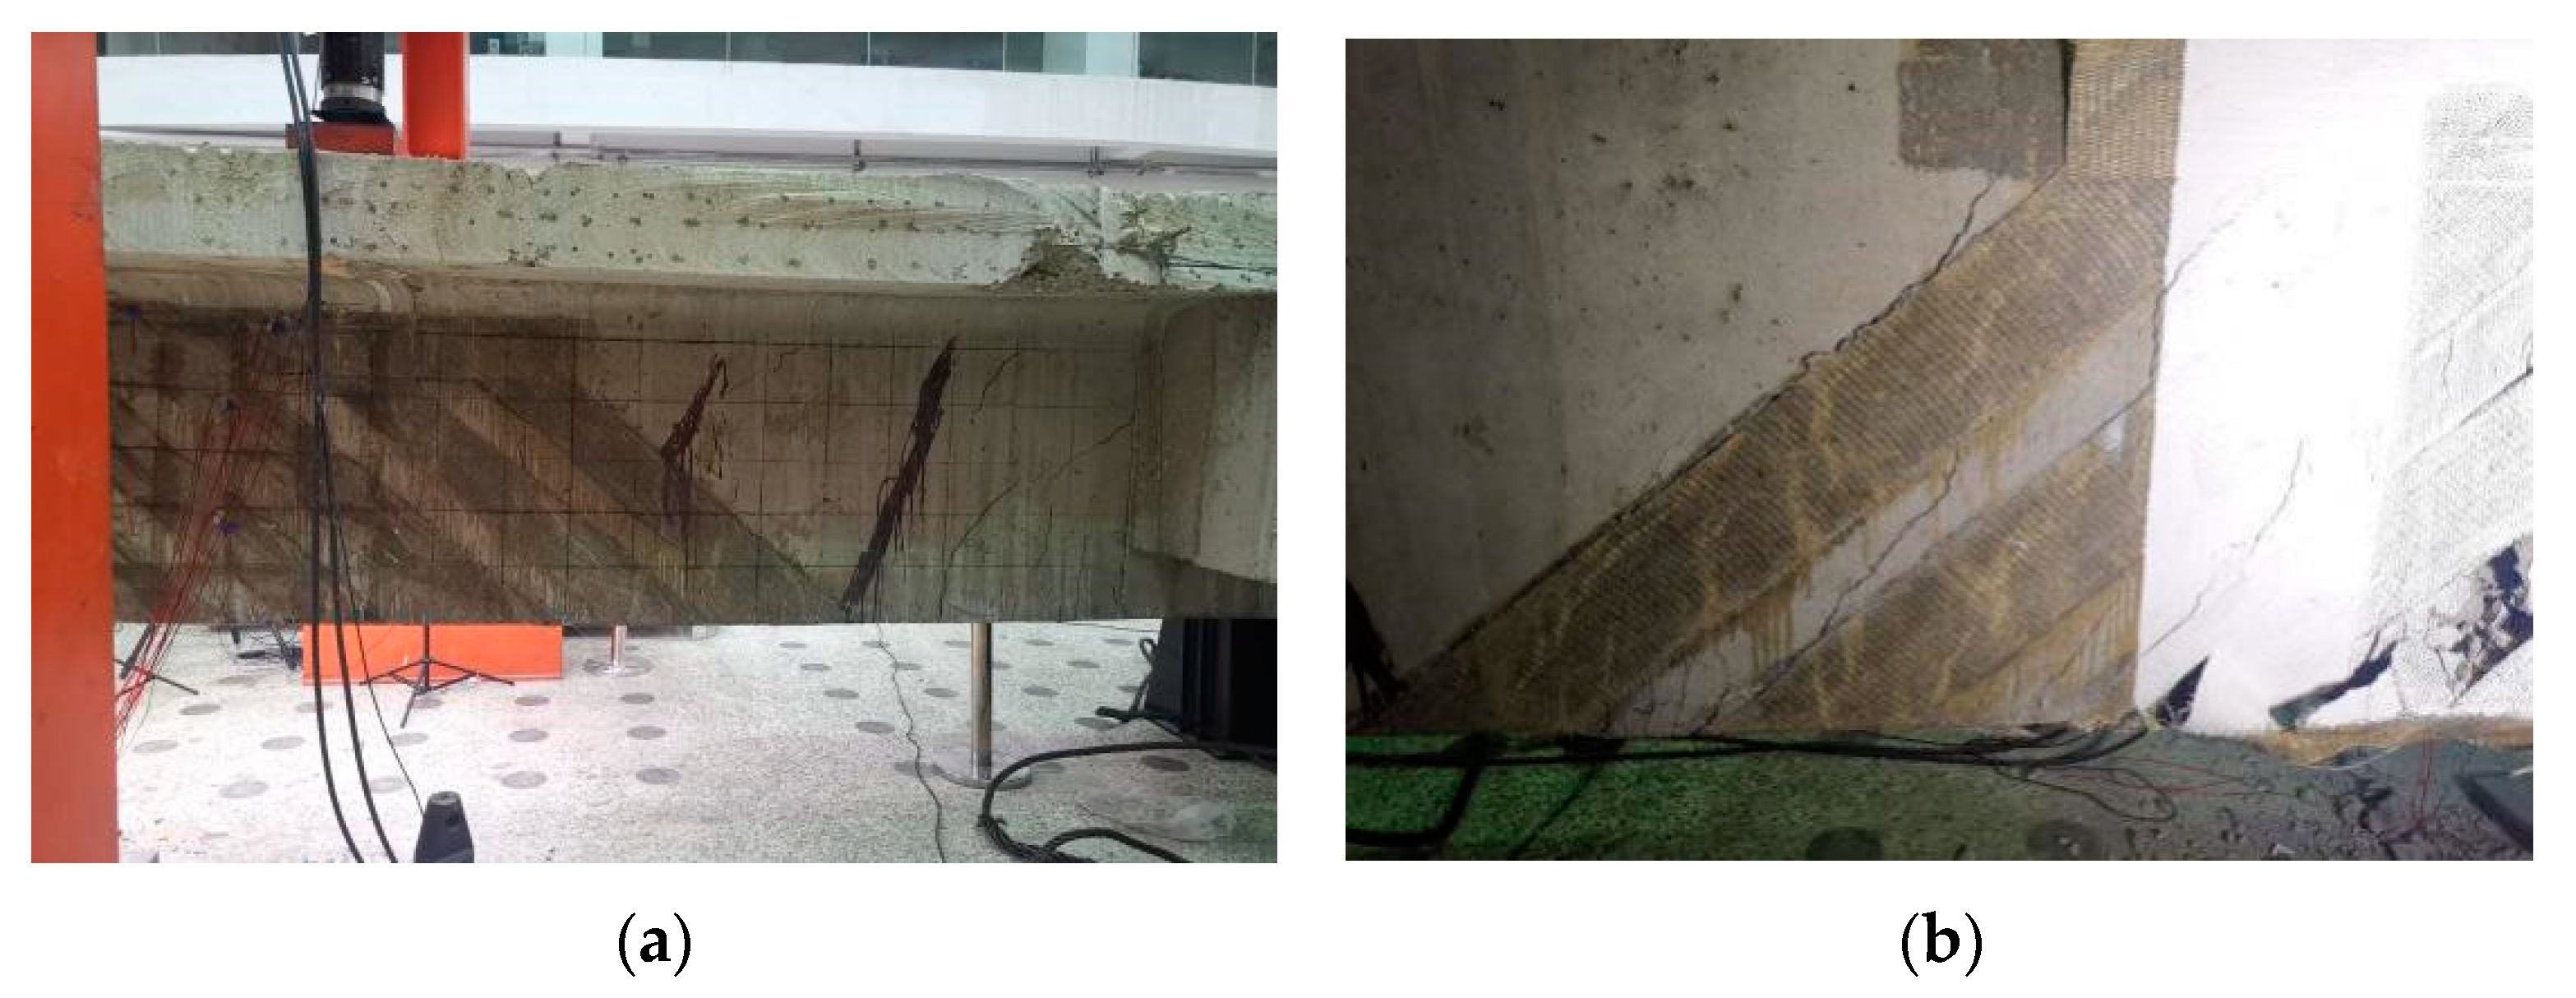
3.2.1. Ultimate State of the Specimen

The displacement nephogram of the component is shown in Figure 14, in which the unit is in meters. Figure 14 illustrates that the ultimate state of the FE model is similar to that of the tested specimen, as shown in Figure 7. In the ultimate state, the loading end of the specimen rises, and the displacement of each point is unevenly distributed along the beam’s length. Although there are numerical differences between the simulated strain distribution and the experimental results, the displacement distribution trend of the FE-simulated member is consistent with that of the experimental data. The maximum displacement does not appear at the loading point.

3.2.2. Load–Displacement Curve

Figure 15 shows a comparison between the simulated curve and the tested curve. It is obvious that the bearing capacities of the two curves in Figure 15 are relatively close. The ultimate shear-bearing capacity of the FE-predicted curves is 1932 kN, whereas the capacity in the experimental result is 1910 kN, which is slightly smaller than the FE-predicted curve. This could be due to immature debonding of the GFRP rather than a pull cut in the experiment.
In addition, Figure 15 shows that under the same loading scale, the shear stiffness of the measured curve is slightly lower than that of the simulated curve. The initial shear stiffness of the actual specimen is slightly lower than the theoretical value, which is related to the initial assumption in the simulation. The simulation assumed that there was no interface slip between the rebar and the concrete. However, an interface slip was present in the actual specimen. In addition, the actual specimen has lower stiffness, which can be attributed to the cracking of concrete.

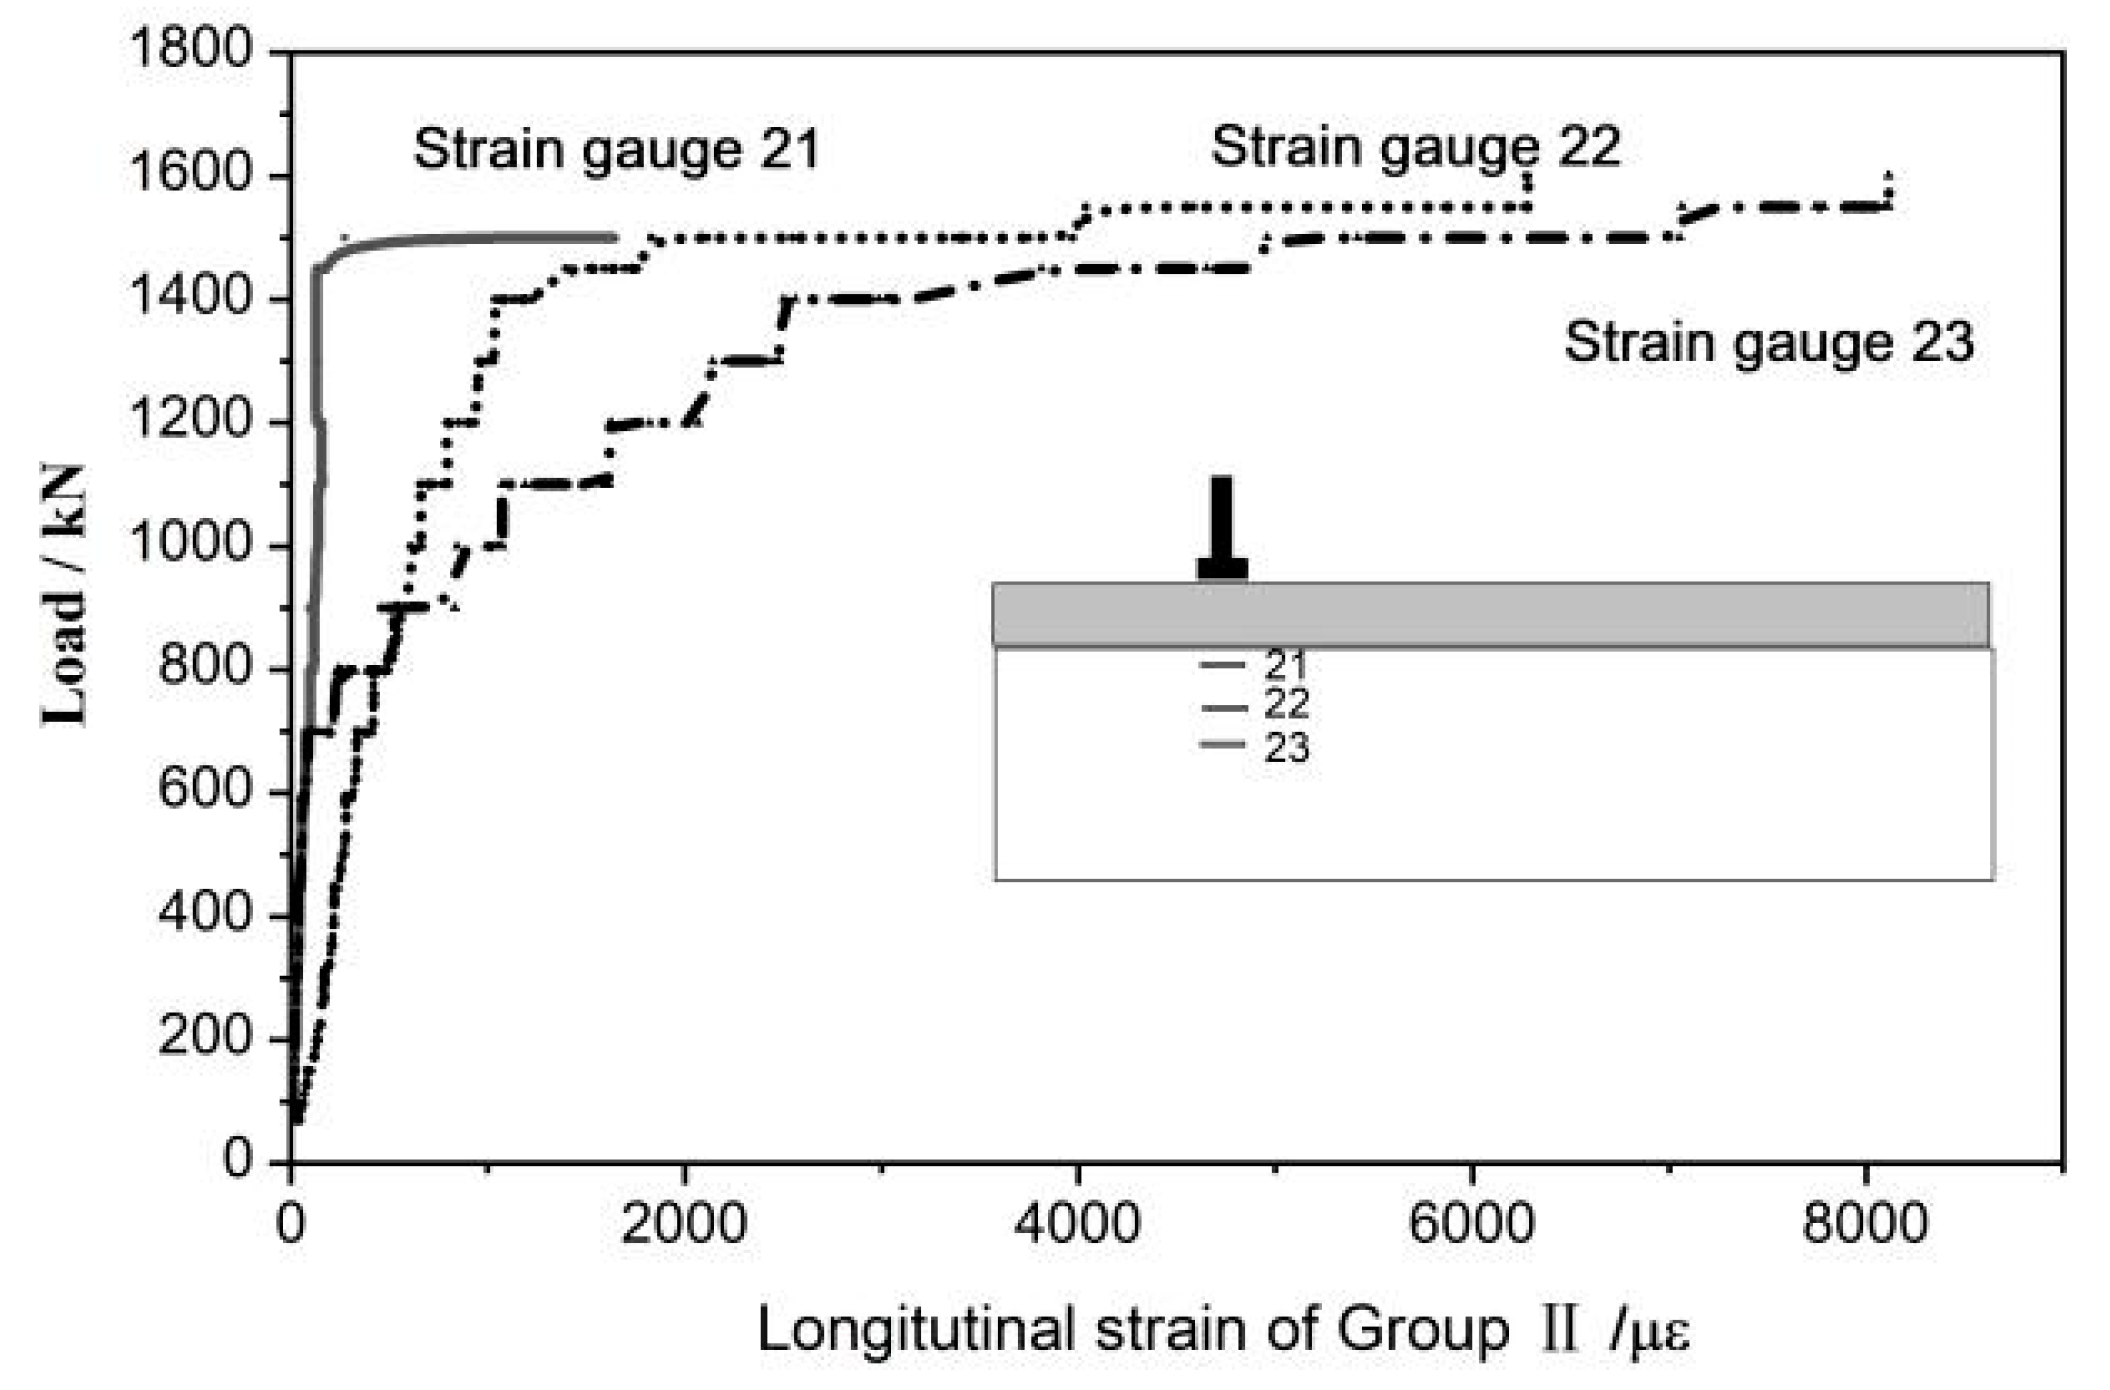
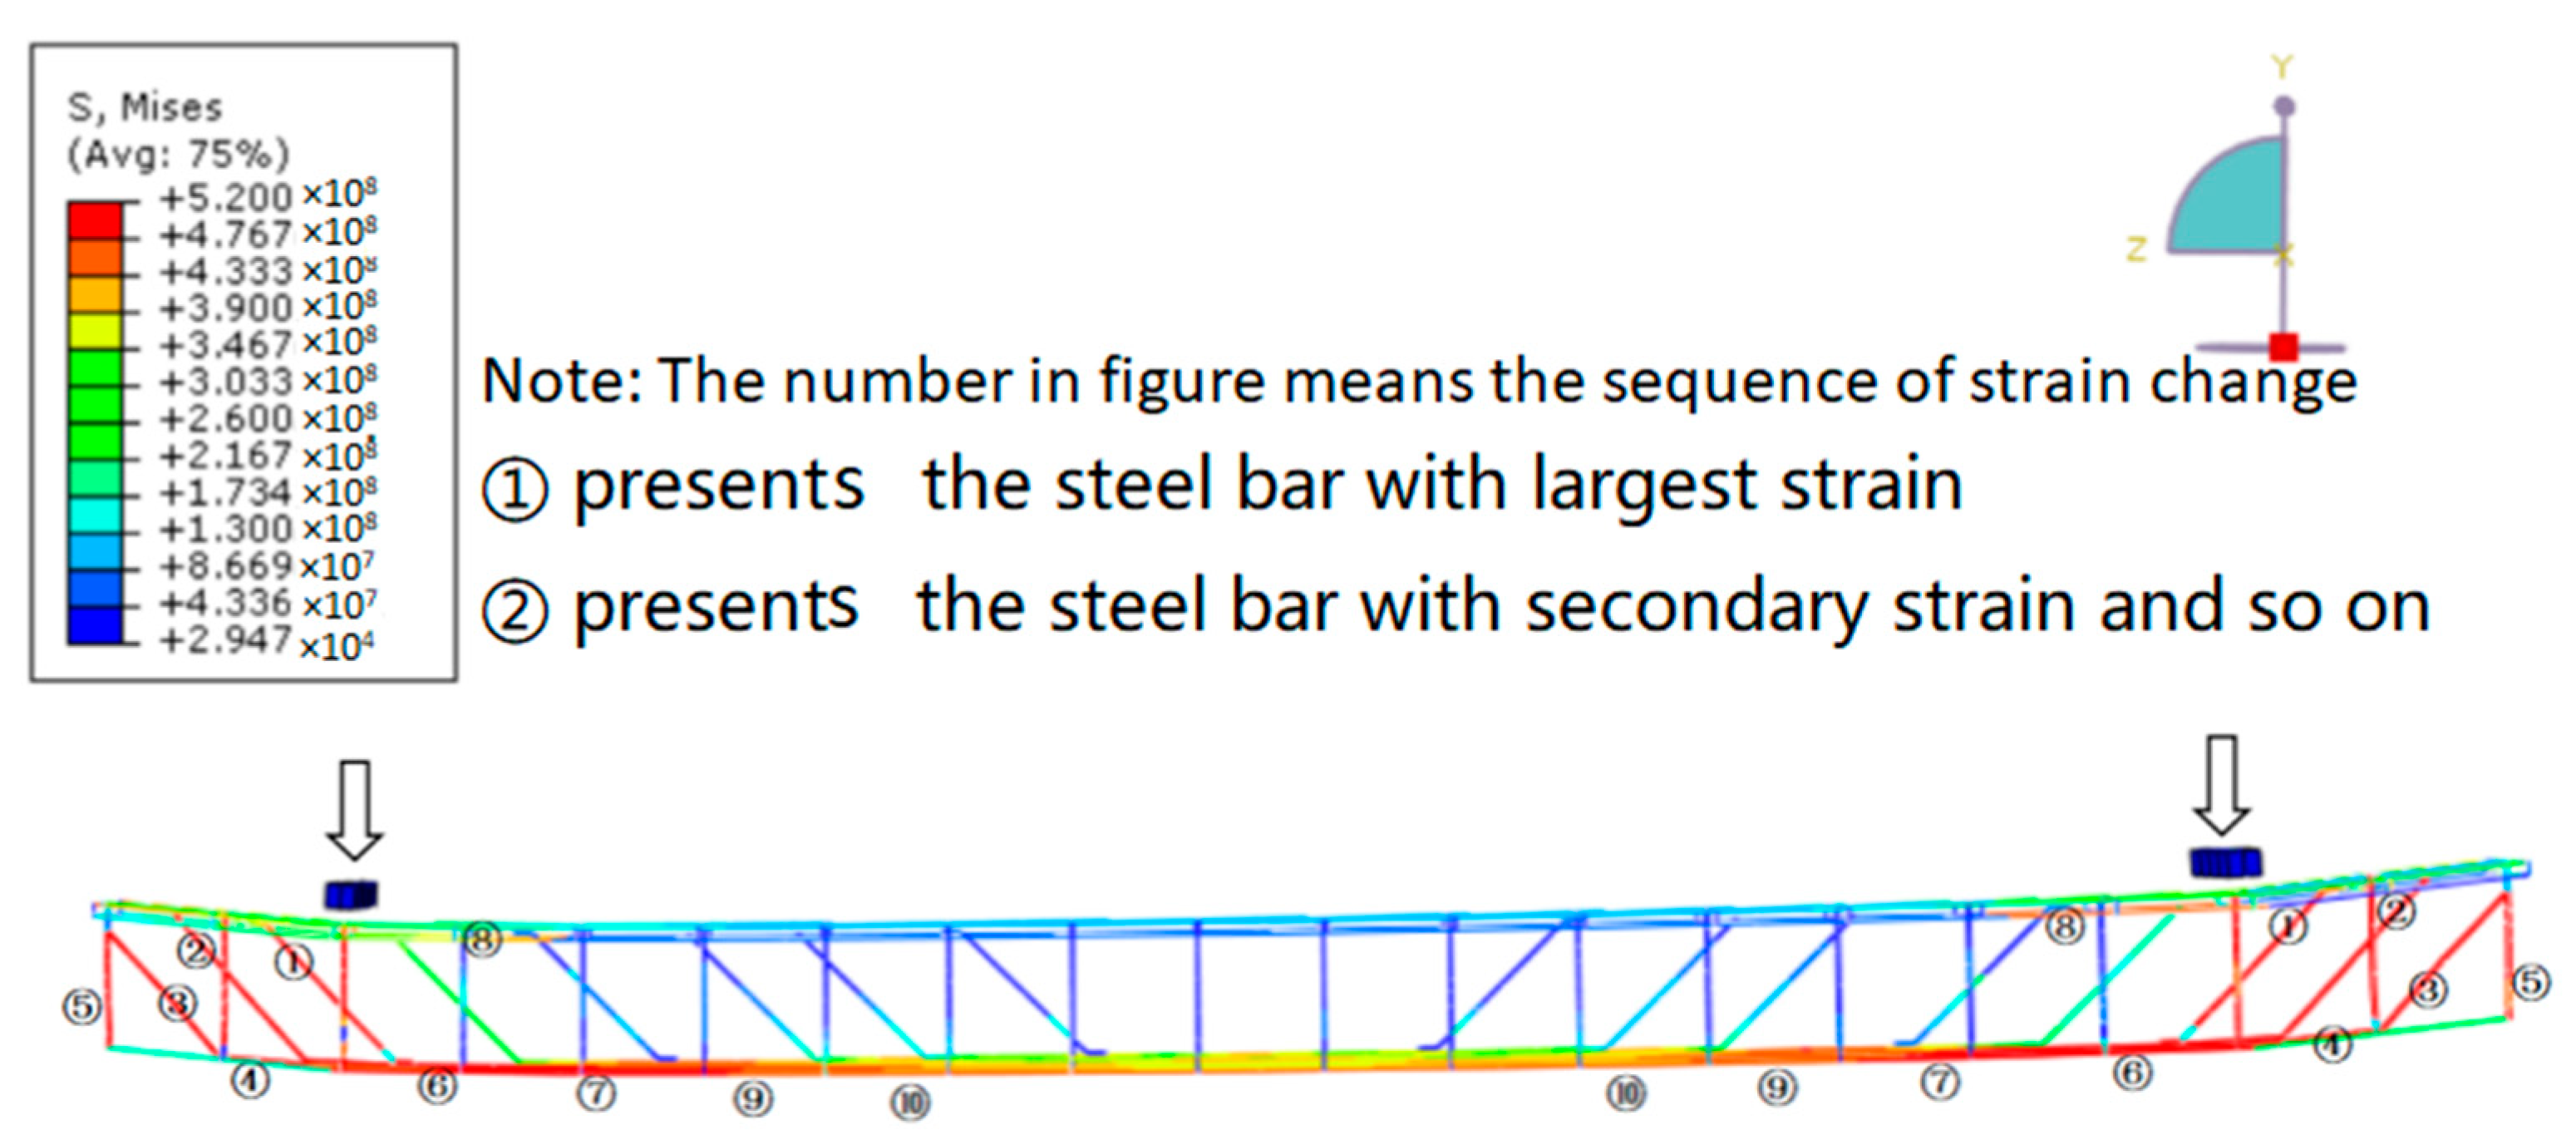
3.3. Analysis of Inner Steel Bars

The super-span concrete T-beam has a special anti-shear reinforcement arrangement created by bending the longitudinal reinforcement at the ends of the specimen. Therefore, longitudinal reinforcement plays an important role in the shear performance of the specimen. However, for thin-web T-beams, it is impractical to expose the inner rebars to attach strain gauges in order to monitor stress and strain distributions. The stress and strain distributions of the inner rebars were studied through the FE model, which was in turn verified by the experimental results.
The strain nephogram of the inner rebar of a super-span T-beam is shown in Figure 16. The strain and stress distribution can also be observed in Figure 16. In the figure, the number represents the order of magnitude of the strain of the internal reinforcement under shear loading. The analysis results show that under shear loading, bent steel bar ① below the loading point has the largest strain value among all steel bars, which indicates that bent steel bar ① has the highest stress in the process of shearing. It is notable that the specific location of the largest stress is exactly the clipping point in the experiment. The bent bar behind bar ①, called bar ②, is secondary, and the bent bar before bar ① (bar ③) is tertiary. It is obvious that the bent bars play an important role in resisting the shearing load. However, for bent steel bar ① and bar ②, the stress is concentrated at the bending point, which is a weak point for shear. The other steel bars mainly take on the stress derived from the shear load. The order of the stress is shown in Figure 16. The units of number in the legend are Pa.

3.4. Influence Analysis of Loading Mode

According to the method in the Standard for test methods of concrete structures (GB/T 50152-2012) [29], most research adopts the double-point loading pattern in shearing tests (Figure 17).
However, in this study, the specimen is so long that shear loading with a double point is impractical in the laboratory. As mentioned above, single-point loading was thus adopted, which is considered a closer loading pattern to the specimen’s real conditions. As many existing theories of the shear performance of T-beams are sourced from experiments using double-point loading, the influences of the loading pattern on the T-beam’s performance must be studied.

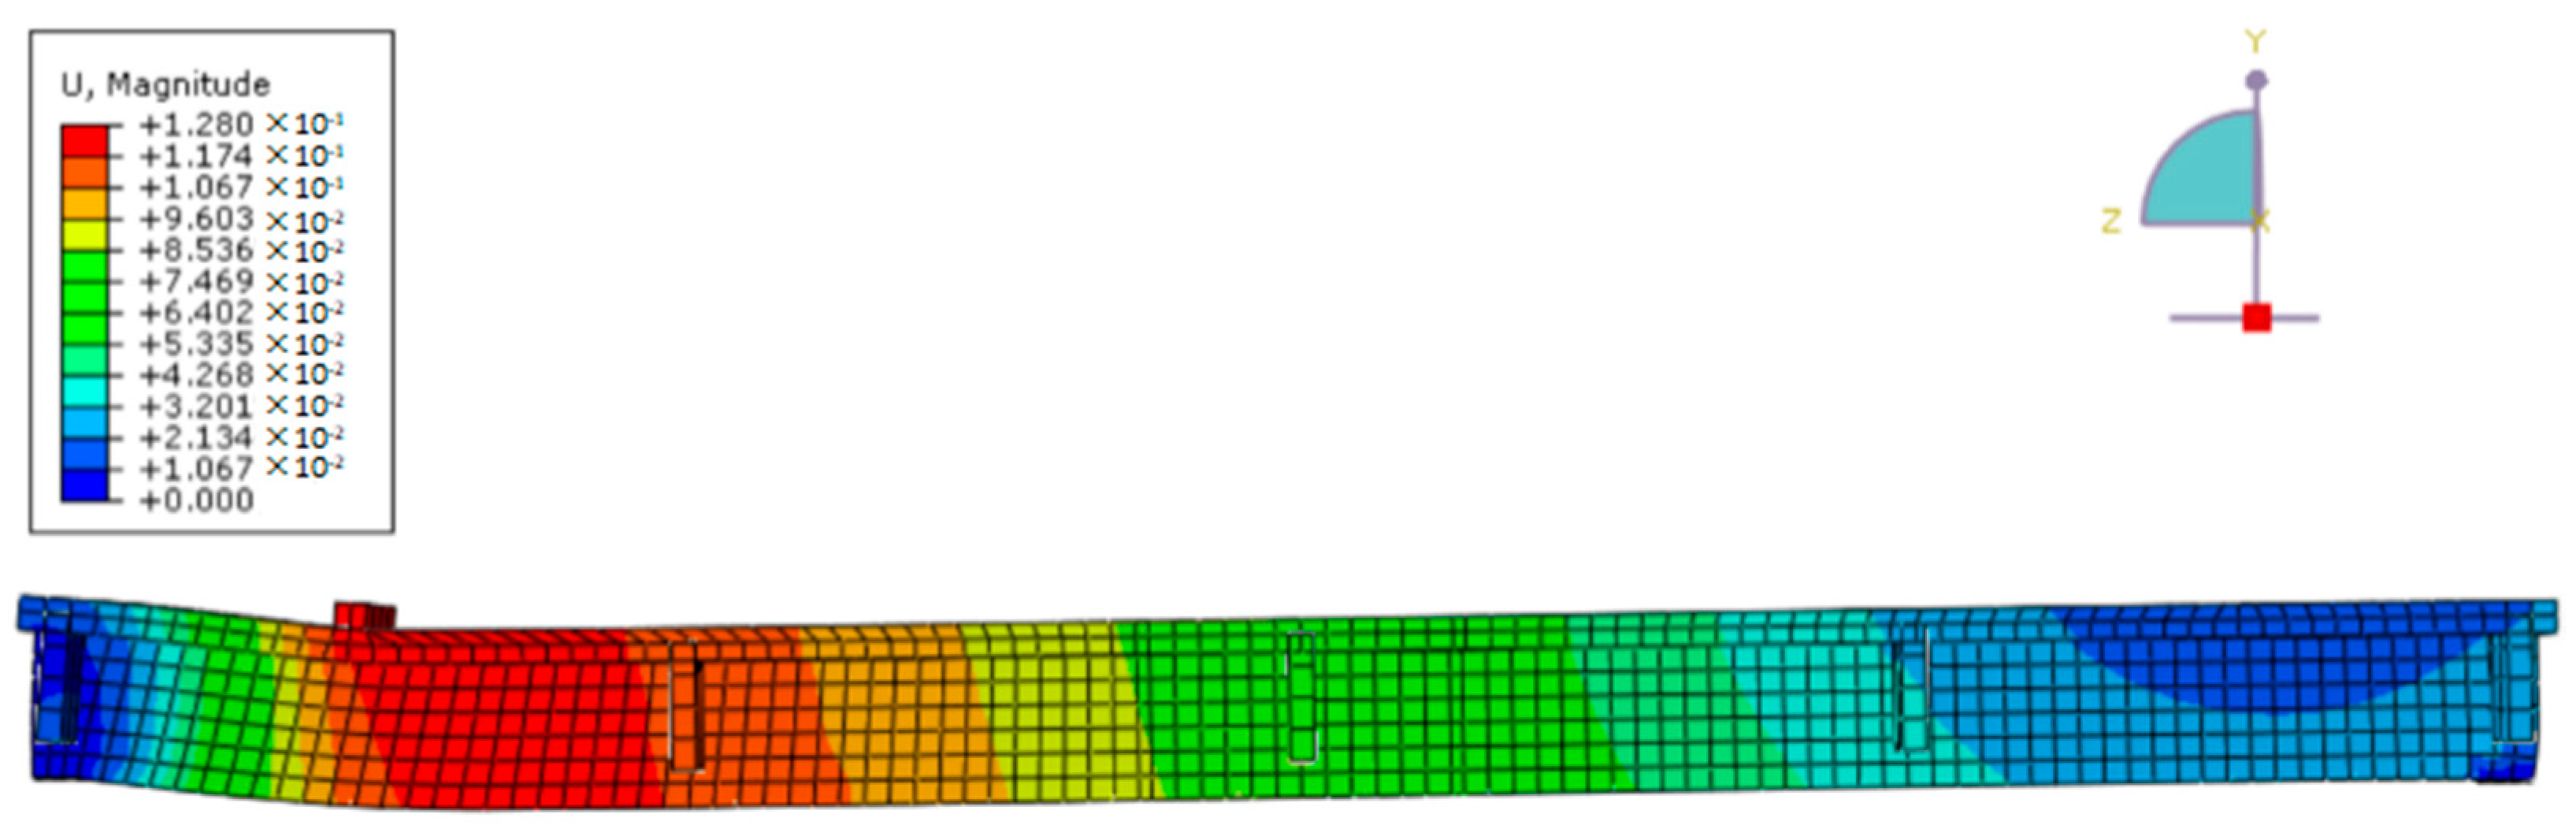
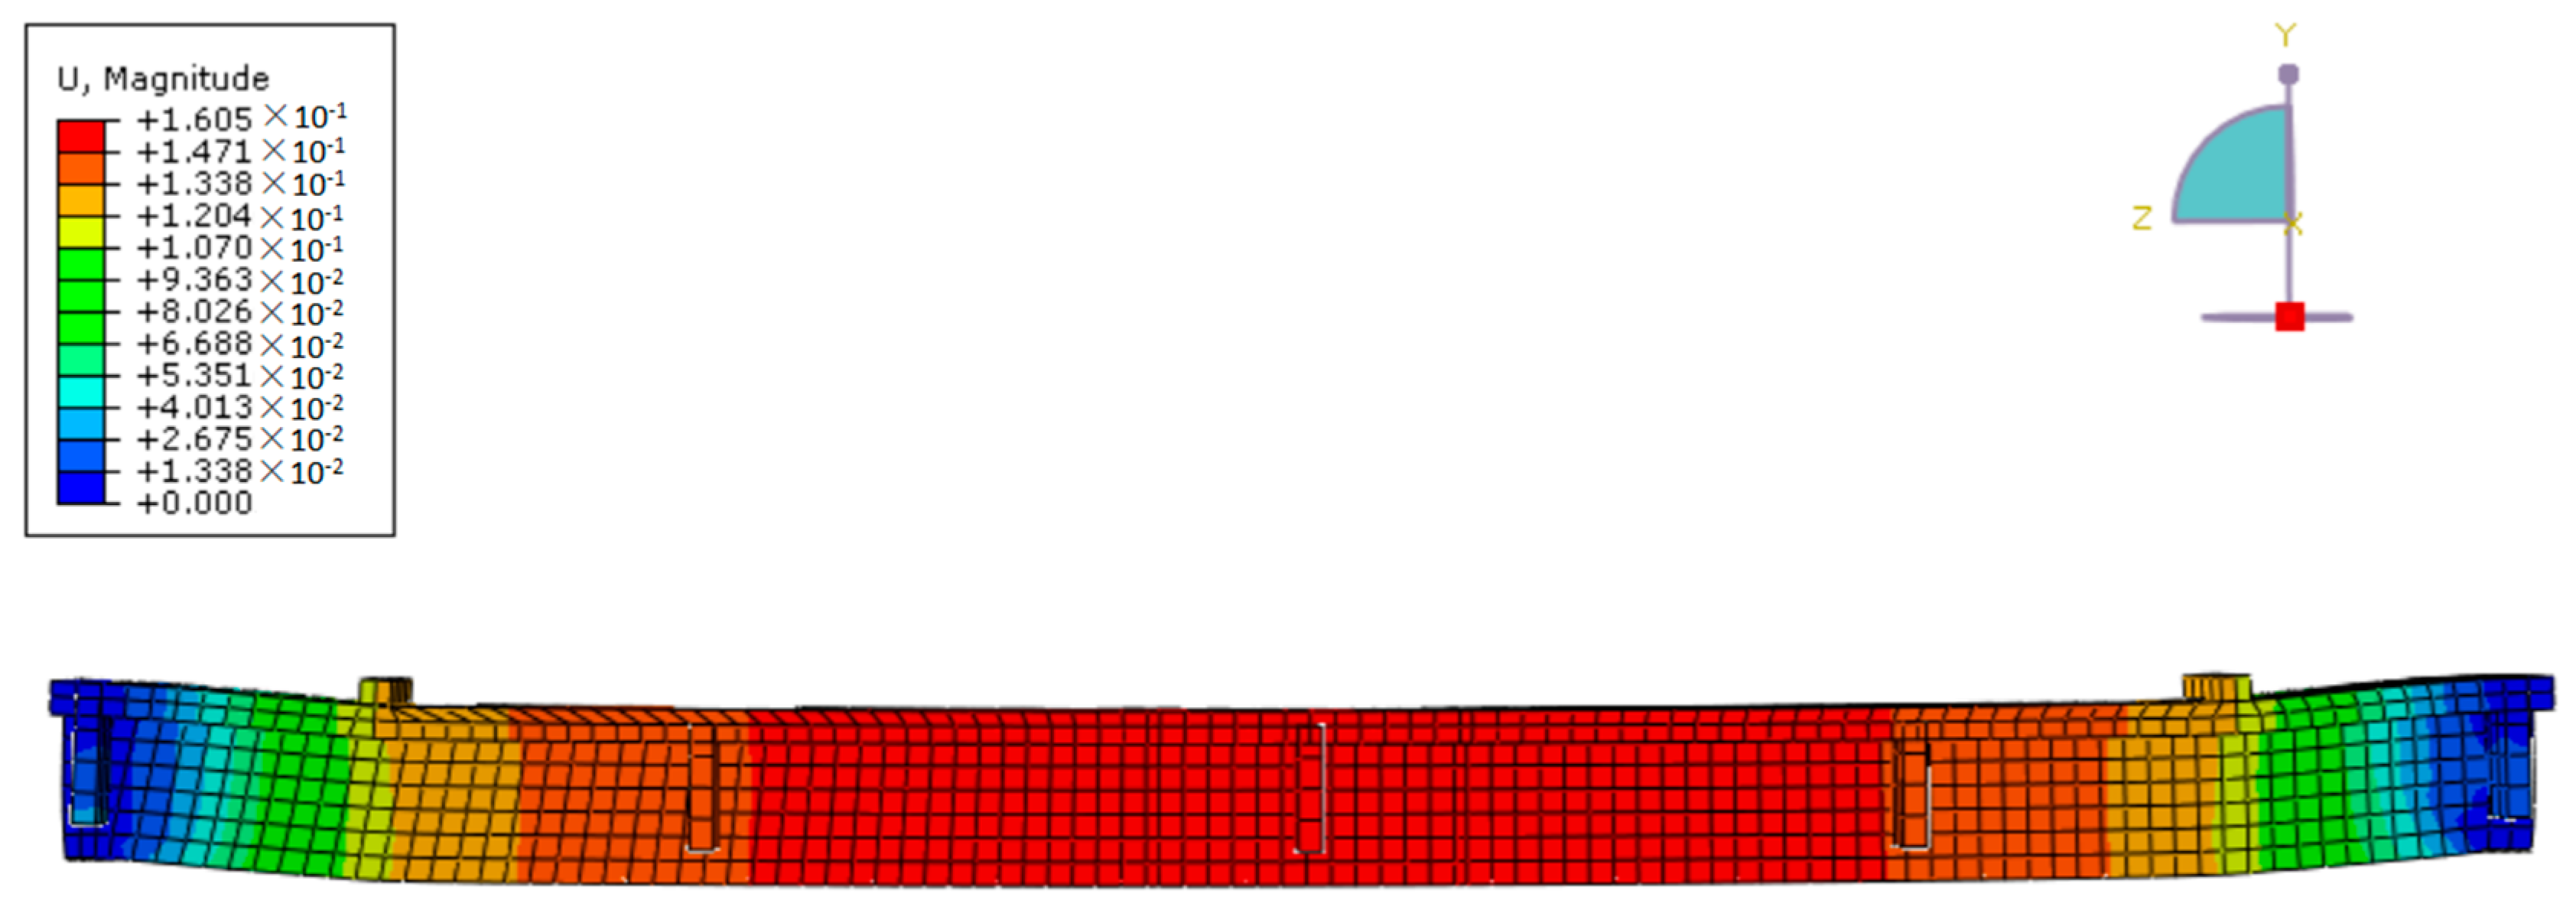
3.4.1. The Influence on the Ultimate State

The specimen subjected to single-point loading is shown in Figure 14, and the specimen subjected to double-point loading is shown in Figure 18, in which the units are meters. Comparing the two figures, it is obvious that the T-beam subjected to shear in two manners has a similar ultimate state.

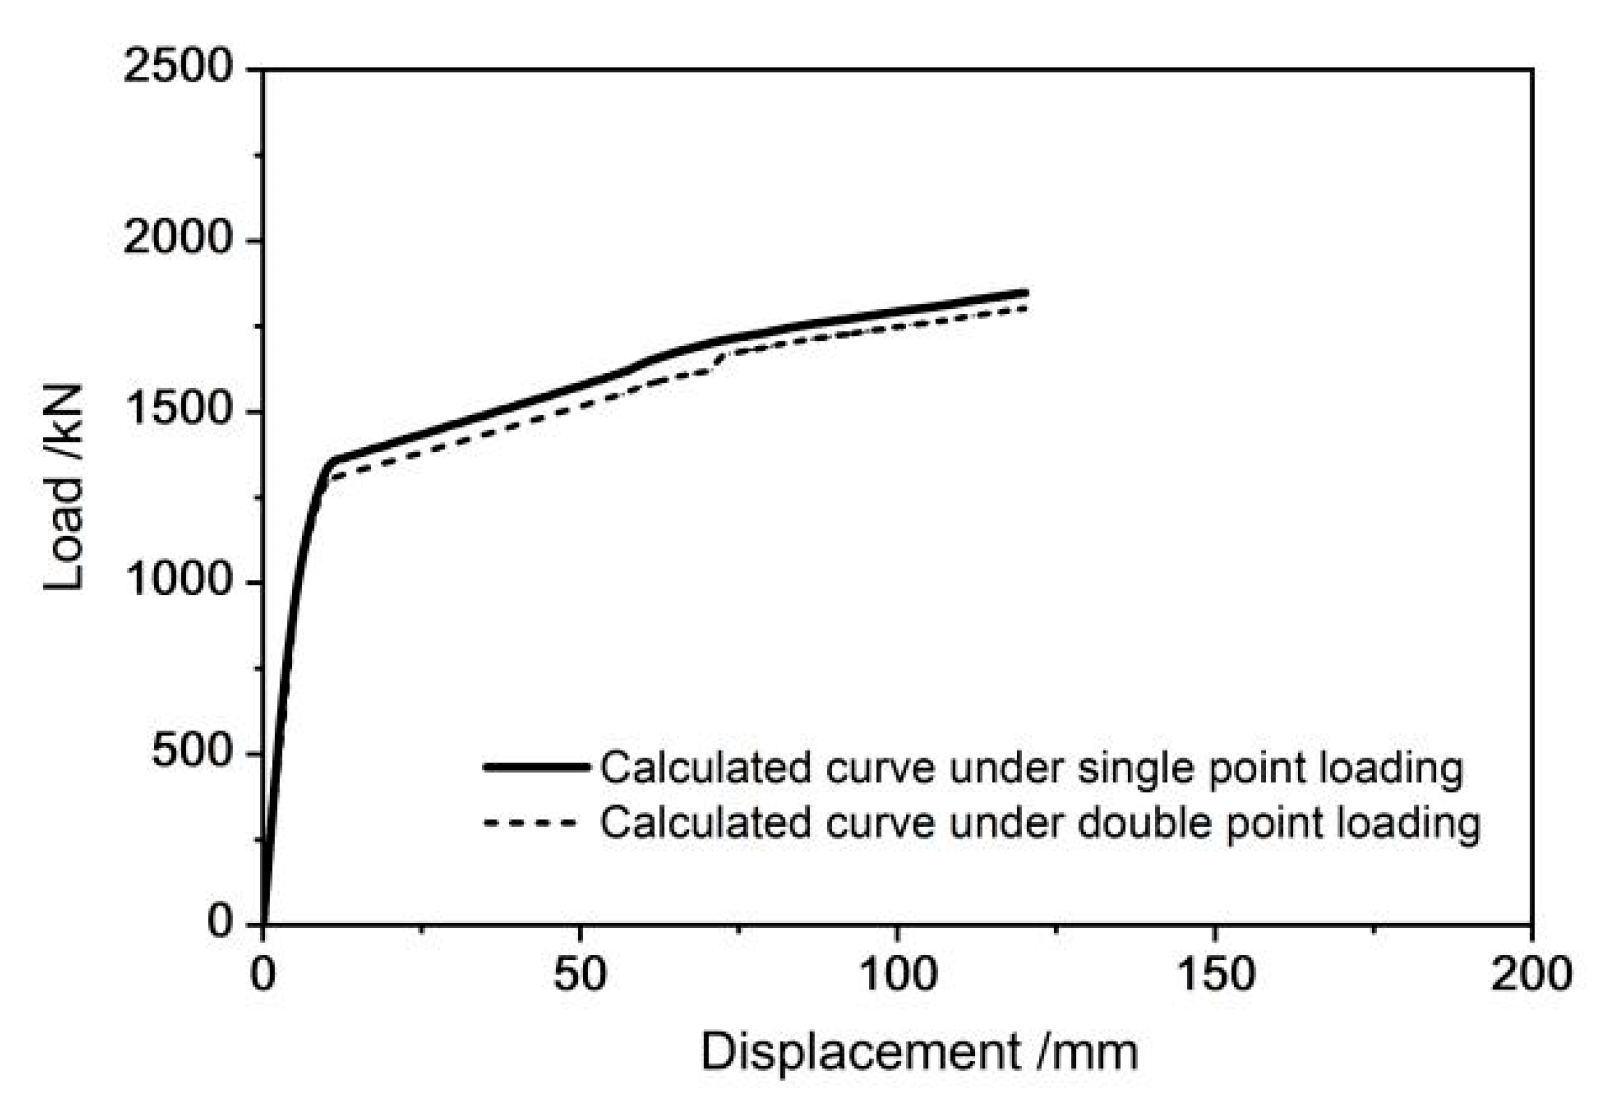
3.4.2. The Influence on Shear Bearing Capacity

Figure 19 presents the calculated curve of the specimen under a single-point shear load and a double-point shear load. Figure 20 indicates that the two curves are relatively close. The ultimate shear bearing capacities of the single-point loading curve and double-point loading curve are 1932 and 1924 kN, respectively. It is concluded that the measured bearing capacity in terms of single lateral loading is slightly higher than the ones with double-point loading.

3.4.3. The Influence of Strain Distribution on the Web

Figure 20 shows the principal strain distribution change in the web of the T-beam subjected to unilateral and bilateral loading, with a bearing capacity of 1100 kN~1900 kN.
It can be seen from Figure 20 that the strain values in the left sub-figures are generally close to the ones in the right sub-figures. However, the specimen subjected to unilateral loading has a more obvious principal strain at the zone under the loading point, whereas the specimen subjected to bilateral loading has a larger principal strain at a diagonal line between the support and loading point. This phenomenon can be explained by the difference in the overall deformation of the specimens, which corresponds to the obviously umbrella-shaped crack group below the ultimate state loading point in this study.

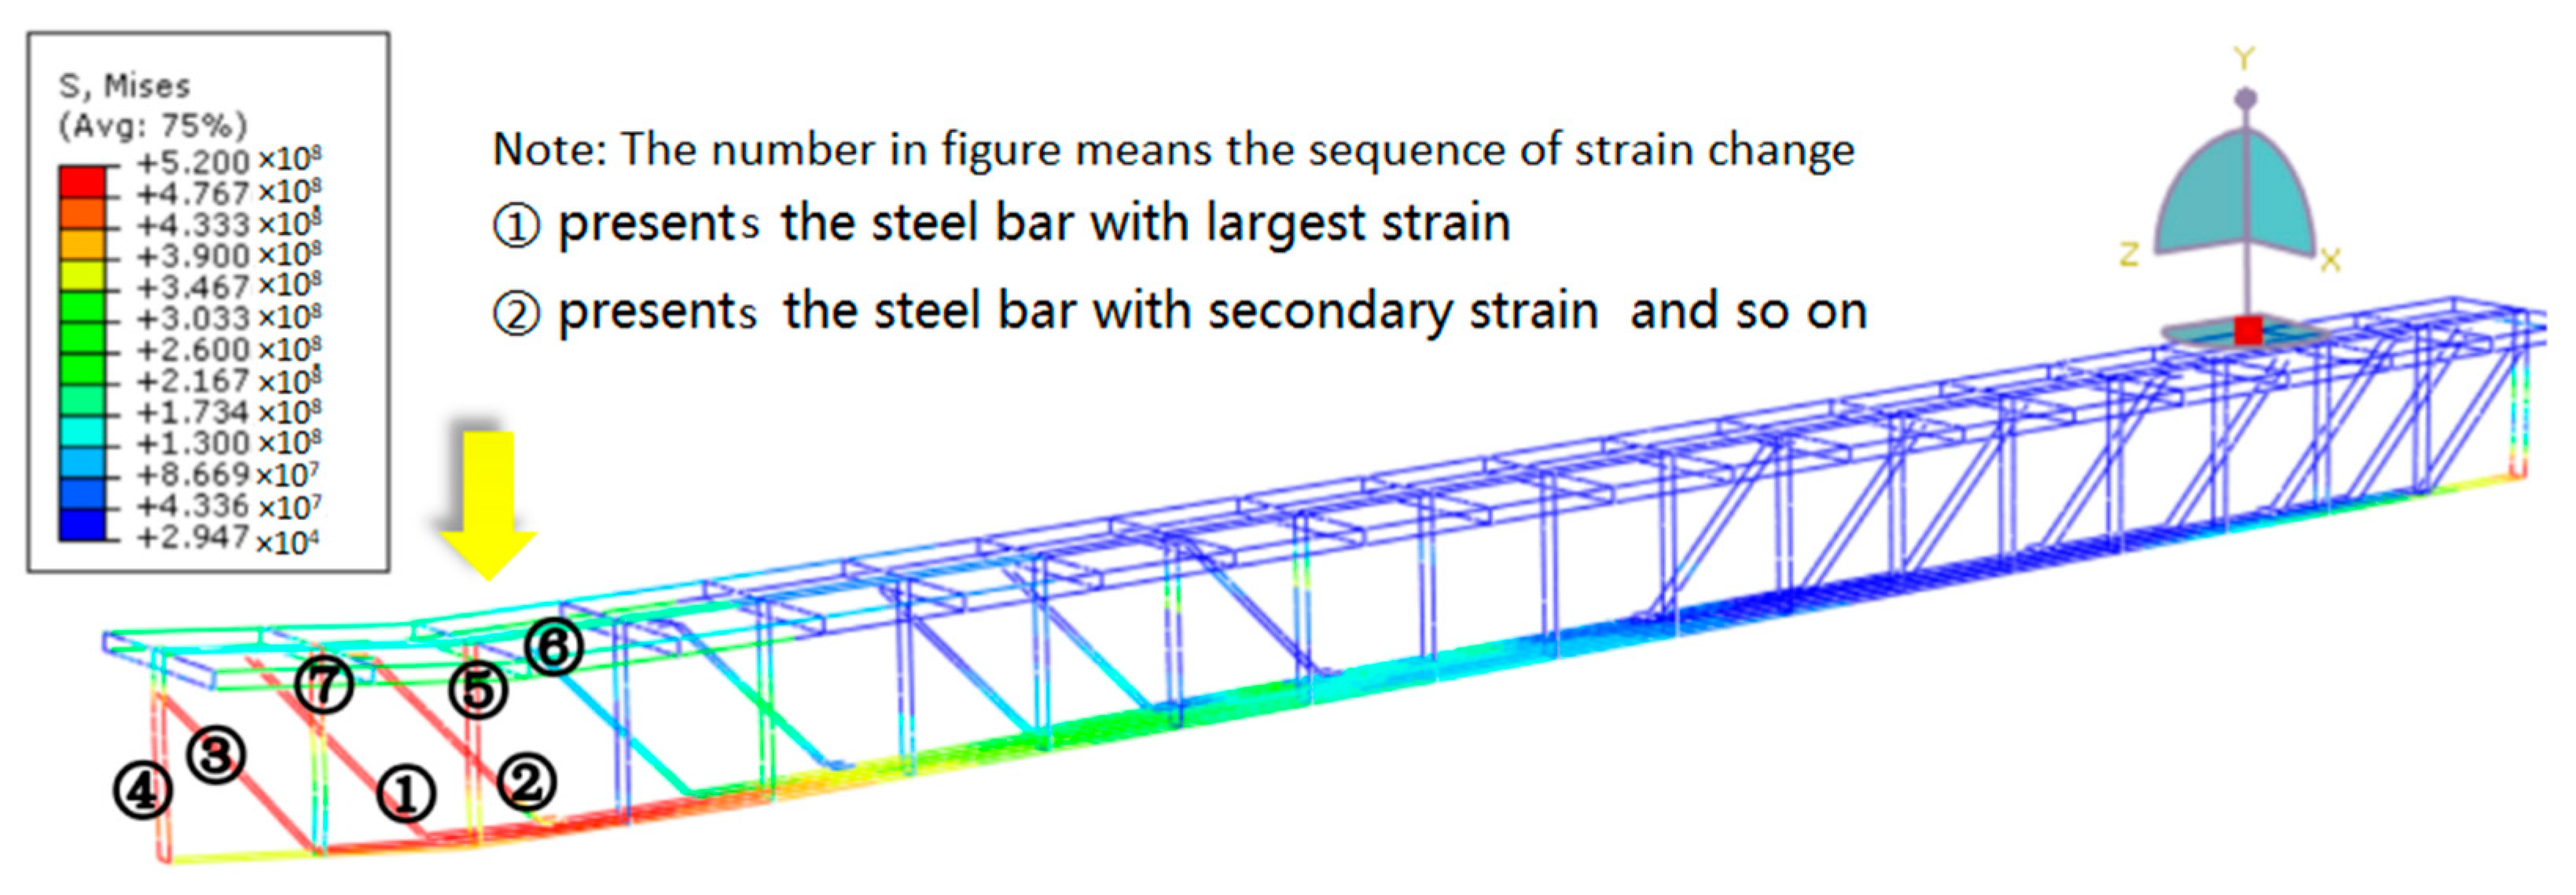
3.4.4. The Influence on the Strain of the Inner Steel Bar

The stress of the inner reinforced bars is shown in Figure 16. The specimen in Figure 16 was subjected to unilateral shear loading. In this section, the stress of the inner reinforced bars of specimens subjected to bilateral shear loading was investigated, as shown in Figure 21. The number in the legend is in Pa.
The yield sequence of the inner steel bar is arranged according to the numbers in Figure 21. Figure 21 shows that under bilateral shear loading, the strain change in the inner steel bar is symmetrical. As shown in this figure, compared to unilateral loading, the specimen subjected to bilateral load has a larger strain at the top of a diagonally bent bar, rather than at the bending point, as in Figure 17, where the units are in meters.

4. Conclusions

In this research, the shear performance of a retrofitted super-span concrete T-beam was studied, and the failure process and service features of the special T-beam mentioned above were understood through experimental and numerical analyses.
Based on the above research, the following conclusions can be drawn:
(1)
Under shear loading, the failure process of the super-span T-beam strengthened by GFRP began with small cracks at the bottom of the mid-span web rather than at the bottom of the loading point.
(2)
The GFRP strips were effective in restraining the extension and connection of cracks in the initial stage. With an increase in load, multitudinous cracks gradually form an umbrella network. The diagonal cracks perpendicular to the GFRP strips appear earlier than the cracks parallel to or in the same direction as these strips.
(3)
For super-span concrete T-beams, the strain distribution in the web is complex. The shear strain of the two sides of the web is nearly symmetrically distributed. The strain of the web is distributed larger from the upper to the button.
(4)
Finite element analysis was especially significant for assessing an existing old concrete T-beam since the absence of information about its inner steel bars. The numerical analysis shows that the yielding of diagonally bent longitudinal steel bars, below the loading point, occurs earlier than that in other bars and maintained a larger strain at all times.
(5)
Since the regular double-point loading mode is invalid, finite element analysis is also significant for large-span beams subjected to shear load. Compared to the regular loading mode, the specimen tested using a single-point loading pattern has a slightly larger bearing capacity, and larger strain on the diagonal line of the web. In the former pattern, the largest strain on the inner steel bars appears in the bent section of the longitudinal bar and appears at the junction of the bent section in the latter pattern.

Author Contributions

Experiment and software, D.H.; Project Administration, T.H.; Resources, G.Z. All authors have read and agreed to the published version of the manuscript.

Funding

This research received no external funding.

Institutional Review Board Statement

Not applicable.

Informed Consent Statement

Not applicable.

Data Availability Statement

Data is unavailable due to privacy.

Conflicts of Interest

The authors declare no conflict of interest in this research.

References

  1. Kotsovou, G.M.; Demitrios, M.C. Shear failure criterion for RC T-beams. Eng. Struct. 2018, 160, 44–55. [Google Scholar] [CrossRef]
  2. Jian, L.; Ziyue, G. A comparative study of models for shear strength of reinforced concrete T-beams. Structures 2022, 35, 922–930. [Google Scholar] [CrossRef]
  3. Jabbar, A.M.; Hamood, M.J.; Mohammed, D.H. The effect of using basalt fibers compared to steel fibers on the shear behavior of ultra-high performance concrete T-beam. Case Stud. Constr. Mat. 2021, 15, e00702. [Google Scholar] [CrossRef]
  4. Ayensa, A.; Oller, E.; Beltrán, B.; Ibarz, E.; Marí, A.; Gracia, L. Influence of the flanges width and thickness on the shear strength of reinforced concrete beams with T-shaped cross section. Eng. Struct. 2019, 188, 506–518. [Google Scholar] [CrossRef]
  5. Cladera, A.; Marí, A.; Ribas, C.; Bairán, J.; Oller, E. Predicting the shear–flexural strength of slender reinforced concrete T and I shaped beams. Eng. Struct. 2015, 101, 386–398. [Google Scholar] [CrossRef]
  6. Bousselham, A.; Chaallal, O. Shear strengthening reinforced concrete beams with fiber-reinforced ploymer: Assessment of influencing parameters and required research. Aci. Struct. 2004, 101, 219–227. [Google Scholar]
  7. Chen, J.; Teng, J. Shear capacity of fiber-reinforced polymer strengthened reinforced concrete beams: Fiber reinforced polymer rupture. J. Struct. Eng. 2003, 129, 615–625. [Google Scholar] [CrossRef]
  8. Bousselham, A.; Chaallal, O. Behavior of reinforced concrete T-beams strengthened in shear with carbon fiber-reinforced polymer-an experimental study. Aci. Struct. 2006, 103, 339–347. [Google Scholar]
  9. Foster, R.M.; Brindley, M.; Lees, J.M.; Ibell, T.J.; Morley, C.T.; Darby, A.P.; Evernden, M.C. Experimental investigation of reinforced concrete T-beams strengthened in shear with externally bonded CFRP sheets. J. Compos. Constr. 2017, 21, 04016086. [Google Scholar] [CrossRef]
  10. Khalifa, A.; Nanni, A. Improveing shear capacity of existing RC T-section beams using CFRP composites. J. Cem. Concr. Compos. 2000, 22, 165–174. [Google Scholar] [CrossRef]
  11. Kar, S.; Biswal, K.G. FRP shear contribution prediction for U-wrapped RC T-beams using a soft computing tool. Structures 2020, 27, 1093–1104. [Google Scholar] [CrossRef]
  12. Nie, X.; Zhang, S.; Teng, J.; Chen, G. Experimental study on RC T-section beams with an FRP-strengthened web opening. Compos. Struct. 2018, 185, 273–285. [Google Scholar] [CrossRef]
  13. Belarbi, A.; Bae, S.; Brancaccio, A. Behavior of full-scale RC T-beams strengthened in shear with externally bonded FRP sheets. Constr. Build Mater. 2012, 32, 27–40. [Google Scholar] [CrossRef]
  14. Nayak, C.B.; Narule, G.N.; Surwase, H.R. Structural and cracking behaviour of rc t-beams strengthened with bfrp sheets by experimental and analytical investigation. J. King Saud Univ. Eng. Sci. 2021, 34, 398–405. [Google Scholar] [CrossRef]
  15. Lee, H.; Cheong, S.; Ha, S.; Lee, C. Behavior and performance of RC-section deep beams externally strengthened in shear with CFRP sheets. Compos. Struct. 2011, 93, 911–922. [Google Scholar] [CrossRef]
  16. Mhanna, H.H.; Hawileh, R.A.; Abdalla, J.A. Shear behavior of RC T-beams externally strengthened with anchored high modulus carbon fiber-reinforced polymer (CFRP) laminates. Compos. Struct. 2021, 272, 114198. [Google Scholar] [CrossRef]
  17. Chen, J.; Teng, J. Shear capacity of FRP-strengthened RC beams: FRP debonding. Constr. Build Mater. 2003, 17, 27–41. [Google Scholar] [CrossRef]
  18. Hassan, A.; Baraghith, A.T.; Atta, A.M.; El-Shafiey, T.F. Retrofitting of shear-damaged RC T-beams using U-shaped SHCC jacket. Eng. Struct. 2021, 245, 112892. [Google Scholar] [CrossRef]
  19. Arslan, M.H.; Yazman, Ş; Hamad, A.A.; Aksoylu, C.; Özkılıç, Y.O.; Gemi, L. Shear strengthening of reinforced concrete T-beams with anchored and non-anchored CFRP fabrics. Structures 2022, 39, 527–542. [Google Scholar] [CrossRef]
  20. Cui, S.; Wang, J.; Shi, L.; Liu, Y. Test and FEM analysis of debonding failure of RC beam strengthened with CFRP. J. Reinf. Plast. Compos. 2009, 28, 2151–2160. [Google Scholar] [CrossRef]
  21. Chen, G.M.; Chen, J.F.; Teng, J.G. On the finite element modelling of RC beams shear-strengthened with FRP. Constr. Build Mater. 2012, 32, 13–26. [Google Scholar] [CrossRef]
  22. Tahenni, T.; Bouziadi, F.; Boulekbache, B.; Amziane, S. Experimental and nonlinear finite element analysis of shear behaviour of reinforced concrete beams. Structures 2021, 29, 1582–1596. [Google Scholar] [CrossRef]
  23. Demir, A.; Caglar, N.; Ozturk, H.; Sumer, Y. Nonlinear finite element study on the improvement of shear capacity in reinforced concrete T-Section beams by an alternative diagonal shear reinforcement. Eng. Struct. 2016, 120, 158–165. [Google Scholar] [CrossRef]
  24. Schanck, A.P.; Davids, W.G. Capacity assessment of older t-beam bridges by nonlinear proxy finite-element analysis. Structures 2020, 23, 267–278. [Google Scholar] [CrossRef]
  25. Lubliner, J.; Oliver, J.; Oller, S.; Oñate, E. A plastic-damage model for concrete. Solids Struct. 1989, 25, 299–326. [Google Scholar] [CrossRef]
  26. GB50010-2010; Chinese Code for Design of Concrete Structures. Ministry of Housing and Urban-Rural Development of the People’s Republic of China (MOHURD): Beijing, China, 2015.
  27. Mark, P.; Birtel, V. Parameterised finite element modelling of RC beam shear failure. In Proceedings of the 2006 ABAQUS Users’ Conference, Cambridge, MA, USA, 23–25 May 2006; pp. 95–108. [Google Scholar]
  28. Gotame, M.; Franklin, C.L.; Blomfors, M.; Yang, J.; Lundgren, K. Finite element analyses of FRP-strengthened concrete beams with corroded reinforcement. Eng. Struct. 2022, 257, 11407. [Google Scholar] [CrossRef]
  29. GB/T 50152-2012; Standard for Test Method of Concrete Structures. Ministry of Housing and Urban-Rural Development of the People’s Republic of China (MOHURD): Beijing, China, 2012.
Figure 1. Preparation of specimen.
Sustainability 15 02768 g001
Figure 2. Detail of the specimen’s dimensions and main reinforcement.
Sustainability 15 02768 g002
Figure 3. Samples of steel bars and concrete.
Sustainability 15 02768 g003
Figure 4. Experimental setup. (a) The test device. (b) The position of measuring points. (c) The strain rosettes composed of 0°, 45°, and 90° gauges.
Sustainability 15 02768 g004
Figure 5. Crack propagation of the specimen. (a) Initial cracks on the surface of webs; (b) The cracks in 150 kN; (c) The cracks in 300 kN; (d) The cracks in 450 kN; (e) The cracks in 600 kN; (f) The cracks in 700 kN; (g) The cracks in 1000 kN; (h) The cracks in 1450 kN; (i) The cracks in 1550 kN; (j) The cracks in 1650 kN.
Sustainability 15 02768 g005aSustainability 15 02768 g005bSustainability 15 02768 g005c
Figure 6. Cracks on the web. (a) The cracks perpendicular to the fiber direction; (b) The cracks parallel to the fiber direction.
Sustainability 15 02768 g006
Figure 7. Integral state of the specimen.
Sustainability 15 02768 g007
Figure 8. Ultimate state of the specimen. (a) Map-cracking under the loading point; (b) Cutting off bent reinforcement at the flex point; (c) Clipping point of the reinforcement.
Sustainability 15 02768 g008
Figure 9. Load–displacement curve of the specimen.
Sustainability 15 02768 g009
Figure 10. Displacement of measuring points.
Sustainability 15 02768 g010
Figure 11. Strain distribution of the web on two sides. (a) Section 1-A; (b) Section 1-B; (c) section of specimen.
Sustainability 15 02768 g011
Figure 12. Longitudinal strain of Group Ⅱ gauge.
Sustainability 15 02768 g012
Figure 13. The finite element model of the specimen.
Sustainability 15 02768 g013
Figure 14. Finite element model.
Sustainability 15 02768 g014
Figure 15. Comparison of simulated and tested curves.
Sustainability 15 02768 g015
Figure 16. The stress nephogram of the rebars of a super-span T-beam.
Sustainability 15 02768 g016
Figure 17. The double-point loading pattern.
Sustainability 15 02768 g017
Figure 18. The specimen subjected to double-point shear loading.
Sustainability 15 02768 g018
Figure 19. The comparison of calculated curve under different loading patterns.
Sustainability 15 02768 g019
Figure 20. The comparison of principal strain under different loading patterns.
Sustainability 15 02768 g020
Figure 21. Stress nephogram of reinforcement.
Sustainability 15 02768 g021
Table 1. Main parameters of the materials.
fcb/MPafcp/MPafy/MPafu/MPaEs/GPafGFRP/MPaEGFRP/GPa
Nominal value 234036058020080080
Measured value31.245.9320.7521.2215.2__
fcb—Compressive strength of concrete of T-beam. fcp—Compressive strength of concrete of pavement. fy—Yield strength of shear reinforcement. fu—Ultimate strength of shear reinforcement. fGFRP—Ultimate strength of GFRP. Es—Elasticity modulus of the main reinforcement. EGFRP—Elasticity modulus of GFRP.
Disclaimer/Publisher’s Note: The statements, opinions and data contained in all publications are solely those of the individual author(s) and contributor(s) and not of MDPI and/or the editor(s). MDPI and/or the editor(s) disclaim responsibility for any injury to people or property resulting from any ideas, methods, instructions or products referred to in the content.

