Article

Rhizobiome Signature and Its Alteration Due to Watering in the Wild Plant Moringa oleifera

1
Department of Biochemistry, College of Science, University of Jeddah, Jeddah 21493, Saudi Arabia
2
Biological Sciences Department, College of Science & Arts, King Abdulaziz University, Rabigh 21911, Saudi Arabia
3
Department of Chemistry, Al Lieth University College, Umm Al-Qura University, Makkah 21955, Saudi Arabia
4
Department of Biology, College of Sciences, Princess Nourah bint Abdulrahman University, Riyadh 11671, Saudi Arabia
5
Department of Botany and Microbiology, College of Science, King Saud University, Riyadh 11451, Saudi Arabia
6
Department of Biology, Jamoum University College, Umm Al-Qura University, Makkah 21955, Saudi Arabia
7
Department of Biology, College of Science, University of Jeddah, Jeddah 21493, Saudi Arabia
8
Department of Biology, College of Science and Arts at Khulis, University of Jeddah, Jeddah 21921, Saudi Arabia
*
Author to whom correspondence should be addressed.
Sustainability 2023, 15(3), 2745; https://doi.org/10.3390/su15032745
Submission received: 21 December 2022 / Revised: 22 January 2023 / Accepted: 31 January 2023 / Published: 2 February 2023

Abstract

:
Metagenomic approach was used to detect microbial gene abundance and relative abundance in the rhizosphere of Moringa oleifera and surrounding bulk soil and to detect the response of soil microbes to watering. Expectedly, the number and abundance of non-redundant genes were extremely higher in bacteria followed by archaea, eukaryota and viruses. Results demonstrated unexpected high abundance of some microbes (ex., endophyte genus Nocardioides) in the rhizosphere that are supposed to exist mainly in other rhizocompartments. We suggest this differential distribution of microbes is due to the specific pattern of host-microbe interaction. Other endosymbiont microbes, ex., fungi Mucoromycota and Ascomycota, were highly abundant in the bulk soil possibly because they are phytopathogens where plant exudates might inhibit their growth or force these fungi to approach reverse chemotaxis. Our data indicated high abundance of other symbiont microbes in the rhizosphere of M. oleifera at phylum (ex., Actinobacteria) and genus (ex., Streptomyces) levels. Watering experiment indicated that phylum Actinobacteria and the descending genus Streptomyces are among the highest. Rhizobiome of M. oleifera seems to harbor a wealth of new species of the genus Streptomyces that are required to be deciphered for function in order to be eventually utilized in pharmaceutical and agricultural applications.

1. Introduction

Moringa oleifera is an edible, drought-resistant wild plant species of family Moringaceae that grows natively in Saudi Arabia [1,2]. This wild plant is involved in several medicinal and pharmacological applications as its leaves, pods and seeds are rich in a variety of essential phytochemicals that act on producing estrogen and stimulating mammary gland ducts to produce milk [3]. M. oleifera also contains more vitamin C than oranges and more vitamin A than carrots, and has more calcium than milk, more potassium than bananas and more iron than spinach [4]. This plant is also rich in antioxidants, e.g., flavonoids (quercetin), polyphenols and ascorbic acid in its leaves, flowers and seeds [5]. Polysaccharides and fibers of M. oleifera can be used to treat chronic diseases such as cancer, cardiovascular diseases, diabetes and obesity [6,7,8]. Leaves and flowers of M. oleifera can also protect liver from damage, oxidation and toxicity, while seed oil can restore liver enzymes and increase liver’s total protein content. In addition, leaves and seeds of M. oleifera contain glycosides (Fahey [9]) and N-α-L-rhamnophyranosyl vincosamide (Panda et al. [10]) that can help lower blood pressure and the leaf β-sitosterol was also used to lower cholesterol level [9]. In terms of agricultural applications, powder of M. oleifera seed can be used as a natural coagulant to purify water, while seed oil can be used as a plant fertilizer to increase crop yields (Ashfaq et al. [11]) and as an ingredient in feeding tilapia fish [12]. This plant is also used in cosmetics and in the production of soaps and perfumes [13] and biodiesel [14].
The term metagenomics refers to the untargeted whole shotgun sequencing (WGS) of microbes, while the term metataxonomics refers to the targeted 16S rRNA gene (or marker gene) sequencing. When comparing the two approaches, the first uses random primers that target overlapping regions of microbial genomes, while the second uses specific primers to amplify 16S rRNA, which, in turn, leads to potential bias in the recovered taxonomic units [15,16,17,18]. Other advantages of WGS approach include its reliability in bacterial profiling [19,20]. In terms of metataxonomic approach, only one specific region of DNA is read, while all genomic DNA of WGS approach is read to allow the identification and profiling, not only bacterial and archaeal structures and genomes, but also those of fungi, protozoa and viruses. Draft genomes of many abundant microbes can be generated from WGS approach. Besides, taxa in WGS approach can be more accurately defined down to the species level and even to the strain level, while mostly not beyond the genus level for 16S approach [21]. WGS also provides accurate information about functional potentiality of a given microbiome, while predicted functionality for 16S approach [19,20,22]. In terms of rarefaction plots of the two approaches, WGS was shown to significantly identify more bacterial taxa than 16S approach as WGS was proven to identify twice the number of species compared with 16S approach [19,20,21]. WGS approach also shows higher accuracy in estimating alpha and beta diversity that correspond, respectively, to microbial richness and abundance [22]. Unlike marker gene sequencing, WGS almost contains all of the prevalent microbial genes in the microbiome, thus, provide a deeper view of soil microbe taxonomy and taxon abundance of different microbial kingdoms due to changing habitat or environmental condition [23].
Unlike wild plants, domesticated plants have low ability to establish symbiotic associations with microbes in the rhizosphere due to the reduced soil microbial diversity caused by continuing agricultural practices [24]. For example, continuous supply of nitrogen fertilizers retards soil respiration, microbial biomass and the evolution of less-mutualistic rhizobacteria [25]. This practice also influences the differential abundance and assemblage of rhizosphere microbes (Bouffaud et al. [26]) as it likely promotes the growth of members of phyla Actinobacteria and Firmicutes, while reduces that of members of phyla Acidobacteria and Verrucomicrobia [27]. Such an impaired microbial diversity results in a modified pattern of plant exudation (or rhizodeposition) [26,28,29]. Accordingly, advantages of using the wild plant M. oleifera in studying rhizosphere microbiome and host-microbe interactions include the virgin nature of intact soil microbiome, which allows the study of native microbial structures, diversity, assemblages and evolution dynamics [24,30,31].
In the present study, we have used metagenome approach in order to detect signatures of rhizosphere and surrounding bulk soil microbiomes of M. oleifera and detect influence of watering on microbial signatures and abundances as well as the consequent downstream plant-microbe interactions.

2. Materials and Methods

2.1. Watering Experiment, Soil Collection and Whole Metagenome Sequencing

Watering experiment was conducted on Moringa oleifera plants naturally grow in western region of Mecca governorate (21°12′17.8″ N 39°31′26.4″ E), Saudi Arabia [2]. A field spot that received no rainfall for >3 months was selected for the experiment, where we assigned three plots (1 m2 each) of single-grown similar-sized plants to collect rhizosphere soil and three nearby plots (≤10 m apart from the plants) to collect bulk soil. These six plots were watered only once at early morning (25 L dH2O/plot), then, samples were collected after 0, 24 and 48 h at ~10–30 cm depth as previously described [23,32]. Amount of water was enough to keep the soil moist for two days. Samples of each day for each soil type were gathered to isolate microbiomes of the two soil types at the three time points after watering. Gathered samples were immediately put in liquid nitrogen and transported to the lab in dry ice to be stored at −20 °C until use [33].

2.2. DNA Extraction, Library Construction and WGS

DNAs of the six gathered samples of the two soil types for the three watering time points were extracted using CTAB/SDS method after soil pH was determined in a 1:1 (wt/wt) soil-H2O slurry [34]. Purity and integrity of DNAs were checked by agarose gel electrophoresis (1%) and DNA concentration was adjusted to 10 ng/μL using dsDNA Assay kit (Life Technologies, Carlsbad, CA, USA). High quality DNAs were, then, shipped to Novogene Co., Ltd., Singapore, for whole metagenome sequencing (WGS). Recovered data were first pre-processed by trimming low quality bases (Q-value ≤ 38) with >40-bp threshold, and removing reads with N nucleotides with >10-bp threshold. Effective clean data were, then, processed for bioinformatics analysis. Library preparation was carried out using an Ultra DNA Library Prep kit for Illumina (NEB, Ipswich, MA, USA) and samples were fragmented by sonication to recover 350 bp reads that were further processed to approach PCR. Size distribution of purified amplicons (AMPure XP System, Illumina, CA, USA) was estimated using Agilent2100 Bioanalyzer and DNA libraries were sequenced on Illumina HiSeq 2500 platform.

2.3. Processing of Sequencing Data and Gene Cataloging

Raw data were assembled using MEGAHIT with Kmer = 55 and chimeras were removed as described [35,36,37]. Less abundant, unassembled reads of all samples were gathered and reassembled to recover NOVO_MIX scaffolds. Assembled and unassembled scaffolds were cut off at “N” to obtain scaftigs and an extra layer of quality control was done by removing scaftigs of ˂500 bp length [35,38]. Then, clean data were mapped against Soap 2.21 software and effective Scaftigs were used further in gene prediction as described [38,39,40,41,42]. Non-redundant gene catalogues (nrGC) were constructed using greedy pairwise comparison following standard procedure (Li et al. [43]) after predicted genes with ORFs > 100 nt length were dereplicated using Cluster Database at High Identity with Tolerance (CD-HIT) [44,45]. nrGCs were incorporated in the detection of gene abundance, then, taxonomic groups were assigned using pipeline designed by Novogene if percentage of reads annotated to the same species exceeded 95%. Reads showing lower percentages were considered as chimeric contigs and recovered species were not considered further.

2.4. Gene and Taxonomic Annotation

Gene annotation was conducted using binning reference-based classification method MEGAN [46,47]. While, taxonomic annotation based on abundance of non-redundant (NR) genes was done using DIAMOND database [48]. Analyses of correlation coefficient, principle component (PCA) and Core/pan were carried out based on Bray–Curtis distances, then, core/pan rarefaction curve was drown. Beta diversity measures referring to abundance and relative abundance at different taxonomic ranks were estimated to explore taxon composition, while Venn diagram was drawn to detect unique and shared genes among the three watering groups. Generated tables refer to gene number and abundance at different taxonomic ranks (kingdom down to species).

3. Results

3.1. Statistics of WGS Datasets

An average of 7.52 Gb raw data were generated for microbiome samples across soil type and time after watering, while averages of 7.51 and 7.55 Gb for bulk and rhizosphere microbiomes, respectively, and averages of 6.53, 8.09 and 7.98 Gb for soil microbiomes collected at 0, 24 and 48 h watering time points, respectively (Table 1). Average number of raw reads was 50.18 M in microbiomes across soil type and time after watering, while 50.03 and 50.34 M for bulk and rhizosphere soil microbiomes, respectively, and averages of 43.50, 53.90 and 53.15 M for microbiomes collected at 0, 24 and 48 h watering time points, respectively. Average percentages of Ns, clean data, clean GC and efficiency in raw data across soil type and time after watering were 0.5, 97.8, 60.45 and 99.73%, respectively (Table 1).
Total length of assembled scaftigs of microbiomes across soil type and watering time points was 2196 billion bp referring to 2,462,090 reads with average scaftig length of 890.38 bp, while that for assembled NOVO_MIX scaftigs of less abundant genes was 2170 billion bp referring to a number of 2,553,156 reads with average length of 849.92 bp (Table 2). This indicates that almost half of sequencing reads are less abundant, thus, gathered for assembling NOVO_MIX scaffolds. Averages of scaftigs at N50 and N90 lengths of microbiomes across soil type and watering time points were 873.17 and 543.83 bp, respectively, while 841 and 542 bp, respectively, for assembled NOXO_MIX scaftigs of less abundant genes. Average largest assembled scaftigs across soil type and watering time points was 90,250, while as little as 20,354 for assembled NOXO_MIX scaftigs of less abundant genes (Table 2).
In terms of gene prediction data shown in Table 3, total number of non-redundant open reading frames (ORFs) in assembled scafolds of M. oleifera across soil type and watering time points was 3,138,858, while 3,486,643 for assembled NOVO_MIX ORFs of less abundant genes (Table 3). Of which, percentages of 10.62, 29.72, 28.11 and 31.55% were calculated, respectively, for ORFs with no start/no stop codons, with start codons, with stop codons and with start/stop codons in microbiomes of M. oleifera across soil type and watering time points, while 11.47, 31.60, 30.80 and 26.14%, respectively, for assembled NOVO_MIX ORFs of less abundant genes. This indicates that percentage of ORFs of complete genes resulted from the original assembly (31.55%) is higher than that of re-assembled low abundant reads (26.14%).
Of which, total length of genes annotated from gene catalogue in Mb in microbiomes of M. oleifera across soil type and watering time points was 1365.49 Mb with average length of 420.43 bp, while 1508.40 Mb for assembled NOVO_MIX of less abundant ORFs with average length of 432.62 bp. Average GC% within genes in microbiomes of M. oleifera across soil type and watering time points was 63.80%, while 67.35% for assembled NOVO_MIX ORFs of less abundant genes (Table 3) and was 60.45% for clean GC in raw data (Table 1).

3.2. Description of Core/Pan Rarefaction Curves and Venn Diagram

Stacked numbers of non-redundant genes of the six microbiome samples were randomly incorporated in core- and pan rarefaction curves (Figure S1). Core rarefaction curve gradually drops in size as more metagenomes are added, while stuck when metagenome incorporates no more inflammation. Pan metagenome refers to entire set of genes across the six metagenomes as it incorporate genes that are absent from one or more samples (e.g., shell metagenome), unique genes to any sample (e.g., cloud metagenome) and genes that are present in all six metagenomes (core metagenome). The results in Figure S1 indicate that core rarefaction dropped to reach 90,000 conserved non-redundant genes across the six samples, while pan metagenome reached up to ~1,350,000 genes. Venn diagram in Figure 1 indicates that sizes of cloud metagenomes for the three watering time points 0 (group A), 24 (group B) and 48 h (group C) were 118,147, 90,756 and 151,356 genes, respectively (Figure 1). The latter three records refer to unique genes of a given group. Sizes of shell metagenomes between groups A and B, B and C, and A and C were 167,389, 356,732 and 316,015 genes, respectively (Figure 1). While, size of core metagenome across the three groups was 1,301,863. The latter record basically refers to genes incorporated in beta diversity measurements.

3.3. Correlation Coefficient and Principal Component Analyses

Heat diagram of correlation coefficient between different sample pairs is shown in Table S1 and described in Figure S2. Positive correlations occurred for pairs of microbiomes of the same soil type, while negative correlations refers to the large distance between rhizosphere and bulk soil microbiome samples. These results refer to the low similarity in microbiome structures between microbiomes of the two soil types. However, the results at the three watering group levels indicated that distance between microbiome samples of the two soil types harvested at the same watering time point is lower than that between microbiome samples of the two soil types harvested at two different watering time points (Figure S2).
The results of principle component analyses (PCA) based on the number of non-redundant genes indicated complete separation between microbiomes of the two soil types at phylum, genus and species levels (Figure 2). At phylum level (Figure 2a), bulk soil microbiomes were located at the negative side of PCA2 (or PC2) axis, while those of rhizosphere soil were located at the positive side of PC2 axis. At genus level (Figure 2b), bulk soil microbiomes were located at the negative side of PC1 axis, while positive side of PC1 axis at species level (Figure 2c) and vice versa for rhizosphere microbiomes. In terms of soils collected at the three time points, group A microbiome (0 h watering time point) showed complete separation at the three taxonomic levels (Figure 2a–c) from those of groups B (24 h watering time point) and C (48 h watering time point). However, there is no complete separation between microbiomes of groups B and C indicating partial similarity or overlap in microbiome structures and abundance in these two groups. The results of correlation coefficient and PCA indicated that grouping of microbiomes at soil type and time after watering is explainable and reliable.

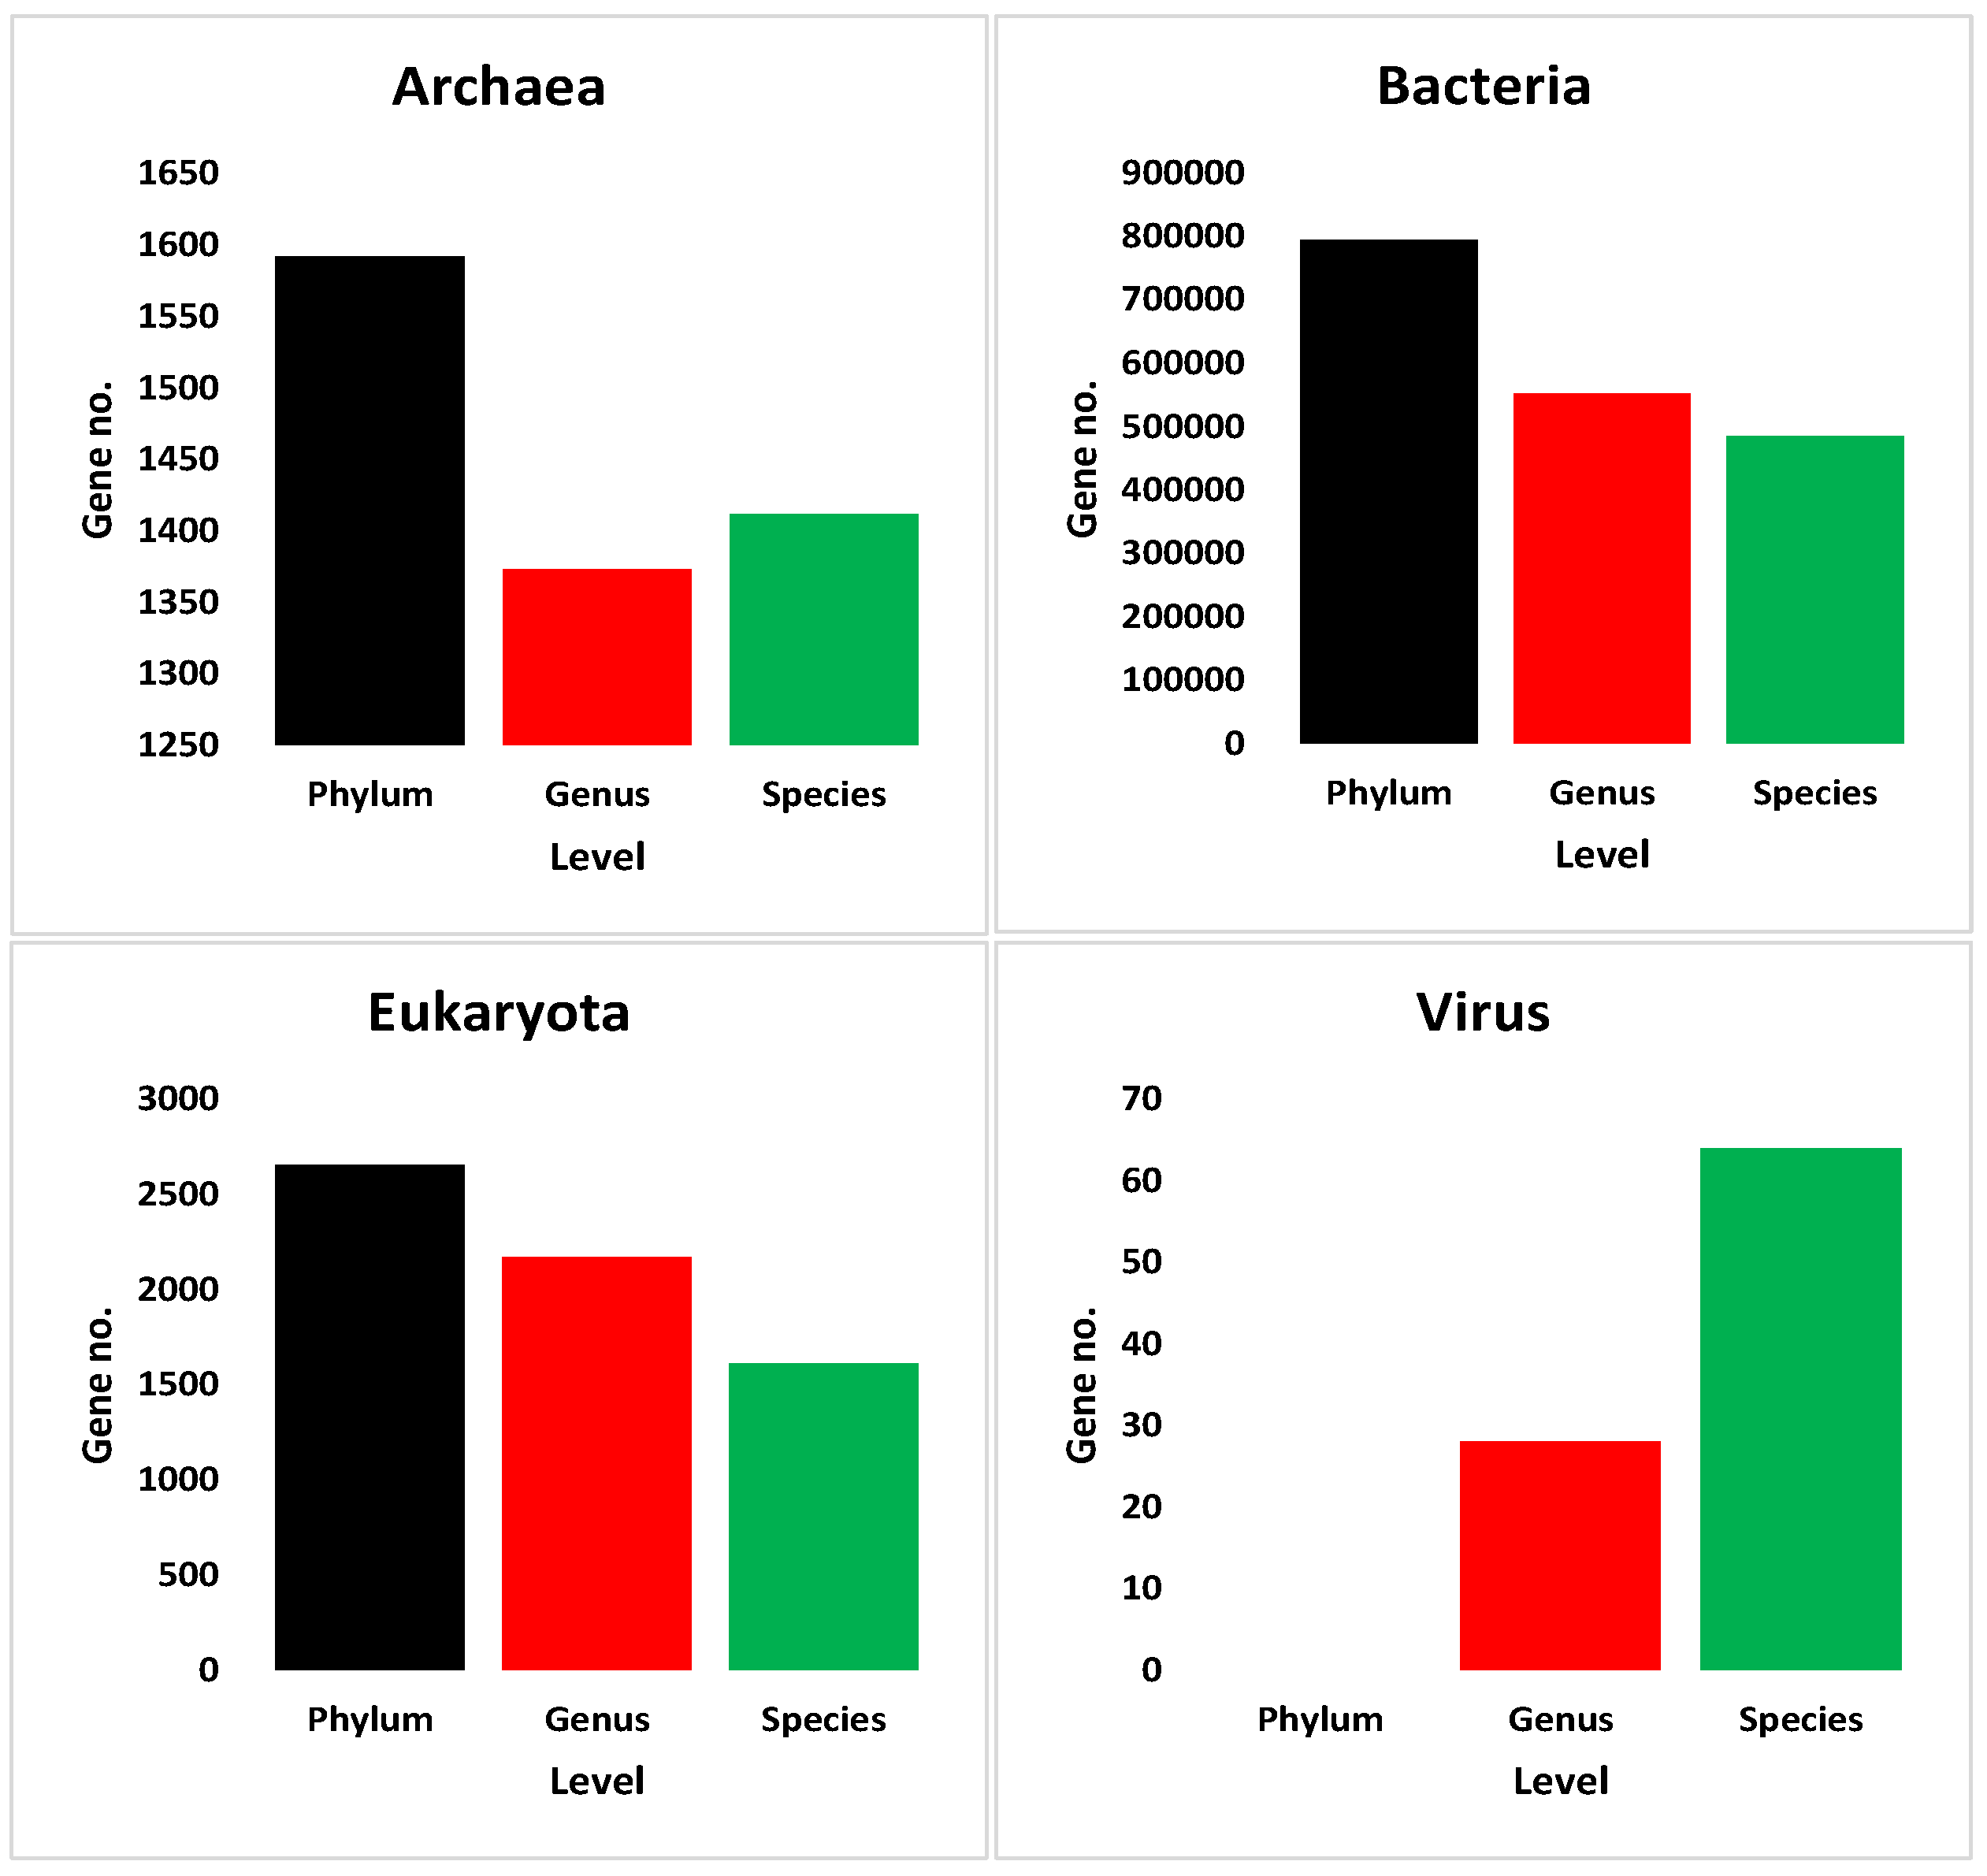
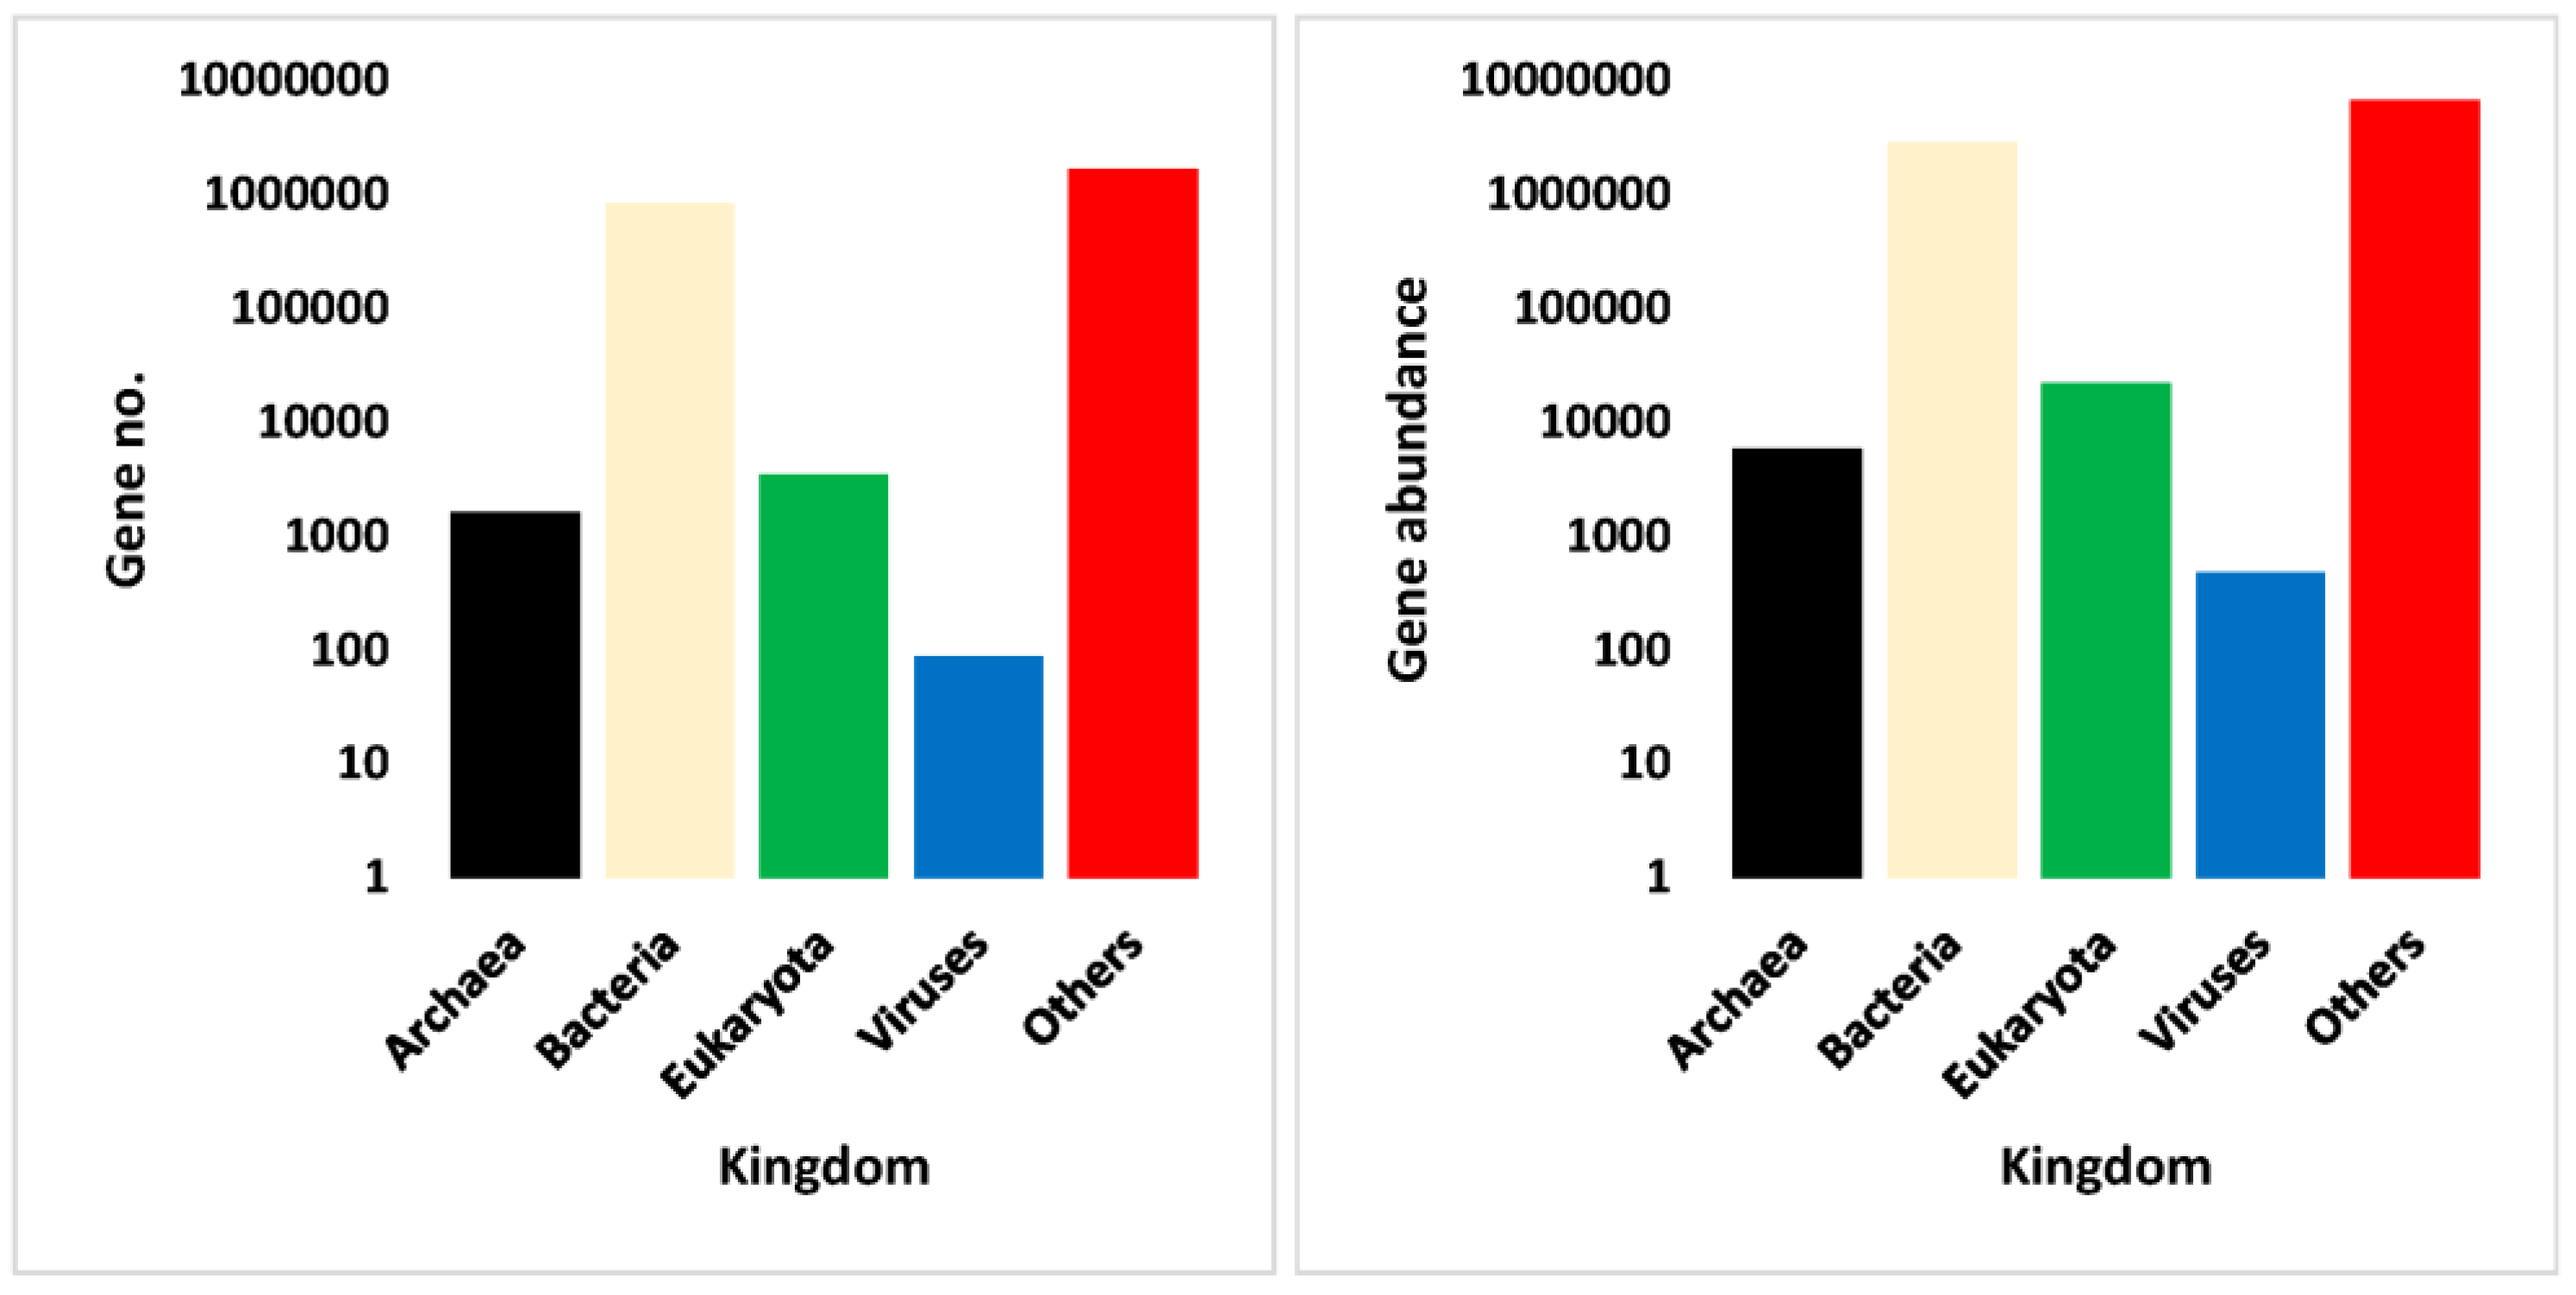
3.4. Annotation Results of Assembled Non-Redundant ORFs

Alignment was conducted for the generated non-redundant high abundant ORFs and low abundant NOVO_MIX ORFs that were subjected to BLAST to find subject hits in the National Center for Biotechnology Information (NCBI). These subjects subsequently refer to the encoding microbes in Moringa oleifera microbiomes across soil type and time after watering (Table S2). NOVO_MIX refers to the mixed assembly results of less abundant reads usually found in ≥2 out of the six samples. Number of aligned ORFs based on the described quality control criteria was 1,048,574 that ranged in size between 344–1291 bp. Numbers of ORFs for kingdoms Archaea, Bacteria, Eukaryota and viruses were 1745, 1,036,782, 9948 and 99, respectively. Criteria for annotation include occurrence of ≥70% identity and mismatch of ≤30% (Table S2).

3.5. Differential Microbiome Structure and Abundance

Number of genes at the four different taxonomic ranks kingdom, phylum, genus and species in microbiomes of Moringa oleifera across soil type and time after watering is shown in Tables S3–S6, respectively and described in Figure 3. Gene numbers across soil type and time after watering for the four kingdoms archaea, Bacteria, Eukaryota and viruses were 1623, 818,976, 3462 and 88, respectively (Table S3). The total gene number across the four kingdoms is almost 79% that of their original total ORF number (Table S2) probably because of the cases where more than one ORF share only one subject in the NCBI.
Results in Table S3 and Figure 3 indicated a number of 1,678,109 genes that found no analogs in the NCBI indicating the wealth of new genetic information in the matagenome of M. oleifera. Total gene number at the three other taxonomic ranks phylum, genus and species in Tables S4–S6 and Figure 3 was highest at the phylum level of Archaea, Bacteria and Eukaryota. Note that no phylum level is available for viruses. Bacteria and Eukaryota showed higher records at genus level than those at species level, while Archaea showed higher records at species level than those at genus level. We speculate that the large gene number at genus level of kingdoms Bacteria and Eukaryota is due to the large taxa that are not yet deciphered at the species level.
Results in Tables S4–S7 and Figure 4 indicated that gene number align with gene abundance for the four kingdoms. Abundance results at the four taxonomic ranks among microbiome samples are shown in Tables S7–S10, respectively, while those between groups of soil type of Moringa oleifera and time after watering are shown in Tables S11–S14, respectively. Results of gene abundance versus relative abundance in the aforementioned tables were compared among microbiome samples and between microbiome groups of soil type (rhizosphere and bulk) and those of watering time points (0, 24 and 48 h) at the four taxonomic ranks. Heatmaps referring to microbes of the top 35 highly abundant non-redundant genes among samples (R1–R3 and S1–S3) of rhizosphere (R) and bulk (S) soils of M. oleifera after 0 (R1 and S1), 24 (R2 and S2) and 48 h (R3 and S3) of watering at the four taxonomic ranks are shown in Figures S3–S6, respectively. Of which, we have selected abundance thresholds of ≥1000, ≥20,000 and ≥15,000 for taxa to be analyzed further at phylum, genus and species levels (Figure 5, Figure 6 and Figure 7, respectively).
Abundance and relative abundance of the top non-redundant genes in terms of abundance (≥1000) at phylum level among (R1–R3 and S1–S3) and across microbiome samples of rhizosphere (R) and bulk (S) soils of M. oleifera after 0 (group A), 24 (group B) and 48 h (group C) of watering. Eu = eukaryote, Arch = Archaea. Other phyla are bacterial. More details of abundance and relative abundance are available in Tables S8 and S12, respectively.
As a large number of genes refer to their encoding microbes, we will use the term microbial abundance referring to their gene abundance. We considered differential abundance and relative abundance of a given taxon to be positive when ≥2-fold difference in both abundance and relative abundance of this taxon are generated between the two soil types or among the three time points. We suggest that similar patterns of abundance and relative abundance at the level of soil type or watering time points equally contribute to growth dynamics of microbiome, especially if two or more of these taxa are required to co-exist in order to conduct a certain metabolic process or to influence growth rates of other beneficial and/or pathogenic microbes. Therefore, we have focused on taxa that showed were high in both abundance and relative abundance for further analysis. The most highly abundant taxa belong to 16 different phyla across the four kingdoms (Table S12 and Figure 5), while belong to 16 genera (Table S13 and Figure 6) and 15 species (Table S14 and Figure 7).

3.5.1. At Phylum Level

The results indicated that two phyla belong to Eukaryota kingdom (e.g., Ascomycota and Mucoromycota), one phylum belongs to Archaea kingdom (e.g., Thaumarchaeota), while the rest belong to Bacteria kingdom (Table S8 and Figure 5). Four phyla showed higher abundance in bulk soil microbiome (e.g, phyla Firmicutes and Verrucomicrobia and the two Eukaryota phyla Ascomycota and Mucoromycota), while four other phyla showed higher abundance in rhizosphere soil microbiome (e.g., Actinobacteria, Bacteroidetes, Candidatus Saccharibacteria and Nitrospirae) of Moringa oleifera. In terms of abundance of microbiomes at 0 (group A), 24 (group B) and 48 h (group C) time points, highest abundance in group A microbiome occurred for the two Eukaryota phyla Ascomycota and Mucoromycota in addition to Acidobacteria, while phyla Firmicutes, and Verrucomicrobia for group B and phylum Gemmatimonadetes for group C (Table S12 and Figure 5). In terms of relative abundance, phyla Firmicutes, Verrucomicrobia and Mucoromycota showed higher abundance in bulk soil microbiome of M. oleifera, while phyla Actinobacteria, Bacteroidetes, Candidatus Saccharibacteria and Nitrospirae for rhizosphere soil microbiome (Table S12 and Figure 5). In terms of relative abundance of microbiomes at 0 (group A), 24 (group B) and 48 h (group C) time points, phyla Actinobacteria, Ascomycota and Mucoromycota of group A microbiome showed highest relative abundance, while phylum Firmicutes for groups A and B and phyla Acidobacteria, Gemmatimonadetes and Verrucomicrobia for groups B and C (Table S12 and Figure 5).

3.5.2. At Genus Level

In terms of abundance at the genus level in Table S13 and Figure 6, genera Pseudonocardia, Staphylococcus and Bacillus showed higher abundance in bulk soil microbiome, while genera Blastococcus, Microvirga, Geodermatophilus, Arthrobacter, Solirubrobacter, Mycobacterium, Belnapia, Marmoricola and Streptomyces for rhizosphere soil microbiome. Highest abundance of group A microbiome occurred for genera Blastococcus, Streptomyces and Staphylococcus, while genera Bacillus and Ramlibacter for group B and genera Gemmatirosa and Microbacterium for group C (Table S13 and Figure 6). In terms of relative abundance, genera Pseudonocardia, Staphylococcus, Bacillus and Microbacterium showed higher abundance in bulk soil microbiome of Moringa oleifera, while genera Blastococcus, Microvirga, Geodermatophilus, Arthrobacter, Solirubrobacter, Belnapia, Marmoricola, Streptomyces and Rubellimicrobium in rhizosphere soil microbiome (Table S13 and Figure 6). In terms of relative abundance of microbiomes at 0 (group A), 24 (group B) and 48 h (group C) time points, genus Streptomyces of group A microbiome showed highest relative abundance, while genus Bacillus for group B, genus Sphingomonas for group C, and genera Gemmatirosa, Ramlibacter and Microbacterium for groups B and C (Table S13 and Figure 6).

3.5.3. At Species Level

In terms of abundance at the species level in Table S14 and Figure 6, species Staphylococcus aureus, Pseudonocardia sp. CNS-004, Pseudonocardia sp. MH-G8 and Bacillus thuringiensis showed higher abundance in bulk soil microbiome, while Sphingomonas sp. URHD0057, Blastococcus sp. DSM 46786, Solirubrobacter sp. URHD0082, Geodermatophilus sabuli, Microvirga sp. BSC39, Arthrobacter crystallopoietes, Microvirga massiliensis, Rubellimicrobium mesophilum, Conexibacter woesei and Sphingomonas jaspsi for rhizosphere soil microbiome. Highest abundance of group A microbiome occurred for species Staphylococcus aureus and Blastococcus sp. DSM 46786, while species Gemmatirosa kalamazoonesis for group C (Table S14 and Figure 7). In terms of relative abundance, species Staphylococcus aureus, Pseudonocardia sp. CNS-004, Pseudonocardia sp. MH-G8 and Bacillus thuringiensis showed higher abundance in bulk soil microbiome of Moringa oleifera, while species Sphingomonas sp. URHD0057, Blastococcus sp. DSM 46786, Solirubrobacter sp. URHD0082, Geodermatophilus sabuli, Microvirga sp. BSC39, Arthrobacter crystallopoietes, Microvirga massiliensis, Rubellimicrobium mesophilum, Conexibacter woesei and Sphingomonas jaspsi in rhizosphere soil microbiome (Table S14 and Figure 7). In terms of relative abundance of microbiomes at 0 (group A), 24 (group B) and 48 h (group C) time points, species Gemmatirosa kalamazoonesis of group C microbiome showed highest relative abundance (Table S14 and Figure 7).
Overall, the results of abundance and relative abundance at different taxonomic levels are summarized in Table 4. Nine and 22 taxa, respectively, were highly AB/RAB in bulk and rhizosphere soil microbiomes of M. oleifera. In terms of time after watering, four, five and four taxa, respectively, were highly AB/RAB at 0 h (group A), 24 h (group B) and/or 48 h watering time points, respectively. These 39 taxa were analyzed further (Table 4).

4. Discussion

The ultimate goal of the present study is to use whole metagenome sequencing approach in detecting signature of rhizobiome of Moringa oleifera and its response to watering. This approach was previously proven to be powerful in taxonomic assignment of soil microbiomes and their response to environmental perturbations [49,50,51]. One main reason for using WGS to achieve this goal is the accurate steps of quality control (QC) during assembly and annotation of metagenomes that are well adopted to WGS approach. On the other hand, sequencing errors resulting from marker gene sequencing can negatively affect the estimated diversity and taxonomic annotation of microbiomes and recover false information about the microbes responding to changing environmental conditions [52].
As cost of doing WGS is higher than that of 16S sequencing, a new modified approach of WGS, namely shallow shotgun sequencing, has recently emerged [53]. The latter new WGS approach allows maintaining quality of sequencing data in terms of composition and functionality at a cost similar to metataxonomic or 16S approach. The 16S rRNA approach is cost-effective and requires lower coverage than WGS approach [16]. Note that metataxonomic sequencing usually includes 16S rRNA marker gene for bacteria, the 18S rRNA marker gene for eukaryotes and the internal transcribed spacer (ITS) region for fungi [54,55]. Other advantages of 16S rRNA approach include the existence of informative databases, e.g., Greengenes (DeSantis [56]) and SILVA (Carlton et al. [57]), which harbor marker genes from millions of taxa. However, as the error can occur during amplification or sequencing process, then, operational taxonomic units (OTUs) will likely fail to account for small sequence variations. In addition, Xi et al. [58] indicated that 16S rRNA marker gene can only be used in measuring small amounts of dominant soil microbes. As the number of OTUs in a given sample is overestimated, thus, it is expected that false information on the microbial signatures and diversity will be generated [59,60,61].
There are three rhizocompartments where soil microbes dwell. They are endorhizosphere or the region within root cells, rhizosphere region existing next to endorhizosphere in close proximity to the roots and rhizoplane or root surface region [62]. In the present study, we selected to detect rhizosphere soil microbiome of M. oleifera because it is the region mainly influenced by plant root exudation and the site by which plant and microbes intensively interact [63]. Our results demonstrated unexpected high abundance of some microbes in the rhizosphere that are supposed to exist mainly in other rhizocompartments and low abundance of microbes that are meant to act effectively in the rhizosphere soil. We assume these conflicting results are due to the pattern of interaction between plant and soil microbes especially when natural long-term interaction occurred without any outer artificial forces that affect native microbial assemblage, diversity and evolution.
As in human, plant rhizobiome is considered as a second genome that mainly promotes plant health and growth rate under normal and adverse conditions [63]. Many studies demonstrated that rhizobiome can be shaped by plant root architecture and pattern of plant exudation (rhizodeposition) that promote growth of beneficial microbes and inhibit growth of phytopathogens [28,64,65,66,67,68]. This allelopathic action can result in the production of microbial metabolites and elicitors for plant defense that elicit defense pathways in host plant to urge it to induce systemic acquired resistance (SAR) [69]. Plant exudation pattern can contain low-molecular-weight (e.g., sugars, amino acids secondary metabolites, etc.) or high-molecular-weight compounds (e.g., proteins and mucilage) [70,71]. As indicated, each exudation pattern promotes growth of a distinct incompatible group of plant growth promoting rhizobacteria (PGPR), while inhibits those of other groups. Example of a PGPR group includes Pseudomonas fluorescens and Bacillus subtilis that are attracted to rhizosphere region via chemotaxis towards malic acid exuded by tomato roots [72]. Interestingly, P. fluorescens is induced to colonize and form biofilm as a shield against pathogenic species of the same genus, namely P. syringae [73]. Species P. fluorescens and B. subtilis do not seem to be among the plethora of microbes that act effectively as PGPR of M. oleifera as these species were proven to be less abundant in rhizosphere soil of M. oleifera. Other reason for low abundance of these microbes might be their existence in other rhizocompartment(s).

4.1. Differential Abundance/Relative Abundance of Microbes Based on Soil Type

4.1.1. Higher AB/RAB Taxa in Bulk Soil

High abundance of microbes in bulk soil is not fully justifiable unless it is proven that they cannot sense the presence of plant root exudates to approach chemotaxis and/or plant root might release exudates to inhibit growth of bacteria that mostly have no symbiotic relationship with the plant, thus, chemotaxis occurs at a reverse direction.
In the present study, B. thuringiensis (BT) was shown to be the reason for unexpected high abundance of genus Bacillis and phylum Firmicutes in bulk soil microbiome. BT is a endospore-forming bacteria that can be found in soil, water, plants and dead insects and acts mainly as an environmental pathogen [74]. But, there is no prior reports for any sort of symbiotic relationship of this microbe with plant roots. BT has saprophytic lifestyle as it utilizes saprotrophic nutrition and decaying organic matter for survival and acquiring energy. It is also classified as a copiotrophic microbe [74,75]. This is because it is capable to survive and colonize several environmental niches [74,76]. Soil BT originally exists in the form of spores, which germinate in nutrient-rich, highly humid condition with pH near neutrality, besides being sensed by other co-existing soil microbiota [74,77,78]. We speculate that Moringa oleifera might retard growth of BT by exuding compounds that promote high growth rate of beneficial bacteria, which, in turn, block growth of BT or force it to move far from rhizosphere soil via reverse chemotaxis. This might explain its preference to survive in bulk soil.
Eukaryotic Mucoromycota is a division of mycorrhizal fungi that usually form mycorrhiza-like relationships with plants [79]. Little information is available for this fungal division in terms of its interaction with surrounding plant roots, except that its subdivision Macrophomina was proven to cause several plant diseases, e.g., stem and root rot, seedling blight, upon contact [80,81,82]. Pathogenicity is based on the fungus’s ability to produce hydrolytic enzymes to degrade plant cell wall [83]. Less AB/RAB of Mucoromycota in rhizosphere of M. oleifera might raise the possibility that this wild plant might release root exudates that inhibit propagation of this fungus in plant rhizosphere region [66,67,68]. However, as this fungus as well as the non-mycorrhizal eukaryotic phylum Ascomycota are originally endophytes (Andreo-Jimenez et al. [84]), it is likely that these two endosymbiont fungi mainly exist in endospheric microbiome that occupies plant internal tissues (Rodriguez et al. [85]), while scarcely exist in plant rhizospheric microbiome. Mucoromycota and its descending clade Mucoromycotina are named MFRE or Mucoromycotina ‘fine root endophytes’ [86].
Interestingly, genus Pseudonocardia is a member of phylum Actinobacteria that is highly abundant and relatively abundant (AB/RAB) in rhizosphere soil. Thus, it is not the reason for high AB/RAB of this phylum in rhizosphere soil. Members of this genus are free-living microorganisms that survive at a neutral pH and make no mutual activities with other organisms including plant and have low demands of energy and food [87]. Species of Pseudonocardia produce several secondary metabolites, acting as antifungal, antibacterial and antiviral such as depsipeptide gerumycins, polyene nystatin/nystatin and diketopiperazines (DKPs) [88]. Characteristics of members of this genus might justify the unrequired direct contact with plant root, thus, propagation rate in bulk soil is high. It was recently proven that soil proteins have high antibacterial activity against methicillin resistant Staphylococcus aureus (MRSA), where a number of 144 proteins were identified in the soil among which the majority of them belong to Gram-negative bacteria [89]. Another recent study indicated that Staphylococcus and its decedent species Staphylococcus aureus grow in soil when temperature is high, while moisture is low and pH is between 6–7 [90]. This means that environmental conditions in bulk soil might mimic those required for growth of this bacteria.

4.1.2. Higher AB/RAB in Rhizosphere Soil

Previous reports indicated high abundance of phylum Actinobacteria and descending genus Streptomyces in rhizosphere soil (Lazcano et al. [91]) in alignment with our results (Table 4). Members of this phylum, particularly genus Streptomyces, were reported to promote plant growth via production of various bioactive secondary metabolites, and via production of nitrogenous compounds and organic acids that provide nitrogen to plant rhizosphere [92,93]. As a phosphate solubilizing microorganism (PSM), phylum Actinobacteria carries out mineralization and solubilization of organic P to be stored in large amounts as a biomass in rhizosphere sink until required by either organism, e.g., microbe or plant [94,95]. The latter processes are referred to as biogeochemical P Cycling [96]. Members of phylum Actinobacteria colonize plant tissue and produce antibiotics, awing to the important action of genus Streptomyces. Other products of phylum Actinobacteria in plant rhizosphere include anti-fungal compounds and phytohormones that are beneficial to plant growth [93,97,98,99].
Recent studies indicated that members of phylum Bacteroidetes are highly abundant in plant rhizosphere than in surrounding bulk soil [24,100,101]. Members of phylum Bacteroidetes are pathogen-suppressing in plant rhizobiome zone as they contribute to rhizosphere phosphorus mobilization due to the constitutive activity of a unique phosphatase namely PafA [101]. Phosphorous is an essential nutrient that effectively contributes to carbon acquisition and plant fitness [102,103,104]. Members of Bacteroidetes create a localized region of Pi-depletion at plant rhizosphere to help plant utilizes phosphorous effectively and avoids competing with other rhizosphere microbes for it [105,106]. Members of phylum Bacteroidetes are also a main regulator of carbon cycling as they help degrade complex algal and plant-derived polysaccharides via action of gene clusters, namely polysaccharide utilization loci (PULs) [107,108,109].
Candidatus Saccharibacteria, formerly known as TM7, is a Candidate Phyla Radiation (CPR) phylum existing in aerobic and anaerobic environments of plant rhizosphere as it has capacity to perform fermentation and to grow aerobically using non-familiar electron transport chain system [110,111,112]. Interestingly, members of this phylum harbor genes for complex carbon utilization and amino acid metabolism that act on recycling DNA of rhizobacteria that survive on plant exudates [111]. They are also able to degrade cellulose, hemicellulose, pectin, starch, and 1,3-β-glucan to generate energy by fermentation and/or decomposition of soil necromass (e.g., dead bacteria and timber) to acetate and lactate [111]. In addition, members of this phylum encode a hydrolase that can breakdown the small phenolic compound namely salicylic acid (SA). SA is a signaling molecule required by plant to mediate plant’s ability to recognize pathogen-derived components in the infected zone and to generate plant systemic resistance [113,114]. This phylum can also modulate other signaling molecules such as zeatin and cytokinin [114]. Thus, plant is required to utilize these other signaling molecules to induce plant systemic resistance when this phylum becomes abundant in soil rhizosphere.
Members of phylum Nitrospirae are mainly aerobic ammonia-oxidizing (AOB) or comammox bacteria that contribute to soil nitrification. This bacteria is rarely cultivated, thus, little is known about its ecophysiology [115]. Nitrification is important for composing nitrogen (N) cycle as N acts as a production chain of nitrate, which is the main nitrogen source of terrestrial plants [115]. This action is important when soil is acidic (pH < 5); a condition that makes this bacteria dominates, especially when food-based, rather than carbon-based, organic compounds are available [116,117,118]. However, excessive nitrification can cause a release of a greenhouse gas namely nitrous oxide (Wrage et al. [119]) and undesired level of soil acidification for microbes [120]. Comammox Nitrospira was speculated to have advantages over other nitrifiers especially when dissolved oxygen concentration is low, besides, this microbe has the ability to adapt to slow growth in oligotrophic environments [121]. The bacteria also helps catalyze most soil N transformation processes, thus, plays an important role in mediating N exchange among atmosphere, plants and soils [122,123]. These processes are required to be assessed in order to detect interactive effects of elevated levels of temperature and atmospheric CO2 and role of this bacteria to modulate these adverse conditions [123,124,125].
No enough information is available for genus Blastococcus in terms of its main functions and possible interaction with plant except that it is an aerobic stone-dwelling microbe of phylum Actinobacteria that mostly grows in sandy desert soil [126]. Besides, this microbe is able to withstand increased pH and heavy metals and to degrade pyrogenic organic matter [127]. However, members of Actinobacterial genus Arthrobacter promote plant growth in addition to being able to survive under desiccation and starvation conditions [128]. Genus Rubellimicrobium of phylum Proteobacteria contains few number of species including R. thermophilum and R. mesophilum [129]. The two species are photoheterotroph and the first can withstand heat stress, while the second can grow photoautotrophically more efficiently [130]. However, there is no information about symbiotic relationship for this genus with plant root.
Genera Microvirga of phylum Proteobacteria is an endosymbiont and was reported to enrich content of soil nutrients, promote plant growth and control soil-borne diseases [131]. Members of this genus were proven to be endophytes that promotes nodulation in plant roots (Msaddak et al. [132]; a bioprocess that requires further prove in M. oleifera. Members of the genera Geodermatophilus of phylum Actinobacteria, Gemmatirosa of phylum Gemmatimonadetes and Belnapia of phylum Proteobacteria also colonize both the rhizosphere and phyllosphere regions and promote growth of several plant species [133,134,135]. Prior information about genus Solirubrobacter of phylum Actinobacteria is scarce, except for being a plant symbiont [136]. Marmoricola of phylum Actinobacteria is a chemoorganotrophic bacterial genus of family Nocardioidaceae. However, very little information is available for this genus. However, genus Nocardioides of the same family is known to be an endophyte with potent biocontrol activities against plant pathogen [137]. Information on genus Sphingomonas of phylum Proteobacteria is scarce except that it is soil-indigenous and plant-associated bacterium [138]. Also, species Conexibacter woesei of phylum Actinobacteria is known to be a Gram-positive, aerobic, non-sporulating, oxidase-positive, slow-growing bacteria that is motile by characteristic long peritrichous flagella [139]. It has the ability to reduce nitrate into nitrite suggesting its ability to make respiration anaerobically when oxygen supply is limited [139]. This bacteria is saccharolytic as it hydrolyzes carbohydrates to generate carbon as the main source of energy. However, there is no reports for symbiotic relationship of this microbe with plant.

4.2. Differential Abundance/Relative Abundance of Microbes Based on Watering Time Points

Drought stress can directly shape microbes associated with plant rhizosphere [84]. As Moringa oleifera grows in arid region of Saudi Arabia, all taxa in the soil microbiome of this plant ought to be considerably drought stress tolerant. Drought is a type of selective pressure that drive evolutionary forces and physiodynamics in plant and its intact soil bacteria [140]. Such perturbations in plant physiology due to drought stress can reshape bulk and plant soil microbiomes to restore fitness [141,142,143].Therefore, drought stress can, not only directly, but also indirectly—through plant—impact signature and diversity of rhizobiome. Our results indicate that taxa with higher AB/RAB at 24 and 48 h watering time points ought to be less tolerant compared with those of 0 h watering time point. Therefore, we focused on taxa that showed higher AB/RAB at 0 h watering time point (e.g., phyla Eu:Ascomycota, Eu:Mucoromycota and Actinobacteria and genus Streptomyces), where plant and rhizobiome were subjected to drought stress for at least three months prior watering as indicated in experimental section. Aligning with our claim, endophytic eukaryotic phyla Ascomycota and Mucoromycota were recently reported to be highly drought tolerant [144], while Gemmatimonadetes—with higher AB/RAB at 48 h time point—was recently reported to be drought sensitive [145]. Otherwise, very little information is available for the two eukaryotic microbes to justify their high level of drought stress tolerance.
Prior reports indicated that phylum Actinobacteria and descending genus Streptomyces are in fact more pronounced in soil under drought stress [146]. A more recent report indicated that Actinobacteria and members of descending genus Streptomyces have tremendous influence on plant morphology and physiology under drought stress [147]. In terms of morphology, it was declared that these bacterial taxa increase plant’s fresh weight and root length, reduce damaging effects caused by drought stress and prevent deleterious effects on the chlorophyll content [148]. At the physiological level, content of the osmo-protectant proline in plant increased under drought stress, which is an indicator of drought stress tolerance in several plant species [148,149]. Proline can also act as a scavenger of the deleterious hydroxyl radical produced under drought stress [150,151]. High abundance of members of phylum Actinobacteria also resulted in increased relative water content (RWC) in plant cells. This bacteria can produce phytohormones, indole acetic acid (IAA) to improve drought stress tolerance of host plants via pathway “Plant hormone signal transduction” [152]. IAA acts in enhancing plant root growth and promoting water and nutrient uptake [153]. In addition, Actinobacteria helps mitigate deleterious effects of ethylene whose production is induced under drought stress by biosynthesizing immediate precursor of ethylene namely 1-aminocyclopropane-1-carboxylate (ACC) deaminase that causes reduction of ethylene in plant cells under the stress [154]. The latter action paves the way for IAA to promote plant growth under drought stress [155].
Interestingly, many of the latter reports describing functions of phylum Actinobacteria refer to several species of genus Streptomyces namely S. thermocarboxydus, S. spinoverrucosus, S. pilosus, S. griseus, S. scabies, S. viridis and S. coelicolor [147]. Although this genus and its phylum Actinobacteria are among the highly AB/RAB genera in rhizosphere of M. oleifera and at 0 h watering time point in the present study, none of these descending species showed either high abundance or relative abundance in the present study in either soil type or at any watering time point. This might indicate that members of genus Streptomyces in the present study are completely novel uncultured species and might need to be deciphered in order to add to our understanding of the diversity and possible new functions of the new species of this genus in rhizosphere soil of M. oleifera. Based on these results, we support the statement that native microbiomes of wild plant species represent a wealth of biological system that can eventually be utilized in several pharmaceutical and agricultural applications [24,30,31].

5. Conclusions

In the present study, we have detected signatures and abundance combined with relative abundance of rhizosphere soil microbiome of Moringa oleifera versus that of surrounding bulk soil and overall performance of these soil drought-stressed microbiomes after watering. We tried to justify the recovered data in terms of symbiotic relationships of different microbes especially those with no prior enough information in the literature. Overall, the results indicated high abundance of some microbes (ex., endophyte genus Nocardioides) in the rhizosphere that are supposed to exist mainly in other rhizocompartments. It seems that microbes in different rhizocompartments differ due to the different interaction pattern with plant hosts, where several endophytes existed unexpectedly in rhizosphere of M. oleifera at high AB/RAB levels, while in other rhizocompartment of other plant species. On the other hand, the phytopathogens fungi Mucoromycota and Ascomycota were highly abundant in the bulk soil because plant exudates likely make these fungi to approach reverse chemotaxis. Drought stress tolerance in this wild plant can be directly conferred by some rhizosphere microbes and/or indirectly via the plant-microbe interaction mediated by plant exudates. We recommend studying microbiomes in the three rhizocompartments of M. oleifera in order to get an accurate figure on the differential existence and abundance of microbes in these three regions especially after watering of drought-stressed soil microbes. The recommended analysis will scope the light on the influence of the specific M. oleifera-microbes interaction pattern on distribution and abundance of microbes in the three rhizocompartments. We also recommend a more extensive study via culturomics approaches in order to decipher the new species of genus Streptomyces that might have economic value in several biological applications.

Supplementary Materials

The following supporting information can be downloaded at: https://drive.google.com/drive/folders/14zojGB5PsdSqxYRYwVgC1adIJT9TncQT?usp=share_link.

Author Contributions

Conceptualization, M.Y.R., A.A.A., I.J.H., N.A.S., M.D.A., M.M.A., N.M.A., A.M.A., N.S.A.-A., R.S.J.; methodology, M.Y.R., R.A.A., I.J.H., N.A.S., M.D.A., M.M.A.; software, M.Y.R., A.A.A., I.J.H., N.A.S., M.D.A., M.M.A.; validation, M.Y.R., A.A.A., I.J.H., N.A.S., M.D.A., M.M.A.; formal analysis, N.M.A., A.M.A., N.S.A.-A., R.S.J.; investigation, R.A.A., N.M.A., A.M.A., N.S.A.-A., R.S.J.; resources, N.M.A., A.M.A., N.S.A.-A., R.S.J.; data curation, N.M.A., A.M.A., N.S.A.-A., R.S.J.; writing—original draft preparation, M.Y.R., A.A.A., I.J.H., N.A.S., M.D.A., M.M.A., N.M.A., A.M.A., N.S.A.-A., R.S.J.; writing—review and editing, M.Y.R., A.A.A., R.A.A., N.A.S., M.D.A., M.M.A., N.M.A., H.S.S., A.M.A., N.S.A.-A., S.A.A., R.S.J.; visualization, M.Y.R., A.A.A., I.J.H., N.A.S., M.D.A., M.M.A.; supervision, N.M.A., A.M.A., N.S.A.-A., R.S.J.; project administration, M.Y.R., A.A.A., I.J.H., N.A.S., M.D.A., M.M.A., N.M.A., A.M.A., N.S.A.-A., R.S.J.; funding acquisition, M.Y.R., A.A.A., R.A.A., I.J.H., N.A.S., M.D.A., M.M.A., N.M.A., H.S.S., S.A.A., A.M.A., N.S.A.-A., R.S.J. All authors have read and agreed to the published version of the manuscript.

Funding

Princess Nourah bint Abdulrahman University Researchers Supporting Project number (PNURSP2023R83), Princess Nourah bint Abdulrahman University, Riyadh, Saudi Arabia.

Data Availability Statement

Acknowledgments

The authors acknowledge with thanks Princess Nourah bint Abdulrahman University Researchers Supporting Project number (PNURSP2023R83), Princess Nourah bint Abdulrahman University, Riyadh, Saudi Arabia.

Conflicts of Interest

The authors declare that the research was conducted in the absence of any commercial or financial relationships that could be construed as a potential conflict of interest.

References

  1. Gupta, B.; Ahmed, K. Moringa oleifera: A Bibliometric Analysis of International Publications during 1935–2019. Pharmacogn. Rev. 2020, 14, 82–90. [Google Scholar]
  2. Al-Eisawi, D.M.; Al-Ruzayza, S. The flora of holy Mecca district, Saudi Arabia. Int. J. Biodivers. Conserv. 2015, 7, 173–189. [Google Scholar]
  3. Gopalakrishnan, L.; Doriya, K.; Kumar, D.S. Moringa oleifera: A review on nutritive importance and its medicinal application. Food Sci. Hum. Wellness 2016, 5, 49–56. [Google Scholar] [CrossRef]
  4. Rockwood, J.; Anderson, B.; Casamatta, D. Potential uses of Moringa oleifera and an examination of antibiotic efficacy conferred by M. oleifera seed and leaf extracts using crude extraction techniques available to underserved indigenous populations. Int. J. Phytother. Res. 2013, 3, 61–71. [Google Scholar]
  5. Milla, P.G.; Penalver, R.; Nieto, G. Health Benefits of Uses and Applications of Moringa oleifera in Bakery Products. Plants 2021, 10, 318. [Google Scholar] [CrossRef]
  6. Koul, B.; Chase, N. Moringa oleifera Lam.: Panacea to several maladies. J. Chem. Pharm. Res. 2015, 7, 687–707. [Google Scholar]
  7. Kumar, A.; Naaz, F.; Kushwaha, A.; Chaudhary, P.; Srivastav, P. Present review on phytochemistry, neutraceutical, antimicrobial, antidiabetic, biotechnological and pharmacological characteristics of Moringa oleifera Linn. BMR Phytomed. 2016, 2, 1–17. [Google Scholar]
  8. Saini, R.K.; Sivanesan, I.; Keum, Y.-S. Phytochemicals of Moringa oleifera: A review of their nutritional, therapeutic and industrial significance. 3 Biotech 2016, 6, 1–14. [Google Scholar]
  9. Fahey, J.W. Moringa oleifera: A review of the medical evidence for its nutritional, therapeutic, and prophylactic properties. Part 1. Trees Life J. 2005, 1, 1–15. [Google Scholar]
  10. Panda, S.; Kar, A.; Sharma, P.; Sharma, A. Cardioprotective potential of N,alpha-L-rhamnopyranosyl vincosamide, an indole alkaloid, isolated from the leaves of Moringa oleifera in isoproterenol induced cardiotoxic rats: In vivo and in vitro studies. Bioorg. Med. Chem. Lett. 2013, 23, 959–962. [Google Scholar] [CrossRef]
  11. Ashfaq, M.; Basra, S.M.; Umair, A. Moringa: A miracle plant for agro-forestry. J. Agric. Soc. Sci. 2012, 8, 115–122. [Google Scholar]
  12. Rivas-Vega, M.E.; López-Pereira, J.L.; Miranda-Baeza, A.; Sandoval-Muy, M.I. Sustitución parcial de harina de sardina con Moringa oleifera en alimentos balanceados para juveniles de tilapia (Oreochromismossambicus x Oreochromisniloticus) cultivada en agua de mar. Biotecnia 2012, 14, 3–10. [Google Scholar]
  13. Folkard, G.; Sutherland, J. Moringa oleifera un árbol con enormes potencialidades. Agrofor. Today 1996, 8, 5–8. [Google Scholar]
  14. Gómez, A.V.; Angulo, K.J.O. Revisión de las características y usosde la planta moringa oleífera. Investig. Desarro. 2014, 22, 309–330. [Google Scholar]
  15. Breitwieser, F.P.; Lu, J.; Salzberg, S.L. A review of methods and databases for metagenomic classification and assembly. Brief Bioinform 2019, 20, 1125–1136. [Google Scholar] [CrossRef]
  16. Laudadio, I.; Fulci, V.; Palone, F.; Stronati, L.; Cucchiara, S.; Carissimi, C. Quantitative Assessment of Shotgun Metagenomics and 16S rDNA Amplicon Sequencing in the Study of Human Gut Microbiome. Omics 2018, 22, 248–254. [Google Scholar] [CrossRef]
  17. Campanaro, S.; Treu, L.; Kougias, P.G.; Zhu, X.; Angelidaki, I. Taxonomy of anaerobic digestion microbiome reveals biases associated with the applied high throughput sequencing strategies. Sci. Rep. 2018, 8, 1926. [Google Scholar] [CrossRef]
  18. Fouhy, F.; Clooney, A.G.; Stanton, C.; Claesson, M.J.; Cotter, P.D. 16S rRNA gene sequencing of mock microbial populations- impact of DNA extraction method, primer choice and sequencing platform. BMC Microbiol. 2016, 16, 123. [Google Scholar] [CrossRef]
  19. Durazzi, F.; Sala, C.; Castellani, G.; Manfreda, G.; Remondini, D.; De Cesare, A. Comparison between 16S rRNA and shotgun sequencing data for the taxonomic characterization of the gut microbiota. Sci. Rep. 2021, 11, 3030. [Google Scholar]
  20. Chistoserdova, L. Functional metagenomics: Recent advances and future challenges. Biotechnol. Genet. Eng. Rev. 2009, 26, 335–352. [Google Scholar]
  21. Ranjan, R.; Rani, A.; Metwally, A.; McGee, H.S.; Perkins, D.L. Analysis of the microbiome: Advantages of whole genome shotgun versus 16S amplicon sequencing. Biochem. Biophys. Res. Commun. 2016, 469, 967–977. [Google Scholar] [CrossRef]
  22. Pérez-Cobas, A.E.; Gomez-Valero, L.; Buchrieser, C. Metagenomic approaches in microbial ecology: An update on whole-genome and marker gene sequencing analyses. Microb. Genom. 2020, 6, mgen000409. [Google Scholar]
  23. Dai, L.; Zhang, G.; Yu, Z.; Ding, H.; Xu, Y.; Zhang, Z. Effect of drought stress and developmental stages on microbial community structure and diversity in peanut rhizosphere soil. Int. J. Mol. Sci. 2019, 20, 2265. [Google Scholar] [CrossRef]
  24. Bulgarelli, D.; Garrido-Oter, R.; Munch, P.C.; Weiman, A.; Droge, J.; Pan, Y.; McHardy, A.C.; Schulze-Lefert, P. Structure and function of the bacterial root microbiota in wild and domesticated barley. Cell Host Microbe 2015, 17, 392–403. [Google Scholar] [CrossRef] [Green Version]
  25. Weese, D.J.; Heath, K.D.; Dentinger, B.T.; Lau, J.A. Long-term nitrogen addition causes the evolution of less-cooperative mutualists. Evolution 2015, 69, 631–642. [Google Scholar] [CrossRef]
  26. Bouffaud, M.L.; Poirier, M.A.; Muller, D.; Moënne-Loccoz, Y. Root microbiome relates to plant host evolution in maize and other P oaceae. Environ. Microbiol. 2014, 16, 2804–2814. [Google Scholar] [CrossRef]
  27. Ramirez, K.S.; Craine, J.M.; Fierer, N. Consistent effects of nitrogen amendments on soil microbial communities and processes across biomes. Glob. Chang. Biol. 2012, 18, 1918–1927. [Google Scholar] [CrossRef]
  28. Jones, D.L.; Nguyen, C.; Finlay, R.D. Carbon flow in the rhizosphere: Carbon trading at the soil–root interface. Plant Soil 2009, 321, 5–33. [Google Scholar] [CrossRef]
  29. Jones, D.L.; Hodge, A.; Kuzyakov, Y. Plant and mycorrhizal regulation of rhizodeposition. New Phytol. 2004, 163, 459–480. [Google Scholar] [CrossRef]
  30. Schlaeppi, K.; Dombrowski, N.; Oter, R.G.; Ver Loren van Themaat, E.; Schulze-Lefert, P. Quantitative divergence of the bacterial root microbiota in Arabidopsis thaliana relatives. Proc. Natl. Acad. Sci. USA 2014, 111, 585–592. [Google Scholar] [CrossRef]
  31. Zachow, C.; Müller, H.; Tilcher, R.; Berg, G. Differences between the rhizosphere microbiome of Beta vulgaris ssp. maritima—Ancestor of all beet crops—And modern sugar beets. Front. Microbiol. 2014, 5, 415. [Google Scholar]
  32. Geng, L.-L.; Shao, G.-X.; Raymond, B.; Wang, M.-L.; Sun, X.-X.; Shu, C.-L.; Zhang, J. Subterranean infestation by Holotrichia parallela larvae is associated with changes in the peanut (Arachis hypogaea L.) rhizosphere microbiome. Microbiol. Res. 2018, 211, 13–20. [Google Scholar]
  33. Hurt, R.A.; Qiu, X.; Wu, L.; Roh, Y.; Palumbo, A.V.; Tiedje, J.M.; Zhou, J. Simultaneous recovery of RNA and DNA from soils and sediments. Appl. Environ. Microbiol. 2001, 67, 4495–4503. [Google Scholar] [CrossRef]
  34. McLean, E. Soil pH and lime requirement. Methods Soil Anal. Part 2 Chem. Microbiol. Prop. 1983, 9, 199–224. [Google Scholar]
  35. Mende, D.R.; Waller, A.S.; Sunagawa, S.; Järvelin, A.I.; Chan, M.M.; Arumugam, M.; Raes, J.; Bork, P. Assessment of metagenomic assembly using simulated next generation sequencing data. PLoS ONE 2012, 7, e31386. [Google Scholar]
  36. Karlsson, F.H.; Fåk, F.; Nookaew, I.; Tremaroli, V.; Fagerberg, B.; Petranovic, D.; Bäckhed, F.; Nielsen, J. Symptomatic atherosclerosis is associated with an altered gut metagenome. Nat. Commun. 2012, 3, 1245. [Google Scholar]
  37. Oh, J.; Byrd, A.L.; Deming, C.; Conlan, S.; Program, N.C.S.; Kong, H.H.; Segre, J.A. Biogeography and individuality shape function in the human skin metagenome. Nature 2014, 514, 59–64. [Google Scholar] [CrossRef]
  38. Nielsen, H.B.; Almeida, M.; Juncker, A.S.; Rasmussen, S.; Li, J.; Sunagawa, S.; Plichta, D.R.; Gautier, L.; Pedersen, A.G.; Le Chatelier, E. Identification and assembly of genomes and genetic elements in complex metagenomic samples without using reference genomes. Nat. Biotechnol. 2014, 32, 822–828. [Google Scholar] [CrossRef]
  39. Qin, N.; Yang, F.; Li, A.; Prifti, E.; Chen, Y.; Shao, L.; Guo, J.; Le Chatelier, E.; Yao, J.; Wu, L.; et al. Alterations of the human gut microbiome in liver cirrhosis. Nature 2014, 513, 59–64. [Google Scholar] [CrossRef]
  40. Qin, J.; Li, R.; Raes, J.; Arumugam, M.; Burgdorf, K.S.; Manichanh, C.; Nielsen, T.; Pons, N.; Levenez, F.; Yamada, T.; et al. A human gut microbial gene catalogue established by metagenomic sequencing. Nature 2010, 464, 59–65. [Google Scholar] [CrossRef]
  41. Zeller, G.; Tap, J.; Voigt, A.Y.; Sunagawa, S.; Kultima, J.R.; Costea, P.I.; Amiot, A.; Bohm, J.; Brunetti, F.; Habermann, N.; et al. Potential of fecal microbiota for early-stage detection of colorectal cancer. Mol. Syst. Biol. 2014, 10, 766. [Google Scholar] [CrossRef]
  42. Sunagawa, S.; Coelho, L.P.; Chaffron, S.; Kultima, J.R.; Labadie, K.; Salazar, G.; Djahanschiri, B.; Zeller, G.; Mende, D.R.; Alberti, A.; et al. Ocean plankton. Structure and function of the global ocean microbiome. Science 2015, 348, 1261359. [Google Scholar] [CrossRef]
  43. Li, J.; Jia, H.; Cai, X.; Zhong, H.; Feng, Q.; Sunagawa, S.; Arumugam, M.; Kultima, J.R.; Prifti, E.; Nielsen, T.; et al. An integrated catalog of reference genes in the human gut microbiome. Nat. Biotechnol. 2014, 32, 834–841. [Google Scholar] [CrossRef]
  44. Li, W.; Godzik, A. Cd-hit: A fast program for clustering and comparing large sets of protein or nucleotide sequences. Bioinformatics 2006, 22, 1658–1659. [Google Scholar] [CrossRef]
  45. Fu, L.; Niu, B.; Zhu, Z.; Wu, S.; Li, W. CD-HIT: Accelerated for clustering the next-generation sequencing data. Bioinformatics 2012, 28, 3150–3152. [Google Scholar] [CrossRef]
  46. Huson, D.H.; Beier, S.; Flade, I.; Górska, A.; El-Hadidi, M.; Mitra, S.; Ruscheweyh, H.-J.; Tappu, R. MEGAN community edition-interactive exploration and analysis of large-scale microbiome sequencing data. PLoS Comput. Biol. 2016, 12, e1004957. [Google Scholar] [CrossRef]
  47. Huson, D.H.; Mitra, S.; Ruscheweyh, H.-J.; Weber, N.; Schuster, S.C. Integrative analysis of environmental sequences using MEGAN4. Genome Res. 2011, 21, 1552–1560. [Google Scholar] [CrossRef]
  48. Buchfink, B.; Xie, C.; Huson, D.H. Fast and sensitive protein alignment using DIAMOND. Nat. Methods 2015, 12, 59–60. [Google Scholar]
  49. Wu, L.; Wang, J.; Wu, H.; Chen, J.; Xiao, Z.; Qin, X.; Zhang, Z.; Lin, W. Comparative Metagenomic Analysis of Rhizosphere Microbial Community Composition and Functional Potentials under Rehmannia glutinosa Consecutive Monoculture. Int. J. Mol. Sci. 2018, 19, 2394. [Google Scholar] [CrossRef]
  50. Luo, C.; Rodriguez-R., L.M.; Johnston, E.R.; Wu, L.; Cheng, L.; Xue, K.; Tu, Q.; Deng, Y.; He, Z.; Shi, J.Z. Soil microbial community responses to a decade of warming as revealed by comparative metagenomics. Appl. Environ. Microbiol. 2014, 80, 1777–1786. [Google Scholar]
  51. Simon, C.; Daniel, R. Achievements and new knowledge unraveled by metagenomic approaches. Appl. Microbiol. Biotechnol. 2009, 85, 265–276. [Google Scholar] [CrossRef] [Green Version]
  52. Lucaciu, R.; Pelikan, C.; Gerner, S.M.; Zioutis, C.; Kostlbacher, S.; Marx, H.; Herbold, C.W.; Schmidt, H.; Rattei, T. A Bioinformatics Guide to Plant Microbiome Analysis. Front. Plant Sci. 2019, 10, 1313. [Google Scholar] [CrossRef]
  53. Xu, W.; Chen, T.; Pei, Y.; Guo, H.; Li, Z.; Yang, Y.; Zhang, F.; Yu, J.; Li, X.; Yang, Y. Characterization of shallow whole-metagenome shotgun sequencing as a high-accuracy and low-cost method by complicated mock microbiomes. Front. Microbiol. 2021, 12, 1723. [Google Scholar] [CrossRef]
  54. Woese, C.R.; Fox, G.E. Phylogenetic structure of the prokaryotic domain: The primary kingdoms. Proc. Natl. Acad. Sci. USA 1977, 74, 5088–5090. [Google Scholar] [CrossRef]
  55. Schoch, C.L.; Seifert, K.A.; Huhndorf, S.; Robert, V.; Spouge, J.L.; Levesque, C.A.; Chen, W.; Consortium, F.B.; List, F.B.C.A.; Bolchacova, E. Nuclear ribosomal internal transcribed spacer (ITS) region as a universal DNA barcode marker for Fungi. Proc. Natl. Acad. Sci. USA 2012, 109, 6241–6246. [Google Scholar] [CrossRef]
  56. DeSantis, T.Z.; Hugenholtz, P.; Larsen, N.; Rojas, M.; Brodie, E.L.; Keller, K.; Huber, T.; Dalevi, D.; Hu, P.; Andersen, G.L. Greengenes, a chimera-checked 16S rRNA gene database and workbench compatible with ARB. Appl. Environ. Microbiol. 2006, 72, 5069–5072. [Google Scholar] [CrossRef]
  57. Carlton, J.M.; Angiuoli, S.V.; Suh, B.B.; Kooij, T.W.; Pertea, M.; Silva, J.C.; Ermolaeva, M.D.; Allen, J.E.; Selengut, J.D.; Koo, H.L.; et al. Genome sequence and comparative analysis of the model rodent malaria parasite Plasmodium yoelii yoelii. Nature 2002, 419, 512–519. [Google Scholar] [CrossRef]
  58. Xi, H.; Shen, J.; Qu, Z.; Yang, D.; Liu, S.; Nie, X.; Zhu, L. Effects of Long-term Cotton Continuous Cropping on Soil Microbiome. Sci. Rep. 2019, 9, 18297. [Google Scholar] [CrossRef]
  59. Schloss, P.D.; Westcott, S.L.; Ryabin, T.; Hall, J.R.; Hartmann, M.; Hollister, E.B.; Lesniewski, R.A.; Oakley, B.B.; Parks, D.H.; Robinson, C.J.; et al. Introducing mothur: Open-source, platform-independent, community-supported software for describing and comparing microbial communities. Appl. Environ. Microbiol. 2009, 75, 7537–7541. [Google Scholar] [CrossRef]
  60. Sun, Y.; Cai, Y.; Liu, L.; Yu, F.; Farrell, M.L.; McKendree, W.; Farmerie, W. ESPRIT: Estimating species richness using large collections of 16S rRNA pyrosequences. Nucleic Acids Res. 2009, 37, e76. [Google Scholar]
  61. Quince, C.; Walker, A.W.; Simpson, J.T.; Loman, N.J.; Segata, N. Shotgun metagenomics, from sampling to analysis. Nat. Biotechnol. 2017, 35, 833–844. [Google Scholar] [CrossRef]
  62. Reinhold-Hurek, B.; Bünger, W.; Burbano, C.S.; Sabale, M.; Hurek, T. Roots shaping their microbiome: Global hotspots for microbial activity. Annu. Rev. Phytopathol. 2015, 53, 403–424. [Google Scholar] [CrossRef]
  63. Berendsen, R.L.; Pieterse, C.M.; Bakker, P.A. The rhizosphere microbiome and plant health. Trends Plant Sci. 2012, 17, 478–486. [Google Scholar] [CrossRef]
  64. Jones, D.; Kemmitt, S.; Wright, D.; Cuttle, S.; Bol, R.; Edwards, A. Rapid intrinsic rates of amino acid biodegradation in soils are unaffected by agricultural management strategy. Soil Biol. Biochem. 2005, 37, 1267–1275. [Google Scholar]
  65. Saleem, M.; Law, A.D.; Sahib, M.R.; Pervaiz, Z.H.; Zhang, Q. Impact of root system architecture on rhizosphere and root microbiome. Rhizosphere 2018, 6, 47–51. [Google Scholar] [CrossRef]
  66. Grove, S.; Haubensak, K.A.; Parker, I.M. Direct and indirect effects of allelopathy in the soil legacy of an exotic plant invasion. Plant Ecol. 2012, 213, 1869–1882. [Google Scholar]
  67. Wu, L.; Chen, J.; Xiao, Z.; Zhu, X.; Wang, J.; Wu, H.; Wu, Y.; Zhang, Z.; Lin, W. Barcoded Pyrosequencing Reveals a Shift in the Bacterial Community in the Rhizosphere and Rhizoplane of Rehmannia glutinosa under Consecutive Monoculture. Int. J. Mol. Sci. 2018, 19, 850. [Google Scholar] [CrossRef]
  68. Li, X.-G.; Ding, C.-F.; Hua, K.; Zhang, T.-L.; Zhang, Y.-N.; Zhao, L.; Yang, Y.-R.; Liu, J.-G.; Wang, X.-X. Soil sickness of peanuts is attributable to modifications in soil microbes induced by peanut root exudates rather than to direct allelopathy. Soil Biol. Biochem. 2014, 78, 149–159. [Google Scholar] [CrossRef]
  69. Marquez, N.; Giachero, M.L.; Declerck, S.; Ducasse, D.A. Macrophomina phaseolina: General Characteristics of Pathogenicity and Methods of Control. Front. Plant Sci. 2021, 12, 634397. [Google Scholar] [CrossRef]
  70. Badri, D.; Vivanco, J. Regulation and function of root exudates Plant. Cell Environ. 2009, 32, 666–681. [Google Scholar] [CrossRef]
  71. Badri, D.V.; Chaparro, J.M.; Zhang, R.; Shen, Q.; Vivanco, J.M. Application of natural blends of phytochemicals derived from the root exudates of Arabidopsis to the soil reveal that phenolic-related compounds predominantly modulate the soil microbiome. J. Biol. Chem. 2013, 288, 4502–4512. [Google Scholar] [CrossRef]
  72. de Weert, S.; Vermeiren, H.; Mulders, I.H.; Kuiper, I.; Hendrickx, N.; Bloemberg, G.V.; Vanderleyden, J.; De Mot, R.; Lugtenberg, B.J. Flagella-driven chemotaxis towards exudate components is an important trait for tomato root colonization by Pseudomonas fluorescens. Mol. Plant-Microbe Interact. 2002, 15, 1173–1180. [Google Scholar] [CrossRef]
  73. Rudrappa, T.; Czymmek, K.J.; Pare, P.W.; Bais, H.P. Root-secreted malic acid recruits beneficial soil bacteria. Plant Physiol. 2008, 148, 1547–1556. [Google Scholar] [CrossRef]
  74. Argôlo-Filho, R.C.; Loguercio, L.L. Bacillus thuringiensis is an environmental pathogen and host-specificity has developed as an adaptation to human-generated ecological niches. Insects 2013, 5, 62–91. [Google Scholar]
  75. Fang, Y.; Li, Z.; Liu, J.; Shu, C.; Wang, X.; Zhang, X.; Yu, X.; Zhao, D.; Liu, G.; Hu, S.; et al. A pangenomic study of Bacillus thuringiensis. J. Genet. Genom. 2011, 38, 567–576. [Google Scholar] [CrossRef]
  76. Raymond, B. The biology, ecology and taxonomy of Bacillus thuringiensis and related bacteria. In Bacillus Thuringiensis and Lysinibacillus sphaericus; Springer: New York, NY, USA, 2017; pp. 19–39. [Google Scholar]
  77. Polanczyk, R.A.; Zanúncio, J.C.; Alves, S.B. Relationship between chemical properties of the soil and the occurrence of Bacillus thuringiensis. Ciência Rural 2009, 39, 1–5. [Google Scholar]
  78. Cappello, M.; Bungiro, R.D.; Harrison, L.M.; Bischof, L.J.; Griffitts, J.S.; Barrows, B.D.; Aroian, R.V. A purified Bacillus thuringiensis crystal protein with therapeutic activity against the hookworm parasite Ancylostoma ceylanicum. Proc. Natl. Acad. Sci. USA 2006, 103, 15154–15159. [Google Scholar] [CrossRef]
  79. Lee, S.C.; Idnurm, A. Fungal Sex: The Mucoromycota. Microbiol. Spectr. 2017, 5, 14. [Google Scholar] [CrossRef]
  80. Spatafora, J.W.; Aime, M.C.; Grigoriev, I.V.; Martin, F.; Stajich, J.E.; Blackwell, M. The Fungal Tree of Life: From Molecular Systematics to Genome-Scale Phylogenies. Microbiol. Spectr. 2017, 5, 1–34. [Google Scholar] [CrossRef]
  81. Spatafora, J.W.; Chang, Y.; Benny, G.L.; Lazarus, K.; Smith, M.E.; Berbee, M.L.; Bonito, G.; Corradi, N.; Grigoriev, I.; Gryganskyi, A.; et al. A phylum-level phylogenetic classification of zygomycete fungi based on genome-scale data. Mycologia 2016, 108, 1028–1046. [Google Scholar] [CrossRef]
  82. Ghosh, T.; Biswas, M.; Guin, C.; Roy, P. A review on characterization, therapeutic approaches and pathogenesis of Macrophomina phaseolina. Plant Cell Biotechnol. Mol. Biol. 2018, 19, 72–84. [Google Scholar]
  83. Khan, A.N.; Shair, F.; Malik, K.; Hayat, Z.; Khan, M.A.; Hafeez, F.Y.; Hassan, M.N. Molecular Identification and Genetic Characterization of Macrophomina phaseolina Strains Causing Pathogenicity on Sunflower and Chickpea. Front. Microbiol. 2017, 8, 1309. [Google Scholar] [CrossRef]
  84. Andreo-Jimenez, B.; Vandenkoornhuyse, P.; Le Van, A.; Heutinck, A.; Duhamel, M.; Kadam, N.; Jagadish, K.; Ruyter-Spira, C.; Bouwmeester, H. Plant host and drought shape the root associated fungal microbiota in rice. PeerJ 2019, 7, e7463. [Google Scholar] [CrossRef]
  85. Rodriguez, R.; White, J.; Redman, R. Fungal endophytes: Diversity and functional roles. New Phytol. 2009, 182, 314–330. [Google Scholar]
  86. Sinanaj, B.; Hoysted, G.A.; Pressel, S.; Bidartondo, M.I.; Field, K.J. Critical research challenges facing Mucoromycotina ‘fine root endophytes’. New Phytol. 2021, 232, 1528–1534. [Google Scholar]
  87. Barka, E.A.; Vatsa, P.; Sanchez, L.; Gaveau-Vaillant, N.; Jacquard, C.; Klenk, H.-P.; Clément, C.; Ouhdouch, Y.; van Wezel, G.P. Taxonomy, physiology, and natural products of Actinobacteria. Microbiol. Mol. Biol. Rev. 2016, 80, 1–43. [Google Scholar] [CrossRef]
  88. Riahi, H.S.; Heidarieh, P.; Fatahi-Bafghi, M. Genus Pseudonocardia: What we know about its biological properties, abilities and current application in biotechnology. J. Appl. Microbiol. 2022, 132, 890–906. [Google Scholar] [CrossRef]
  89. Ananbeh, H.; Rodrigo, M.A.M.; Jelinkova, P.; Strmiska, V.; Splichal, Z.; Jehmlich, N.; Michalkova, H.; Stojanović, M.; Voberkova, S.; Adam, V. Soil protein as a potential antimicrobial agent against methicillin–resistant Staphylococcus aureus. Environ. Res. 2020, 188, 109320. [Google Scholar]
  90. Gerken, T.; Wiegner, T.N.; Economy, L.M. A Comparison of Soil Staphylococcus aureus and Fecal Indicator Bacteria Concentrations across Land Uses in a Hawaiian Watershed; 0047-2425; Wiley Online Library: Hoboken, NJ, USA, 2022. [Google Scholar]
  91. Lazcano, C.; Boyd, E.; Holmes, G.; Hewavitharana, S.; Pasulka, A.; Ivors, K. The rhizosphere microbiome plays a role in the resistance to soil-borne pathogens and nutrient uptake of strawberry cultivars under field conditions. Sci. Rep. 2021, 11, 1–17. [Google Scholar] [CrossRef]
  92. Chaiharn, M.; Pathom-Aree, W.; Sujada, N.; Lumyong, S. Characterization of phosphate solubilizing Streptomyces as a biofertilizer. Chiang Mai J. Sci 2018, 45, 701–716. [Google Scholar]
  93. Jog, R.; Pandya, M.; Nareshkumar, G.; Rajkumar, S. Mechanism of phosphate solubilization and antifungal activity of Streptomyces spp. isolated from wheat roots and rhizosphere and their application in improving plant growth. Microbiology 2014, 160, 778–788. [Google Scholar]
  94. Devi, R.; Kaur, T.; Kour, D.; Yadav, A.; Yadav, A.N.; Suman, A.; Ahluwalia, A.S.; Saxena, A.K. Minerals solubilizing and mobilizing microbiomes: A sustainable approaches for managing minerals deficiency in agricultural soil. J. Appl. Microbiol. 2022, 133, 1245–1272. [Google Scholar]
  95. Sathya, A.; Vijayabharathi, R.; Gopalakrishnan, S. Plant growth-promoting actinobacteria: A new strategy for enhancing sustainable production and protection of grain legumes. 3 Biotech 2017, 7, 1–10. [Google Scholar] [CrossRef] [Green Version]
  96. Tian, J.; Ge, F.; Zhang, D.; Deng, S.; Liu, X. Roles of Phosphate Solubilizing Microorganisms from Managing Soil Phosphorus Deficiency to Mediating Biogeochemical P Cycle. Biology 2021, 10, 158. [Google Scholar] [CrossRef]
  97. Divjot, K.; Rana, K.L.; Tanvir, K.; Yadav, N.; Yadav, A.N.; Kumar, M.; Kumar, V.; Dhaliwal, H.S.; Saxena, A.K. Biodiversity, current developments and potential biotechnological applications of phosphorus-solubilizing and-mobilizing microbes: A review. Pedosphere 2021, 31, 43–75. [Google Scholar]
  98. Hamdali, H.; Smirnov, A.; Esnault, C.; Ouhdouch, Y.; Virolle, M.J. Physiological studies and comparative analysis of rock phosphate solubilization abilities of Actinomycetales originating from Moroccan phosphate mines and of Streptomyces lividans. Appl. Soil Ecol. 2010, 44, 24–31. [Google Scholar]
  99. Hamdali, H.; Bouizgarne, B.; Hafidi, M.; Lebrihi, A.; Virolle, M.J.; Ouhdouch, Y. Screening for rock phosphate solubilizing Actinomycetes from Moroccan phosphate mines. Appl. Soil Ecol. 2008, 38, 12–19. [Google Scholar]
  100. Niu, B.; Paulson, J.N.; Zheng, X.; Kolter, R. Simplified and representative bacterial community of maize roots. Proc. Natl. Acad. Sci. USA 2017, 114, E2450–E2459. [Google Scholar] [CrossRef]
  101. Lidbury, I.; Borsetto, C.; Murphy, A.R.J.; Bottrill, A.; Jones, A.M.E.; Bending, G.D.; Hammond, J.P.; Chen, Y.; Wellington, E.M.H.; Scanlan, D.J. Niche-adaptation in plant-associated Bacteroidetes favours specialisation in organic phosphorus mineralisation. ISME J. 2021, 15, 1040–1055. [Google Scholar] [CrossRef]
  102. Cordell, D.; Drangert, J.-O.; White, S. The story of phosphorus: Global food security and food for thought. Glob. Environ. Chang. 2009, 19, 292–305. [Google Scholar]
  103. Tyrrell, T. The relative influences of nitrogen and phosphorus on oceanic primary production. Nature 1999, 400, 525–531. [Google Scholar] [CrossRef]
  104. Goll, D.S.; Brovkin, V.; Parida, B.; Reick, C.H.; Kattge, J.; Reich, P.B.; Van Bodegom, P.; Niinemets, Ü. Nutrient limitation reduces land carbon uptake in simulations with a model of combined carbon, nitrogen and phosphorus cycling. Biogeosciences 2012, 9, 3547–3569. [Google Scholar]
  105. White, P.J.; Hammond, J.P. Phosphorus nutrition of terrestrial plants. In The Ecophysiology of Plant-Phosphorus Interactions; Springer: New York, NY, USA, 2008; pp. 51–81. [Google Scholar]
  106. Schachtman, D.P.; Reid, R.J.; Ayling, S.M. Phosphorus Uptake by Plants: From Soil to Cell. Plant Physiol. 1998, 116, 447–453. [Google Scholar] [CrossRef]
  107. Thomas, F.; Hehemann, J.H.; Rebuffet, E.; Czjzek, M.; Michel, G. Environmental and gut bacteroidetes: The food connection. Front. Microbiol. 2011, 2, 93. [Google Scholar] [CrossRef]
  108. Bauer, M.; Kube, M.; Teeling, H.; Richter, M.; Lombardot, T.; Allers, E.; Würdemann, C.A.; Quast, C.; Kuhl, H.; Knaust, F. Whole genome analysis of the marine Bacteroidetes ‘Gramella forsetii’reveals adaptations to degradation of polymeric organic matter. Environ. Microbiol. 2006, 8, 2201–2213. [Google Scholar]
  109. Martens, E.C.; Koropatkin, N.M.; Smith, T.J.; Gordon, J.I. Complex glycan catabolism by the human gut microbiota: The Bacteroidetes Sus-like paradigm. J. Biol. Chem. 2009, 284, 24673–24677. [Google Scholar] [CrossRef]
  110. Castelle, C.J.; Banfield, J.F. Major new microbial groups expand diversity and alter our understanding of the tree of life. Cell 2018, 172, 1181–1197. [Google Scholar] [CrossRef]
  111. Starr, E.P.; Shi, S.; Blazewicz, S.J.; Probst, A.J.; Herman, D.J.; Firestone, M.K.; Banfield, J.F. Stable isotope informed genome-resolved metagenomics reveals that Saccharibacteria utilize microbially-processed plant-derived carbon. Microbiome 2018, 6, 1–12. [Google Scholar] [CrossRef]
  112. Xie, B.; Wang, J.; Nie, Y.; Chen, D.; Hu, B.; Wu, X.; Du, W. EpicPCR-directed cultivation of a Candidatus Saccharibacteria symbiont reveals a type IV pili-dependent epibiotic lifestyle. Proc. Natl. Acad. Sci. USA 2021, 119, e2215990119. [Google Scholar] [CrossRef]
  113. Tsuda, K.; Sato, M.; Glazebrook, J.; Cohen, J.D.; Katagiri, F. Interplay between MAMP-triggered and SA-mediated defense responses. Plant J. 2008, 53, 763–775. [Google Scholar] [CrossRef]
  114. Lu, H. Dissection of salicylic acid-mediated defense signaling networks. Plant Signal Behav. 2009, 4, 713–717. [Google Scholar] [CrossRef]
  115. Takahashi, Y.; Fujitani, H.; Hirono, Y.; Tago, K.; Wang, Y.; Hayatsu, M.; Tsuneda, S. Enrichment of Comammox and Nitrite-Oxidizing Nitrospira from Acidic Soils. Front. Microbiol. 2020, 11, 1737. [Google Scholar] [CrossRef]
  116. Tarre, S.; Green, M. High-rate nitrification at low pH in suspended-and attached-biomass reactors. Appl. Environ. Microbiol. 2004, 70, 6481–6487. [Google Scholar] [CrossRef]
  117. Cytryn, E.; Levkovitch, I.; Negreanu, Y.; Dowd, S.; Frenk, S.; Silber, A. Impact of short-term acidification on nitrification and nitrifying bacterial community dynamics in soilless cultivation media. Appl. Environ. Microbiol. 2012, 78, 6576–6582. [Google Scholar] [CrossRef]
  118. Hu, J.; Zhao, Y.; Yao, X.; Wang, J.; Zheng, P.; Xi, C.; Hu, B. Dominance of comammox Nitrospira in soil nitrification. Sci. Total Environ. 2021, 780, 146558. [Google Scholar] [CrossRef]
  119. Wrage, N.; Velthof, G.L.; Van Beusichem, M.L.; Oenema, O. Role of nitrifier denitrification in the production of nitrous oxide. Soil Biol. Biochem. 2001, 33, 1723–1732. [Google Scholar]
  120. Vitousek, P.M.; Aber, J.D.; Howarth, R.W.; Likens, G.E.; Matson, P.A.; Schindler, D.W.; Schlesinger, W.H.; Tilman, D.G. Human alteration of the global nitrogen cycle: Sources and consequences. Ecol. Appl. 1997, 7, 737–750. [Google Scholar]
  121. Koch, H.; van Kessel, M.A.; Lücker, S. Complete nitrification: Insights into the ecophysiology of comammox Nitrospira. Appl. Microbiol. Biotechnol. 2019, 103, 177–189. [Google Scholar] [CrossRef]
  122. Graham, E.B.; Knelman, J.E.; Schindlbacher, A.; Siciliano, S.; Breulmann, M.; Yannarell, A.; Beman, J.; Abell, G.; Philippot, L.; Prosser, J. Microbes as engines of ecosystem function: When does community structure enhance predictions of ecosystem processes? Front. Microbiol. 2016, 7, 214. [Google Scholar]
  123. Séneca, J.; Pjevac, P.; Canarini, A.; Herbold, C.W.; Zioutis, C.; Dietrich, M.; Simon, E.; Prommer, J.; Bahn, M.; Pötsch, E.M. Composition and activity of nitrifier communities in soil are unresponsive to elevated temperature and CO2, but strongly affected by drought. ISME J. 2020, 14, 3038–3053. [Google Scholar]
  124. Dieleman, W.I.; Vicca, S.; Dijkstra, F.A.; Hagedorn, F.; Hovenden, M.J.; Larsen, K.S.; Morgan, J.A.; Volder, A.; Beier, C.; Dukes, J.S.; et al. Simple additive effects are rare: A quantitative review of plant biomass and soil process responses to combined manipulations of CO2 and temperature. Glob. Chang. Biol. 2012, 18, 2681–2693. [Google Scholar] [CrossRef]
  125. Song, J.; Wan, S.; Piao, S.; Knapp, A.K.; Classen, A.T.; Vicca, S.; Ciais, P.; Hovenden, M.J.; Leuzinger, S.; Beier, C.; et al. A meta-analysis of 1119 manipulative experiments on terrestrial carbon-cycling responses to global change. Nat. Ecol. Evol. 2019, 3, 1309–1320. [Google Scholar] [CrossRef]
  126. Sghaier, H.; Hezbri, K.; Ghodhbane-Gtari, F.; Pujic, P.; Sen, A.; Daffonchio, D.; Boudabous, A.; Tisa, L.S.; Klenk, H.P.; Armengaud, J.; et al. Stone-dwelling actinobacteria Blastococcus saxobsidens, Modestobacter marinus and Geodermatophilus obscurus proteogenomes. ISME J. 2016, 10, 21–29. [Google Scholar] [CrossRef]
  127. Normand, P.; Daffonchio, D.; Gtari, M. The family geodermatophilaceae. In The Prokaryotes: Actinobacteria; Springer: Berlin/Heidelberg, Germay, 2014; pp. 361–379. [Google Scholar]
  128. Chukwuneme, C.F.; Babalola, O.O.; Kutu, F.R.; Ojuederie, O.B. Characterization of actinomycetes isolates for plant growth promoting traits and their effects on drought tolerance in maize. J. Plant Interact. 2020, 15, 93–105. [Google Scholar]
  129. Denner, E.B.M.; Kolari, M.; Hoornstra, D.; Tsitko, I.; Kampfer, P.; Busse, H.J.; Salkinoja-Salonen, M. Rubellimicrobium thermophilum gen. nov., sp. nov., a red-pigmented, moderately thermophilic bacterium isolated from coloured slime deposits in paper machines. Int. J. Syst. Evol. Microbiol. 2006, 56, 1355–1362. [Google Scholar] [CrossRef]
  130. Dastager, S.G.; Lee, J.C.; Ju, Y.J.; Park, D.J.; Kim, C.J. Rubellimicrobium mesophilum sp. nov., a mesophilic, pigmented bacterium isolated from soil. Int. J. Syst. Evol. Microbiol. 2008, 58, 1797–1800. [Google Scholar] [CrossRef]
  131. Wang, R.; Zhang, H.; Sun, L.; Qi, G.; Chen, S.; Zhao, X. Microbial community composition is related to soil biological and chemical properties and bacterial wilt outbreak. Sci. Rep. 2017, 7, 343. [Google Scholar] [CrossRef]
  132. Msaddak, A.; Rejili, M.; Duran, D.; Rey, L.; Imperial, J.; Palacios, J.M.; Ruiz-Argueso, T.; Mars, M. Members of Microvirga and Bradyrhizobium genera are native endosymbiotic bacteria nodulating Lupinus luteus in Northern Tunisian soils. FEMS Microbiol. Ecol. 2017, 93, fix068. [Google Scholar] [CrossRef]
  133. Zhang, Y.Q.; Chen, J.; Liu, H.Y.; Zhang, Y.Q.; Li, W.J.; Yu, L.Y. Geodermatophilus ruber sp. nov., isolated from rhizosphere soil of a medicinal plant. Int. J. Syst. Evol. Microbiol. 2011, 61, 190–193. [Google Scholar] [CrossRef]
  134. Camarena-Pozos, D.A.; Flores-Núñez, V.M.; López, M.G.; López-Bucio, J.; Partida-Martínez, L.P. Smells from the desert: M icrobial volatiles that affect plant growth and development of native and non-native plant species. Plant Cell Environ. 2019, 42, 1368–1380. [Google Scholar]
  135. Flores-Núñez, V.M.; Fonseca-García, C.; Desgarennes, D.; Eloe-Fadrosh, E.; Woyke, T.; Partida-Martínez, L.P. Functional signatures of the epiphytic prokaryotic microbiome of agaves and cacti. Front. Microbiol. 2020, 10, 3044. [Google Scholar]
  136. Zhao, Y.; Fu, W.; Hu, C.; Chen, G.; Xiao, Z.; Chen, Y.; Wang, Z.; Cheng, H. Variation of rhizosphere microbial community in continuous mono-maize seed production. Sci. Rep. 2021, 11, 1544. [Google Scholar] [CrossRef]
  137. Yoon, J.-H.; Park, Y. The genus Nocardioides. Prokaryotes 2006, 3, 1099–1113. [Google Scholar]
  138. Kim, H.; Nishiyama, M.; Kunito, T.; Senoo, K.; Kawahara, K.; Murakami, K.; Oyaizu, H. High population of Sphingomonas species on plant surface. J. Appl. Microbiol. 1998, 85, 731–736. [Google Scholar] [CrossRef]
  139. Monciardini, P.; Cavaletti, L.; Schumann, P.; Rohde, M.; Donadio, S. Conexibacter woesei gen. nov., sp. nov., a novel representative of a deep evolutionary line of descent within the class Actinobacteria. Int. J. Syst. Evol. Microbiol. 2003, 53, 569–576. [Google Scholar] [CrossRef]
  140. Pold, G.; Billings, A.F.; Blanchard, J.L.; Burkhardt, D.B.; Frey, S.D.; Melillo, J.M.; Schnabel, J.; van Diepen, L.T.; DeAngelis, K.M. Long-Term Warming Alters Carbohydrate Degradation Potential in Temperate Forest Soils. Appl. Environ. Microbiol. 2016, 82, 6518–6530. [Google Scholar] [CrossRef]
  141. Naylor, D.; DeGraaf, S.; Purdom, E.; Coleman-Derr, D. Drought and host selection influence bacterial community dynamics in the grass root microbiome. ISME J. 2017, 11, 2691–2704. [Google Scholar] [CrossRef] [Green Version]
  142. Berg, G.; Grube, M.; Schloter, M.; Smalla, K. Unraveling the plant microbiome: Looking back and future perspectives. Front. Microbiol. 2014, 5, 148. [Google Scholar] [CrossRef]
  143. Berg, G. Plant–microbe interactions promoting plant growth and health: Perspectives for controlled use of microorganisms in agriculture. Appl. Microbiol. Biotechnol. 2009, 84, 11–18. [Google Scholar] [CrossRef]
  144. Buscardo, E.; Souza, R.C.; Meir, P.; Geml, J.; Schmidt, S.K.; Da Costa, A.C.; Nagy, L. Effects of natural and experimental drought on soil fungi and biogeochemistry in an Amazon rain forest. Commun. Earth Environ. 2021, 2, 55. [Google Scholar]
  145. Yang, N.; Nesme, J.; Roder, H.L.; Li, X.; Zuo, Z.; Petersen, M.; Burmolle, M.; Sorensen, S.J. Emergent bacterial community properties induce enhanced drought tolerance in Arabidopsis. NPJ Biofilms Microbiomes 2021, 7, 82. [Google Scholar] [CrossRef]
  146. Yandigeri, M.S.; Meena, K.K.; Singh, D.; Malviya, N.; Singh, D.P.; Solanki, M.K.; Yadav, A.K.; Arora, D.K. Drought-tolerant endophytic actinobacteria promote growth of wheat (Triticum aestivum) under water stress conditions. Plant Growth Regul. 2012, 68, 411–420. [Google Scholar]
  147. Lasudee, K.; Tokuyama, S.; Lumyong, S.; Pathom-Aree, W. Actinobacteria associated with arbuscular mycorrhizal Funneliformis mosseae spores, taxonomic characterization and their beneficial traits to plants: Evidence obtained from mung bean (Vigna radiata) and Thai jasmine rice (Oryza sativa). Front. Microbiol. 2018, 9, 1247. [Google Scholar]
  148. Cha-Um, S.; Yooyongwech, S.; Supaibulwatana, K. Water deficit stress in the reproductive stage of four indica rice (Oryza sativa L.) genotypes. Pak. J. Bot. 2010, 42, 3387–3398. [Google Scholar]
  149. Pandey, V.; Shukla, A. Acclimation and tolerance strategies of rice under drought stress. Rice Sci. 2015, 22, 147–161. [Google Scholar]
  150. Kaushal, M.; Wani, S.P. Plant-growth-promoting rhizobacteria: Drought stress alleviators to ameliorate crop production in drylands. Ann. Microbiol. 2016, 66, 35–42. [Google Scholar]
  151. Forni, C.; Duca, D.; Glick, B.R. Mechanisms of plant response to salt and drought stress and their alteration by rhizobacteria. Plant Soil 2017, 410, 335–356. [Google Scholar] [CrossRef]
  152. Vurukonda, S.S.; Vardharajula, S.; Shrivastava, M.; Sk, Z.A. Enhancement of drought stress tolerance in crops by plant growth promoting rhizobacteria. Microbiol. Res. 2016, 184, 13–24. [Google Scholar] [CrossRef]
  153. Dimkpa, C.; Weinand, T.; Asch, F. Plant–rhizobacteria interactions alleviate abiotic stress conditions. Plant Cell Environ. 2009, 32, 1682–1694. [Google Scholar] [CrossRef]
  154. Yang, J.; Kloepper, J.W.; Ryu, C.M. Rhizosphere bacteria help plants tolerate abiotic stress. Trends Plant Sci. 2009, 14, 1–4. [Google Scholar] [CrossRef]
  155. Lugtenberg, B.; Kamilova, F. Plant-growth-promoting rhizobacteria. Annu. Rev. Microbiol. 2009, 63, 541–556. [Google Scholar] [CrossRef] [Green Version]
Figure 1. Venn diagram referring to number of non-redundant genes of microbiomes across soil type (rhizosphere and bulk) of Moringa oleifera after 0 (group A [grey circle]), 24 (group B [red circle]) and 48 h (group C [green circle]) of watering. Cd = Cloud, Sh = Shell, Co = Core.
Sustainability 15 02745 g001
Figure 2. Principle component analysis (PCA) estimated based on the number of non-redundant genes at phylum (a), genus (b) and species (c) levels of microbiomes collected from bulk (B) and rhizosphere (R) soils of Moringa oleifera after 0 (group A or S1 and R1, respectively), 24 (group B or S2 and R2, respectively) and 48 h (group C or S3 and R3, respectively) of watering. Orange circles = bulk soil microbiomes, blue circles = rhizosphere microbiomes, black circles = group A, red circles = group B, green circles = group C.
Sustainability 15 02745 g002
Figure 3. Non-redundant gene number of the four kingdoms at phylum, genus and species levels across soil microbiomes (rhizosphere and bulk) and time after watering (e.g., 0, 24 and 48 h) of Moringa oleifera. Records of gene number were calculated from those in Tables S3–S6, respectively.
Sustainability 15 02745 g003
Figure 4. Non-redundant gene number and abundance at kingdom, phylum, genus and species levels across soil microbiomes (rhizosphere and bulk) and time after watering (e.g., 0, 24 and 48 h) of Moringa oleifera. More details on gene number and abundance are available in Tables S3 and S7, respectively. Gene number and abundance are shown in Tables S3 and S7, respectively.
Sustainability 15 02745 g004
Figure 5. Abundance and relative abundance of the top non-redundant genes in terms of abundance (≥1000) at phylum level among (R1–R3 and S1–S3) and across microbiome samples of rhizosphere (R) and bulk (S) soils of Moringa oleifera after 0 (group A), 24 (group B) and 48 h (group C) of watering. Eu = eukaryote, Arch = Archaea. Other phyla are bacterial. More details of abundance and relative abundance are available in Tables S8 and S12, respectively.
Sustainability 15 02745 g005
Figure 6. Abundance and relative abundance of the top non-redundant genes in terms of abundance (≥20,000) at genus level among (R1–R3 and S1–S3) and across microbiome samples of rhizosphere (R) and bulk (S) soils of Moringa oleifera after 0 (group A), 24 (group B) and 48 h (group C) of watering. More details of different four taxonomic ranks are available in Table S4, respectively. More details of abundance and relative abundance are available in Tables S9 and S13, respectively.
Sustainability 15 02745 g006
Figure 7. Abundance and relative abundance of the top non-redundant genes in terms of abundance (≥15,000) at species level among (R1–R3 and S1–S3) and across microbiome samples of rhizosphere (R) and bulk (S) soils of Moringa oleifera after 0 (group A), 24 (group B) and 48 h (group C) of watering. More details of abundance and relative abundance are available in Tables S10 and S14, respectively.
Sustainability 15 02745 g007
Table 1. Statistics of raw sequencing data (350 bp average read length) of microbiome samples collected from rhizosphere (R) and bulk (S) soils of Moringa oleifera after 0 (S1 and R1 [or group A]), 24 (S2 and R2 [or group B]) and 48 h (S3 and R3 [or group C]) of watering.
Sample IDGroupRaw Data
(Gb) 1
Raw Reads
(no.) 2
Ns
(%) 3
Clean Data (Gb) 4Effective
(%) 5
S1A6.0240,123,3520.346.0099.73
S2B8.0353,530,4500.348.0099.69
S3C8.4756,437,5540.28.4599.77
R1A7.0346,870,6640.117.0199.75
R2B8.1454,268,0140.218.1299.71
R3C7.4849,871,2240.457.4699.71
1 Raw data: Data derived from deep sequencing in Gb. 2 Raw reads (no.): Number of raw reads generated from deep sequencing. 3 Ns (%): Percentage of unread nucleotides. 4 Clean data: Filtered and valid data in Gb. 5 Effective (%): Percentage of clean data among raw data.
Table 2. Statistics of assembled scaftigs of microbiomes of rhizosphere (R) and bulk soils of Moringa oleifera after 0 (S1 and R1), 24 (S2 and R2) and 48 h (S3 and R3) of watering referring to groups A, B and C, respectively.
Sample IDGroupTotal Len. (bp) 1No. Scaftigs 2Average Len. (bp) 3Max Len. (bp) 4
S1A387,720,527413,461937.74140,598
S2B298,717,745346,445862.24118,379
S3C399,538,190487,285819.93117,898
R1A421,596,529450,710935.4167,510
R2B280,594,281334,491838.8739,284
R3C407,398,380429,698948.158,099
NOVO_MIX 7 2,169,967,6832,553,156849.9220,354
1 Total len.: Total length of assembled scaftigs in bp. 2 No. scaftigs: Total number of assembled scaftigs. 3 Average len.: Average length of scaftigs in bp. 4 Max Len.: Longest assembled scaftigs in bp. 7 NOVO_MIX: Mixed assembly results.
Table 3. Statistics of predicted genes (ORFs) of microbiome samples collected from rhizosphere (R) and bulk (S) soils of Moringa oleifera after 0 (S1 and R1 [or group A]), 24 (S2 and R2 [or group B]) and 48 h (S3 and R3 [or group C]) of watering.
Sample IDGroupORFs No. 1Integrity:None 2Integrity:Start 3Integrity:End 4Integrity:All 5Total Len. (Mb) 6Average Len. (bp) 7
S1A367,79321,809106,90973,846165,229123.87336.81
S2B338,99725,804100,89377,249135,051123.67364.8
S3C534,23455,782162,132144,520171,800207.75388.88
R1A709,89283,195212,224216,176198,297345.42486.57
R2B499,73565,343149,218162,133123,041227.86455.97
R3C688,20781,551201,411208,372196,873336.92489.57
NOVO_MIX 83,486,643399,7521,101,8161,073,746911,3291508.40432.62
1 ORFs No.: Number of non-redundant genes in the gene catalogue. 2 Integrity:none: No. and percentage of genes that have neither a start codon nor end codon. 3 Integrity:start: No. and percentage of annotated genes that contain the start codon only. 4 Integrity:end: No. and percentage of annotated genes that contain the end codon only. 5 Integrity:all: No. and percentage of completed genes which have both start and end codons. 6 Total len.: Total length of genes annotated from the gene catalogue in Mb. 7 Average len.: the average length of the sequenced genes within a sample in bp. 8 NOVO_MIX: Mixed assembly result.
Table 4. Description of abundant (AB) and relatively abundant (RAB) taxa at the three taxonomic levels in terms of soil type (e.g., bulk and rhizosphere) and time after watering (0h [group A], 24 h [group B] and 48 h [group C]) in microbiomes of Moringa oleifera. Color-filled boxes (e.g., red, green and gray) refer to highly abundant and relatively highly abundant taxa, while no filled boxes refer to less abundant and relatively abundant taxa.
TaxonSoil TypeTime after Watering
BulkRhizosphereA (0 h)B (24 h)C (48 h)
ABRABABRABABRABABRABABRAB
Phylum
Firmicutes
Verrucomicrobia
Eu:Ascomycota
Eu:Mucoromycota
Actinobacteria
Bacteroidetes
Candidatus Saccharibacteria
Nitrospirae
Acidobacteria
Verrucomicrobia
Gemmatimonadetes
Genus
Pseudonocardia
Staphylococcus
Blastococcus
Microvirga
Geodermatophilus
Arthrobacter
Solirubrobacter
Mycobacterium
Belnapia
Marmoricola
Streptomyces
Bacillus
Ramlibacter
Gemmatirosa
Microbacterium
Rubellimicrobium
Sphingomonas
Species
Staphylococcus aureus
Pseudonocardia sp. CNS-004
Pseudonocardia sp. MH-G8
Bacillus thuringiensis
Sphingomonas sp. URHD0057
Blastococcus sp. DSM 46786
Solirubrobacter sp. URHD0082
Geodermatophilus sabuli
Microvirga sp. BSC39
Microvirga massiliensis
Arthrobacter crystallopoietes
Rubellimicrobium mesophilum
Conexibacter woesei
Sphingomonas jaspsi
Gemmatirosa kalamazoonesis
Disclaimer/Publisher’s Note: The statements, opinions and data contained in all publications are solely those of the individual author(s) and contributor(s) and not of MDPI and/or the editor(s). MDPI and/or the editor(s) disclaim responsibility for any injury to people or property resulting from any ideas, methods, instructions or products referred to in the content.

