Article

Analysis of the Effect of Providing Pedestrian Crossing Information at the Blind Spots of Intersections on Vehicle Traffic

Department of Highway & Transportation Research, Korea Institute of Civil Engineering and Building Technology, Goyang-Si 10223, Republic of Korea
*
Author to whom correspondence should be addressed.
Sustainability 2023, 15(3), 2718; https://doi.org/10.3390/su15032718
Submission received: 20 October 2022 / Revised: 16 January 2023 / Accepted: 31 January 2023 / Published: 2 February 2023

Abstract

:
In this study, we conducted an analysis of the pedestrian safety system for crosswalks introduced in Korea to improve sustainable traffic safety. The pedestrian crossing information provision system provides information to a driver in advance when a pedestrian is detected in the driver’s blind spot when the latter is turning right at an intersection. The location analyzed was the three-way intersection in front of Yungheung Elementary School in Jeollabuk-do, and vehicle speed information for 150–160 min before and after system installation was collected. As a result of comparing and analyzing the change in the compliance rate of the spot speed and the speed limit, it was found that there was no statistical difference in the change in the spot speed, but in the absence of pedestrians, the speed increased slightly compared with that before installation. The change in the speed limit compliance rate was found to improve when pedestrian crossing information was provided. In addition, a chi-square test found that there was a difference in the speed limit compliance rate before and after system installation where pedestrians existed (when information was provided), while there was no difference in the situation where pedestrians did not exist (when information was not provided).

1. Introduction

Pedestrians are the most vulnerable group in road traffic accidents, and collisions between vehicles and pedestrians are recognized as a serious problem in numerous countries. According to the World Health Organization, the pedestrian fatality rate accounts for ~23% of the entire fatality rate in road transportation [1]. In Korea, as a result of continuous efforts to reduce pedestrian fatalities, the number of such fatalities decreased by an average of 6.7% over the past 10 years (2011–2020) [2]. However, compared with OECD countries, in terms of the number of pedestrian deaths in 2018, Korea ranked 30th out of 31 countries [3], and there are still more than 1000 deaths occurring a year [2].
In general, human factors, vehicle factors, and road/environmental factors influence the occurrence of traffic accidents [4]. The risk of accidents due to vehicle factors and road/environmental factors can be reduced by developing vehicle technology and through advances in traffic operation technology [5]. However, human behavior, which is a human factor, has limitations, in that the speed of change is slow and difficult, unlike technological development; thus, most traffic accidents are related to the behavior of pedestrians and drivers [5]. The major risk behaviors that have been observed recently include the use of mobile phones or related devices while on the move, and many studies suggest that these behaviors increase the occurrence or risk of accidents [6,7,8,9]. In Japan, about 35% of fatal pedestrian accidents are caused by driver distraction [10], constituting the main cause of vehicle and pedestrian collisions [11].
Among pedestrian traffic accidents in Korea, accidents that occurred while crossing the road accounted for 52.5% of the total in 2020, which is a larger proportion than other types [2]. In particular, the fatal accident of a child pedestrian on a crosswalk by a right-turning vehicle in 2021 became a significant social issue [12,13]. From 2018 to 2020, the percentage of pedestrian casualties caused by right-turning vehicles comprised 9.9% of all traffic accidents, and it was found that the drivers could not recognize pedestrians due to the blind spot when turning right [14]. In other words, to secure the safety of crossing pedestrians, it is necessary for both drivers and crossing pedestrians to pay close attention to the risk of a collision, with drivers’ attentive behavior emphasized for the safety of pedestrians.
In the past, to reduce road traffic accidents, a method to forcibly reduce the speed of a vehicle by installing a physical facility on the road was applied based on a study on the severity and risk of pedestrian accidents according to vehicle speed [15,16,17,18,19]. However, with the development of science and technology, voluntary speed reduction is induced as a supplement. Representative examples include lighting facilities around crosswalks and curbs using object-recognition technology [20,21,22,23] and flashing safety signs such as VMS (variable message sign) information [22,24,25,26,27,28,29,30,31]. In addition, a number of studies analyzed the effect of speed reduction through empirical studies to improve traffic safety [20,21,22,23,24,25,26,27,28,29,30,31].
This study analyzed the effect of a pedestrian-crossing information notification system provided in the blind spot of the right turn in a children’s protection zone (School Zone), which is a low-speed section of Jeollabuk-do. In the process of installing the system, a briefing session was conducted for local residents. This study is meaningful because it does not simply compare the situations before and after system installation but examines changes in driver behavior depending on whether information is provided in a situation where the driver is fully aware of the system. As for the indicators of the analysis, as presented in previous studies, an analysis was performed on speed changes in vehicles, and drivers further reviewed their compliance with the speed limit, one of the main causes of traffic accidents [32].

2. Literature Review

Considering previous empirical studies that applied detection technology, Hakkert et al. (2002) [20] installed sensors on both sides of the crosswalk to detect pedestrians in the crosswalk waiting section and provide information to vehicles through floor warning lights. As a result, vehicle speed decreased by 2 to 5 km/h. Furthermore, it was suggested that the rate of yielding the right-of-way to pedestrians increased. Costa et al. (2020) [21] evaluated an integrated lighting warning system in non-signal crosswalks at nighttime and compared and analyzed the effects under seven different conditions. They found that the yield rate of vehicles improved the most when drivers were provided with information that enabled all standard road lighting plus enhanced dedicated lighting, flashing beacons, and curb LED lighting. Hong et al. (2021) [22] analyzed the effect of an information-providing system using VMS and floor warning lights through vehicle and pedestrian detection information collected from radar sensors and thermal imaging cameras. As a result of analyzing the day and nighttime zones separately for a children’s protection zone and an elderly protection zone, it was found that the approaching speed of vehicles at the crosswalk decreased. Jin and Lee (2016) [23] performed an analysis of the effects of a cross-safety support system that provides information to pedestrians and drivers using VMS, LED lights in crosswalks, text-display devices, and voice devices. By analyzing vehicle driving speed and pedestrian behavior during the day and nighttime for the crosswalk in front of an elementary school, they found that the vehicle speed decreased, and, in terms of pedestrian behavior, the frequency of looking left and right before and during crossing also increased by about 1.63–2.25 times depending on the time of the day. Hoye and Laureshyn (2019) [29] analyzed the effect of a pedestrian crossing warning system with an automatic pedestrian-detection function and showed that the yielding behavior of drivers improved without negatively affecting the behavior of pedestrians.
Regarding studies related to rectangular rapid flashing beacons (RRFBs), Van Houten et al. (2010) [30] compared and analyzed the effects of installing additional beacons in a median zone (or refuge island) and the side of the road to improve the visibility of RRFBs. They showed that the yielding behavior of the driver was effectively improved due to RRFBs, and when RRFBs were additionally installed in the median zone (or refuge island), the efficiency was further increased. In addition, this increase in the driver yield rate continued for two years without a reduction effect. Similar studies [24,25,26,27,28,31] on RRFBs have been conducted, and all studies suggest that the yield rate of drivers improved. In particular, Shurbutt and Van Houten (2008) [31] reported a reduction in collisions between drivers and pedestrians and the proportion of pedestrians trapped in crosswalks in the middle of the road through light-emitting diode (LED) blinkers with irregular flash patterns. Ross et al. (2011) [24] recommended the installation of an RRFB in a speed section of 35 mph or more, while Fitzpatrick et al. (2015) [27] analyzed the difference between RRFBs and circular rapid-flashing beacons (CRFBs) to show that there was no difference in the effect of the beacon type. Fitzpatrick and Park (2021) [28] found that RRFBs are more effective at night, whereas LED-embedded (LED-Em) crossing signs are more effective during the day. Pedestrian hybrid beacons (PHBs), however, suggested that there was no difference in driver yield between day and night.

3. Pedestrian Crossing Information Notification System

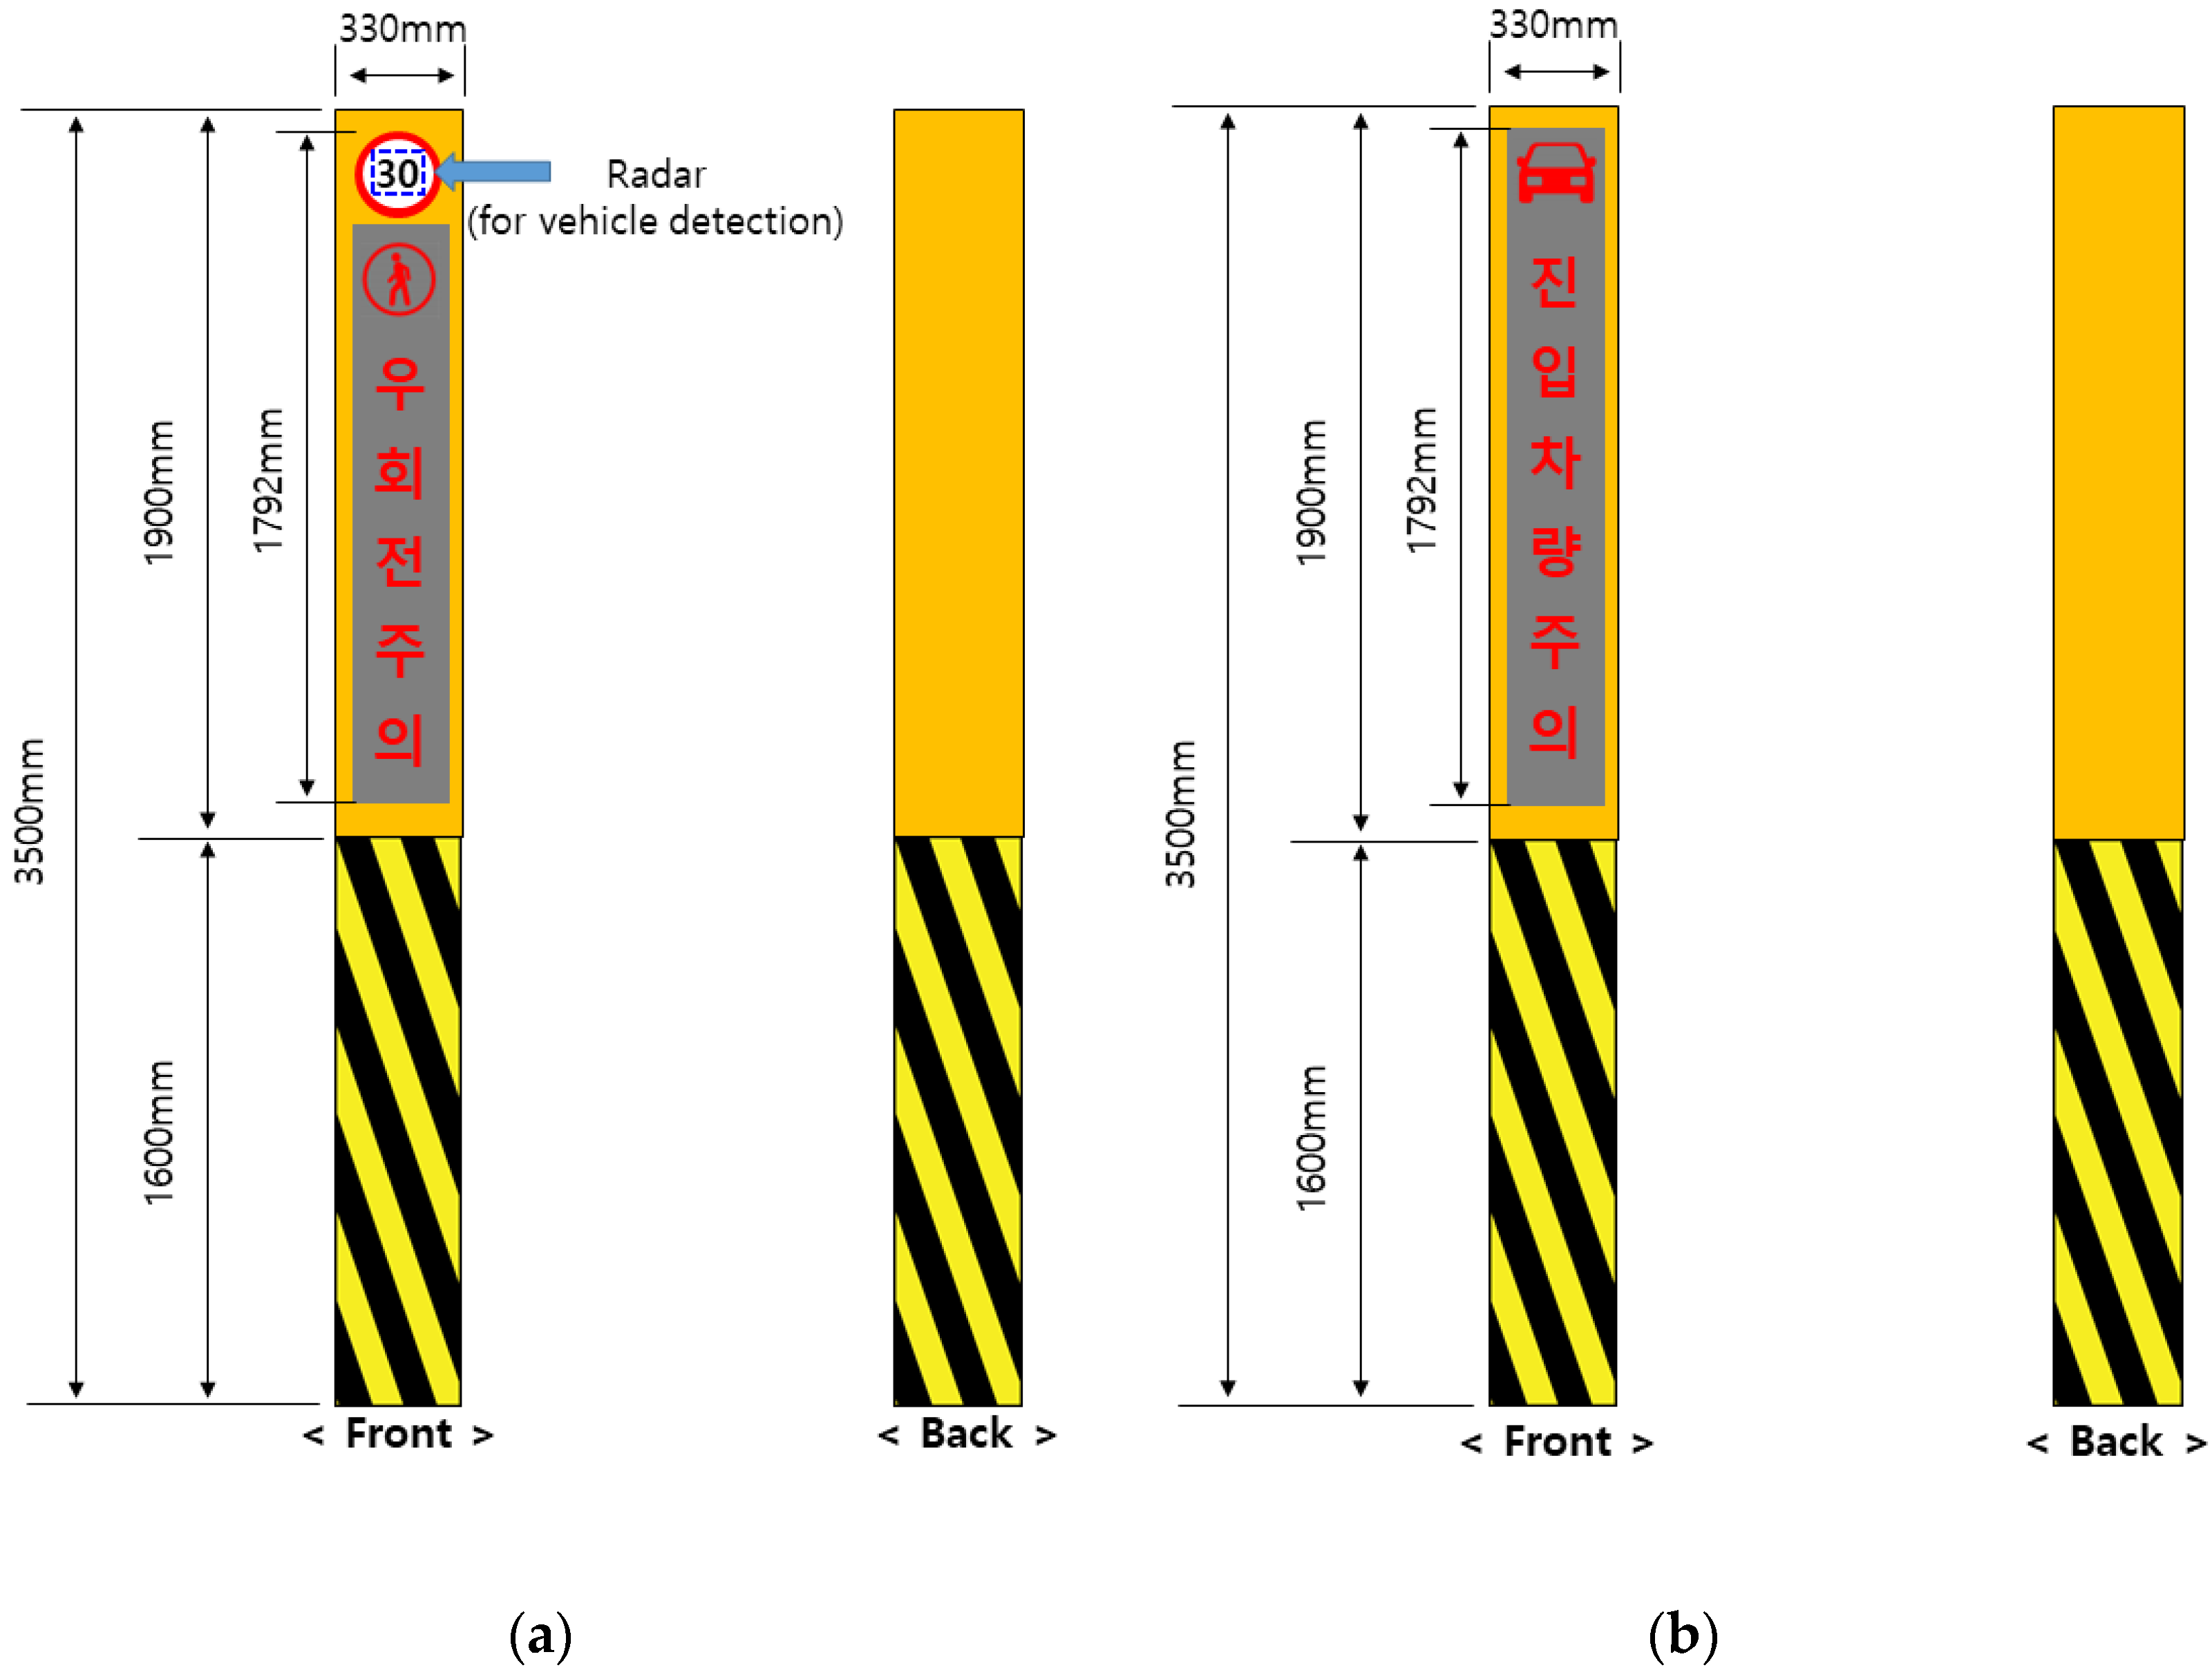
3.1. System Configuration and Notification Service

As shown in Figure 1a, the crossing information notification system of this study consists of a radar sensor-based information collection device that can identify approaching vehicle information and image data (thermal imaging camera and RGB camera; Figure 1b) that provide information about pedestrians crossing in order to collect object movement information. These two pieces of information are immediately processed by the control unit, applied with FPGA-based edge computing technology (Figure 1c) in the field (Figure 1d), and the processed information provides vehicle access information to pedestrians and pedestrian crossing information to drivers.
As for the information provision method, a character-type display was used, as shown in Figure 2. A sensor for vehicle detection (see Figure 1a) is mounted on a display provided to the driver and designed to express a “RIGHT TURN CAUTION” phrase to the driver when a pedestrian is present in a blind spot and the vehicle is detected. The pedestrian detection sensor (see Figure 1b) uses RGB and thermal imaging cameras and is mounted on a display that provides access information about the vehicle to pedestrians. The information provided to pedestrians expresses the phrase “CAUTION OF VEHICLE ENTRYING”. The dimensions of the driver’s display and the pedestrian’s display are as in Figure 2.
The system was installed as a three-way intersection in front of Yungheung Elementary School, located in Jeollabuk-do. The point is where the children’s protection area (with a speed limit of 30 km/h) of the two-lane road (one lane each way) is designated. The driver’s blind spot refers to the situation where a vehicle traveling from ⓐ to ⓑ turns right to ⓒ, as shown in Figure 3a, and it is difficult to identify pedestrians in the target crosswalk due to obstacles and trees. Therefore, as shown in Figure 3b, a display that provides pedestrian information to the driver was installed at a point 25 m from the intersection. Figure 3c is a display that provides vehicle access information to pedestrians moving in the “①→②” direction. While pedestrians moving in the “②→①” direction can identify vehicles approaching the intersection, pedestrians moving in the opposite direction (①→②) are at a disadvantage because it is difficult to identify vehicles approaching from behind.

3.2. Data Collection

In the case of vehicle point speed, radar equipment was used at the point where the driver display was installed, as shown in Figure 4, and a video was taken at a point near the crosswalk to collect pedestrian information. In addition, the target point is a road frequently used by villagers (apartment and commercial residents), and in this study, a system briefing session was conducted for local residents through the operation of Living Lab. Data were collected after a system adaptation time of about 4 weeks following system installation by referring to a previous study [33].
Data collection for vehicle speed detection was carried out using radar equipment (see Figure 4a) from a nationally accredited certification authority. The equipment collects information on the point speed (detection time and occupancy time) of individual vehicles passing through the observation point, and the camera attached to the radar equipment stores vehicle image information. Additional information on the length of the vehicle was collected, and the collected data were automatically stored as a “csv” file. Information on whether the vehicle was rotated and whether there was a pedestrian was collected by installing a video camera (see Figure 4b) near the target crosswalk.
The collected data were matched between vehicles passing through the radar equipment and vehicles collected from video cameras to distinguish right-turning and straight-ahead-moving vehicles, and speed information was classified according to the presence or absence of pedestrians in the crosswalk.
As shown in Table 1, the data collection results of the information provision system numbered 178 before installation and 166 after installation; thus, a total of 344 datapoints were secured.

4. Analysis Results

4.1. Change in Point Speed

The system of this study provides “right turn caution” information, as shown in Figure 3b, but straight-ahead-moving and right-turning vehicles are mixed in the first lane of the road. In addition, it is not possible for the vehicle detection sensor to distinguish whether the vehicle is a right-turning vehicle or a straight-ahead-moving vehicle. That is, when there is a pedestrian in the target crosswalk, information is provided to all vehicles (straight-ahead-moving or right-turning vehicles) approaching the intersection. Therefore, prior to analyzing the effect before and after system installation, we determined whether there was a difference in the speed between straight-ahead-moving and right-turning vehicles.
Based on an examination of the difference in average point speed according to the rotation of the vehicle, before installation, there was a deviation of about 1.52 km/h with 22.38 km/h for straight-ahead-moving vehicles and 20.86 km/h for right-turning vehicles. After installation, the deviation was about 0.26 km/h with 21.82 km/h for straight-ahead-moving vehicles and 21.55 km/h for right-turning vehicles. Table 2 shows the results of descriptive statistical analysis of vehicles going straight ahead and turning right before and after installation, and Figure 5 shows the distribution according to the range of point speeds for vehicles driving straight and turning right before and after installation.
As a result of performing a t-test to examine the statistical significance, we found that the results for vehicles going straight ahead and vehicles turning right were not statistically different before installation, and the same results were drawn after installation. Table 3 shows the t-test results on the average point speed deviation and speed between right-turning vehicles and straight-ahead-moving vehicles before/after system installation. The speed difference was not large between the straight-ahead-moving vehicles and the right-turning vehicles approaching the intersection from the two-lane road (one lane each way). Therefore, in this study, a comparative analysis was performed before and after system installation, regardless of whether the vehicle was turning.
Considering the average point speed before and after system installation for all surveyed vehicles, we found that the speed was ~22.01 km/h (178 units) before installation and 21.75 km/h (166 units) after installation. For the average point speed change according to the presence or absence of pedestrians, if a pedestrian was present in the crosswalk, the speed was ~22.11 km/h (128 units) before installation and 21.28 km/h (88 units) after installation. In the case of no pedestrians, it was ~21.75 km/h (50 units) before installation and 22.28 km/h (78 units) after installation.
As a result of the t-test for the average point speed, as shown in Table 4, both the presence and absence of pedestrians were considered insignificant. However, when there was a pedestrian in the crosswalk, the average point speed of the vehicle was slightly reduced (−0.83 km/h) compared with that before installation, whereas, in cases where there were no pedestrians, the average point speed slightly increased (0.54 km/h).

4.2. Change in Speed Limit Compliance Rate

Based on analyzing the change in the speed limit compliance rate for all collected vehicles, it was found that it increased by 2.52% to 93.26% (166 units/178 units) before system installation and 95.78% (159 units/166 units) after installation. As a result of this analysis, it can be seen that there are vehicles that do not comply with the speed limit even if the system is installed.
However, it was found that different results were derived by comparing the change in the speed limit compliance rate between situations where pedestrians exist in the target crosswalk and situations where pedestrians do not exist and do not provide information.
First, when pedestrians exist (information provision situation), it was found that the speed limit compliance rate increased from 92.97% (119 units/128 units) before installation to 100.00% (88 units/88 units) after installation. On the other hand, in the absence of pedestrians (information not provided), the speed limit compliance rate decreased by 2.97% from 94.00% (47 units/50 units) before installation to 91.03% (71 units/78 units) after installation (Table 5).
Figure 6 and Figure 7 show the distribution of the point speeds of individual vehicles before/after system installation and according to whether pedestrians were crossing.
Figure 6 shows that the driver’s speed limit compliance rate is improved as the pedestrian crossing information is provided after the system is installed.
However, as shown in Figure 7, when there are no pedestrians in the crosswalk, the speed limit compliance rate of vehicles reduced.
In addition, the results of the chi-square test were used to determine the correlation with the information provision effect; the significance probability was analyzed to be significant at the p < 0.05 level when there was a pedestrian, as shown in Table 6, while the change in speed limit compliance rate in the absence of pedestrians was found to be insignificant.

5. Conclusions

In this study, we conducted an analysis of a pedestrian information provision system introduced to improve sustainable traffic safety. The system provides pedestrian information in advance to a driver entering an intersection when a pedestrian crosses a crosswalk in the blind spot of a right turn. For the analysis data, the speed and image information of individual vehicles was collected using radar equipment, and the image information of pedestrians and vehicles at crosswalks was collected using video equipment.
For the average point speed of the vehicle, the statistical test (t-test) results showed no significant results regardless of the presence or absence of pedestrians. However, when pedestrians were present (when information was provided), the average point speed of the vehicles showed a slight decrease compared with that before system installation, and when there were no pedestrians (when information was not provided), the average point speed increased slightly. The speed limit compliance rate of vehicles increased compared with that before installation when pedestrians were crossing, whereas, when there were no pedestrians (after installation, the system does not provide information), the speed limit compliance rate of vehicles decreased compared with that before installation. In addition, as a result of the chi-square test, it was found that, in situations where pedestrians exist (when information is provided), there is a difference in the speed limit compliance rate before and after system installation. However, it was found that there was no difference in situations where pedestrians did not exist (when information was not provided).
As shown in the analysis results of this study, even if a pedestrian information provision system is installed in a low-speed section, such as a child protection zone (school zone), the deceleration effect of the vehicle is insignificant. However, by providing pedestrian crossing information, the driver can see that their driving behavior should change to comply with the speed limit (improving the speed limit compliance rate).
However, as our study was conducted on a single point, experiments in various similar sections (low-speed sections) are required in the future. In particular, in Korea, in addition to child protection zones (school zones), there are elderly protection zones (silver zones) and village resident protection zones, depending on the characteristics of the pedestrians. Therefore, it seems necessary to conduct research on these sections.
In this regard, we have two points of discussion.
(i) In terms of traffic safety, the change in vehicle speed is a major indicator, but is it an appropriate evaluation indicator even in a low-speed section?
The speed of the vehicle is highly correlated with the degree of the accident (fatal traffic accident) in the event of a traffic accident. The effect of reducing the speed of a vehicle is an important indicator because it can induce a relatively low-level accident in the event of a sudden stop or an accident caused by a vehicle in a dangerous situation. However, it is necessary to discuss whether it is appropriate to expect this effect even in low-speed driving sections (30 km/h or less), as in our analysis. As an example, the measure of effectiveness presented in the Highway Capacity Manual applied in Korea applies different indicators depending on expressways (density), multi-lane roads (V/C, average travel speed), and two-lane roads (total delay rate). In this way, when evaluating the effectiveness of a traffic safety system (or pedestrian safety system), it is necessary to develop measures of effectiveness according to the speed limit or section.
(ii) Would providing information only in situations where attention is needed satisfy both traffic safety and traffic flow requirements?
In general, in order to improve traffic safety (especially pedestrian safety), the installation of a system of facilities to physically reduce the speed of vehicles has been improved in Korea. However, in the pedestrian information provision system of this study, there was no difference in the average speed even when information was provided to the driver in advance. This means that the travel time does not change significantly from the viewpoint of vehicle traffic. However, by providing pedestrian caution information, it can be seen that the number of speeding vehicles (vehicles violating the speed limit) has decreased. In this respect, we need to look at the intelligent transportation system (ITS) projects introduced in the 1990s. ITSes are built to ease road congestion and improve travel efficiency by providing various types of information to vehicles (drivers) driving on the road [34,35,36,37,38,39]. As such, the pedestrian information provision system of this study is similar to an ITS in the sense that it provides information in advance, and it is judged that it is necessary to discuss efficient operation methods.
Therefore, in the future, related guidelines should be continuously developed to introduce a sustainable traffic safety system (or pedestrian safety system) in relation to the above, and research should be conducted to find ways to maximize the effectiveness of the system, as mentioned in a previous study [29].

Author Contributions

Conceptualization, J.-H.K. (Jong-Hoon Kim) and K.-M.H.; methodology, K.-M.H. and J.-H.K. (Jong-Hoon Kim); investigation, J.-H.K. (Jong-Hoon Kim), G.-H.K. and K.-M.H.; data analysis, K.-M.H., J.-H.K. (Jong-Hoon Kim), and J.-A.H.; visualization, K.-M.H.; writing—original draft preparation, K.-M.H.; writing—review and editing, J.-H.K. (Jong-Hoon Kim), J.-A.H. and K.-M.H.; supervision, J.-H.K. (Jong-Hoon Kim) All authors have read and agreed to the published version of the manuscript.

Funding

This research was funded by the Ministry of the Interior and Safety of the Korean government (MOIS), grant number 20010164.

Institutional Review Board Statement

Not applicable.

Informed Consent Statement

Not applicable.

Data Availability Statement

The data presented in this study are available upon request from the corresponding authors. The data are not publicly available due to data that also form part of an ongoing study.

Conflicts of Interest

The authors declare no conflict of interest.

References

  1. World Health Organization. Global Status Report on Road Safety 2018. Available online: https://www.who.int/publications/i/item/9789241565684 (accessed on 17 January 2022).
  2. The Road Traffic Authority. 2020 Statistic Analysis of Traffic Accident; The Road Traffic Authority: Wonju-si, Republic of Korea, 2021. [Google Scholar]
  3. TAAS. Available online: http://taas.koroad.or.kr/ons/omp/mcm/initOecd.do?menuId=ONS_OMP (accessed on 4 January 2022).
  4. Kim, B.G.; Jeong, C.W.; Lee, W.G. A Study on Establishment of Discriminant and Classification Models according to the Occurrence of a Traffic Accident Type. J. Police Sci. 2011, 11, 171–206. [Google Scholar]
  5. Lee, S.C. The characteristics of pedestrians accident: Analysising the conflict behavior between pedestrians and drivers. Korean J. Psychol. Soc. Issues 2000, 6, 159–174. [Google Scholar]
  6. Larue, G.S.; Watling, C.N. Acceptance of visual and audio interventions for distracted pedestrians. Transp. Res. Part F 2021, 76, 369–383. [Google Scholar] [CrossRef]
  7. Osborne, R.; Horberry, T.; Young, K.L. Pedestrian distraction from Smartphones: An end-user perspective on current and future countermeasures. Transp. Res. Part F 2020, 73, 348–361. [Google Scholar] [CrossRef]
  8. Lin, M.-I.B.; Huang, Y.P. The impact of walking while using a smartphone on pedestrians’ awareness of roadside events. Accid. Anal. Prev. 2017, 101, 87–96. [Google Scholar] [CrossRef]
  9. Nasar, J.L.; Troyer, D. Pedestrian injuries due to mobile phone use in public places. Accid. Anal. Prev. 2013, 57, 91–95. [Google Scholar] [CrossRef]
  10. ITARDA. ITARDA. Accidents Resulting in Pedestrian Fatalities Occur Most Frequently with Vehicle Proceeding Straight Ahead. ITARDA Information. 2012. No. 94. Available online: https://www.itarda.or.jp/contents/68/info94_e.pdf (accessed on 17 January 2022).
  11. Habibovic, A.; Tivesten, E.; Uchida, N.; Bärgman, J.; Ljung Aust, M. Driver behavior in car-to-pedestrian incidents: An application of the driving reliability and error analysis method (DREAM). Accid. Anal. Prev. 2013, 50, 554–565. [Google Scholar] [CrossRef]
  12. Yonhap News. Available online: https://www.yna.co.kr/view/AKR20211210042800065 (accessed on 4 January 2022).
  13. Incheonin. Available online: http://www.incheonin.com/news/articleView.html?idxno=84545 (accessed on 4 January 2022).
  14. Yonhap News. Available online: https://www.yna.co.kr/view/AKR20211230023300004 (accessed on 4 January 2022).
  15. Rosen, E.; Stigson, H.; Sander, U. Literature review of pedestrian fatality risk as a function of car impact speed. Accid. Anal. Prev. 2011, 43, 25–33. [Google Scholar] [CrossRef]
  16. Nilsson, G. Traffic Safety Dimensions and the Power Model to Describe the Effect of Speed on Safety; Bulletin 221; Lund Institute of Technology, Department of Technology and Society, Traffic Engineering: Lund, Switzerland, 2004. [Google Scholar]
  17. Rosén, E.; Sander, U. Pedestrian fatality risk as a function of car impact speed. Accid. Anal. Prev. 2009, 41, 536–542. [Google Scholar] [CrossRef]
  18. Hussain, Q.; Feng, H.; Grzebieta, R.; Brijs, T.; Olivier, J. The relationship between impact speed and the probability of pedestrian fatality during a vehicle-pedestrian crash: A systematic review and meta-analysis. Accid. Anal. Prev. 2019, 129, 241–249. [Google Scholar] [CrossRef]
  19. Aarts, L.; Schagen, I.V. Driving speed and the risk of road crashes: A review. Accid. Anal. Prev. 2006, 38, 215–224. [Google Scholar] [CrossRef]
  20. Hakkert, A.S.; Gitelamn, V.; Ben-Shabat, E. An evaluation of crosswalk warning systems: Effects on pedestrian and vehicle behaviour. Transp. Res. Part F 2002, 5, 275–292. [Google Scholar] [CrossRef]
  21. Costa, M.; Lantieri, C.; Vignali, V.; Chasemi, N.; Simone, A. Evaluation of an integrated lighting-warning system on motorists’ yielding at unsignalized crosswalks during nighttime. Transp. Res. Part F 2020, 68, 132–143. [Google Scholar] [CrossRef]
  22. Hong, K.M.; Son, S.H.; Kim, J.H. Effectiveness of Pedestrian Safety Service Provision Using Sensing Technology. Sustainability 2021, 13, 9333. [Google Scholar] [CrossRef]
  23. Jin, M.S.; Lee, S.K. Pedestrians and Drivers Behaviour Change by Installation of Crossing Safety Assistant System. J. Korea Inst. Intell. Transp. Syst. 2016, 15, 85–93. [Google Scholar] [CrossRef]
  24. Ross, J.; Serpico, D.; Lewis, R. Assessment of Driver Yielding Rates Pre- and Post RRFB Installation, Bend, Oregon; Report No. FHWA-OR-RD-12-05; FHWA: Washington, DC, USA, 2011. [Google Scholar]
  25. Foster, N.; Monsere, C.M.; Carlos, K. Evaluating driver and pedestrian behaviours at enhanced, multilane, midblock pedestrian crossings case study in Portland, Oregon. Transp. Res. Rec. 2014, 2464, 59–66. [Google Scholar] [CrossRef]
  26. Al-Kaisy, A.; Miyake, G.T.; Staszcuk, J.; Scharf, D. Motorists’ voluntary yielding of right of way at uncontrolled midblock crosswalks with rectangular rapid flashing beacons. J. Transp. Saf. Secur. 2018, 10, 303–317. [Google Scholar] [CrossRef]
  27. Fitzpatrick, K.; Potts, I.B.; Brewer, M.A.; Averal, R. Comparison of rectangular and circular rapid-flashing beacons in an open- road setting. Transp. Res. Rec. 2015, 2492, 69–77. [Google Scholar] [CrossRef]
  28. Fitzpatrick, K.; Park, E.S. Nighttime effectiveness of the pedestrian hybrid beacon, rectangular rapid flashing beacon, and LED-embedded crossing sign. J. Saf. Res. 2021, 79, 273–286. [Google Scholar] [CrossRef]
  29. Hoye, A.; Laureshyn, A. SeeMe at the crosswalk—Befor-after study of a pedestrian crosswalk warning system. Transp. Res. Part F 2019, 60, 723–733. [Google Scholar] [CrossRef]
  30. Shurbutt, J.; Van Houten, R. Effects of Yellow Rectangular Rapid-Flashing Beacons on Yielding at Multilane Uncontrolled Crosswalks; Report No. FHWA-HRT-10-043; Western Michigan University, Psychology Department: Kalamazoo, MI, USA, 2010. [Google Scholar]
  31. Van Houten, R.; Ellis, R.; Marmolejo, E. Stutter-flash light-emitting-diode beacons to increase yielding to pedestrians at crosswalks. Transp. Res. Rec. 2008, 2073, 69–78. [Google Scholar] [CrossRef]
  32. Pilkington, P.; Kinra, S. Effectiveness of speed cameras in preventing road traffic collisions and related casualties: Systematic review. Br. Med. J. 2005, 330, 331–334. [Google Scholar] [CrossRef] [PubMed] [Green Version]
  33. Pichayapan, P.; Kaewmoracharoen, M.; Peansara, T.; Nanthavisit, P. Urban School Area Road Safety Improvement and Assessment with a 3D Piano-Keyboard-Styled Pedestrian Crossing Approach: A Case Study of Chiang Mai University Demonstration School. Sustainability 2020, 12, 6464. [Google Scholar] [CrossRef]
  34. Yan, X.; Wu, J. Effectiveness of variable message signs on driving behavior based on a driving simulation experiment. Discret. Dyn. Nat. Soc. 2014, 2014, 206805. [Google Scholar] [CrossRef]
  35. Jamson, H.A.; Merat, N. The effectiveness of safety campaign VMS messages a driving simulator investigation. In Proceedings of the 4th International Driving Symposium on Human Factors in Driver Assessment, Training and Vehicle Design, Stevenson, WA, USA, 9–12 July 2007; pp. 459–465. [Google Scholar]
  36. Boyle, L.N.; Mannering, F. Impact of traveler advisory systems on driving speed: Some new evidence. Transp. Res. Part C 2002, 12, 57–72. [Google Scholar] [CrossRef]
  37. Cho, H.J.; Lee, S.H. A Study on Safety Impacts for VMS Traffic Information. J. Korea Inst. Intell. Transp. Syst. 2015, 14, 22–30. [Google Scholar]
  38. Kim, S.H.; Choi, K.C.; Yu, J.W. Driver Route Choice Models for Developing Real-Time VMS Operation Strategies. J. Korean Soc. Civ. Eng. D 2006, 26, 409–416. [Google Scholar]
  39. Lim, S.J.; Lee, J.D.; Park, H.K.; Lee, K.H.; Moon, K.S.; Oah, S.Z. The Effect of VMS Message Presentation Type on the Speed Reduction of Driving Vehicle in School Zone. J. Korea Inst. Intell. Transp. Syst. 2018, 17, 89–99. [Google Scholar] [CrossRef]
Figure 1. Configuration of the pedestrian crossing information notification system: (a) vehicle detection (radar sensor-based fusion detection sensor); (b) pedestrian detection (AI multimodal sensor); (c) FPGA-based edge computing units; and (d) control unit.
Sustainability 15 02718 g001
Figure 2. Information display (sample): (a) driver information display (master); (b) pedestrian information display (slave).
Sustainability 15 02718 g002
Figure 3. System construction status: (a) system installation location and blind spot; (b) master display; (c) pedestrian (slave) display.
Sustainability 15 02718 g003
Figure 4. Field survey: (a) radar equipment and collection data; (b) video equipment and collection data.
Sustainability 15 02718 g004
Figure 5. Distribution of point speed by vehicle rotation: (a) before installation; (b) after installation.
Sustainability 15 02718 g005
Figure 6. Distribution of the point speeds of individual vehicles (with pedestrian present): (a) before installation; (b) after installation.
Sustainability 15 02718 g006
Figure 7. Distribution of point speeds of individual vehicles (with no pedestrians): (a) before installation; (b) after installation.
Sustainability 15 02718 g007
Table 1. Data collection results.
CategoryDate and Time BandNumber of Samples
Before installation2021.09.14 (08:20–09:30), 2021.09.15 (19:00–20:30)178
After installation2021.10.27 (13:15–14:20), 2021.10.28 (17:30–18:55)166
Table 2. Descriptive statistical analysis results.
CategoryPoint Speed (km/h)VarianceStandard DeviationNumber of Samples
AverageMin.Max.
Before installationStraight-ahead-moving vehicle (A)22.3810.9736.8729.815.46134
Right-turning vehicle (B)20.8610.6645.4630.885.5644
Difference (B-A)1.52-----
Sum-----178
After installationStraight-ahead-moving vehicle (A’)21.8210.0435.5121.894.68124
Right-turning vehicle (B’)21.5515.1530.5716.934.1142
Difference (B’-A’)0.26-----
Sum-----166
Table 3. t-test results (for turning vehicles).
CategoryBefore InstallationAfter Installation
t-value−1.5948−0.3243
p-value0.11260.7461
Table 4. t-test results (with/without pedestrians).
CategoryBefore Installation (A)After Installation (B)Difference (B-A)t-Testp-Value
Average point speed (km/h)Whole22.0121.75−0.260.46820.6399
With pedestrians22.1121.28−0.831.22800.2208
Without pedestrians21.7522.280.54−0.55240.5817
Table 5. Change in speed limit compliance rate.
CategoryBefore Installation (A)After Installation (B)Difference (B-A)
Compliance rate under 30 km/h speed limit (%)Whole93.2695.782.52
With pedestrians92.97100.007.03
Without pedestrians94.0091.03−2.97
Table 6. Chi-square test results.
CategoryCompliance with the Speed LimitX2/pPhi/p
Non-Compliance (0)Observance (1)
With pedestriansBefore installationFrequency91196.457/0.0110.173/0.011
Expected frequency5.3122.7
After installationFrequency088
Expected frequency3.784.3
AllFrequency9207
Expected frequency9.0207
Without pedestriansBefore installationFrequency3470.374/0.541−0.054/0.541
Expected frequency3.946.1
After installationFrequency771
Expected frequency6.171.9
AllFrequency10118
Expected frequency10.0118.0
Disclaimer/Publisher’s Note: The statements, opinions and data contained in all publications are solely those of the individual author(s) and contributor(s) and not of MDPI and/or the editor(s). MDPI and/or the editor(s) disclaim responsibility for any injury to people or property resulting from any ideas, methods, instructions or products referred to in the content.

