Abstract
The current study focuses on the Wadi Qanunah basin, which is considered one of Makkah Al-Mukarramah’s most important watersheds. It is located in the southwestern part of the Al Qunfudhah governorate. The identification and characterization of the recharging sources for the quaternary aquifer is one of the most important goals of this study. In this context, different methods will be applied for the identification of the different factors impacting groundwater. Such methods will be based on the integration of geographic information system (GIS) and modern hydrochemical methods ranging from graphical plots, bivariate and multivariate analysis to geochemical modeling. The salinity of the groundwater studied varied from fresh to brackish, according to the seasonal influx of dilute runoff and the dissolution of the weathered rocks, as well as the cementing materials within the aquifers’ matrix. Ionic ratios indicated that ion exchange, silicate weathering and evaporation played a significant role in the enrichment of the groundwater with major constituents including calcium, sodium, magnesium, sulphate and chloride. Furthermore, four factors accounted for 73.92% of the total variance, calculated using SPSS’s statistical program. These factors accounted for leaching and dissolution, silicate and carbonate weathering, anthropogenic effects and evaporation. The δ18O vs. δD, TDS vs. δ18O and δ18O vs. d-excess relationships revealed that local rainfall is the main recharging source for groundwater; some samples were affected by evaporated rainfall, while others with lower salinity (<1000 mg/L) were diluted through seepage from the underlying fractured basement aquifer. Netpath geochemical modeling was applied to calculate the amount of evaporation or dilution which had affected an initial body of water as it moves from the upstream to downstream. The output of this program is consistent with what has been proved by stable isotopes, where the groundwater extracted from the final water is a mixture of an enriched recent precipitation with depleted older water. This study is an attempt to shed light on the assessment of groundwater and the extent at which it is affected by various factors in order to benefit from it in a way that ensures its sustainability.
1. Introduction
Communities all across the world are at risk of poor health and lack of development due to water scarcity. Climate change is making the issue worse, forcing governments to find more creative, cooperative solutions to water shortages [1]. Water supplies have also been harmed by the misuse and overuse of groundwater, particularly in semi-arid and desert regions. These factors have led to a decline in groundwater levels and a deterioration in its quality. Therefore, good management of water resources, especially groundwater, requires further study, including measurements to determine the extent of its sustainability as well as its optimal exploitation. Understanding groundwater chemistry, as well as its evolution along flow paths, the mechanisms for the recharging process and how it mixes with different sources, contributes to better management leading to optimal usage, especially in arid and semi-arid areas [2,3]. It is worth mentioning that groundwater in basement rocks is mainly controlled by faults and fractures and the occurrence of groundwater is limited to the top weathered zone [4,5]. This zone represents the main water-bearing formation (quaternary aquifer). The deposits of the quaternary aquifer are mainly distributed along the drainage basins, reflecting the different compositions of the basin watershed areas.
Several important factors, including rainfall, mineral-weathering and dissolution as well as evaporation-recrystallization mechanisms, control the chemistry of groundwater [6]. In addition, the aquifer rock forming minerals, type of geochemical processes, and solubility of the interacting rocks are all factors that influence the number of constituents dissolved in groundwater [7,8,9]. These governing processes frequently have diverse effects on water throughout the many phases of the hydrological cycle. Furthermore, other processes such as cation-anion exchange and mixing may also influence groundwater chemistry [10]. In addition to precipitation, water-rock interaction also has a substantial impact on the groundwater’s chemical composition.
It should be noted that the geochemical properties of groundwater are mainly attributed to the composition of the aquifer materials within which it circulates. However, there are multiple processes involved in groundwater geochemistry, such as precipitation, rock-water interaction, ion exchange, oxidation–reduction reaction and mixing processes [11,12]. Therefore, recognition of such processes will help in assessing groundwater quality for sustainable development. In addition, environmental stable isotopes along with the hydrochemical datasets can be used to determine the recharging sources as well the hydrogeochemical processes. Stable isotopes are considered to be an important tool for investigating the groundwater recharge mechanism, groundwater residence time and its origin [13,14,15,16].
The chemical and isotopic detests can also be correlated in bivariate (x-y) relationships as they are used as variables in the multivariate statistical programs for the classification of samples and the identification of factors. Furthermore, they are used as input to the inverse geochemical Netpath program to interpret groundwater evolution along the flow direction from the upstream of the Wadi towards the downstream. This model is also applied to distinguish and quantify processes other than rock-water, such as mixing and evaporation [17]. The application of the NETPATH geochemical program requires knowledge of surface and subsurface geology, as well as a good understanding of the geochemical processes that account for the interaction between water and rocks. Some output of the WATEQ program, such as the saturation index (SI), were used to refine the models computed by the Netpath program. In other words, the state of the predominant minerals in each of the models (whether dissolved or precipitated) computed by Netpath will be compared with those that were calculated using the WATEQ.
The ultimate goals of this study comprise the characterization of groundwater present based on its chemical and isotopic composition, and discerning the geochemical evolution and mixing processes in the quaternary aquifer in Wadi Qanunah Basin. Conducting such studies will make it possible to clarify the impact of different sets of conditions and factors on groundwater. For example, it will shed light on the aquifer’s vulnerability to deterioration due to the excessive extracting of groundwater, the impact on climate change and other events resulting from urban expansion. Moreover, clarifying the relationships between groundwater quality, aquifer lithology, and recharge type can help with effective groundwater resource management and exploitation. The expected outcome of this study will lead to better groundwater management, which applies to the quaternary aquifer as well as in the weathered and fractured crystalline rocks for sustainable development, especially in arid and semi-arid regions.
2. Study Area Description
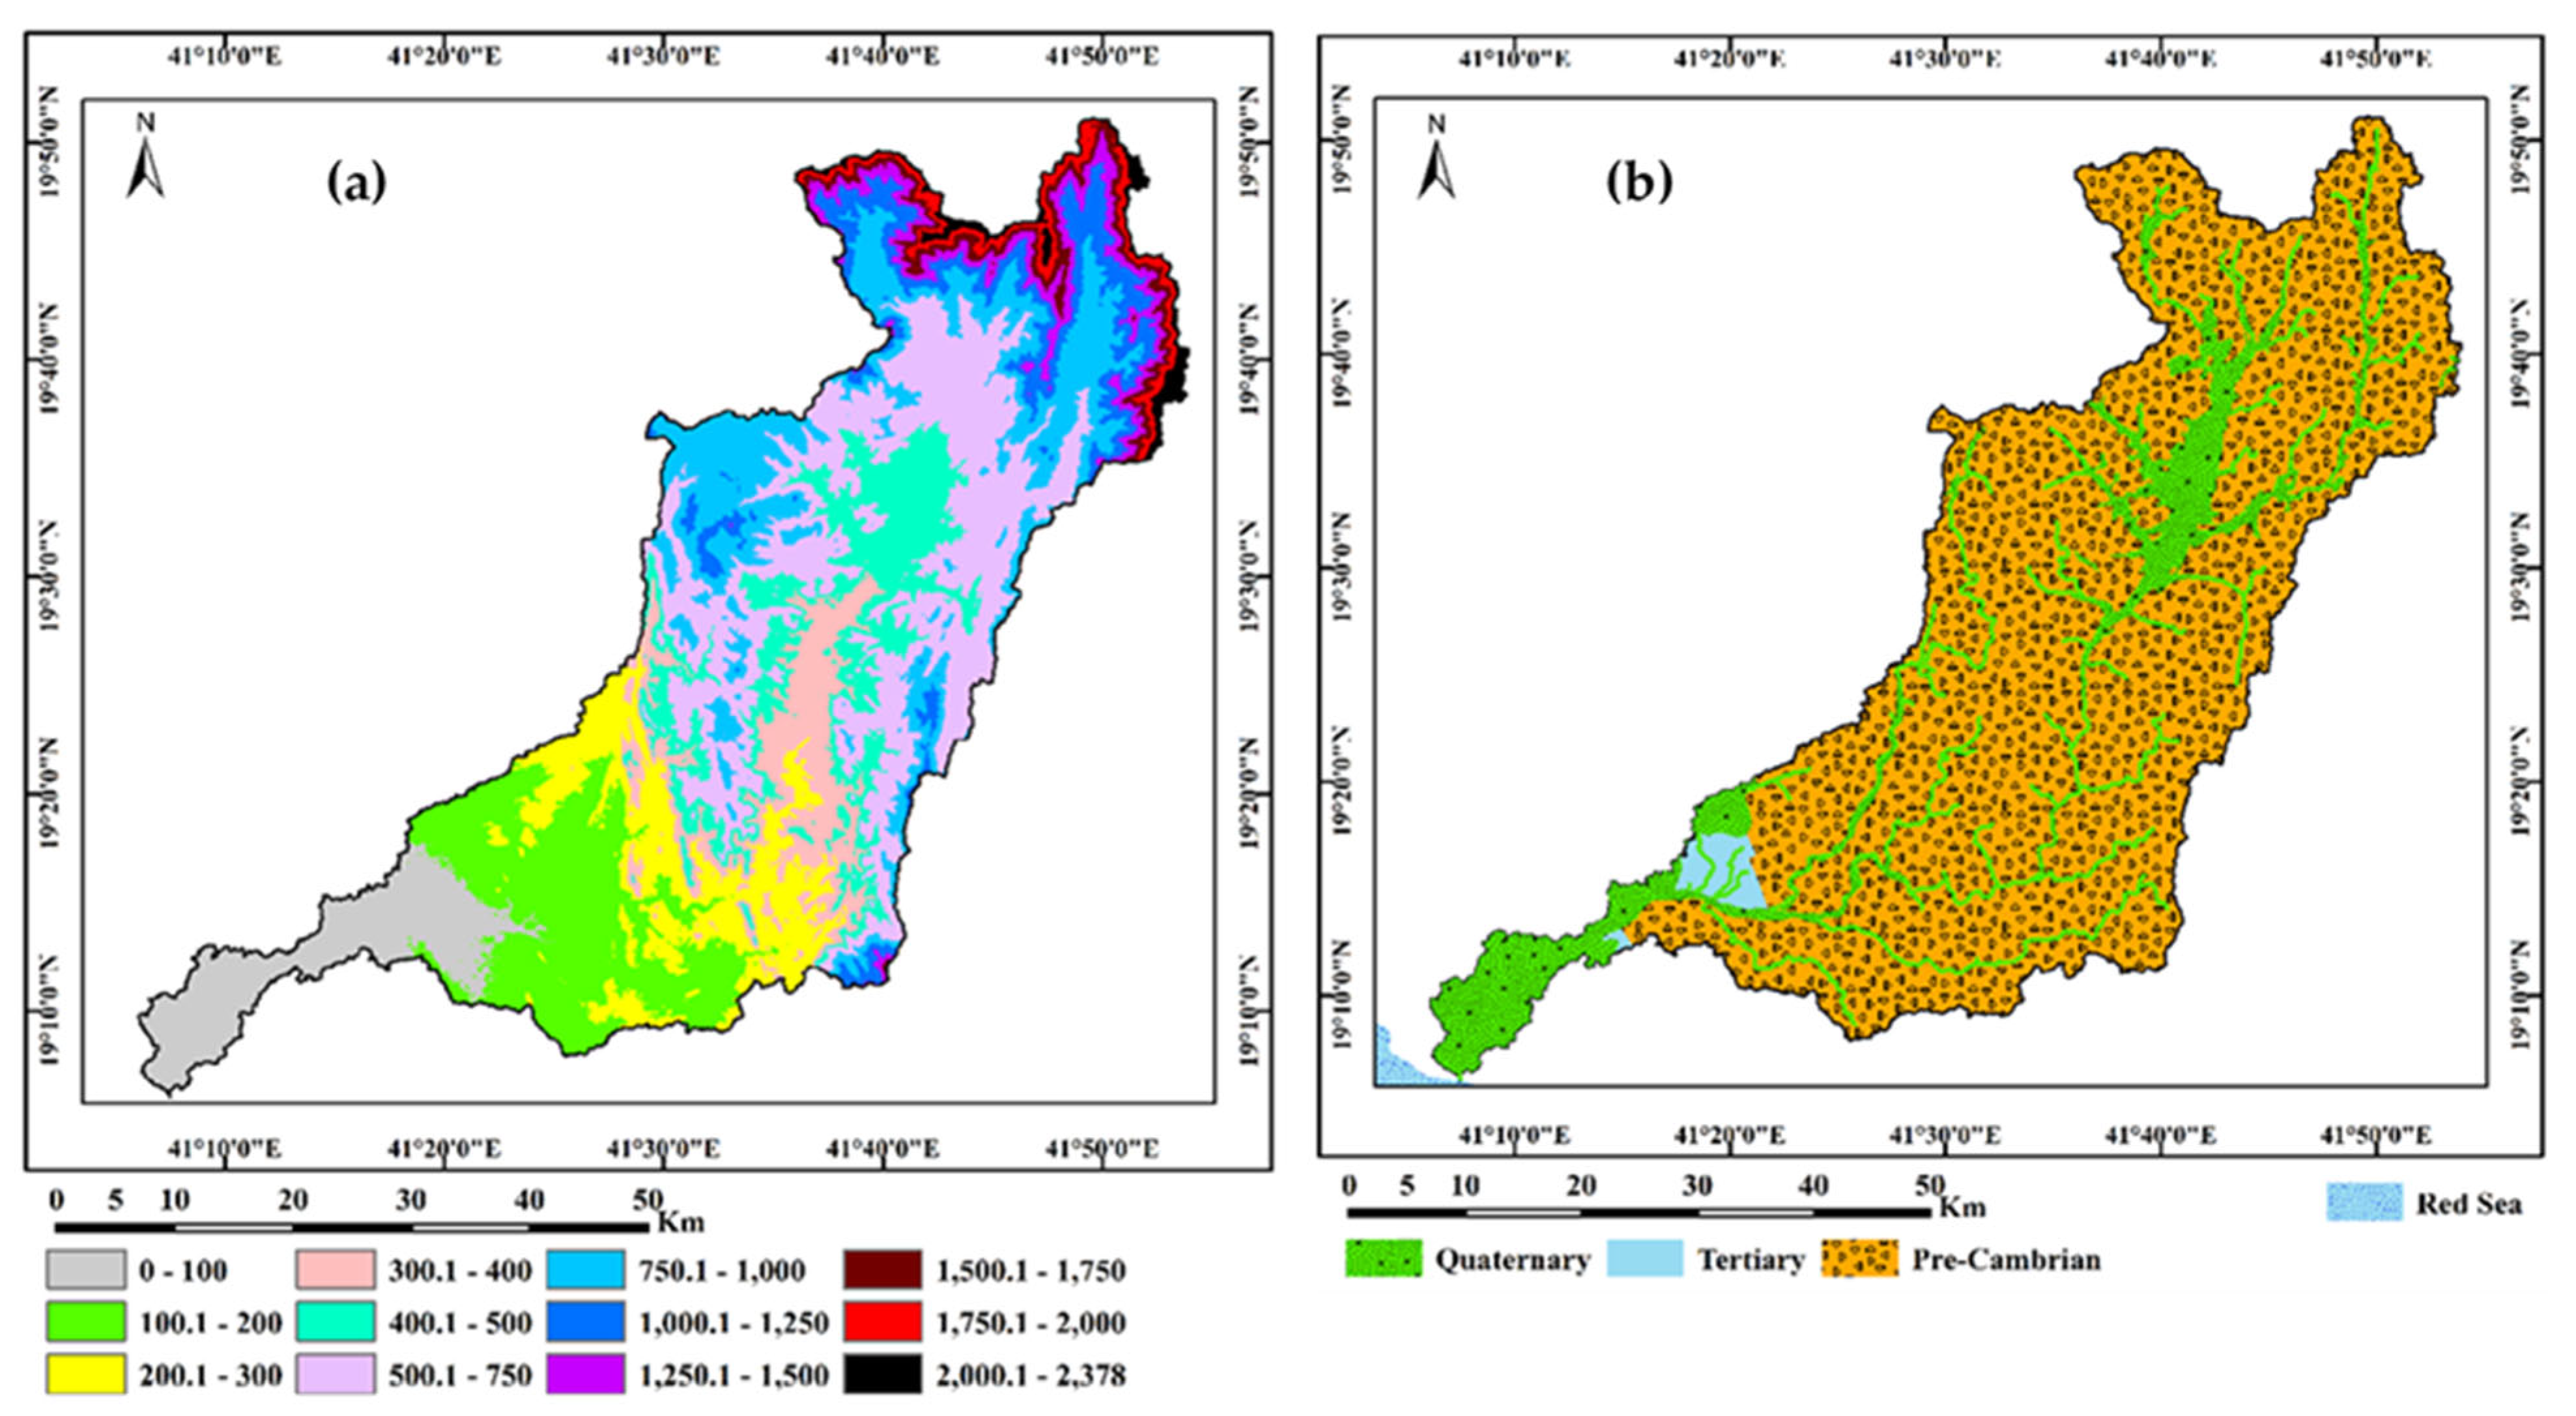
In this study, we focus on Wadi Qanunah, which is one of the most important watersheds in Makkah Al-Mukarramah Province in Saudi Arabia. It is located in the southwestern region of the Al Qunfudhah Governorate between longitudes 41° 05′ and 41° 55′ E and latitudes 19° 05′ and 19° 50′ N with a total area of approximately 2393.7 km2, (Figure 1). This Wadi starts in the high mountains of the Hijaz west and runs 108 km through several towns and villages towards the Red Sea, passing through Al-Qunfudhah city. In terms of geomorphology, Wadi Qanunah has a typical Wadi system, starting from the high eastern slopes of the cliff and descending to the west from the coastal plains of Tihama close to the Red Sea. This basin has a height range of zero to 2378 m, with a mean elevation of 586 m (above mean sea level), as shown in Figure 2a. A land area of zero to 200 m constitutes about 21% of the total area. It corresponds to sediments deposited in the delta during the quaternary and tertiary eras. There are 60% of sub-basins with low hazard levels in the area, while 40% have hazard levels that range between 650 and 2378 m (amsl). In terms of geology, the study area is located within the Arabian Shield in the southwest region of Saudi Arabia [18,19,20]. Throughout geological time, this region has experienced long and complex geological structures as well as geomorphological changes. The study basin begins in the precambrian era. The tertiary and quaternary lithologic times are present in the study basin (Figure 2b). The precambrian rocks consist of andesite, diabase, greenstone and rhyolite. The hilly areas are composed of granite and gneiss. Tertiary rocks are composed of mainly limestone, sandstone, siltstone and shale. The quaternary deposits which cover an area about 12% and are considered to be the main aquifer of the study basin, comprise flood plain deposits, windblown silt, Sabkhas, sand, gravels and conglomerates.
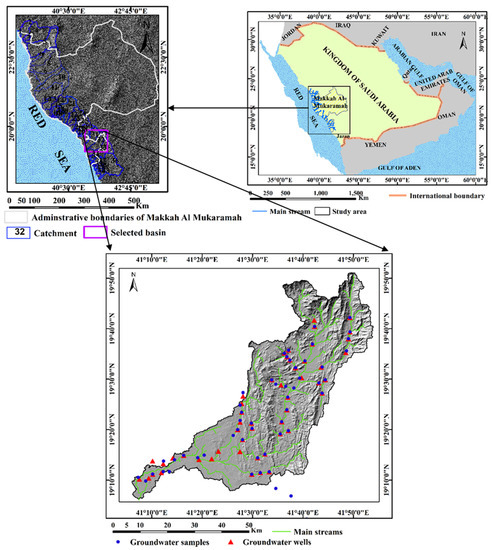
Figure 1.
Key map and location of groundwater wells (depth to water measurements) and water samples collected (chemical analysis) in Wadi Qanunah basin, Saudi Arabia.
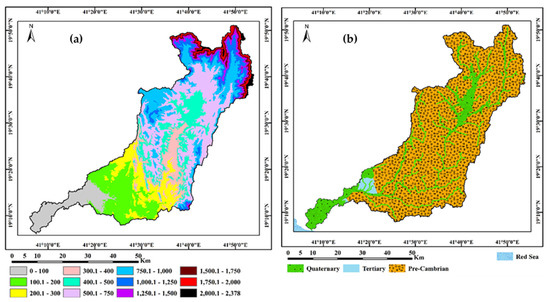
Figure 2.
(a) Digital Elevation Model (DEM) and (b) Geologic map of Wadi Qanunah basin, Saudi Arabia.
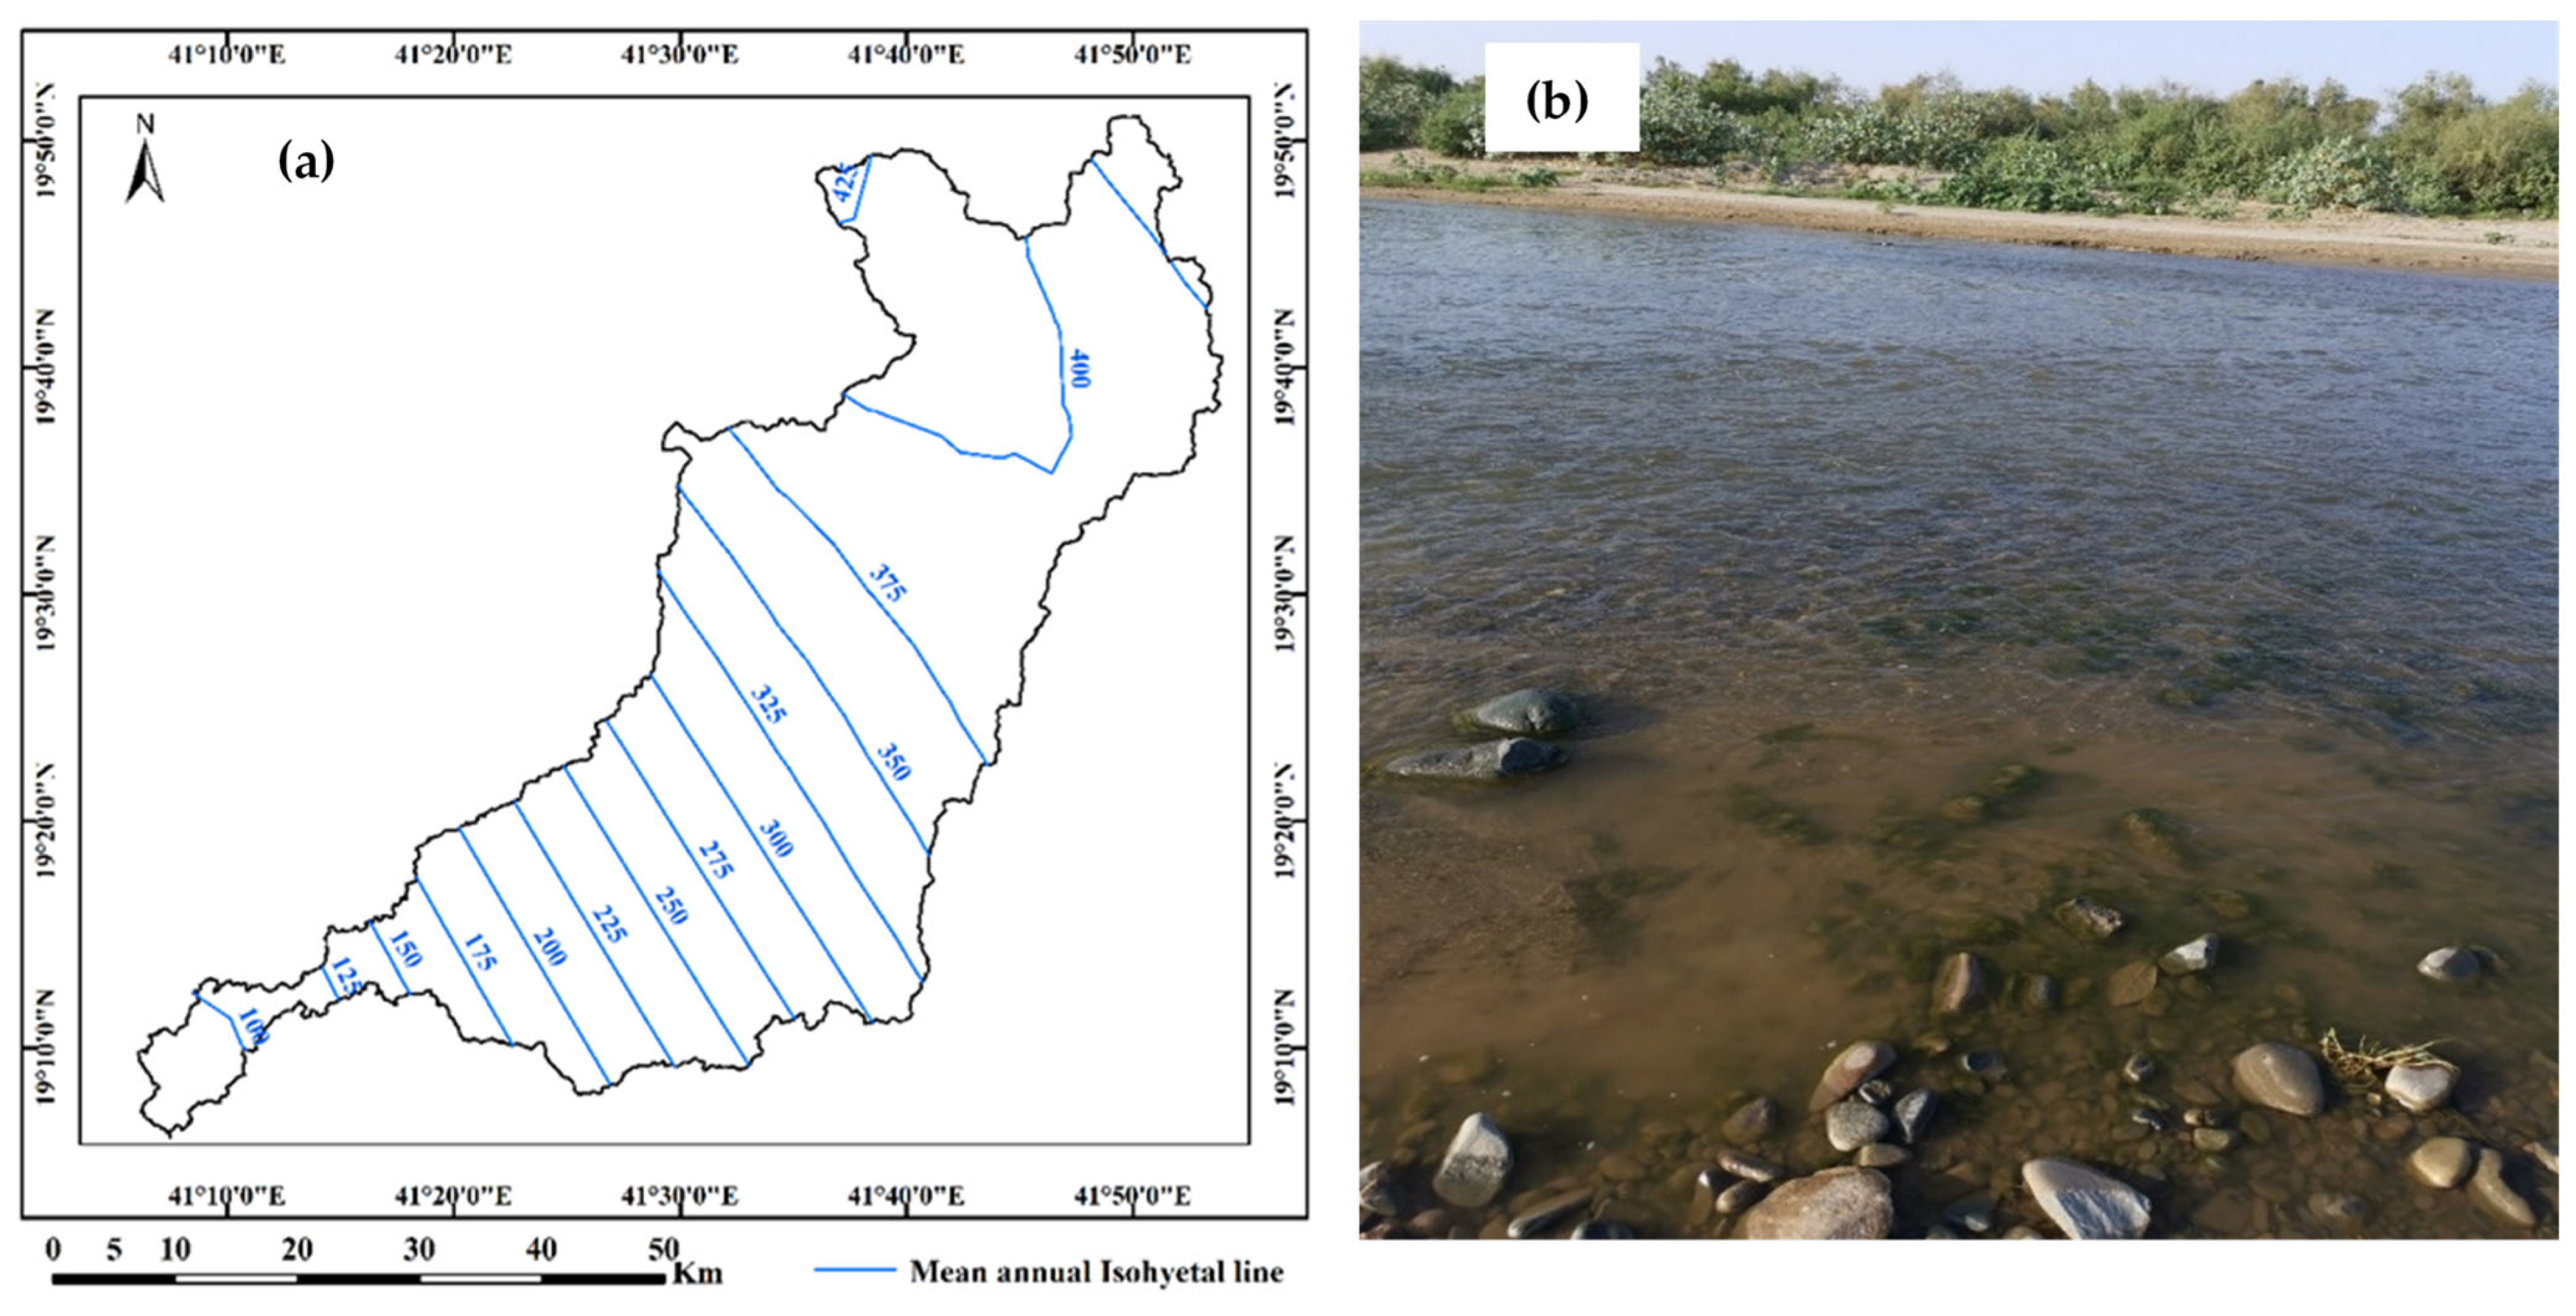
The rainfall distribution map constructed by [21] shows that the average rainfall ranges from 100 mm downstream to 400 mm upstream (Figure 3a). The hydraulic responses of Wadi Qanunah legally depend on meteorological, geological and morphological characteristics. Therefore, it is expected that the selected basin will be rich in surface water in the form of floods of collected rainwater, especially in the areas of the downstream (Figure 3b), in addition to large quantities of this water stored behind the Wadi Qanunah Dam. Accordingly, these conditions will have a positive impact on groundwater recharging and groundwater quality improvement in the area.
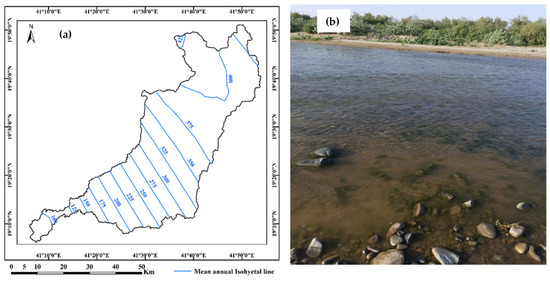
Figure 3.
(a) Annual distribution map of average-rainfall in (mm) and (b) photos of quantities of rainfall in Wadi Qanunah basin, Saudi Arabia.
3. Materials and Methods
3.1. Field Activities
- 1.
- A comprehensive survey was conducted for 106-production groundwater wells employing a hand-held Magellan GPS-315 and also the UTM coordinate system (Figure 1, Figure 4 and Figure 5).
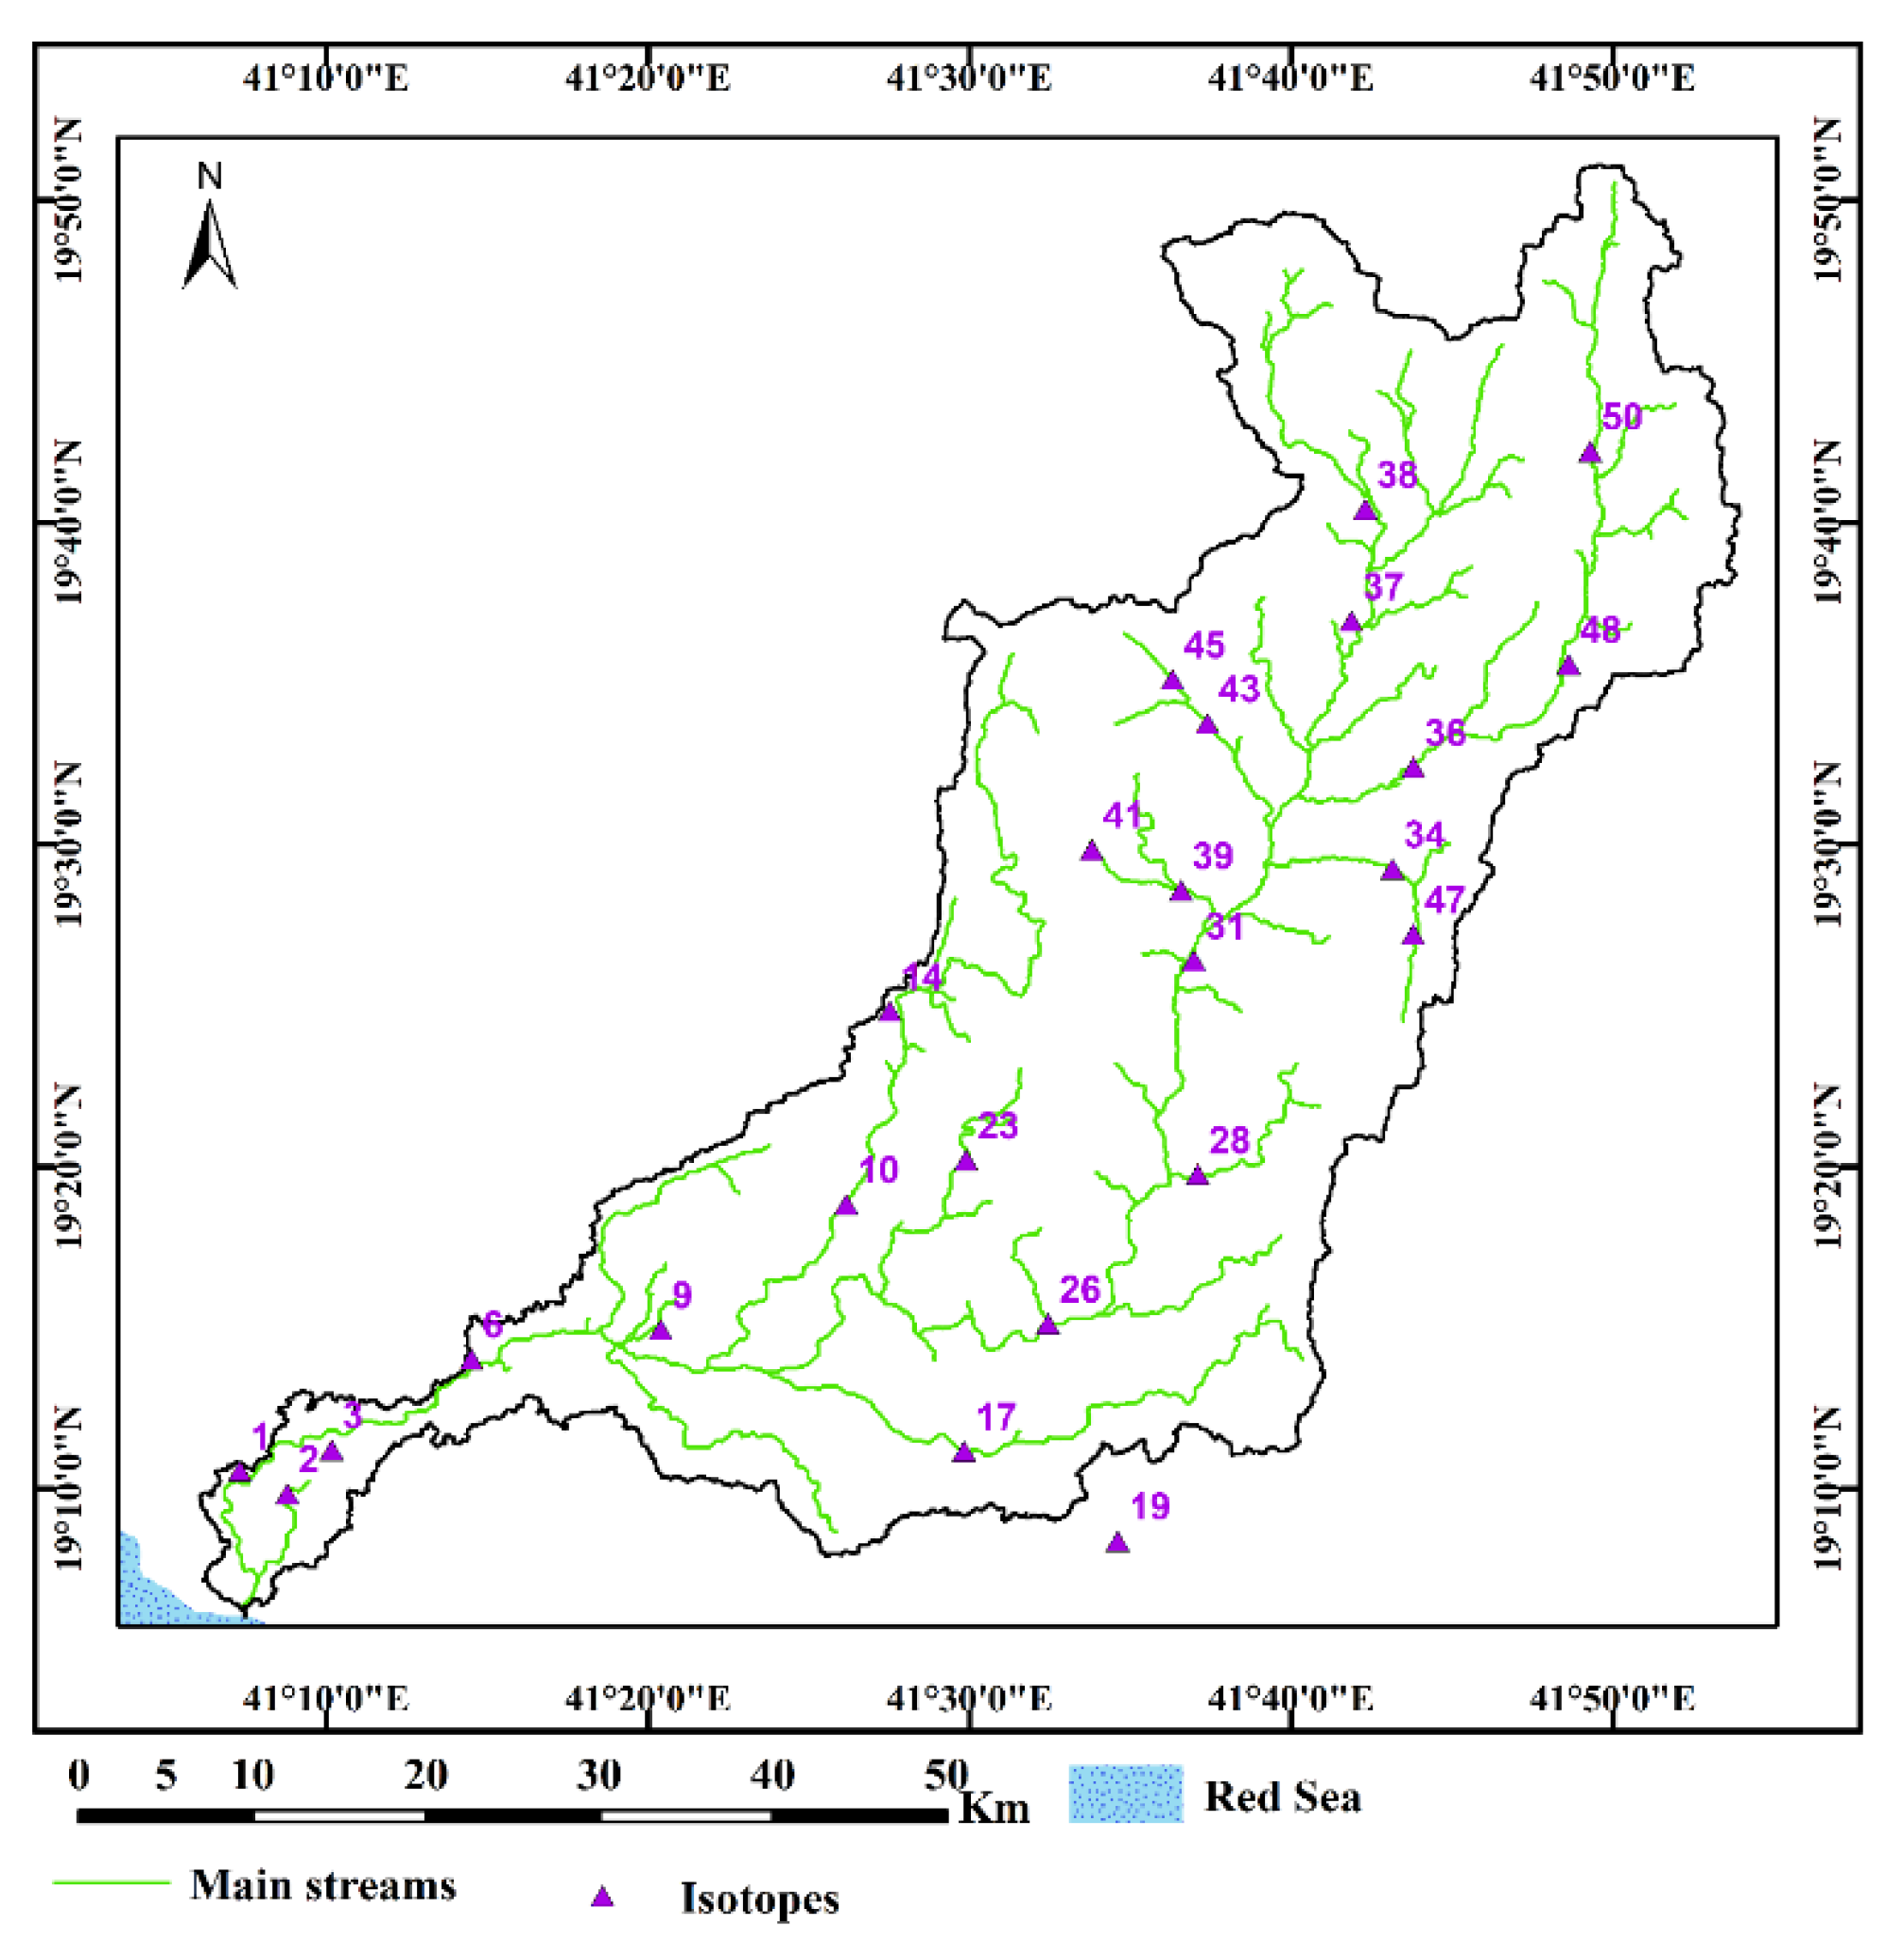
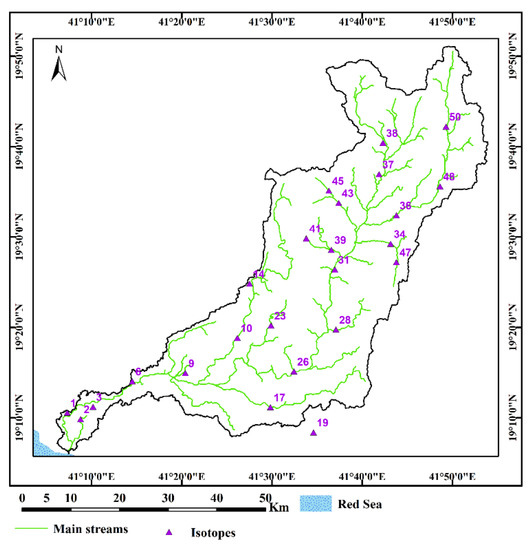 Figure 4. Location map of the selected groundwater samples for stable isotopes (δ18O and δD) analysis in the Wadi Qanunah basin, Saudi Arabia.
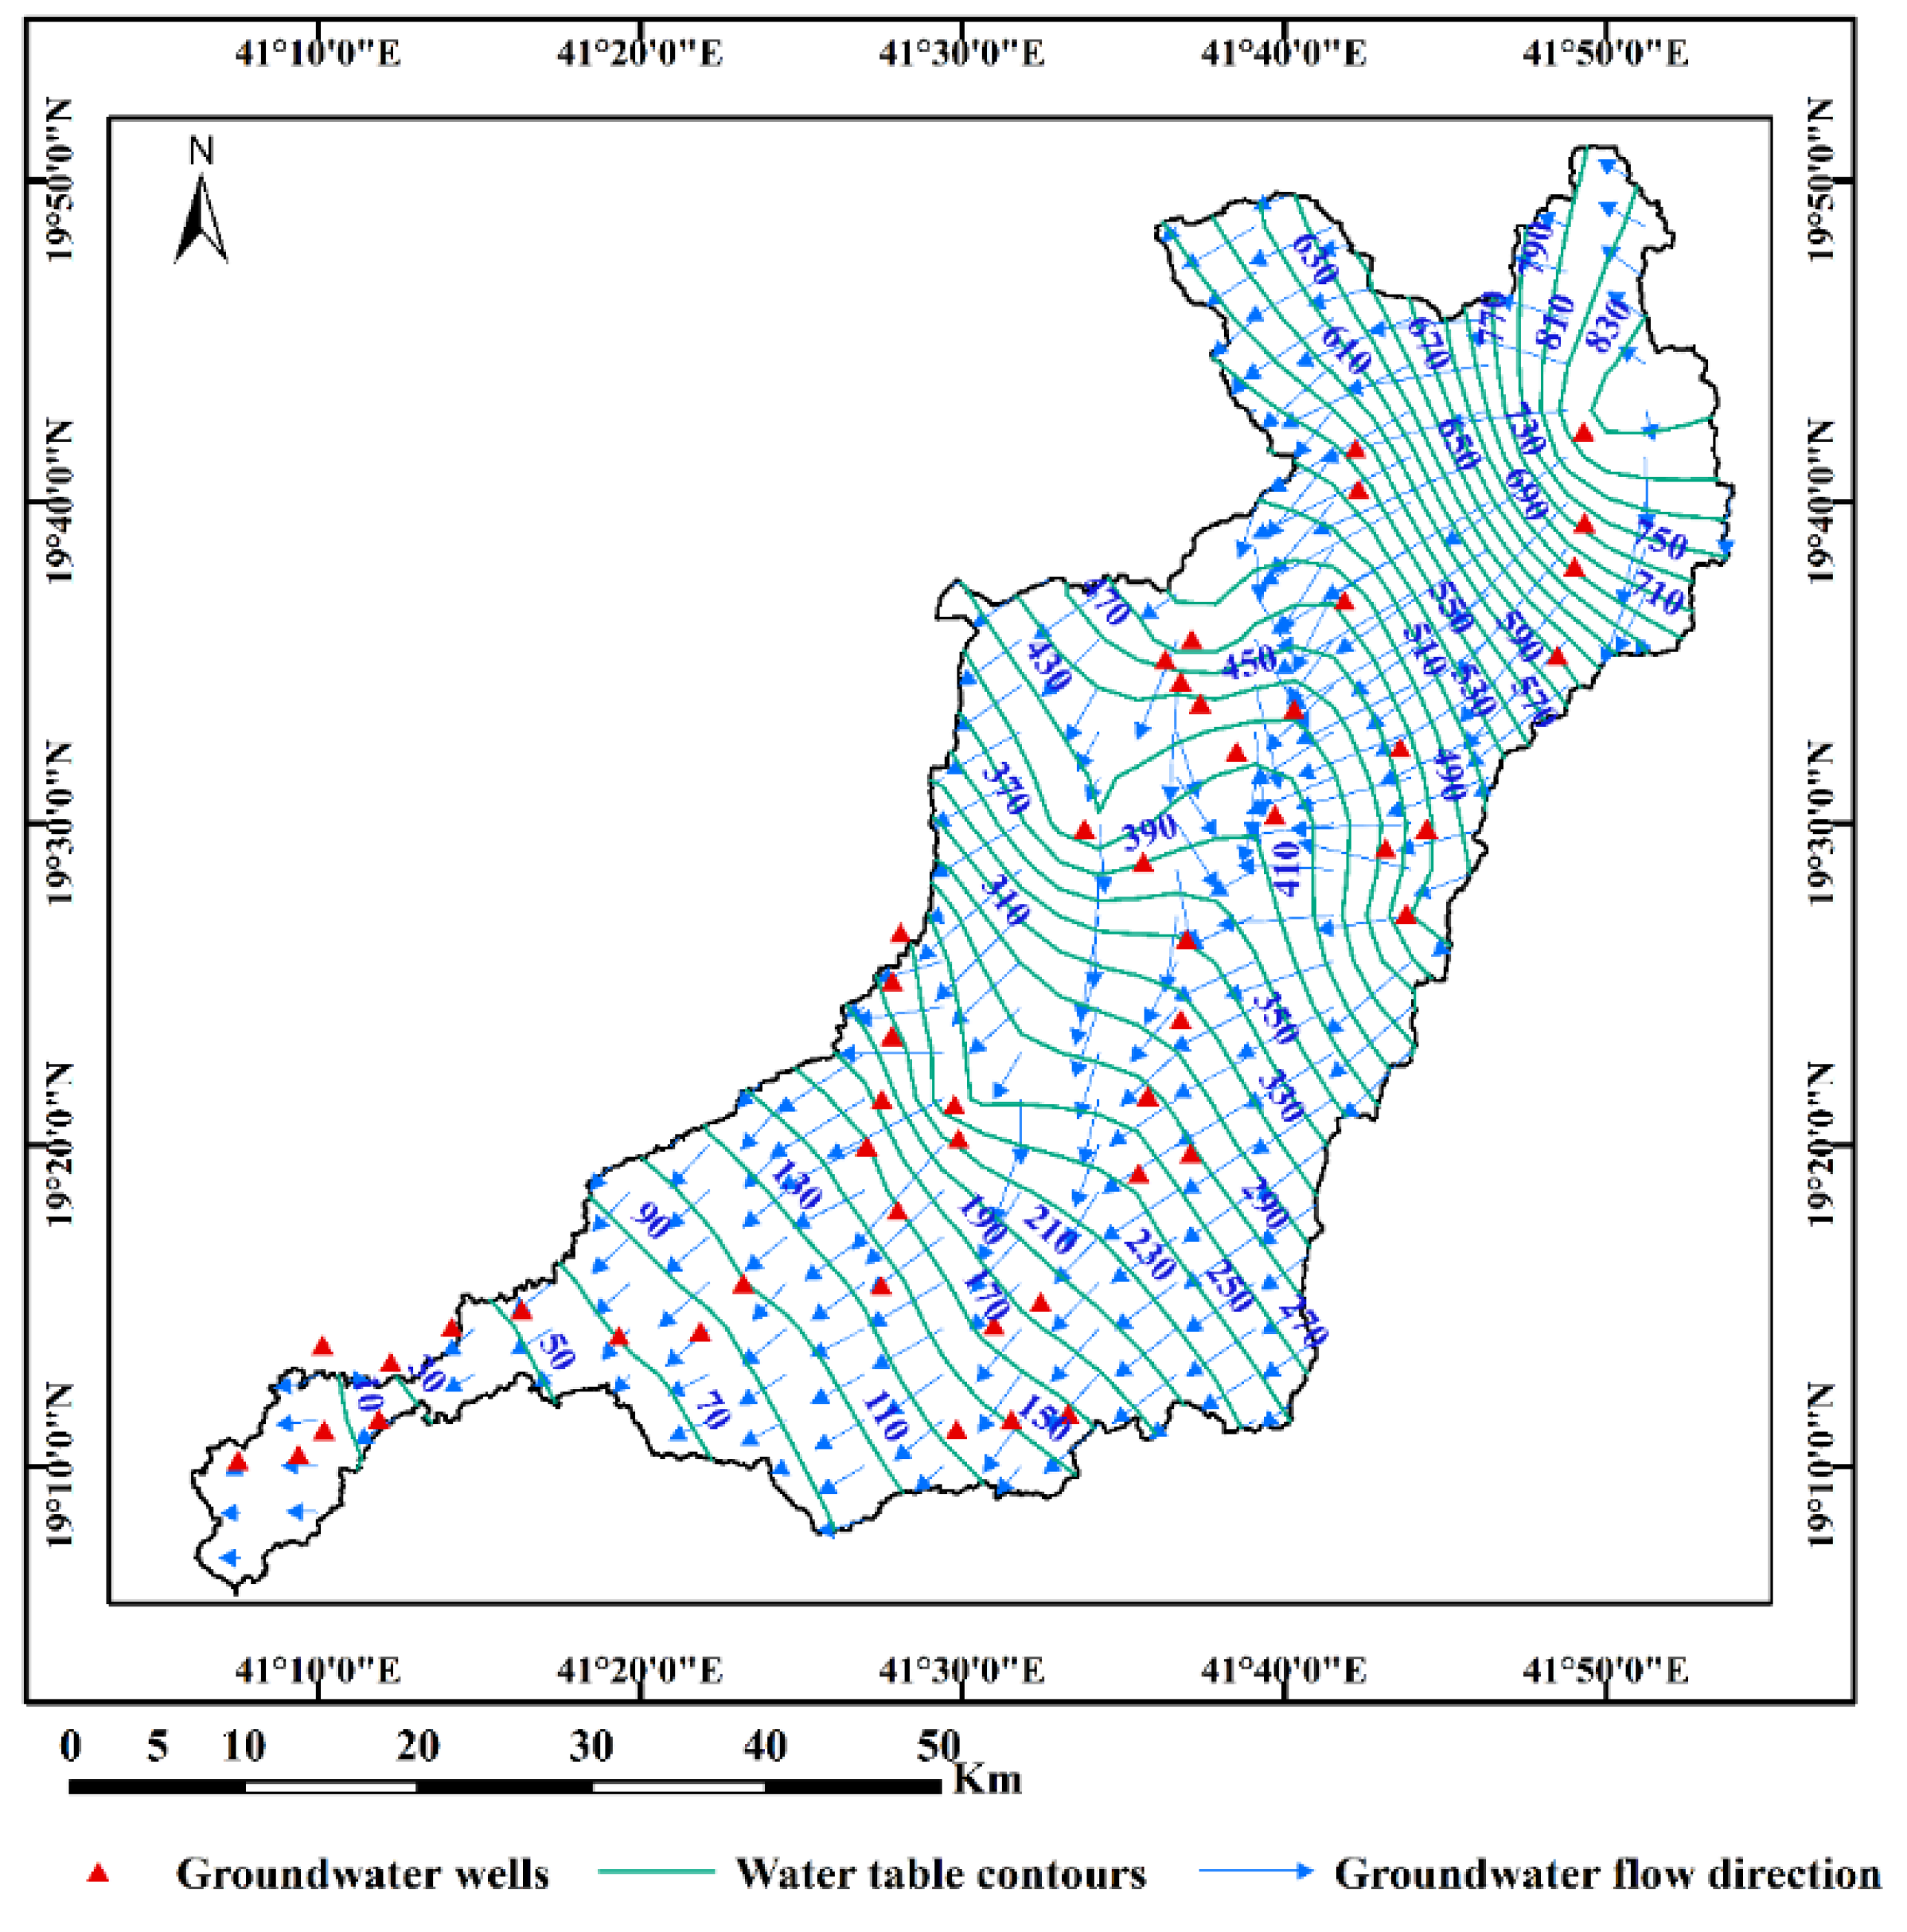
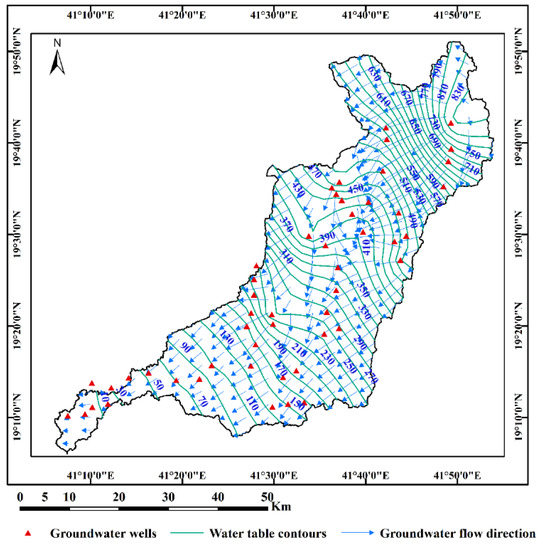 Figure 5. Groundwater table distribution map and flow direction in Wadi Qanunah basin, Saudi Arabia.
 - 2.
- The static water levels from the ground surface were measured in 53 wells to construct the water table maps (Figure 5).
- 3.
- 4.
- Field-based water parameters were measured (Electrical conductivity EC, temperature, and pH).
3.2. Laboratory Activities
- 1.
- Chemical analysis of water samples including major ions (Ca2+, Mg2+, K+, Na+, CO32−, HCO3−, SO42− and Cl−), some minor and trace elements (such as NO3−, SiO2, B, Sr, Al, Fe and Mn) were carried out at the Central Laboratories of the Desert Research Center. The strategies for taking measurements in [22,23,24] were followed. The concentrations of the parameters (Cl−, NO3−, and SO42−, Ca2+, Mg2+, K+, and Na+) were determined by means of ion chromatography (ICS-1100 systems). CO32− and HCO3− concentrations were estimated by titration against 0.01N H2SO4 using phenolphthalein and methyl orange indicators. Trace and heavy elements including (Al, B, Fe, Mo, Mn, Ni, Pb, Sr, and Zn) were detected by inductively coupled plasma-optical emission spectrometry (ICP-OES), thermo-Jarrell elemental company USA. Chemical analysis results are stated in milligrams per liter (mg/L) and milliequivalents per liter (meq/L) units.
- 2.
- The environmental stable isotopes (δ18O and δD) for 24 selected water samples (Figure 4) in addition to rainfall samples were estimated according to the method described in [25] at the Isotope Geochemistry Lab–Department of Geosciences—Western Michigan University, USA. The results are expressed in delta per mil (‰), which notes deviations from the standard mean ocean water (SMOW) standard.
3.3. Computer Software, Hydrochemical Models and Data Analysis Tools
- 1.
- The methods used in this research paper comprise the manipulation of hydrochemical isotopic datasets to detect the recharge to the groundwater aquifer in the Wadi Qanunah basin and to distinguish the hydro-geochemical processes affecting the quality of groundwater. Chemical equilibrium speciation and water type calculations were carried out using Aquachem 10.0 (Waterloo Hydrogeologic, Inc.). Some ion ratios, which correlated with each other as well as with TDS, were also used to classify water samples and identify recharging sources. The consistency of some ions and some related ion ratios will change as a result of groundwater circulation. Therefore, it is possible to examine groundwater evolution by correlating some ionic species with other selected ionic ratios to identify the origin of groundwater, assess the source of the chemical components and determine the contribution of different water bodies in groundwater [26,27].
- 2.
- A graphical representation of the datasets, as in Gibbs’s [6] and Piper’s [28] diagrams, was made to determine the dominant mechanism controlling groundwater chemistry as well as to identify groundwater recharge and salinization. The main objective of Gibb’s graph is to highlight the important factors that influence the groundwater’s quality. Other, more intricate diagrams (such as the Piper plot) will enhance our understanding of the hydrogeochemical processes controlling groundwater characteristics.
- 3.
- Factor analysis (FA) was applied to distinguish the groundwater sources and to define the factors affecting groundwater quality [29,30,31]. FA is a multivariate statistical technique that can be used on a dataset to identify the distribution of variation across variables or simplify data into a manageable number of factors or components. It involves three stages: the generation of a correlation matrix for all the variables, the extraction of factors and the rotation of the factors [32]. The degree of similarity between certain pairs of water quality variables is taken into account using the correlation matrix. The correlation matrix’s eigenvalues and factor loadings are then calculated. Factor loadings are used to assess the degree of correlation between the variables and the factors once the correlation matrix and eigenvalues have been obtained. Finally, factor rotation is carried out to simplify the factor structure and facilitate interpretation [33].
- 4.
- Oxygen-18 was correlated with deuterium, and both the global meteoric water line (GMWL) and the mixing water line (MWL) were included for thecategorization of samples. Isotopic composition of groundwater samples is stated in per mille ‰; deviations from the standard mean ocean water SMOW. These deviations are written in the following equations as δ D for deuterium (2H) and δ 18O for oxygen-18 [34]:
The positive δ18O and δD values indicate the enrichment of a water sample for δ18O and δD related to SMOW, whilst negative values denote depletion of these samples compared to standards. It has been demonstrated that the δ18O value and δD value of global meteoric waters are in a linear relationship, and can be expressed by the following equation [34]:
δD = 8δ18O + 10
Based on vast numbers of meteoric water collected at various latitudes. The data plotted on this line is believed to be of meteoric origin, whereas those deviated would imply either enrichment or depletion.
- 5.
- The saturation index (SI) computed by the WATEQ program was applied to define the equilibrium state of waters with respect to mineral phases, whether they entered (dissolution) or left (precipitation) the solution as a result of rock–water interaction processes. WATEQ is a computer program that calculates the equilibrium dissemination of inorganic aqueous species of major and significant minor elements in natural waters by using chemical analysis and in situ temperature, pH, and redox potential measurements. The states of reaction of water with solid and gaseous phases were calculated using this model. Thermodynamic stabilities of aqueous species, minerals, and gases were chosen after careful consideration of all experimental data [35]. This index was computed by the following equation:
SI= Log (IAP/KT)
- 6.
- NETPATH is an interactive Fortran 77 computer program developed by [17], which is used to interpret net geochemical mass-balance reactions between initial (or multiple initial waters that mix) and final waters along real or hypothetical flow paths in aquifers or other hydrologic systems. This model is a combination of mixing fractions and mole transfers that precisely account for changes in component concentration in the waters. For each possible combination of the plausible phases that can account for the composition of a selected set of chemical and isotopic constraints (components) in the system, inverse models between selected evolutionary waters were found. This program helps calculate the mmol/kgH2O of relevant minerals in the system that should enter (as in dissolution) or leave (upstream) the original solution (as in precipitation). Selected constraints (chemical and isotopic data) were precisely defined on the final water composition (downstream). It also helps to separate the effects of seawater intrusion from the further geochemical modification along flow path. Phases (minerals) were chosen according to the constraints and the aquifer matrix, as well as the type and state of phases induced by WATEQ program. Chloride is considered to be a conservative ion so if it used to calculate the mixing ratio, chloride phases will be excluded. Mixing proportions can also be calculated on the basis of δ18O and δD and might be used to check the results induced by chloride.
- 7.
- The geographic information system (Arc GIS 10.2) and Surfer 12 techniques were applied for mapping aquifer parameters and groundwater quality data.
4. Results and Discussion
4.1. Groundwater Aquifer
In the Wadi Qanunah basin, the quaternary aquifer is the main source of groundwater for various uses. According to information collected for 106-groundwater wells, the aquifer formation is formed mainly by alluvial deposits (gravel, sand and silt). This aquifer occupies the coastal plain and channels of the Wadi with a maximum thickness of about 74 m. Igneous metamorphic rocks form the basis of aquifer, and they are highly fractured and weathered, making them ideal hosts for groundwater preservation [36]. Therefore, the quaternary aquifer in the study area is shallow, unconfined and is directly recharged by occasional rains and floods, where most of the precipitation occurs as runoff and flows into the Red Sea through the town of Al Qunfidhah (Figure 3). Flooding of the Qanunah basin is an important source for the recharging and improvement of groundwater quality [37]. Due to the high rate of soil infiltration, alluvial deposits are filled by water in a short time and there are exposing surface water depressions that are directly related to shallow and free aquifers (Figure 3). Based on field measurements made on 53 groundwater wells, the depth of groundwater varies from 0.8 to 21.7 m from the ground surface. Based on these data, a groundwater table distribution map (Figure 5) was constructed to represent groundwater flow along Wadi Qanunah basin. According to this map, groundwater in the study area usually flows along northeast to southwest towards the Red Sea. This, combined with the presence of groundwater, flows in the direction of the well, which has high abstraction, especially in the central and northern regions. This is due to an increase in agricultural activities, especially in these areas, where the thickness of the quaternary aquifer is increasing. The chemical composition of groundwater ultimately depends on precipitation as well as the direction of flow in the aquifer and the rock (groundwater interaction). Knowledge of the chemical composition of different rocks in the region reflects the physical and hydrochemical characteristics of the collected groundwater samples (evolution). This adds up to the potential for seawater intrusion, especially in near-shore wells, and increased discharge from these wells (mixing). All these changes and processes affect the quality of groundwater in the area and its suitability for various agricultural and drinking water purposes.
4.2. General Hydrochemical Characterizations of Groundwater
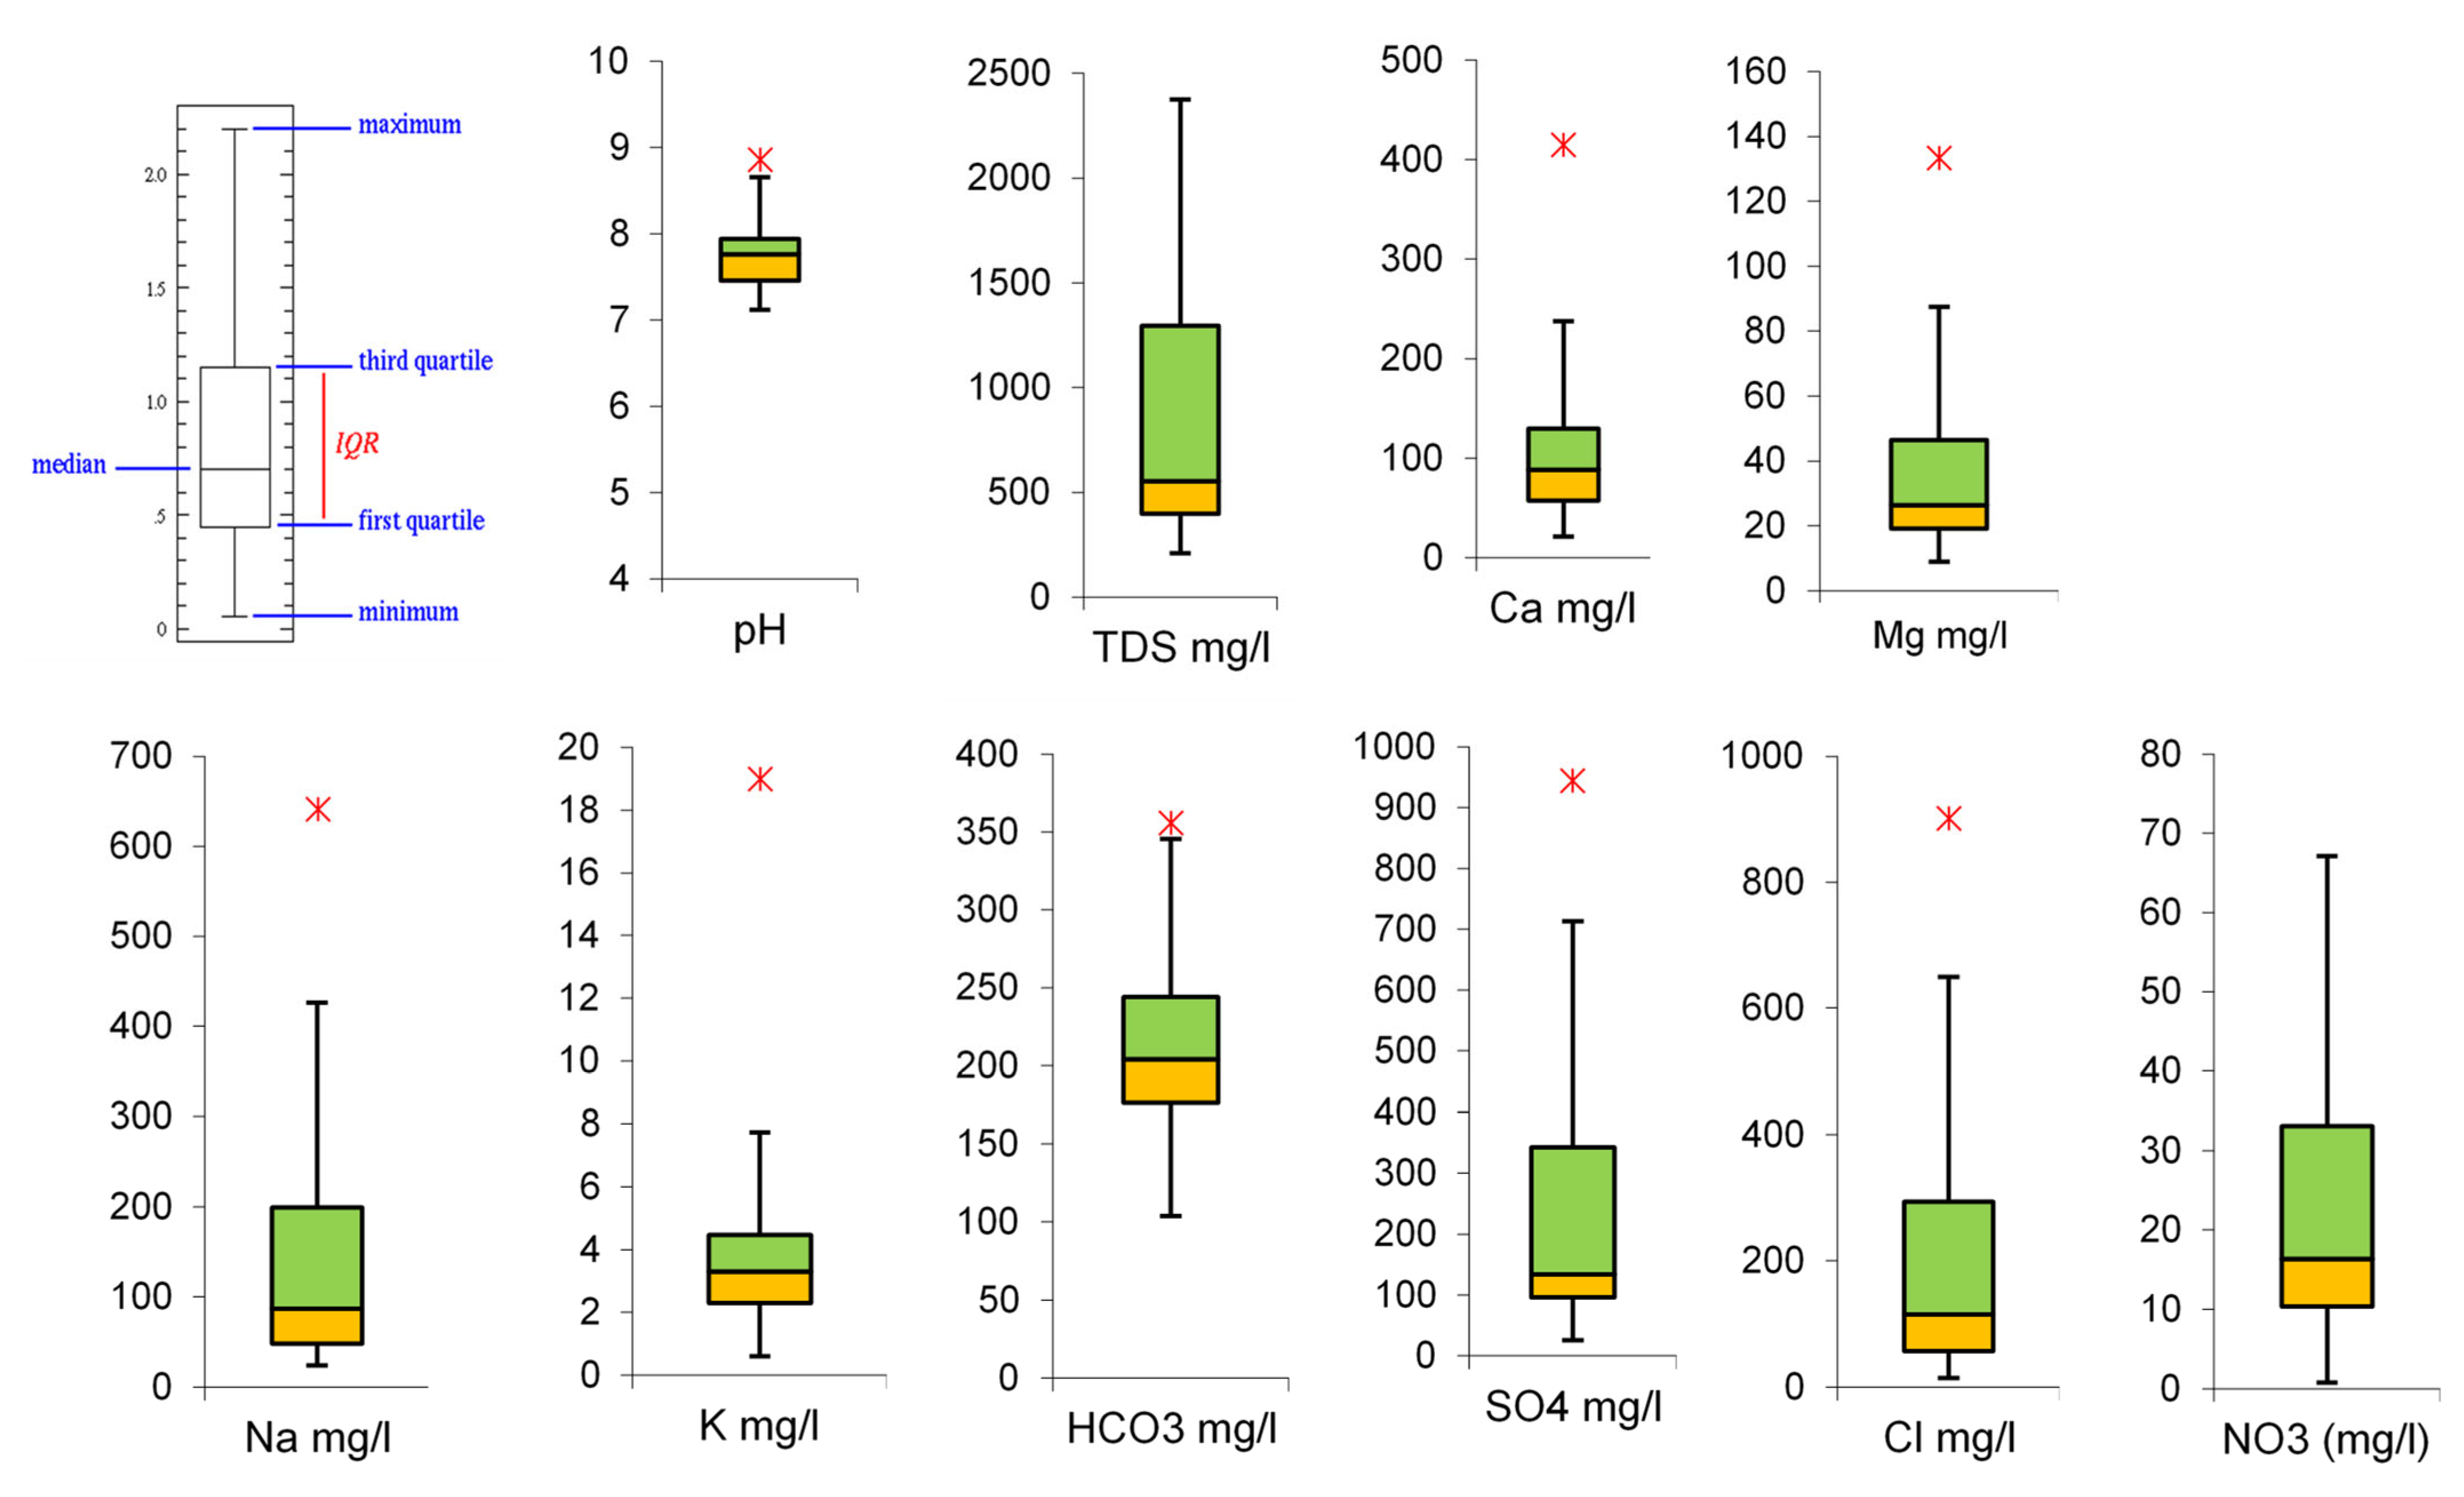
The hydrochemical and isotopic characteristics of analyzed groundwater samples in the Wadi Qanunah basin are listed in Table 1. The ranges of salinity as well as major ions of groundwater of the quaternary aquifer are presented in Table 2 and illustrated in Figure 6 (a box plot for some of the parameters). According to [38], the groundwater salinity of the groundwater samples studied ranges from 208 mg/L to 2375 mg/L with a mean value 866 mg/L, indicating fresh (TDS < 1000 ppm) to brackish (1000 < TDS > 5000) water types. This reflects how close or far the water points are from the catchment areas and the Red Sea, and the effect of the pumping rate in addition to the geochemical processes on groundwater quality (Figure 7). The pH values did not show big differences, varying from neutral to slightly basic ranges falling within the range of natural waters (6.8–8.5) [39]. The existence of free CO2 and the fact that HCO3− ions make up the majority of the dissolved anions are both reflected in the normal pH values (mean 7.7), [38].

Table 1.
Chemical and isotopic data of the analyzed groundwater samples in Wadi Qanunah basin, Saudi Arabia (2022).
Table 2.
Some calculations computed by box plot for the analyzed groundwater samples.
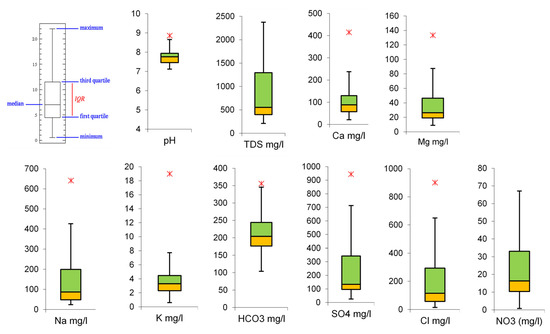
Figure 6.
Box plot for some parameters in the analyzed groundwater samples.
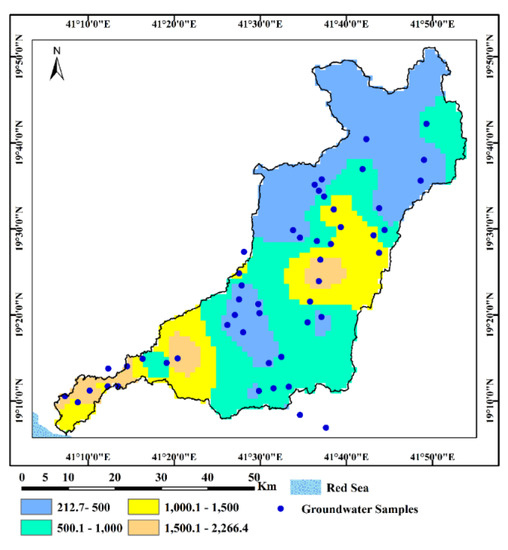
Figure 7.
Groundwater salinity (TDS in mg/L) distribution map in Wadi Qanunah basin.
The ranges of major ions showed that Na+ and Ca+2 are the prevailing cations, followed by Mg+2 and K+. The mean values of these ions are 24.0, 21.6, 9.0, and 0.6 mg/L, respectively. The anions were dominated by the SO4−2 ion, followed by HCO3− and Cl− with average values 242, 213 and 212 mg/L, respectively. The higher Ca+2 and Na+ concentrations in the groundwater of the study area may be due to the dissolution of the weathered granite rock rich in plagioclase feldspar, while the domination of SO4−2 over HCO3− indicates a medium evolutionary stage of groundwater and/or dissolution of minerals rich in gypsum and anhydrite and pyrite [42]. The groundwater of the quaternary aquifer shows different water types (Table 2) that are mainly dominated by the ca-sodium-HCO3-sulphate, sodium-ca-sulphate-HCO3 types. Such water types showed that in most cases, sulphate ions predominate bicarbonate and chloride ions. Alternatively, bicarbonate ions exceed sulphate, while in a few samples, chloride ions are greater than both bicarbonate and sulphate ions. This reflects the fact that the main recharging source is precipitation that has undergone a moderate level of groundwater metasomatism. In addition, the Ca-HCO3 dominant type of low groundwater salinity suggests a quick recharge of the groundwater [43]. This implies that samples of lower TDS values (less than 500 mg/L) were collected from sites close to the watershed area. The changes in groundwater types depends on the type of the aquifer material, the recharge and the discharge rates, rock-water interaction and evaporation. Strontium is more likely derived from the dissolution of the carbonate rocks interbedded within the host rocks (Hidalgo, 1993) [44]. The distribution of strontium concentration indicated that most of groundwater samples (74%) showed values less than 1.00 mg/L, while about 22% showed values that exceeded unity. However, the strontium concentration sharply increased in two samples (sample 3 and sample 37), where it reached about 4.5 and 3.5 mg/L, respectively. Groundwater naturally contains relatively little nitrate (usually less than 44 mg/L NO3−). Concentrations of NO3− that approach or exceed 44.00 mg/L exist in many rural water-supply wells [45]. Most investigators have recognized a growth in nitrate concentrations due to human activities, such as agriculture, industry and domestic effluents. The results showed that samples 20 (160 mg/L), 42 (68 mg/L) and 50 (78 mg/L) all had nitrate concentrations that were higher than the maximum contaminant level.
4.3. Hydrochemical Coefficients (Ion Ratios Relationships)
Hydrochemical coefficients are the relationship between the dissolved groundwater constituents that are used to show the stoichiometric balance between the different ions and indicate the possible hydrochemical processes affecting groundwater, as well as to detect water contamination or mixing. The coefficients which are considered to be of certain importance in this respect are Na/Cl, Ca/Mg, Na/Mg, Na/HCO3, Ca/SO4, SO4/Cl, chloro-alkaline index-1, chloro-alkaline index-2, HCO3/SiO2 and SiO2/(Na + K) − Cl, as shown in Table 3.
Table 3.
Some calculated ionic ratios for the analyzed groundwater samples in Wadi Qanunah.
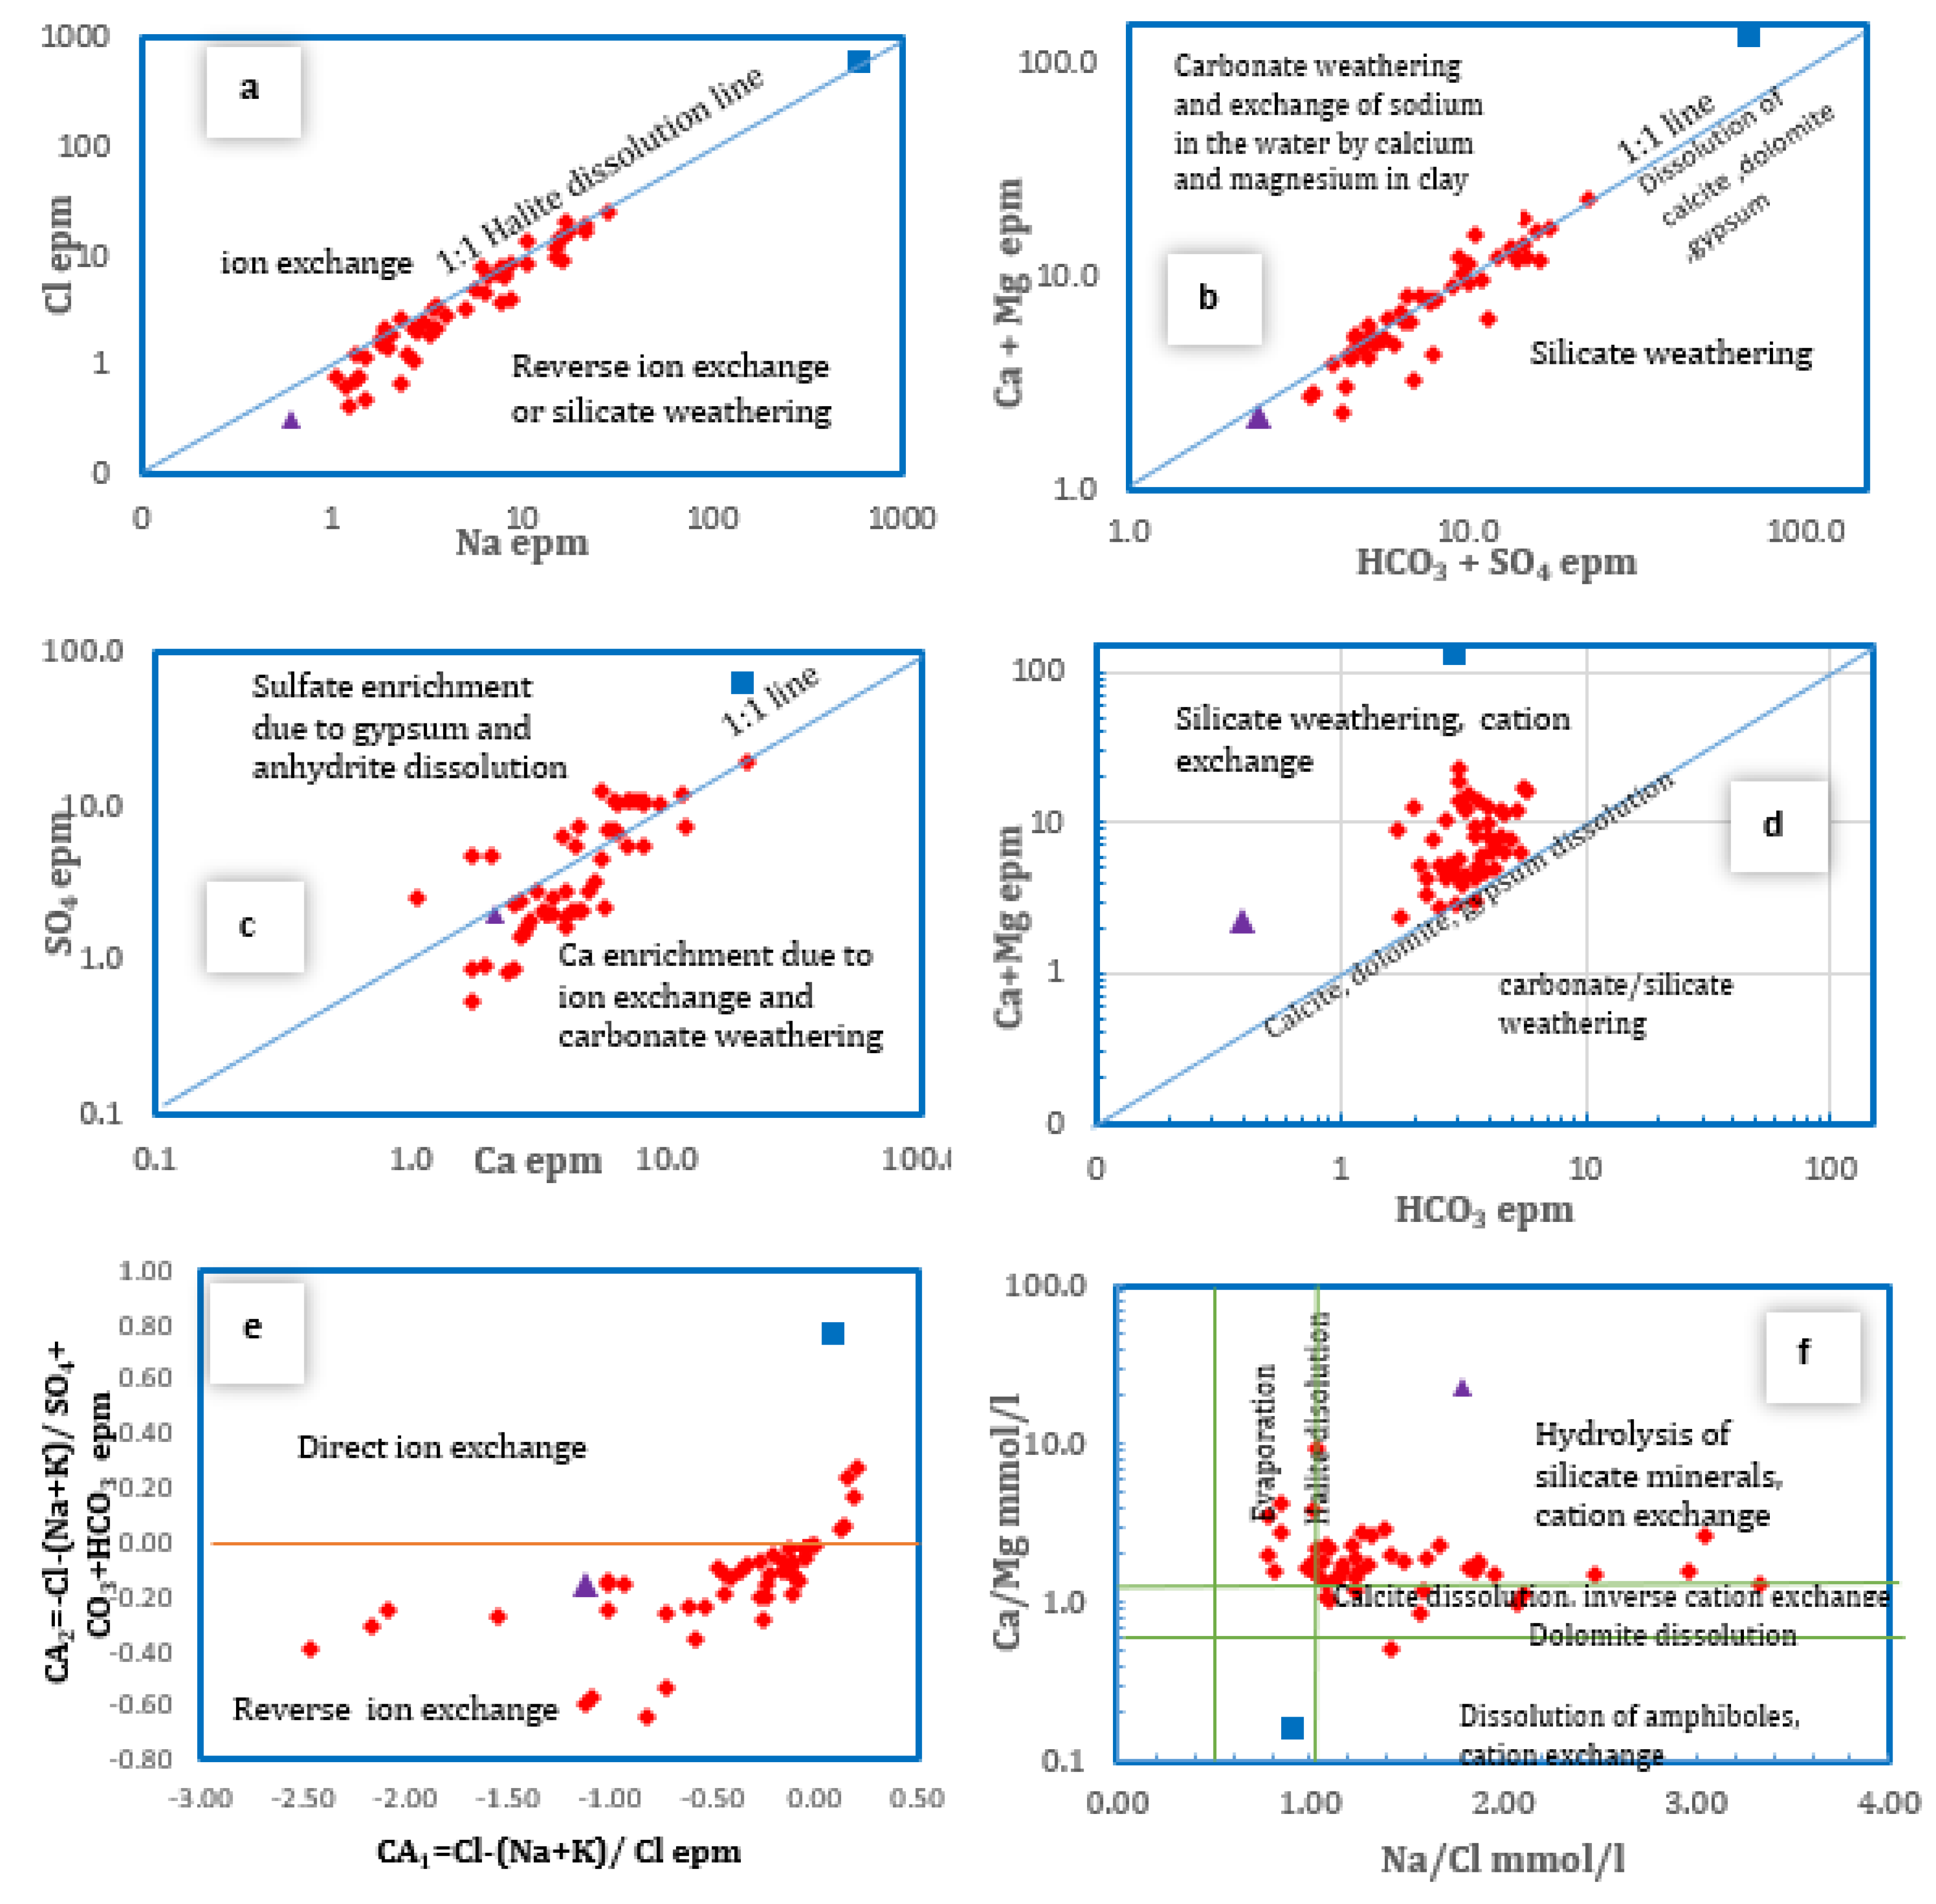
In semi-arid environments, the Na-Cl relationship has frequently been used to determine the mechanisms for obtaining salinity and saline intrusions [46,47]. However, it is also used to imply the effect of meteoric water and dissolution of feldspars on groundwater, [48]. The Na/Cl ratio ranged from 0.79 to 3.34 (Avg. 1.42). The values that exceeded unity reached about 44% and those below unity were 6%, while the remaining 50% lied on the 1:1 halite line (Figure 8a). The higher sodium-to-chloride ratio with low salinity explains the effect of silicate weathering and cation exchange, while the samples located at the 1:1 line with relatively higher salinity were induced by halite dissolution. The correlation between HCO3 + SO4 against Ca +Mg confirmed this hypothesis for the majority of samples. It postulates the prevailing of silicate weathering along with the dissolution of calcite, dolomite and gypsum (Figure 8b).The Ca/SO4 ratio (Figure 8c) revealed that about 62% of the samples lie above the 1:1 line, suggesting that gypsum dissolution is a secondary process. Given that the salinity is low or moderate for most of samples, the cause in this case is silicate and/or carbonate weathering. About 38% of samples had values less than unity, which suggests the removal of calcium by calcite precipitation, cation exchange or anthropogenic sources such as domestic water that can increase sulphate in water [49]. The Na/Ca and Na/Mg ratios are used to differentiate between the carbonate and silicate weathering on one side and the cation exchange processes on the other. Results showed that the values of Na/Ca were more than unity in about 50% of the samples, while the remaining 50% were below unity. On the other hand, the Na/Mg ratio showed that 15% of the samples was below unity and 85% was above unity. This indicates the dominance of reverse cation exchange, which releases Na into the solution. The forward cation exchange that releases Ca and/or Mg into the solution is favorable with respect to Ca rather than Mg due to the exchange with clay minerals rich in Ca more than Mg. The following equations demonstrate the forward and reverse cation exchange:
2 Na+ (aq) + Ca2+ (Mg2+) clay = ► 2Na+ (clay) + Ca2+ (Mg2+) (aq.) Ion exchange
Ca2 + (Mg2+)(aq.) +2 Na+ (clay) =►Ca2+ Mg2+ (clay) + 2Na+ (aq) Reverse ion exchange
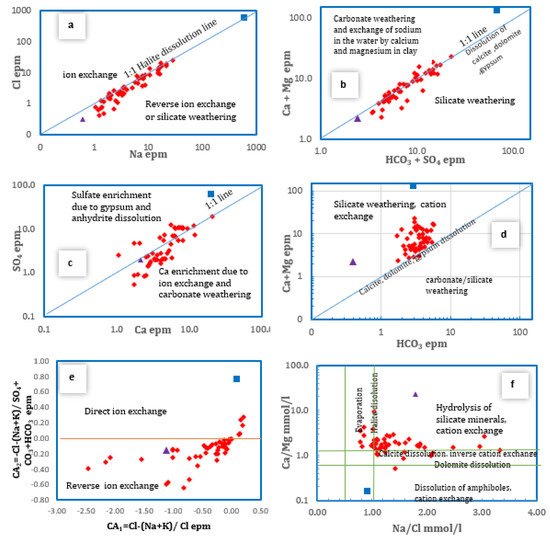
Figure 8.
Bivariate plots of some major ionic parameters and ion ratios for the analyzed groundwater samples in Wadi Qanunah basin.
The plot of Ca + Mg versus HCO3 (Figure 8d) illustrates that few samples were situated on the calcite, dolomite and gypsum line (1:1 line). The majority were located above that line, with a Ca + Mg/HCO3 ratio more than 1, indicating that part of Ca and Mg could be attributed to cation exchange as well as silicate and/or carbonate weathering. The excess Ca + Mg over HCO3 with values that reached 2 or more confirm the same hypothesis of the exchange of calcium and magnesium adsorbed on the aquifer material with sodium in the water [47]. The SiO2/(Na + K) – Cl ratio for the majority of the samples (76%) showed values less than unity, supporting the cation exchange mechanisms. Albite weathering affects about 6% of the samples, with a ratio between 1 and 2. The remaining samples had a ratio of roughly 6%, which indicated the presence of ferromagnesian minerals [50]. To distinguish cation exchange processes, chloro-alkaline indices (CA1 and CA2) were used. Both indices are positive when Na and K in the groundwater exchange directly with Ca and Mg in the aquifer. When Ca or Mg are exchanged indirectly with Na or K in the aquifer material, both indices are negative [51,52]. The results showed that almost all the studied groundwater samples (90%) have negative values regarding these indices. This reflects the abundance of alkalis (Na, K) over the alkali earth elements (Ca, Mg), indicating the superiority of reverse cation exchange (Figure 8e). The Na/Cl against Ca/Mg plot (Figure 8f) demonstrates how numerous geochemical processes have influenced groundwater. These include the weathering of silicate rocks, calcite and dolomite dissolution, ion exchange, and evaporation processes.
4.4. Hydrochemical Facies Diagrams
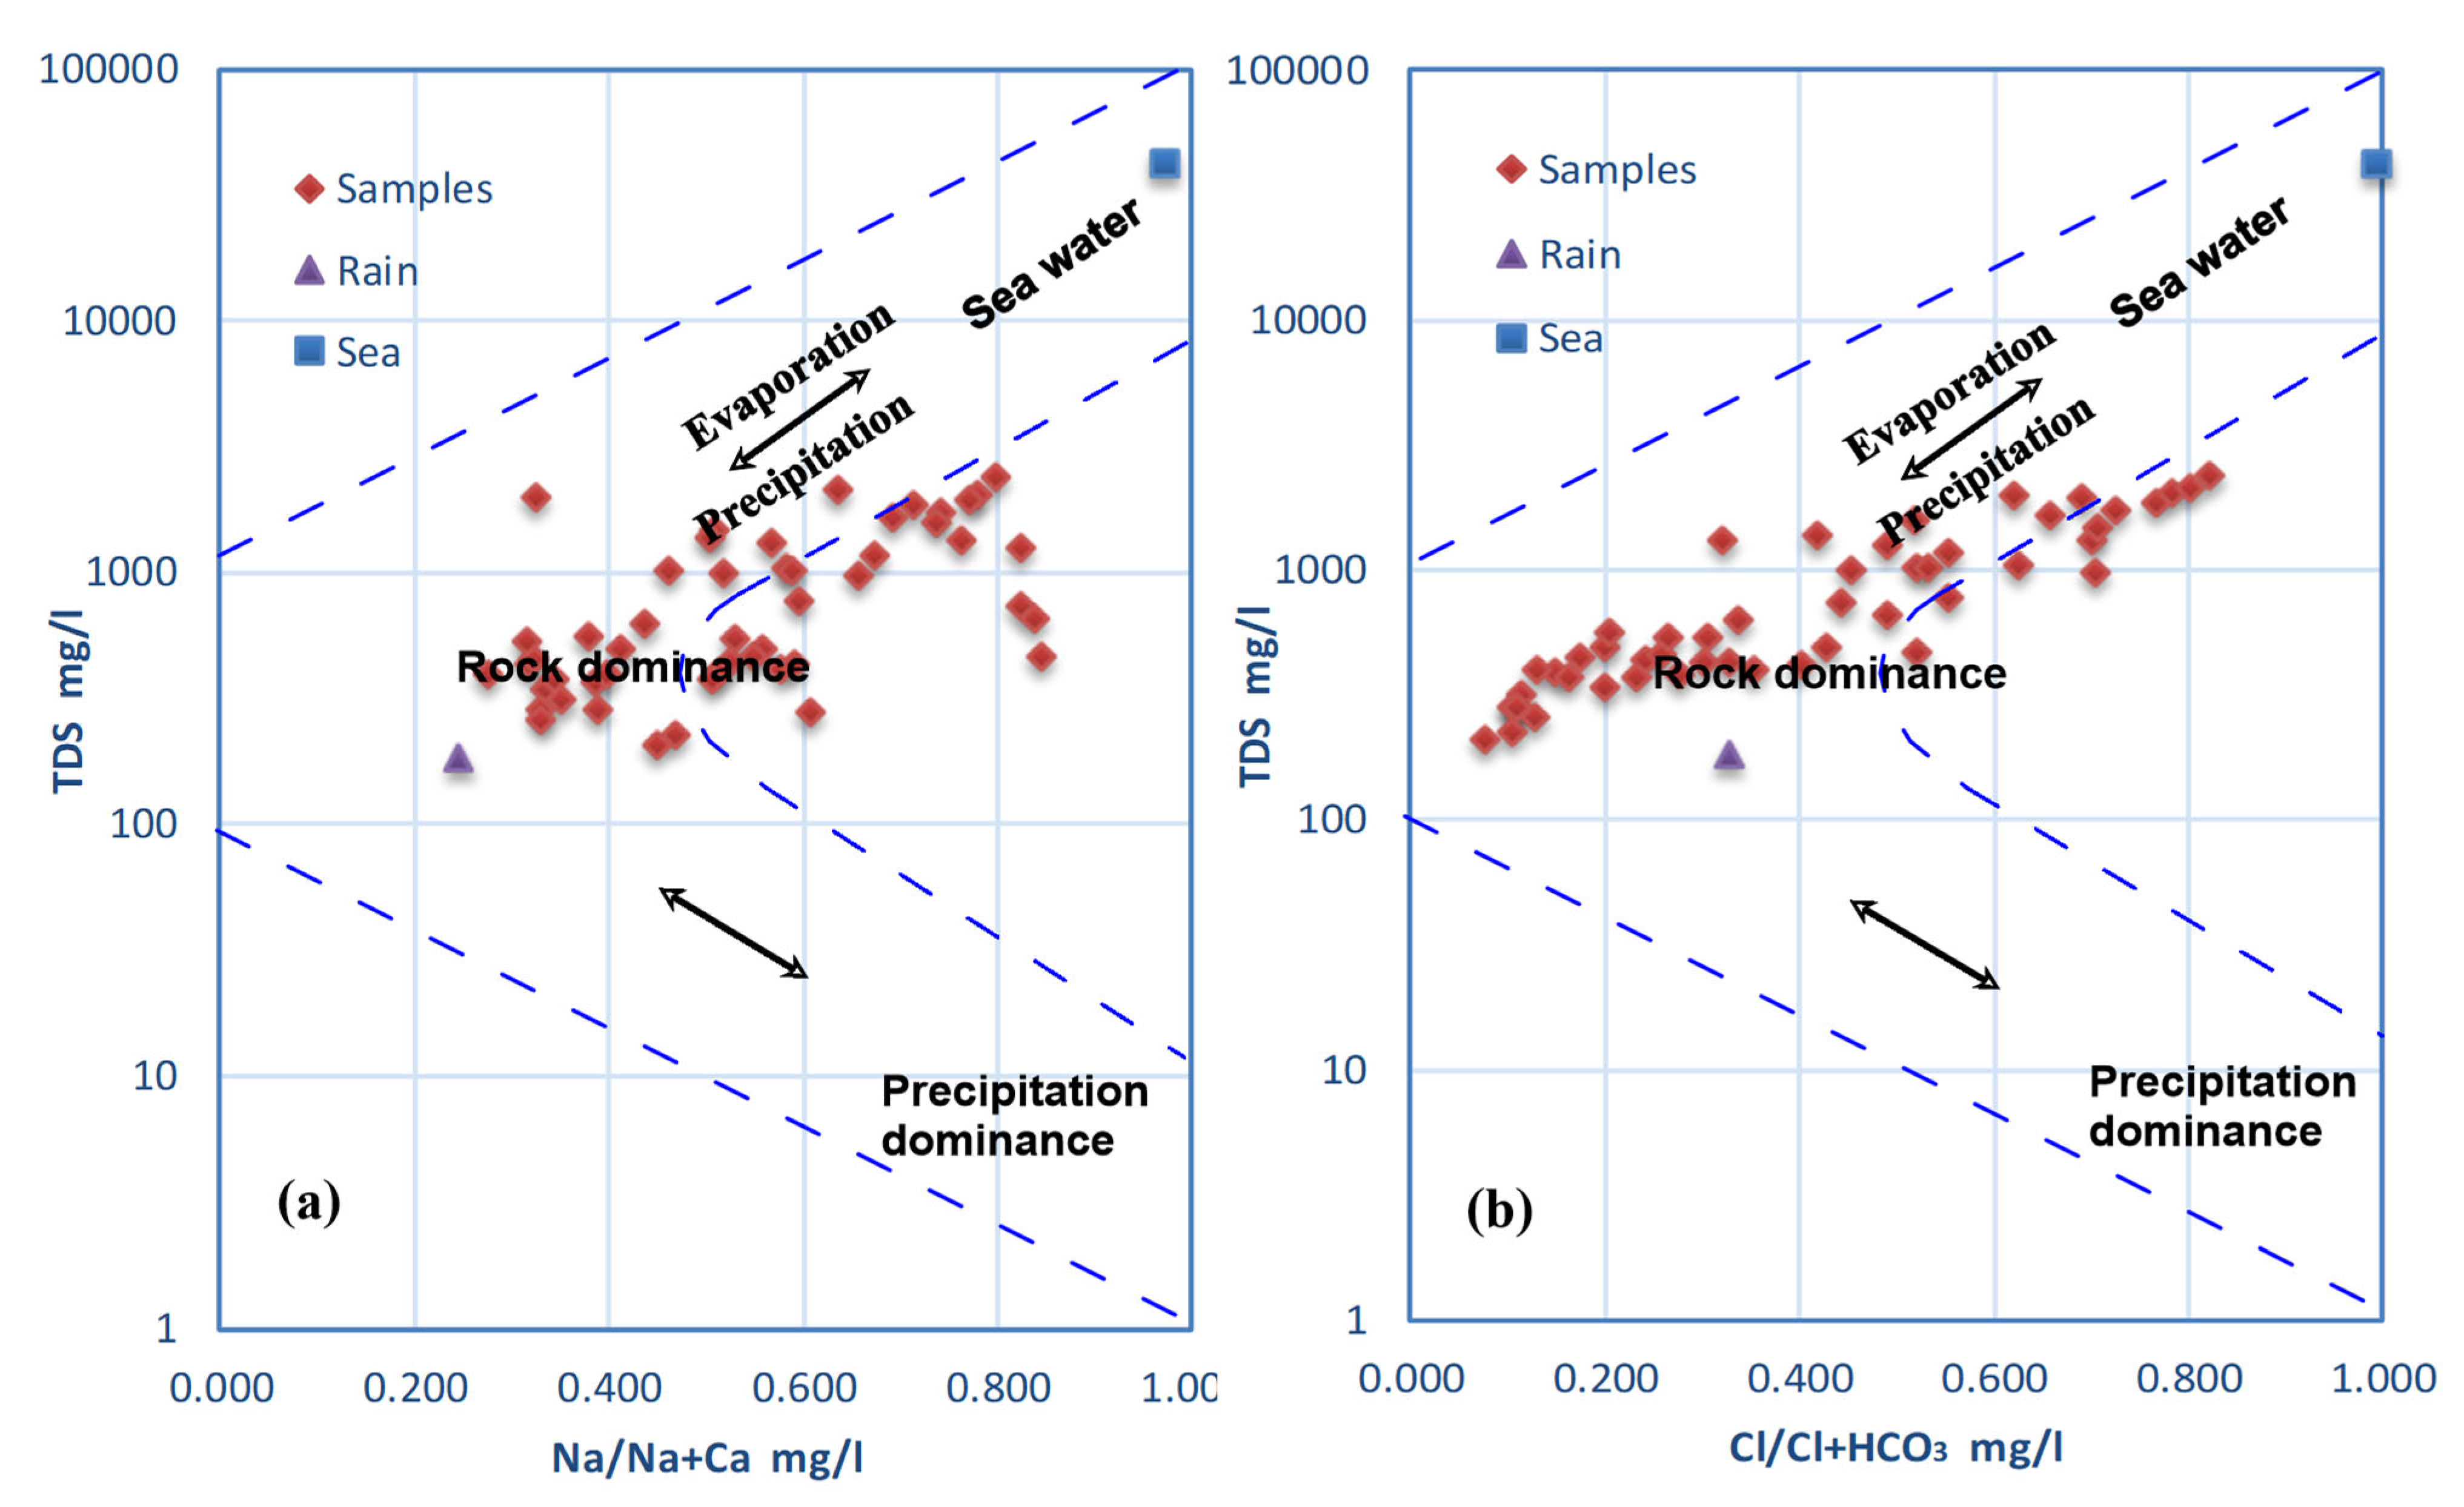
The Gibbs diagram [6] is frequently used to distinguish three separate processes, including precipitation, evaporation, and rock-water interaction. It describes the correlation between TDS and the ratios of cations (Na + K)/(Na + K + Ca) and anions Cl/(Cl + HCO3) (Figure 9). It was demonstrated that few groundwater samples were impacted by evaporation; the majority of samples were located in the field of rock-water interaction. This suggests that the weathering of host rock and aquifer minerals was the main factor controlling groundwater quality in the area studied.
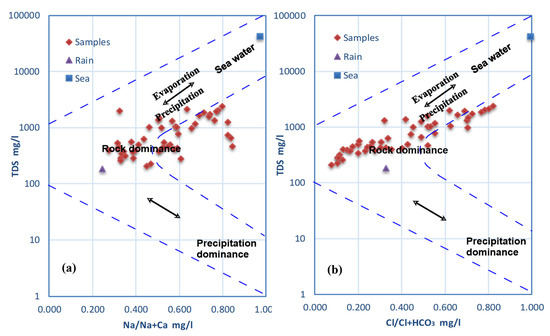
Figure 9.
Gibbs diagram showing groundwater controlling mechanisms in Wadi Qanunah basin.
The Piper diagram was applied to the groundwater samples (Figure 10) and showed most of the groundwater samples plotted in zones D and E, which is characterized by the predominance of alkaline earths (Ca + Mg) and an increase in alkalis (Na + K), with the presence of carbonates and sulfates. Two other groups also appeared, one of which is situated in zone G (where the alkalis with sulfate and chloride predominated), and another small group in zone B, where alkaline earths with sulfate and chloride predominated. The variation in the hydrochemical facies from Ca-HCO3, Ca-Na-HCO3-SO4, Ca-Na-SO4-HCO3 or Na-Ca-SO4-Cl reflects that the groundwater has been subjected to enormous geochemical processes from its recharging area until it seeps into groundwater aquifers. These processes have previously been elucidated in the hydrochemical coefficients section, which mainly include the weathering of silicate minerals and cation exchange.
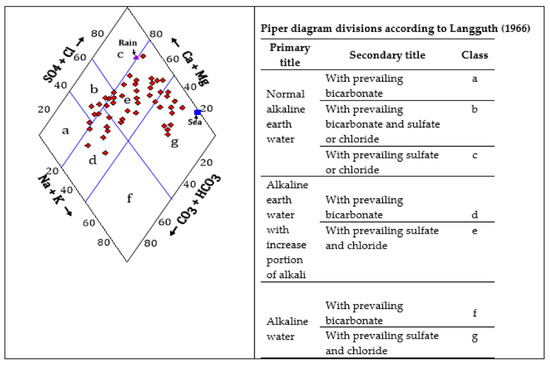
Figure 10.
Piper diagram according to [53] for geochemical facies and groundwater type in Wadi Qanunah basin.
To consider salinity, groundwater samples were plotted on a total ionic salinity (TIS) diagram, as shown in Figure 11. Most samples (about 72%) were located below line TIS = 40 meq/L, indicating a low salinity value in the study area. A relatively high TIS of 40 to 80 meq/L was found in the remaining 14% of groundwater samples.
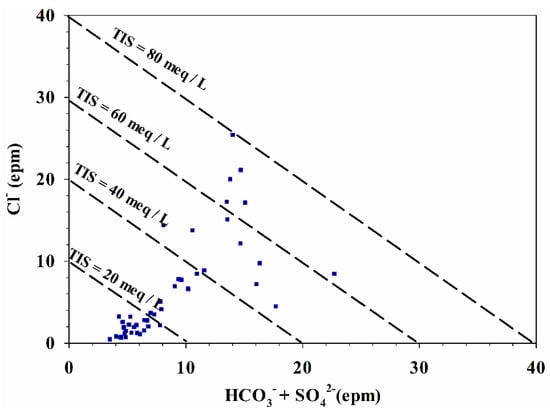
Figure 11.
Total Ionic Salinity (TIS) diagram for the groundwater samples in Wadi Qanunah basin.
4.5. Factor Analysis (FA)
Factor Analysis (FA) was used to isolate and describe the elements influencing the groundwater chemistry in the shallow alluvium aquifer. A subset of 17 water quality indicators, including EC, pH, TDS, Ca, Mg, Na, K, HCO3, SO4, Cl, NO3, Sr, Al, and Fe, were used in this analysis. Table 4 summarizes the FA results, including the loadings, eigenvalues, cumulative values and percentages of total variance. Based on the eigenvalues greater than or equal to one, factors or components were extracted [54]. Varimax rotation was employed to make sure that the factors generated did not correlate with one another, nor that parameters correlate significantly with more than one factor. Because of the orthogonal factor rotation that is produced by varimax rotation, the resulting factors are uncorrelated and simple to understand [55]. According to the statistics calculated, four factors accounted for 73.92% of the total variance in the data matrix generated. Factor 1 accounts for 36.62% of the total variance and associated with substantial positive loadings on EC, TDS, Ca, Mg, Na, K, SO4, and Cl. Since all the parameters with a high positive loading on these factors have geologic origins, Factor 1 could be connected to rock weathering. It demonstrates a substantial association between the principal ions and TDS with correlation coefficients of 0.5 or greater. This clearly illustrates the role of the leaching and dissolution as well as the evaporation process on groundwater mineralization. The second factor (f2) is associated with 16.60% of the variability and corresponded to positive loadings on HCO3 and SiO2 as well as high negative loadings with δ18O and δD. This explains the effect of silicate and carbonate weathering without any intervention of evaporation. Component 3 accounts for 11.93% of the total variance and is highly correlated with Sr, Ca and Mn, while it has moderate loadings with SO4 and NO3. This factor is more likely to reflect the impact of carbonate minerals, gypsum and the anthropogenic activities on groundwater. Finally, factor 4 which corresponds to 8.76% of the total variance and exhibits significant positive loadings with respect to Al, Fe, Mn and Mg. This may be related to the effect of clay minerals (such as biotite and smectite) produced as a result of the weathering of crystalline rocks.
Table 4.
Factor loading for some groundwater variables in Wadi Qanunah basin.
4.6. Environmental Stable Isotopes
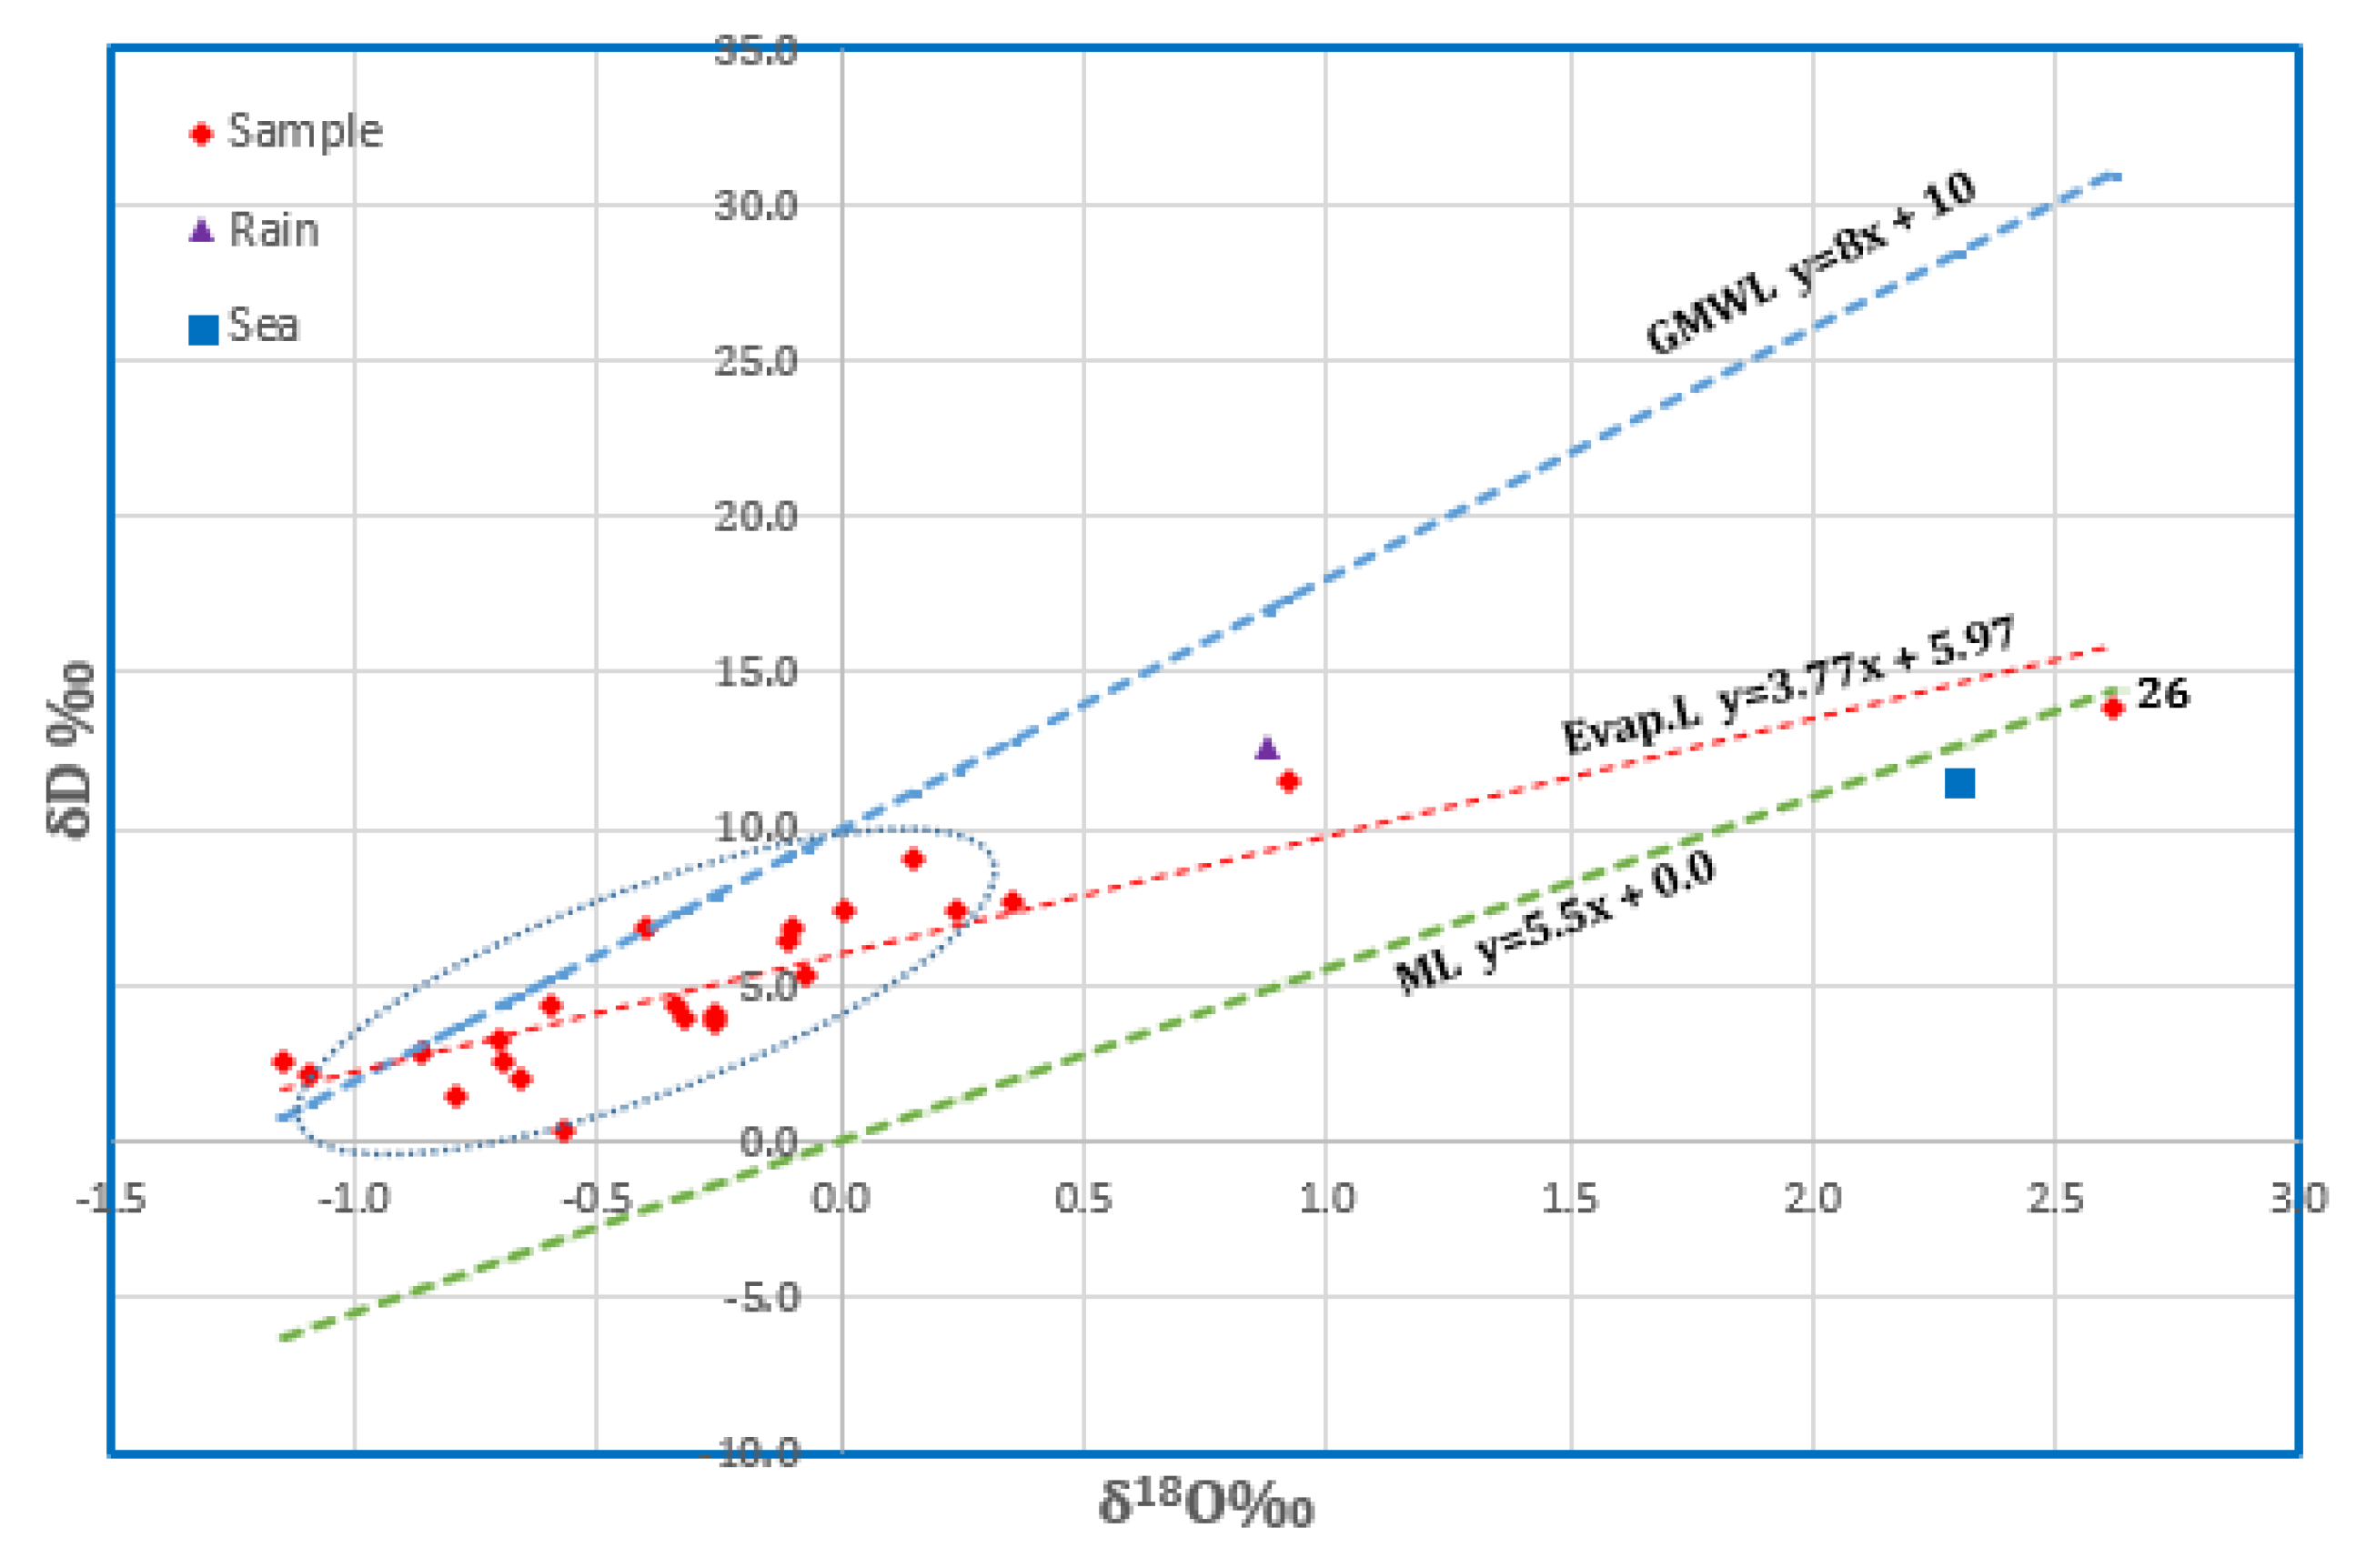
The stable isotopic contents of the studied groundwater varied from −1.15 to 2.62‰ (Avg.−0.21‰) and from 0.32‰ to 13.90‰ (Avg. 5.19‰) for δ18O and δD, respectively (see Table 1). The oxygen-18 vs. deuterium relationship (Figure 12) reveals that a few samples were plotted on the GMWL, while the majority distributed below the meteoric line show depleted values compared with rainwater. The position of the points on the evaporation line that nearly crosses the rainwater point is a reflection of the meteoric origin of such water. The apparent depletion of the isotopic content of these samples probably indicates the mixing between infiltrated water from precipitation and a paleowater component that seeps from the underlying basement aquifer along the lineaments of fault planes and fracture sets. According to [56,57], the water samples will be plotted on a mixing line (ML) described by the equation δD = 5.5 δ18O + 0.0 ‰ if there is a mixing between the groundwater and seawater. It is shown that only one sample (No. 26) was plotted on that line close to the Red Sea sample, reflecting the effect of seawater. However, the lower salinity of this sample (500 mg/L) excludes this hypothesis. The plausible assumption suggests that either the Red Sea spray or the potential change in humidity conditions influences the precipitation compositions.
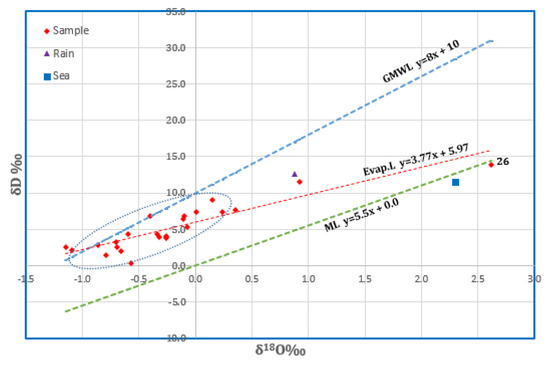
Figure 12.
Plot of δ18O‰ vs. δD‰ for the groundwater samples in Wadi Qanunah basin.
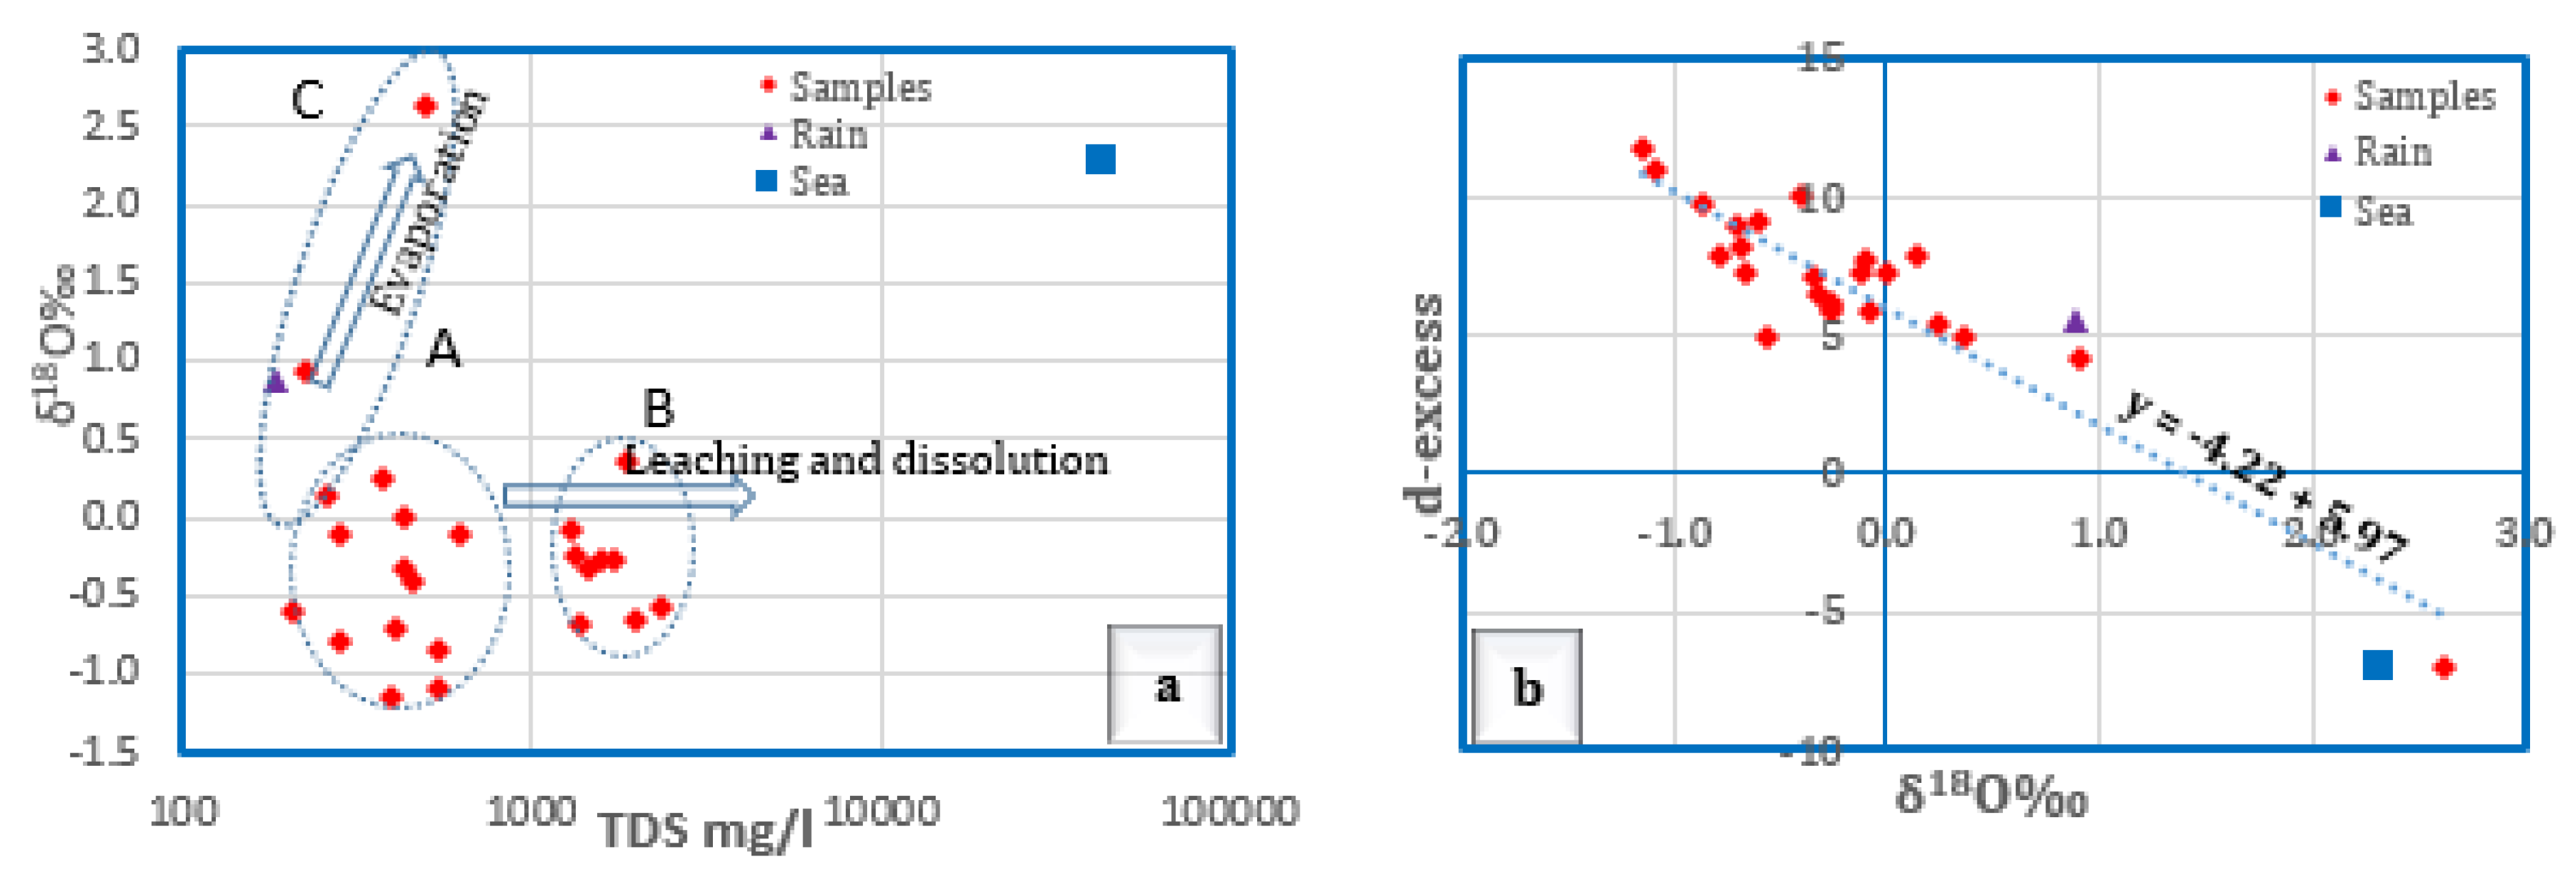
Furthermore, the variation of δ18O‰ composition is correlated with TDS in a bivariate plot to illustrate the processes affecting groundwater. It is shown from (Figure 13a) that most groundwater samples were affected by the leaching and dissolution processes. They can be divided into two groups; group A with a slightly higher salinity (>1000 mg/L) was subjected to evaporation prior to being infiltrated downward to the aquifer, and group B with much lower salinity (<1000 mg/L) was diluted by seepage from the underlying fractured basement aquifer. A few other samples showed the impact of evaporation, and none of the groundwater samples studied were influenced by seawater encroachment.

Figure 13.
TDS vs. δ18O‰ (a) and TDS vs. δ18O‰ (b) for the groundwater in Wadi Qanunah.
The magnitude of the evaporation impact on groundwater is elucidated by plotting the d-excess values (d-excess = δD − 8δ18O) against the δ18O values [58]. The d-excess showed values that ranged from −7.06‰ to 11.80‰ (Avg. 6.84‰). It lies below the d-excess value of the global meteoric water line (10) for almost all the groundwater samples. This indicates that the evaporation process most likely influenced the rainwater before being recharged to groundwater. Local hydrometeorological parameters, such as the source of the vapor mass, re-evaporation during rainfall, and the seasonality of precipitation, influence the local meteoric waters [13]. Figure 13b clarified the negative correlation between δ18O and d-excess indicated by the equation (y = −4.22 + 5.97). This implies that as temperatures rise, the amount of precipitation with lower isotopic composition and higher d-excess values decreases, while the share of warmer precipitation with more positive isotopic composition and lower d-excess values increases [13]. This hypothesis is the case here, since the isotopic content in the local precipitation that feeds groundwater is enriched as a consequence of increasing sub-cloud evaporation with rising temperature, as well as a decrease in the amount of rainfall.
4.7. NETPATH Geochemical Modeling
The groundwater–rock reaction, evaporation and dilution models developed for this study were constrained by the major-ion concentrations (sodium, potassium, magnesium, calcium, carbonate, bicarbonate, sulphate, chloride, strontium and δ18O). Calcite, Ca-montmorillonite, kaolinite, gypsum, dolomite and silica minerals were included as phases in NETPATH models (Table 5). Precipitation or dissolution of any phase along the suggested flow path, as shown in Figure 5, could not be larger than 15 mmol/L in order for the groundwater-rock reaction model simulation to be considered valid [59,60].
Table 5.
WATEQP results for water–rock interactions calculated in mmol/kg (H2O) for well 9. (+) sign means precipitation; (−) sign means dissolution.
The general flow path of groundwater is from northeast to southwest (Figure 5). Sample 9 located downstream in the main channel of Wadi Qanunah was used as a final water, which has been evoluted from rainwater. Chloride and δ18O, along with the other constraints, were applied to calculate the evaporation and/or dilution factor. Saturation indices calculated from WATEQP program indicated that groundwater in site 9 is undersaturated with respect to gypsum and CO2, oversaturated with dolomite and Ca- Montmorillonite, somewhat undersaturated with SiO2 and nearly oversaturated regarding calcite. The calculated log PCO2 is—2.56 atmospheres, which indicates the possibility of CO2 outgassing [17]. The selection of the plausible phases that account for a specific model should be guided by geological, hydrological and geochemical anticipation as well as correlated with the mineral saturation state calculated by WATEQ. At ambient temperature (weathering), some minerals cannot precipitate for thermodynamic reasons [61], for example, biotite, albite and Ca-montmorillonite are expected to be products rather than reactants in this weathering environment [17]. In addition, calcite is also expected to be a product, since the cation exchange played an important role along with carbonate weathering in the enrichment of Ca, as previously stated in the ion relations section. Dolomite and silica saturation indices oscillate between being products or reactants where there are alternative sources of Ca, Mg and SiO2 other than dolomite and silica. Therefore, these findings will help narrow the selection of the models calculated by the Netpath program.
This problem models the groundwater at site 9 as the result of the evaporative concentration of the diluted rainwater influx and the accompanying mineral precipitation. In this issue, the evaporation/dilution factor needed to generate sample 9 water as well as the mass transfer of a specified set of phases are determined using NETPATH. According to the findings, as shown in Table 6, 1.532 kg of water from well 9 would evaporate from 652.85 kg of rainwater that entered the aquifer on average, precipitated 0.13 mmol/kg Ca-mont, 1.67 mmol/kg calcite, and 0.52 mmol/kg CO2. In addition, 0.4 mmol/kgH2O exchange, 0.64 mmol/kgH2O dolomite, 3.26 mmol/kgH2O gypsum, and 0.04 mmol/kgH2O biotite entered the solution (dissolved) at the same time. On the other hand, according to the δ18O calculations, 1.052 kg of the initial sample (rainwater) would be diluted by 1.052 kg of sample 9. This model accounted for the dissolution of 0.89 mmol/kgH2O exchange, 1.3 mmol/kgH2O dolomite, 5.42 mmol/kgH2O gypsum, 0.1 mmol/kgH2O biotite and 0.13 mmol/kg CO2; the precipitation of 0.11 mmol/kg Ca-mont, 2.38 mmol/kg calcite. This hypothesis confirms the possibility of recharge from water with lower isotopic content (fractured basement water), in addition to recharge from rainwater, as described in the stable isotope section.
Table 6.
NETPATH results of mass transfer (mmol/l) and evaporation/dilution factors.
5. Conclusions
- As a result of recent heavy flash floods and groundwater development plans, Wadi Qanunah has received more attention. Flood behavior and groundwater occurrences are influenced by geomorphic and geologic settings as well as climate change.
- The quaternary aquifer is the main source of groundwater for a variety of purposes. The rainfall represents the main recharging source to groundwater in the alluvium aquifer. However, the chemical composition of the precipitation is affected by the sea spray or subjected to evaporation before being infiltrated. Therefore, geochemical characteristics of groundwater were studied to delineate the varies processes impacted groundwater. The results revealed the existence of fresh and brackish water types.
- The heterogeneity of the groundwater chemical composition reflects different processes such as precipitation and dissolution of the minerals interbedded within the aquifer material.
- The principal source of the dissolved chemical species in the groundwater system of the study area was from mineral weathering/dissolution, ion exchange and evaporation process.
- In addition, there are other factors affected groundwater, such as the impact of anthropogenic activities and the recharge from the underlying fractured basement aquifer. Identifying the sources of groundwater recharge, as well as the factors that affected its chemical composition, will enable the decision maker to develop a monitoring and control strategy in order to effectively manage and protect water resources.
Author Contributions
Conceptualization, M.M., M.E.O. and A.A.; methodology, A.A., M.M., M.E.O. and H.E.; software, H.E., M.M. and M.E.O.; validation, M.M., M.E.O., A.A. and H.E.; formal analysis, M.M., M.E.O. and A.A.; investigation, M.M., M.E.O. and H.E.; resources, M.M.; data curation, M.M., M.E.O. and A.A.; writing—original draft preparation, M.M., M.E.O., H.E. and A.A.; writing—review and editing, M.M., M.E.O., H.E. and A.A.; visualization, M.M., M.E.O. and A.A.; supervision, A.A.; project administration, M.M.; funding acquisition, M.M. All authors have read and agreed to the published version of the manuscript.
Funding
The Deanship of Scientific Research (DSR) at King Abdulaziz University (KAU), Jeddah, Saudi Arabia funded this Project under grant no (G:121-123-1443).
Institutional Review Board Statement
Not applicable.
Informed Consent Statement
Not applicable.
Data Availability Statement
All data are provided as tables and figures.
Conflicts of Interest
The authors declare no conflict of interest.
References
- Council on Foreign Relations CFR. Water Stress: A Global Problem That’s Getting Worse. 2022. Available online: https://www.cfr.org/backgrounder/water-stress-global-problem-thats-getting-worse (accessed on 10 November 2022).
- Sun, Z.; Ma, R.; Wang, Y.; Ma, T.; Liu, Y. Using isotopic, hydrogeochemical-tracer and temperature data to characterize recharge and flow paths in a complex karst groundwater flow system in northern China. Hydrogeol. J. 2016, 24, 1393–1412. [Google Scholar] [CrossRef]
- Sreedevi, P.D.; Sreekanth, P.D.; Reddy, D.V. Recharge environment and hydrogeochemical processes of groundwater in a crystalline aquifer in South India. Int. J. Environ. Sci. Technol. 2021, 19, 4839–4856. [Google Scholar] [CrossRef]
- Wright, E.P. The hydrogeology of crystalline basement aquifers in Africa. Geol. Soc. Lond. Spec. Publ. 1992, 66, 1–27. [Google Scholar] [CrossRef]
- Singhal, B.; Gupta, R. Applied Hydrogeology of Fractured Rocks, 2nd ed.; Springer: Berlin/Heidelberg, Germany, 2010. [Google Scholar]
- Gibbs, R.J. Mechanisms controlling world water chemistry. Science 1970, 17, 1088–1090. [Google Scholar] [CrossRef] [PubMed]
- Nosrat, A.; Asghar, A.M. Assessment of groundwater quality and its suitability for drinking and agricultural uses in the Oshnavieh area, northwest of Iran. J. Environ. Prot. 2010, 1, 30–40. [Google Scholar]
- Alqarawy, A.; El Osta, M.; Masoud, M.; Elsayed, S.; Gad, M. Use of Hyperspectral Reflectance and Water Quality Indices to Assess Groundwater Quality for Drinking in Arid Regions, Saudi Arabia. Water 2022, 14, 2311. [Google Scholar] [CrossRef]
- El Osta, M.; Niyazi, B.; Masoud, M. Groundwater evolution and vulnerability in semi-arid regions using modeling and GIS tools for sustainable development: Case study of Wadi Fatimah, Saudi Arabia. Environ Earth Sci. 2022, 81, 248. [Google Scholar] [CrossRef]
- Tijani, M.N.; Abimbola, A.F. Groundwater chemistry and isotope studies of weathered basement aquifer: A case study of OkeOgun area, SW-Nigeria. Afr. Geosci. Rev. 2003, 10, 373–387. [Google Scholar]
- Rosen, M.R.; Jones, S. Controls on the groundwater composition of the Wanaka and Wakatipu basins, Central Otago, New Zealand. Hydrogeol. J. 1998, 6, 264–281. [Google Scholar]
- Roy, A.; Keesari, T.; Mohokar, H.; Pant, D.; Sinha, U.K.; Mendhekar, G.N. Geochemical evolution of groundwater in hard-rock aquifers of South India using statistical and modelling techniques. Hydrol. Sci. J. 2020, 65, 951–968. [Google Scholar] [CrossRef]
- Clark, I.D.; Fritz, P. Environmental Isotopes in Hydrogeology; Lewis Publishers: New York, NY, USA, 1997. [Google Scholar]
- Edmunds, W.; Smedley, P. Residence time indicators in groundwater: The East Midlands Triassic sandstone aquifer. Appl. Geochem. 2000, 15, 737–752. [Google Scholar] [CrossRef]
- Hamed, Y.; Dassi, L.; Tarki, M.; Ahmadi, R.; Mehdi, K.; Dhia, H. Groundwater origins and mixing pattern in the multilayer aquifer system of the Gafsa-south mining district: A chemical and isotopic approach. Environ. Earth Sci. 2011, 63, 1355–1368. [Google Scholar] [CrossRef]
- Marques, J.; Graca, H.; Eggenkamp, H.; Neves, O.; Carreira, P.; Matias, M.; Mayer, B.; Meybeck, M. Global chemical weathering of surficial rocks estimated from river dissolved loads. Am. J. Sci. 1987, 287, 401–428. [Google Scholar] [CrossRef]
- Plummer, L.N.; Prestemon, E.C.; Parkhurst, D.L. An interactive code (NETPATH) for modeling NET geochemical reactions along a flowpath, version 2.0: U.S. Geological Survey. Water Resour. Investig. Rep. 1994, 94, 4169. [Google Scholar] [CrossRef]
- Prinz, W.C. Geologic Map of the Al Qunfudah Quadrangle, Sheet 19 E, Kingdom of Saudi Arabia; Ministry of Petroleum and Mineral Resources, Deputy Ministry for Mineral Resources: Riyadh, Saudi Arabia, 1983; GM-70, scale 1: 250,000. [Google Scholar]
- Greenwood, W.R. Geology of the Jabal Shada Quadrangle, Sheet 19-41A, Kingdom of Saudi Arabia; Ministry of Petroleum and Mineral Resources: Riyadh, Saudi Arabia, 1975; Geologic map GM-20; 10p, Scale 1:100,000. [Google Scholar]
- Greenwood, W.R. Geology of the Biljurashi Quadrangle, Sheet 19-41B, Kingdom of Saudi Arabia; Ministry of Petroleum and Mineral Resources: Riyadh, Saudi Arabia, 1975; Geologic map GM-25; 31p, Scale 1:100,000. [Google Scholar]
- Masoud, M.H. Geoinformatics application for assessing the morphometric characteristics’ effect on hydrological response at watershed (case study of Wadi Qanunah, Saudi Arabia). Arab. J. Geosci. 2016, 9, 280. [Google Scholar] [CrossRef]
- Rainwater, F.; Thatcher, L. Methods for Collection and Analysis of Water Samples; U.S. Geological Survey Water Supply: Denver, CO, USA, 1960; p. 301. [Google Scholar]
- Fishman, J.; Friedman, C. Book 5, Chapter A1. Open File Report 85-495. In Methods for Determination of Inorganic Substances in Water and Fluvial Sediments; U.S. Geological Survey: Denver, CO, USA, 1985. [Google Scholar]
- American Society for Testing and Materials (A.S.T.M). Section 11—Water and Environmental Technology. In Annual Book of ASTM Standards, USA; American Society for Testing and Materials: West Conshohocken, PA, USA, 2002; Volumes 11.01 and 11.02. [Google Scholar]
- Coplen, T.B. Reporting of stable hydrogen carbon and oxygen isotopic abundances. Pure Appl. Chem. 1994, 66, 273–276. [Google Scholar] [CrossRef]
- Karo, E.; Marandi, A.; Vaikmae, R. The Origin of Increased Salinity in the Cambrian-Vendian Aquifer System on the Kopli Peninsula Northern Estonia. Hydrogeol. J. 2004, 12, 424–435. [Google Scholar] [CrossRef]
- Lee, J.-Y.; Song, S.-H. Groundwater chemistry and ionic ratios in a western coastal aquifer of Buan, Korea: Implication for seawater intrusion. Geosci. J. 2007, 11, 259–270. [Google Scholar] [CrossRef]
- Piper, A.M. A graphical procedure in the geochemical interpretation of water analysis. Am. Geophys. Union Trans. 1944, 25, 914–928. [Google Scholar] [CrossRef]
- Ward, H. Hierarchical grouping to optimize an objective function. J. Am. Stat. Assoc. 1963, 69, 236–244. [Google Scholar] [CrossRef]
- Usunoff, E.J.; Guzmán-Guzmán, A. Multivariate analysis in hydrochemistry: An example of the use of factor and correspondence analyses. Ground Water 1989, 27, 27–34. [Google Scholar] [CrossRef]
- Melloul, A.; Collin, M. The ‘principal components’ statistical method as a complementary approach to geochemical methods in water quality factor identification; Application to the Coastal Plain aquifer of Israel. J. Hydrol. 1992, 140, 49–73. [Google Scholar] [CrossRef]
- Gupta, A.K.; Gupta, S.K.; Patil, R.S. Statistical analyses of coastal water quality for a port and harbour region in India. Environ. Monit. Asses. 2005, 102, 179–200. [Google Scholar] [CrossRef] [PubMed]
- Zeng, X.; Rasmussen, T.C. Multivariate Statistical Characterization of Water Quality in Lake Lanier in Georgia, USA. J. Environ. Qual. 2005, 34, 1980–1991. [Google Scholar] [CrossRef] [PubMed]
- Craig, H. Isotopic Variations in Meteoric Waters. Science 1961, 133, 1702–1703. [Google Scholar] [CrossRef]
- Truesdell, A.H.; Jone, B.F. WATEQ, a computer program for calculating chemical equilibria of natural waters. J. Res. US Geol. Surv. 1974, 2, 233–248. [Google Scholar]
- Sharaf, M.; Alyamani, M.; Subyani, A. Regional Study of the Rare and Trace Elements in the Groundwater of the Major Wadi Basins (An Numan, Usfan, and Fatimah) in Western Saudi Arabia and Their Suitability for Various Purposes; Project No. (204/423); King Abdulaziz University: Jeddah, Saudi Arabia, 2004. [Google Scholar]
- Al-Gadi, K.; Al-Doaan, M. Seawater Intrusion into Groundwater Costal Aquifers at Al- Qunfudah Province, Western Saudi Arabia. Multi-Knowl. Electron. Compr. J. Educ. Sci. Publ. 2020, 31. [Google Scholar]
- Freeze, R.; Cherry, J. Groundwater; Prentice Hall Inc.: Englewood Cliffs, NJ, USA, 1979; p. 604. [Google Scholar]
- Langmuir, D. Aqueous Environmental Geochemistry; Prentice Hall: Upper Saddle, River, NJ, USA, 1997. [Google Scholar]
- IAEA. Global Network of Isotopes in Precipitation (GNIP); IAEA: Vienna, Austria, 2019. [Google Scholar]
- Wannous, M.; Jahnke, C.; Troeger, U.; Falk, M.; Bauer, F. Hydrochemistry and environmental isotopes (18O, 2H, 3H, 3He/4He) of groundwater and foodwater in the great area of Hurghada, Eastern Desert of Egypt. Environ. Earth Sci. 2021, 80, 407. [Google Scholar] [CrossRef]
- He, J.; Ma, J.; Zhang, P.; Tian, L.; Zhu, G.; Edmunds, W.M. Groundwater recharge environments and hydrogeochemical evolution in the Jiuquan Basin, Northwest China. J. Appl. Geochem. 2012, 27, 866–878. [Google Scholar] [CrossRef]
- Fuoco, I.; De Rosa, R.; Barca, D.; Figoli, A.; Gabriele, B.; Apollaro, C. Arsenic polluted waters: Application of geochemical modelling as a tool to understand the release and fate of the pollutant in crystalline aquifers. J. Environ. Manag. 2022, 301, 113796. [Google Scholar] [CrossRef]
- Hidalgo, M.C. Estudio Hidroquimico del Acuifero de Baza-Cailes (Provinica de Granada). Ph.D. Thesis, University of Granada, Granada, Spain, 1993. [Google Scholar]
- Hem, J.D. Study and Interpretation of Chemical Characteristics of Natural Waters, 3rd ed.; US Geological Survey Water Supply Paper 2254; US Geological Survey Water Supply: Denver, CO, USA, 1989. [Google Scholar]
- Magaritz, M.; Nadler, A.; Koyumdjesky, H.; Dan, J. The use of Na/Cl ratios to trace solutesources in a semiarid zone. Water Resour. Res. 1981, 12, 602608. [Google Scholar]
- Dixon, W.; Chiswell, B. The use of hydrochemical sections to identify recharge areas and saline intrusions in alluvial aquifers, outheast Queensland, Australia. J. Hydrol. 1992, 135, 259–274. [Google Scholar] [CrossRef]
- Petrides, B.; Cartwright, I. The hydrogeology and hydrogeochemistry of the Barwon Downs Graben aquifer, southwestern Victoria, Australia. Hydrogeol. J. 2006, 14, 809–826. [Google Scholar] [CrossRef]
- Hounslow, A. Water Quality Data: Analysis and Interpretation; CRC Press: Boca Raton, FL, USA, 1995; 416p. [Google Scholar] [CrossRef]
- Meybeck, M. Note on dissolved elemental contents of the Zaire River. Neth. J. Sea Res. 1978, 12, 293–295. [Google Scholar] [CrossRef]
- Schoeller, H. Qualitative evaluation of groundwater resources. In Methods and Techniques of Ground-Water Investigations and Development; UNESCO: Paris, France, 1965; pp. 54–83. [Google Scholar]
- Schoeller, H. Chapter 15—Geochemistry of groundwater. In Groundwater Studies—An International Guide for Research and Practice; UNESCO: Paris, France, 1977; pp. 1–18. [Google Scholar]
- Langguth, H.R. Groundwater Verhaltisse in Bereiech Des Velberter Sattles; Der Minister Fur Eraehrung, Land Wirtsch Forste Duesseldorf: Duesseldorf, Germany, 1966; p. 127. [Google Scholar]
- Kaiser, H.F. Application of electronic computers to factor analysis. Educ. Psychol. Meas. 1960, 20, 141–151. [Google Scholar] [CrossRef]
- Yidana, S.M.; Ophori, D.; Banoeng-Yakubo, B.; Samed, A.A. A factor model to explain the hydrochemistry and causes of fluoride enrichment in groundwater from the middle voltaian sedimentary aquifers in the Northern Region. ARPN-JEAS 2012, 7, 50–68. [Google Scholar]
- Olive, P. Introduction to the Geochemistry of Continental Waters; Print Book, French; Editura Didactica şi Pedagogica: Bucharest, Romania, 1996; 126p. [Google Scholar]
- Apollaro, C.; Tripodi, V.; Vespasiano, G.; De Rosa, R.; Dotsika, E.; Fuoco, I.; Critelli, S.; Muto, F. Chemical, isotopic and geotectonic relations of the warm and cold waters of the Galatro and Antonimina thermal areas, southern Calabria, Italy. Mar. Pet. Geol. 2019, 109, 469–483. [Google Scholar] [CrossRef]
- Dansgaard, W. Stable isotopes in precipitation. Tellus 1964, 16, 436–468. [Google Scholar] [CrossRef]
- Diadin, D.; Vystavna, Y. Long-term meteorological data and isotopic composition in precipitation, surface water and groundwater revealed hydrologic sensitivity to climate change in East Ukraine. Isot. Environ. Health Stud. 2020, 56, 136–148. [Google Scholar] [CrossRef]
- Hershey, R.L.; Heilweil, V.M.; Gardner, P.; Lyles, B.; Earman, S.; Thomas, J.; Lundmark, K.W. Ground-Water Chemistry Interpretations Supporting the Basin and Range Regional Carbonate-Rock Aquifer System (BARCAS) Study, Eastern Nevada and Western Utah; DHS Publication No. 41230; Desert Research Institute: Reno, NV, USA, 2007. [Google Scholar]
- Fuoco, I.; Marini, L.; De Rosa, R.; Figoli, A.; Gabriele, B.; Apollaro, C. Use of reaction path modelling to investigate the evolution of water chemistry in shallow to deep crystalline aquifers with a special focus on fluoride. Sci. Total Environ. 2022, 830, 154566. [Google Scholar] [CrossRef]


Disclaimer/Publisher’s Note: The statements, opinions and data contained in all publications are solely those of the individual author(s) and contributor(s) and not of MDPI and/or the editor(s). MDPI and/or the editor(s) disclaim responsibility for any injury to people or property resulting from any ideas, methods, instructions or products referred to in the content. |
© 2023 by the authors. Licensee MDPI, Basel, Switzerland. This article is an open access article distributed under the terms and conditions of the Creative Commons Attribution (CC BY) license (https://creativecommons.org/licenses/by/4.0/).