1. Introduction and Literature Review
The world has experienced a rapid globalization, resulting in an increase in construction projects such as housing, shopping centers, educational institutions, hospitals, office buildings, and facilities [
1]. This situation has caused many environmental impacts around urban areas, such as the urban heat island effect [
2,
3], which negatively affects human comfort and health, especially in outdoor areas, and leads to an urban energy management problem [
3] and problems with natural wind flow [
4,
5]. Studies suggest that vegetation, such as trees and shrubs, can induce thermal comfort [
6], but the extents to which different amounts and types of vegetation can induce thermal comfort are still under exploration. Furthermore, adding vegetation to the built environment may increase construction and maintenance costs [
7]. Thus, the eco-efficiency of these plants may be needed to convince stakeholders to find ways to create livable and sustainable environments. This study aimed to explore the basic eco-efficiency of plants in an urban space for thermal comfort.
This study combines theories and evidence on how healthy plants can efficiently increase thermal comfort in an urban environment. It can be divided into three topics: urbanization, thermal comfort, and human health; thermal comfort as an ecosystem service of urban vegetation; and the concept of eco-efficiency.
1.1. Urbanization, Thermal Comfort, and Human Health
Globally, cities are expanding. The percentage of urban population in the world has risen from 28.3% in 1950 to 50% in 2010. By 2050, nearly 70% of the world’s population will reside in urban areas. Urban environments usually consist mainly of impervious surfaces and inorganic construction materials, which can make the temperature of the surrounding microclimates more extreme. This phenomenon is known as the urban heat/cold island effect. These temperature changes may affect how comfortable humans feel when they are living in such spaces, i.e., their thermal comfort [
8].
Several indices measure people’s thermal comfort level. One of the popular indicators is the physiologically equivalent temperature (PET). According to Blazejczyk et al.’s study [
9], PET values can be calculated based on four environmental factors: air temperature (Ta), relative humidity (RH), wind speed (Vw), and solar radiation (S). These fundamental factors, when translated to human comfort, constantly change over time, and vary across seasons. For example, Matzarakis et al. [
10] found that the comfortable temperature in Greece is between 18 and 23 °C, while Srivanit and Auttarat [
11] found that the comfort range of people in Chiang Mai was 23.1–31.0 °C. Relative humidity and wind speed must also be suitable for human comfort. Auliciems and Szokolay [
12] found that the human sense of satisfaction with the wind speed was 0.25–0.50 m/s. The sun’s radiation is often understood as only sunlight, but there are also other radiation and electromagnetic waves which may cause glare, irritation, and discomfort [
13,
14].
However, PET lacks human components that are crucial to understand an individual’s comfort. Thus, another index has been introduced: the predicted mean vote (PMV). PMV values consider human component variables, such as the metabolic rate of the body, clothing, and human activities, that are performed at that time, in addition to the four factors offered by PET [
15,
16]. Few studies have compared or suggested which indices best predict thermal comfort; however, these two indices have been used continuously in previous studies to determine thermal comfort levels in the environment, both in simulations and physical sites [
17,
18].
From a project development perspective, outdoor thermal comfort is essential for the design of real estate and urban development projects, as it allows more people to use the space for its intended purposes [
19]. However, outdoor thermal comfort is directly related to the health and well-being of people who use the spaces. Lower temperature, especially when combined with high humidity, make people more susceptible to respiratory illnesses such as colds and pneumonia [
20]. A higher temperature than humans are comfortable with may make people susceptible to heat stroke and dehydration, which may lead to death [
21]. These are serious issues, especially in the vulnerable populations such as toddlers and older adults who may be less perceptive of their environmental conditions and more vulnerable to extreme temperatures [
22]. Furthermore, outdoor thermal comfort encourages people to spend time outdoors, which offers them other environmental co-benefits such as vitamin D secretion, serotonin secretion, lower risk of depression, and psychological well-being [
23].
1.2. Thermal Comfort as an Ecosystem Service of Urban Vegetation
Adding plants is one of the few ways to manipulate outdoor thermal comfort levels in the urban environments [
24]. As described in one study, adding a tree can reduce the temperature by up to three degrees Celsius [
25]. In another, the temperature from a vegetated surface was significantly lower than from a concrete surface [
26]. Another study observed that trees can also reduce the urban cold island effect [
27]. The temperature changes from plants are partially due to evapotranspiration [
28,
29]. For larger plants, the absorption, refraction, and obstruction of sunlight by their leaves can create shade and lower direct solar radiation [
30].
Urban vegetation also provides other ecosystem services such as increasing property values, providing attractive activity spaces for urban development, or managing stormwater [
31]. Studies have suggested that neighborhoods with more trees and accessible green spaces are associated with better health and well-being for all the population [
32].
However, urban vegetation requires resources. The installation and maintenance of urban plants, such as street trees or shrubs, require budgeting. Furthermore, urban vegetation requires space, which can be limited in the urban environment [
33]. These issues mean that too little urban vegetation may provide insufficient benefits, but too much of it may mean that the costs outweigh the benefits. Another design question to consider is the vegetation types. While shrubs take up less space and have relatively lower risks of causing injuries than trees, trees are taller and may provide more ecosystem services due to their biomass [
34]. As a result of these challenges, designers and decision makers need to understand the extent to which different kinds and levels of vegetation may impact the thermal comfort of an urban space, aside from other possible ecosystem services.
1.3. The Concept of Eco-Efficiency
The concept of eco-efficiency originated from the need to create a sustainable industrial development concept. The idea was presented by the World Business Council for Sustainable Development (WBCSD) and was accepted internationally. Eco-efficiency is derived from ecology, economy, and efficiency and is a theoretical principle applied to many industrial enterprises so economic development is coupled with sustainable development. WBCSD officially states that eco-efficiency is a competition in production and service capabilities to meet human needs and bring about a better quality of life while keeping awareness of the impact on ecosystems and natural resources [
35].
Huppes and Ishikawa’s [
36] study presents four calculation methods for eco-efficiency as follows: (1) environmental productivity: eco-efficiency defines the ratio of product value to its environmental impact, (2) environmental intensity: eco-efficiency defines the ratio of its environmental impact to the unit of product value, (3) environmental improvement cost: eco-efficiency defines the ratio of the value of the product to the unit expense of the environmental improvements, and (4) environmental cost-effectiveness: eco-efficiency defines the ratio of environmental improvement cost per unit of production.
Initial investigations revealed that eco-efficiency has been employed to measure the effectiveness of outdoor comfort indices [
37]. However, there are a few examples of utilizing PET as a representative for eco-efficiency calculations, but it still exists in the Reconciling Adaptation, Mitigation and Sustainable Development for Cities (RAMSES) report [
38]. In this study, the focus will be on studying the efficiency of the design by simulating a change in the study site. Using Concept 3 (the environmental improvement cost eco−efficiency) from Huppes and Ishikawa [
36], one can calculate the balance of environment and cost very well (Equation (1)).
Simply put, the more benefits (environmental improvement) we gain, and the less costs we incur, the higher the eco-efficiency will be.
Thus, this study explored the following question: what levels of eco-efficiency can trees and shrubs provide regarding the thermal comfort level? This study on the eco-efficiency of trees concerning outdoor comfort was to test design options by simulating scenarios in ENVI-met 4.4.5 using PET and plant costs to determine the most efficient alternative with the highest eco-efficiency to achieve outdoor thermal comfort development and use it as one design approach for further project development.
This study simulated the change in open space by inserting trees into the ENVI-met program. The objective was to study how the number and type of plants affect the PET. The researchers used two types of plants: shrubs and trees. The methodology will be explained in the next section.
2. Methodology
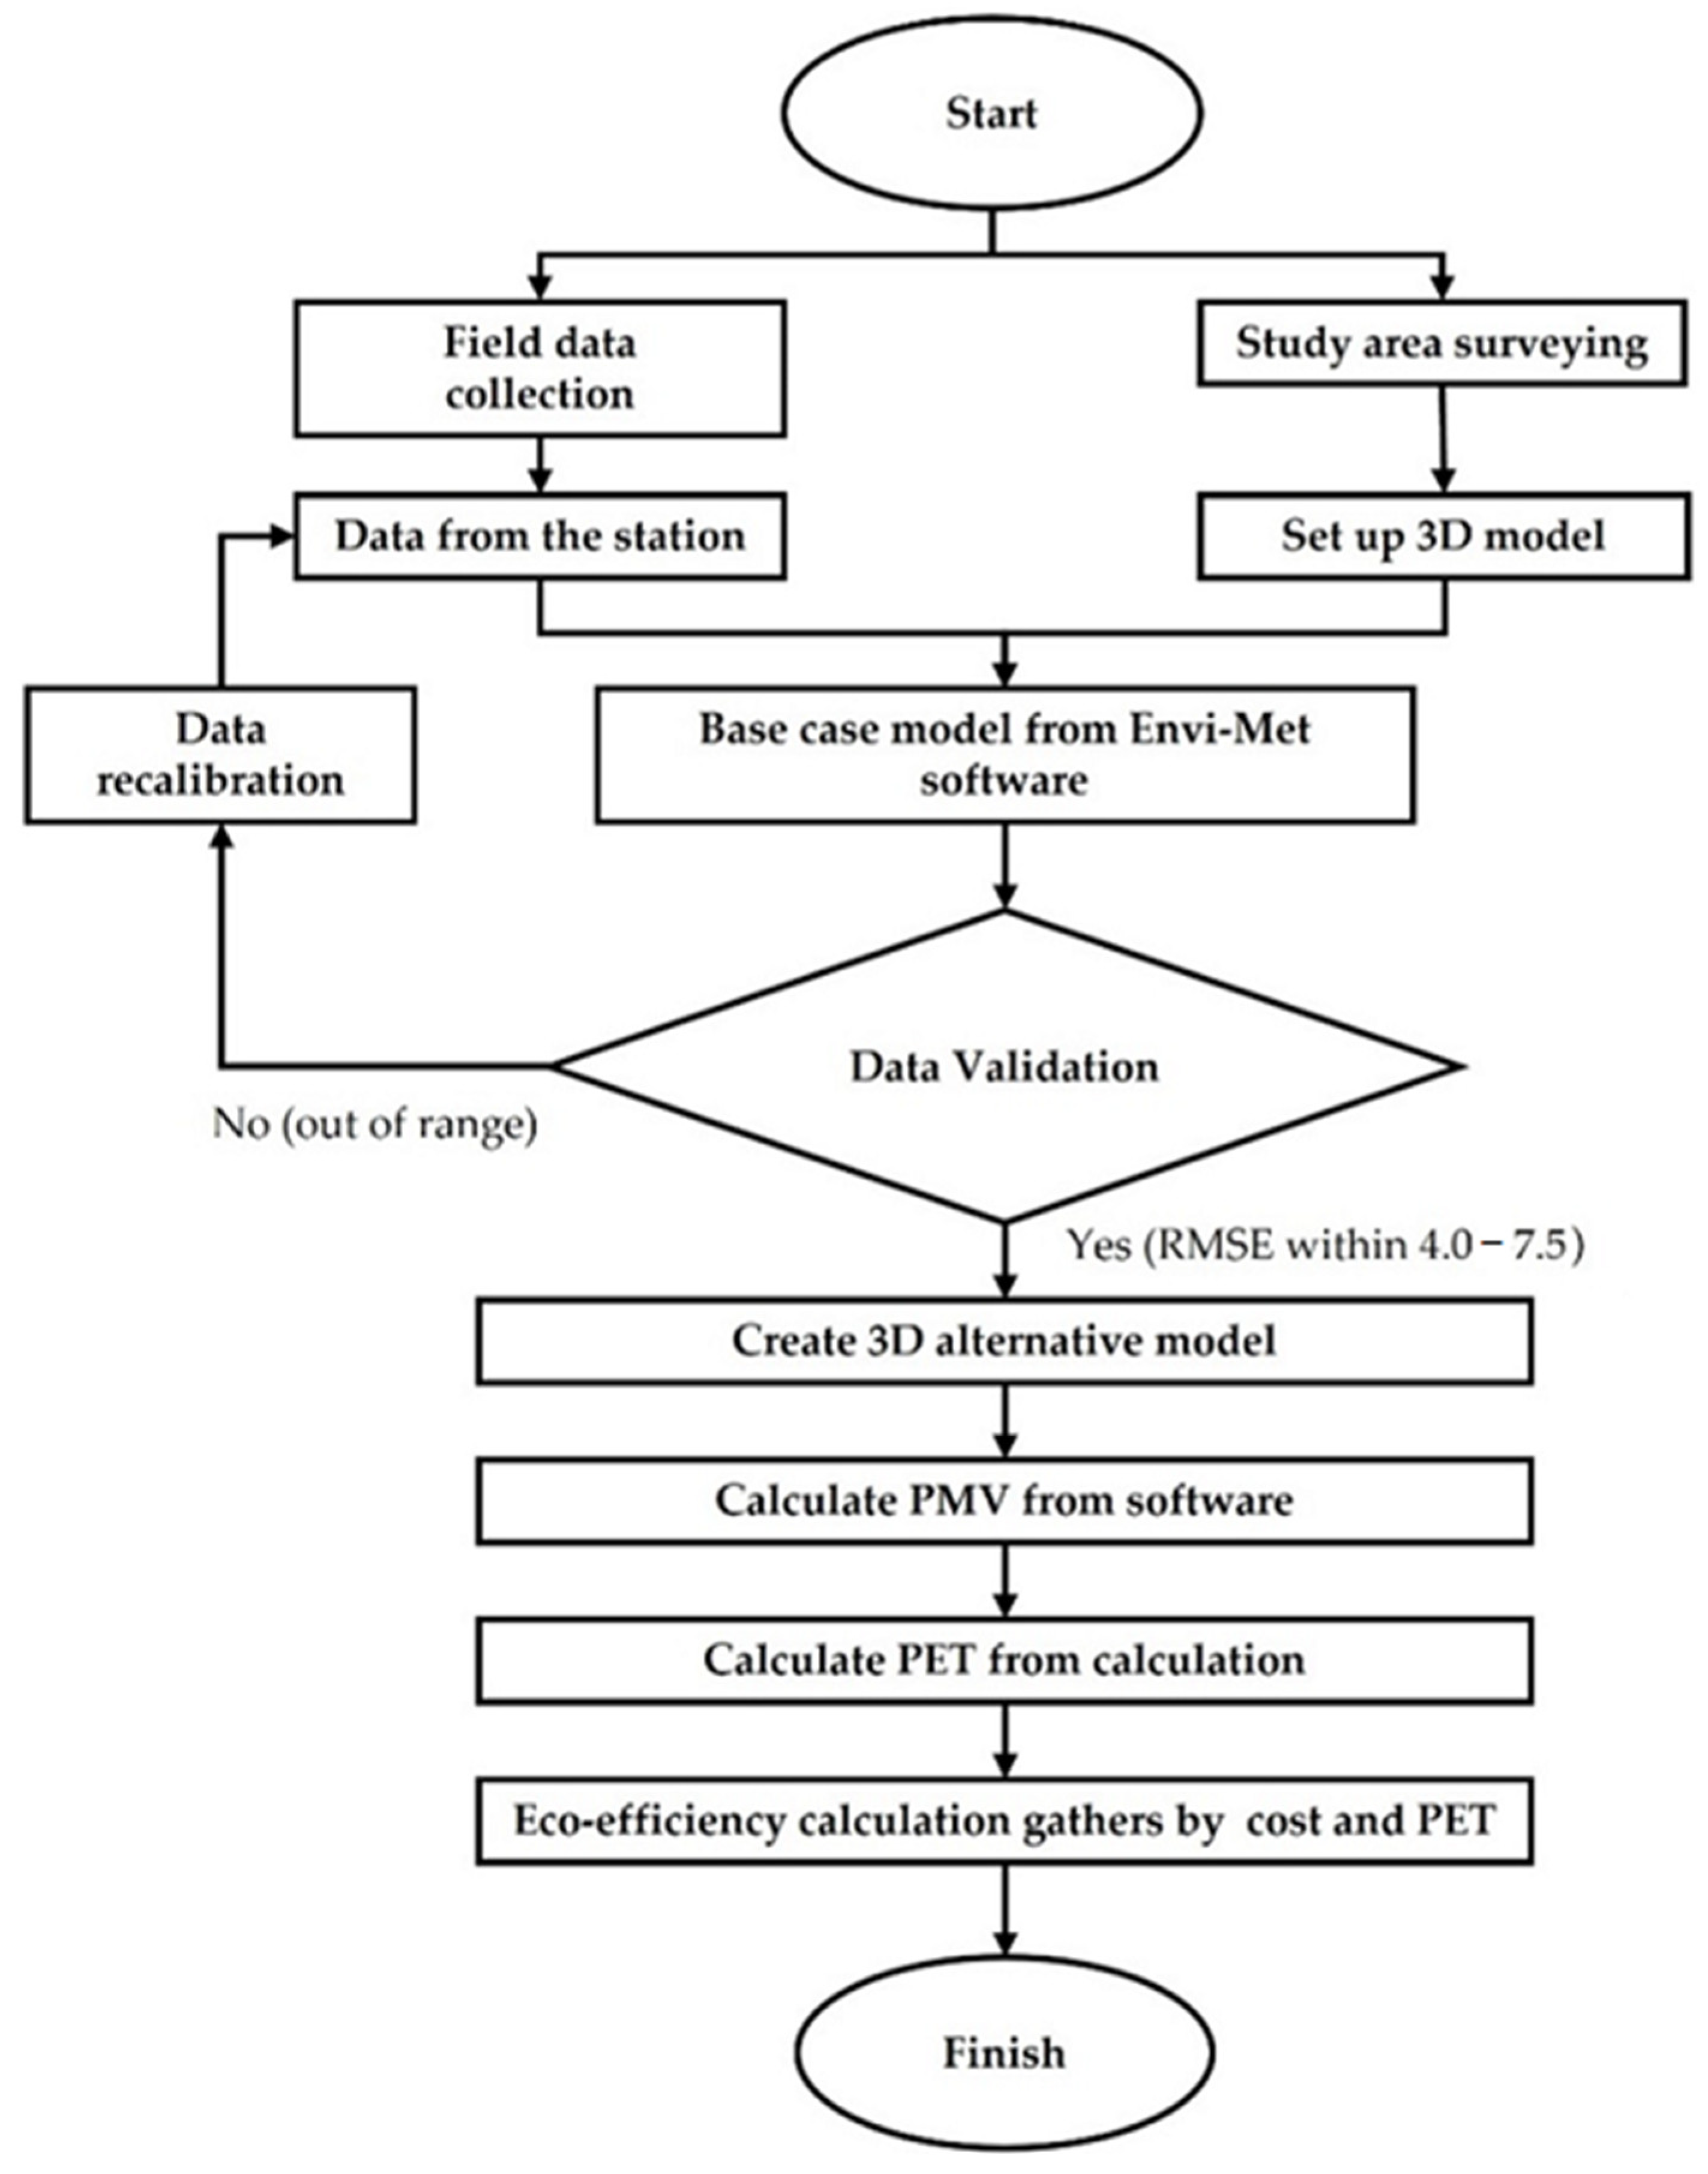
The research methodology involved two data collection procedures: the field data collected from the study location and secondary data retrieved from the measurement station. After collecting data, the data from the station must be calibrated as close to the field data as possible until it is within an acceptable range. After the calibration process, a base case model was created to be used to compare alternative models and further analyze the results. The process can be shown in
Figure 1 and the description of each process is explained below.
2.1. Field Data Collection
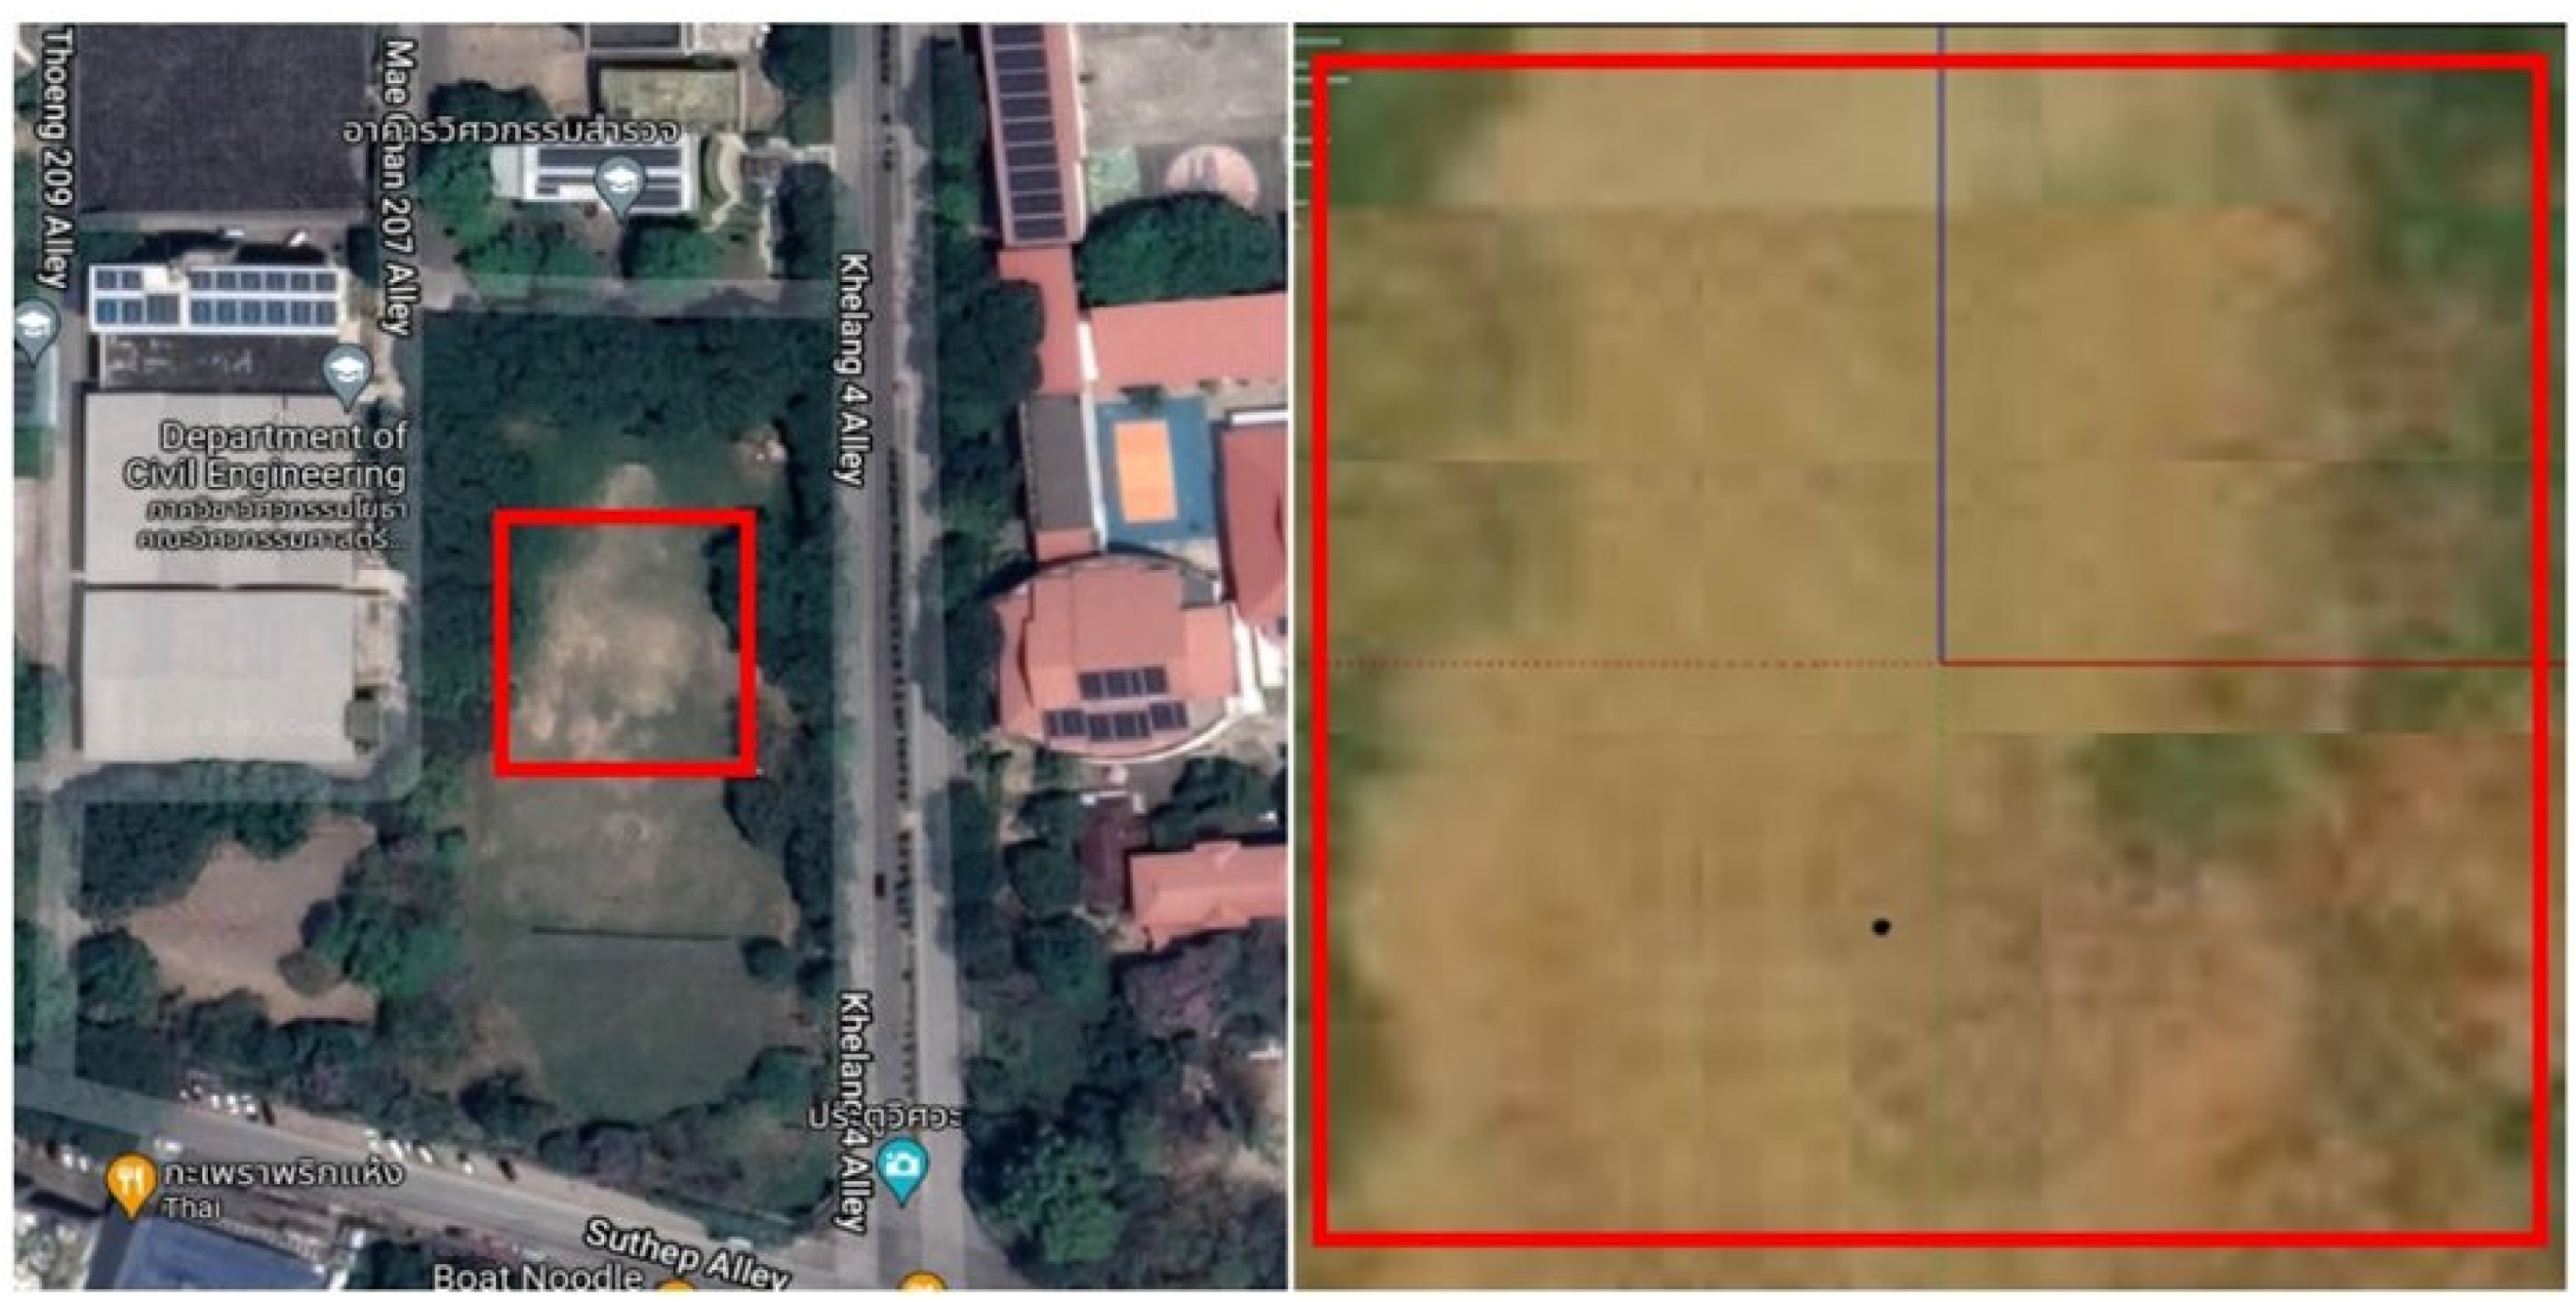
In this process, a hockey field from the Faculty of Engineering, Chiang Mai University was surveyed and selected as the research area because it is an open space without trees and shrubs. This site is located in Chiang Mai, which is located in Aw/Af climate zone of the Köppen climate classification (the tropical wet and dry climate zone) [
39]. This study set the scope of the area to 50 × 50 m to make it suitable for modeling in the ENVI-met program with a ratio of 1:1. The study area can be seen in
Figure 2.
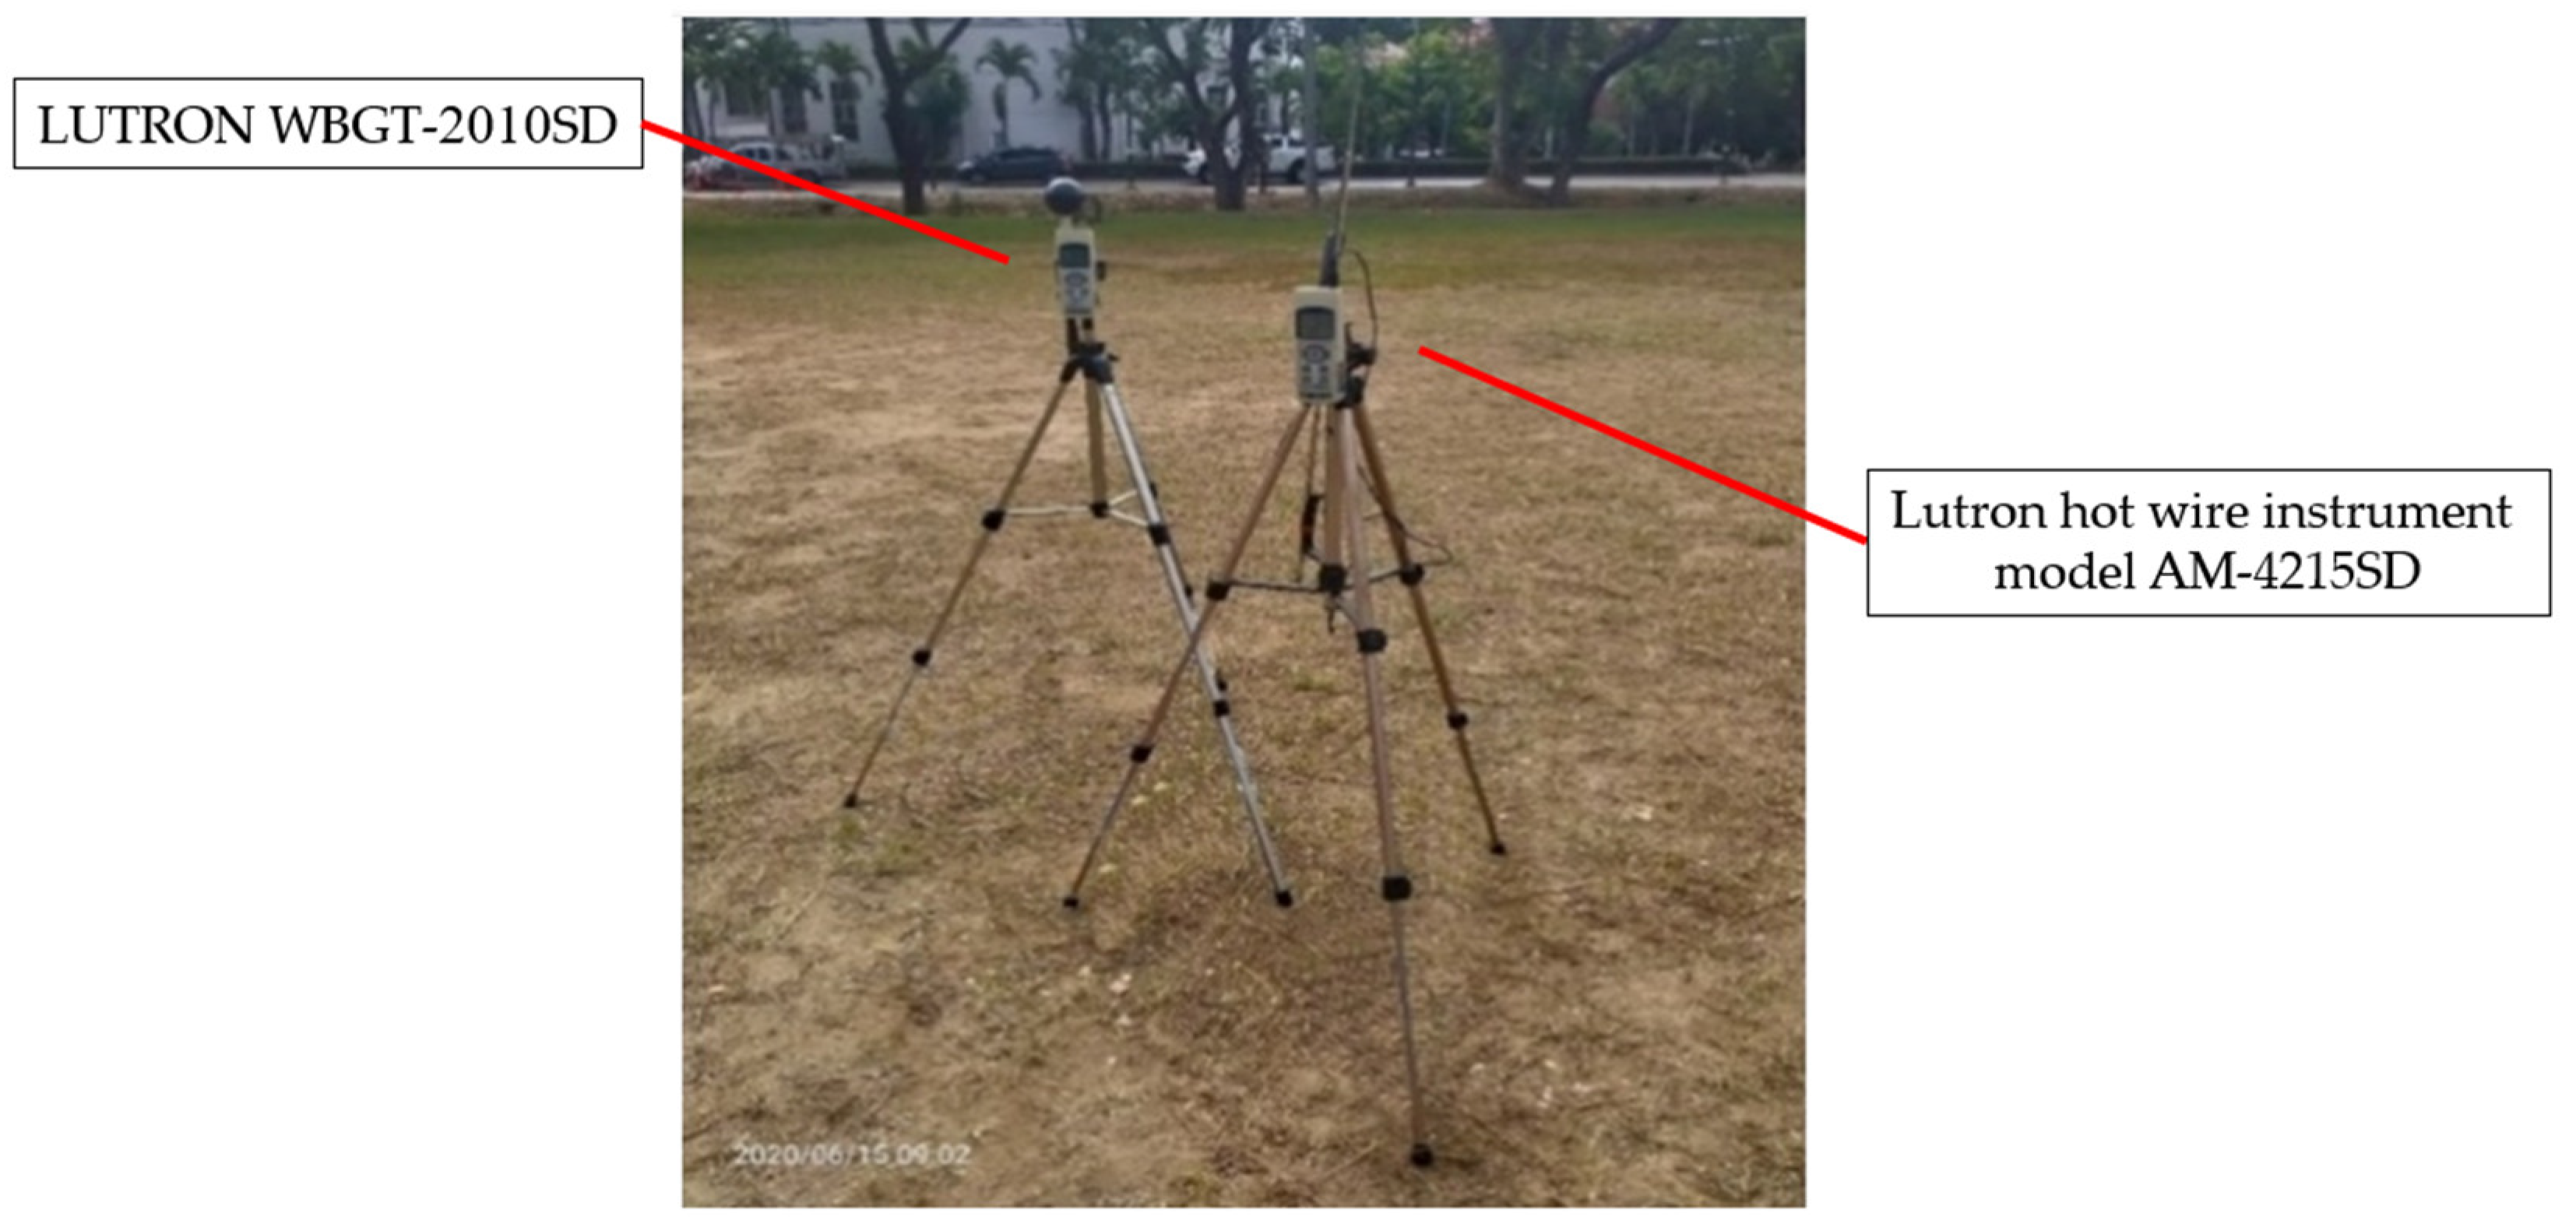
This study collected field data during the late summer in Thailand: 16–17 June 2020, from 9:00 a.m. to 3:00 p.m. Field data were collected with a LUTRON WBGT-2010 SD instrument for measuring air temperature (measurement accuracy of ±0.8 °C) and relative humidity (measurement accuracy of ± 3% RH) [
40]. The wind speed data were collected from a Lutron hot wire instrument model AM-4215 SD (measurement accuracy of ± 5% + 0.1 m/s, acquired from the product manual). This study also collected data from the Meteorological Department on the same day and time and prepared the data for calibration. The location of instruments was set in the study area, as shown in
Figure 3.
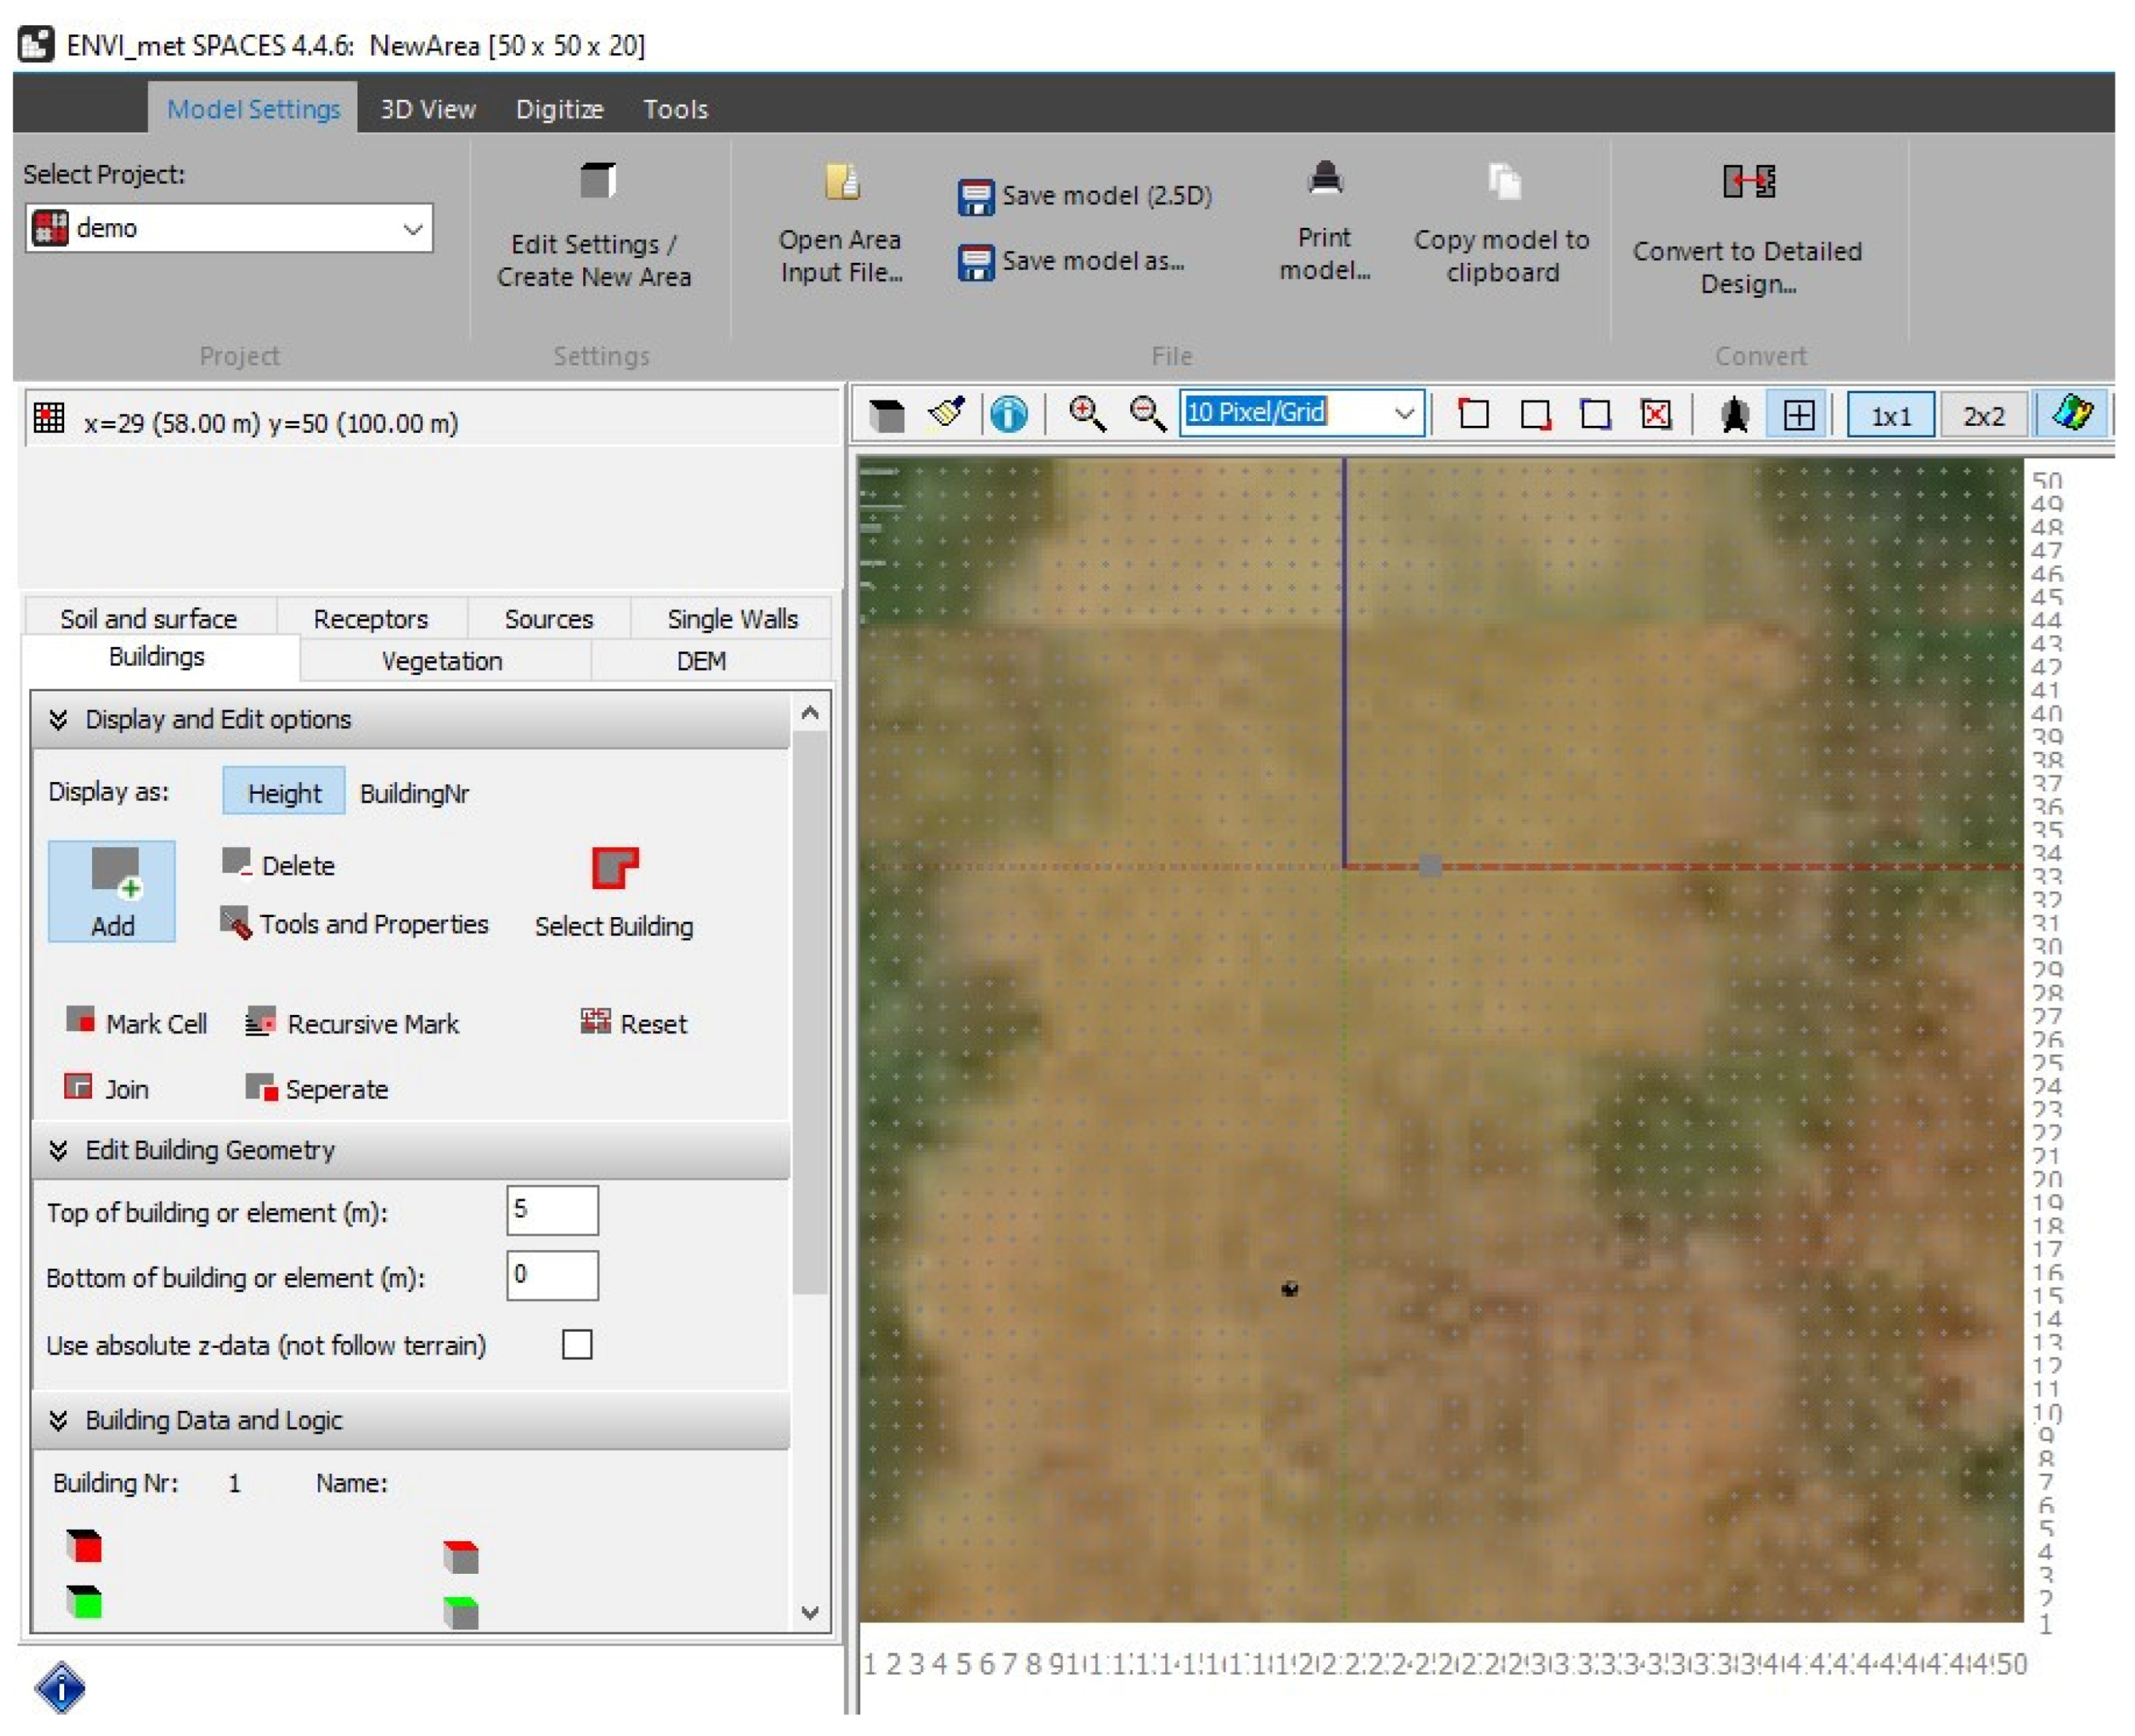
A base case model was created in ENVI-met 4.4.5 using calibrated field data compared with data from the Meteorological Department. An example of data input into ENVI-met is shown in
Figure 4.
The variables imported into the program were air temperature, relative humidity, wind speed, and wind direction for calculating the mean radiant temperature (Tmrt) values and the physiological equivalent temperature (PET) from the program.
2.2. Plant Selection and Cost Calculation
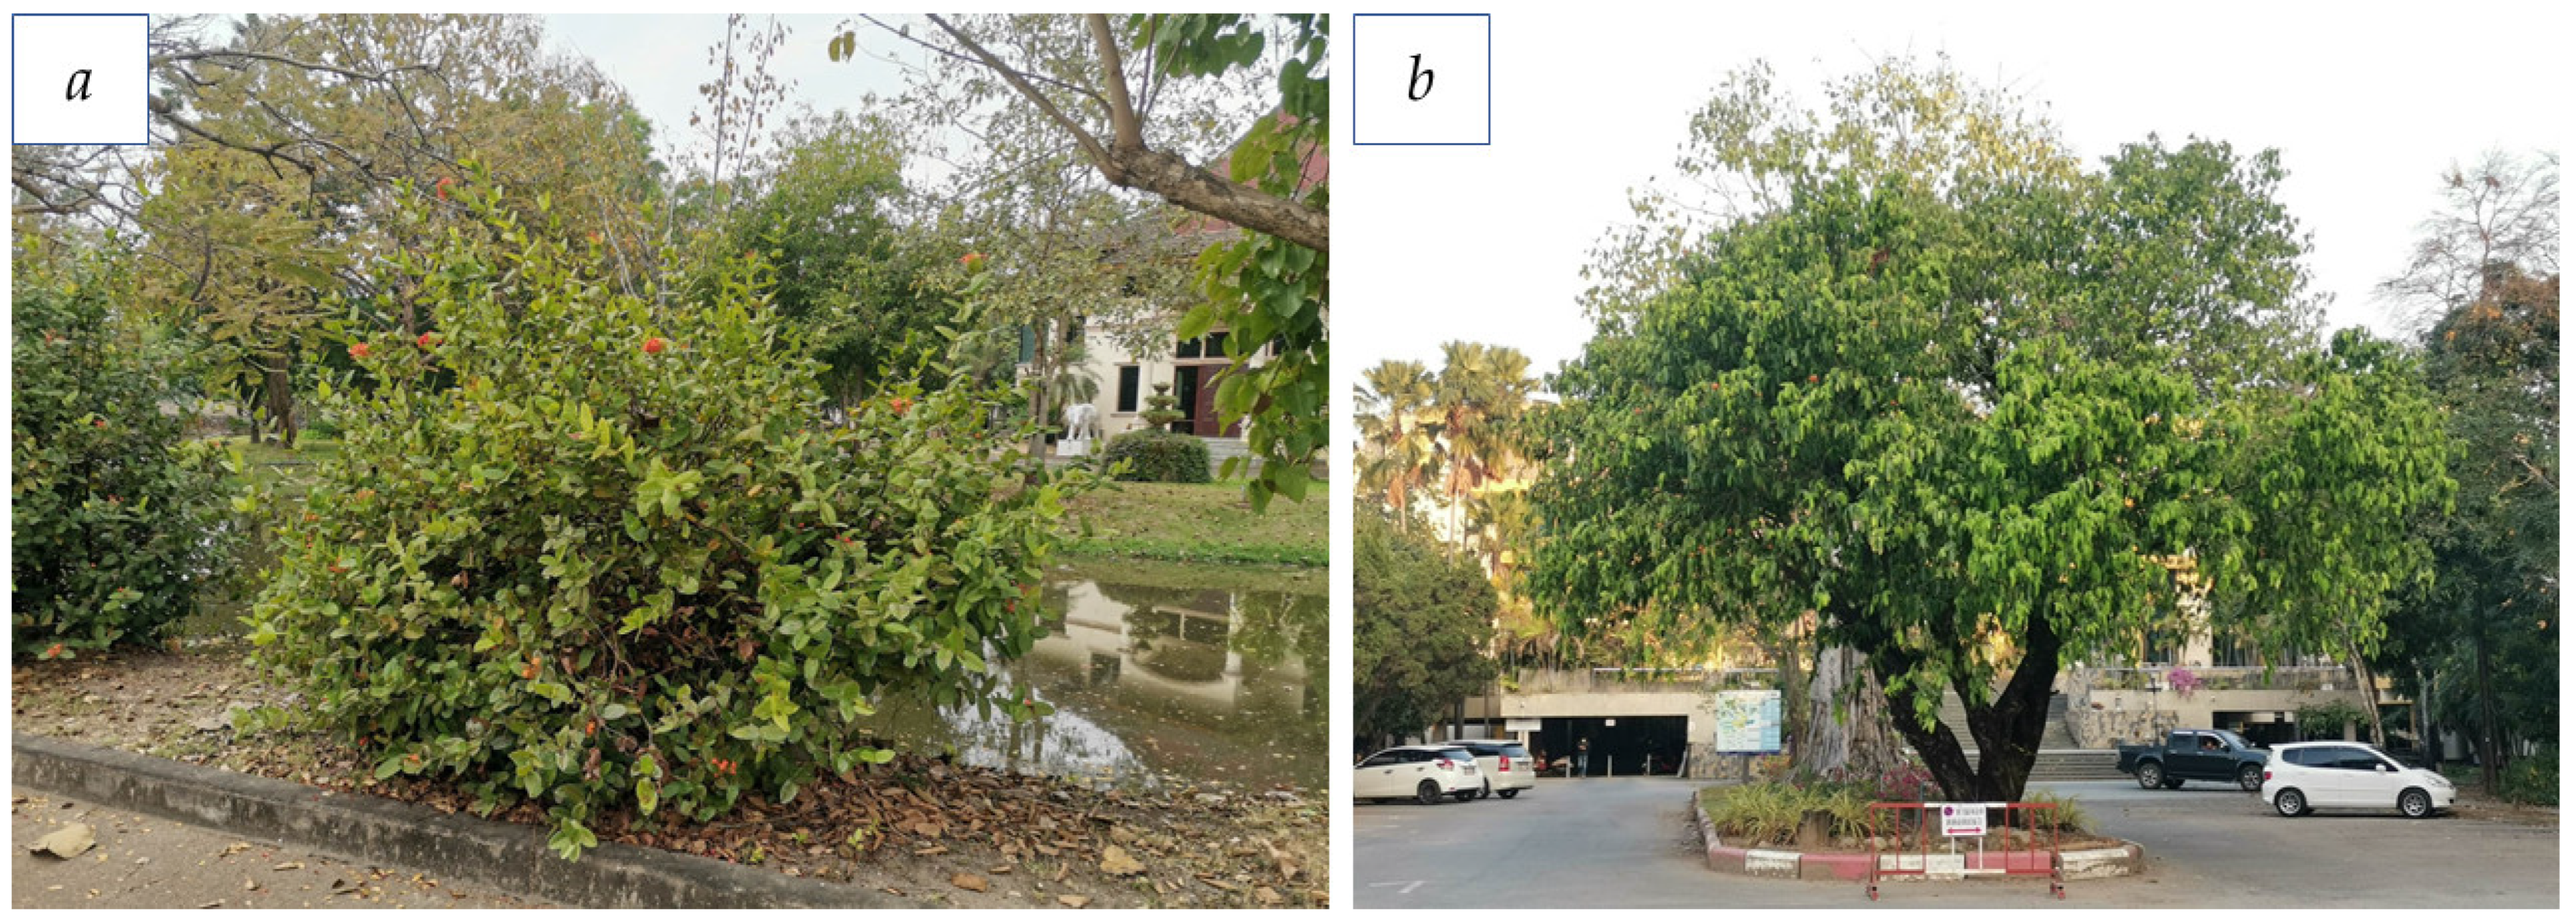
Two types of plants were simulated in the ENVI-met program: shrubs and trees. The shrubs were generated to be a simplified cube shape to represent how their canopies cover the entire space. Their height was set to 1.5 m, similar to typical shrubs and hedges used in typical public parks and garden designs. Examples of these shrubs in a typical Chiang Mai urban landscape may include
Ixora x williamsii Hort,
Plumbago auriculata, or
Syzygium myrtifolium Walp. While some of these plants are not native to the city, they have adapted well to the climate and the urban environment and are popular choices for landscape designers. The costs of the shrubs were investigated in plant shops in the Chiang Mai area, and the average price was THB 500–1000 per square meter, including the costs of planting and 1 year of maintenance, such as watering and pruning. The trees were simulated to be 5.5 m in height and canopy diameter, representing a typical urban tree in Thailand, such as
Saraca indica L.,
Bauhinia purpurea, or
Senna surattensis. These trees are larger than 5.5 m at mature size, but are usually found around this height along the public landscapes due to pruning and limited growing space. Likewise, the costs of the trees were also investigated in plant shops in the Chiang Mai region, where it was found that the average price per tree with a height of 5.5 m was THB 10,000, including installation and annual maintenance such as pruning. An example of plants used in this study can be seen in
Figure 5.
2.3. Creating Base Case and Alternative Model
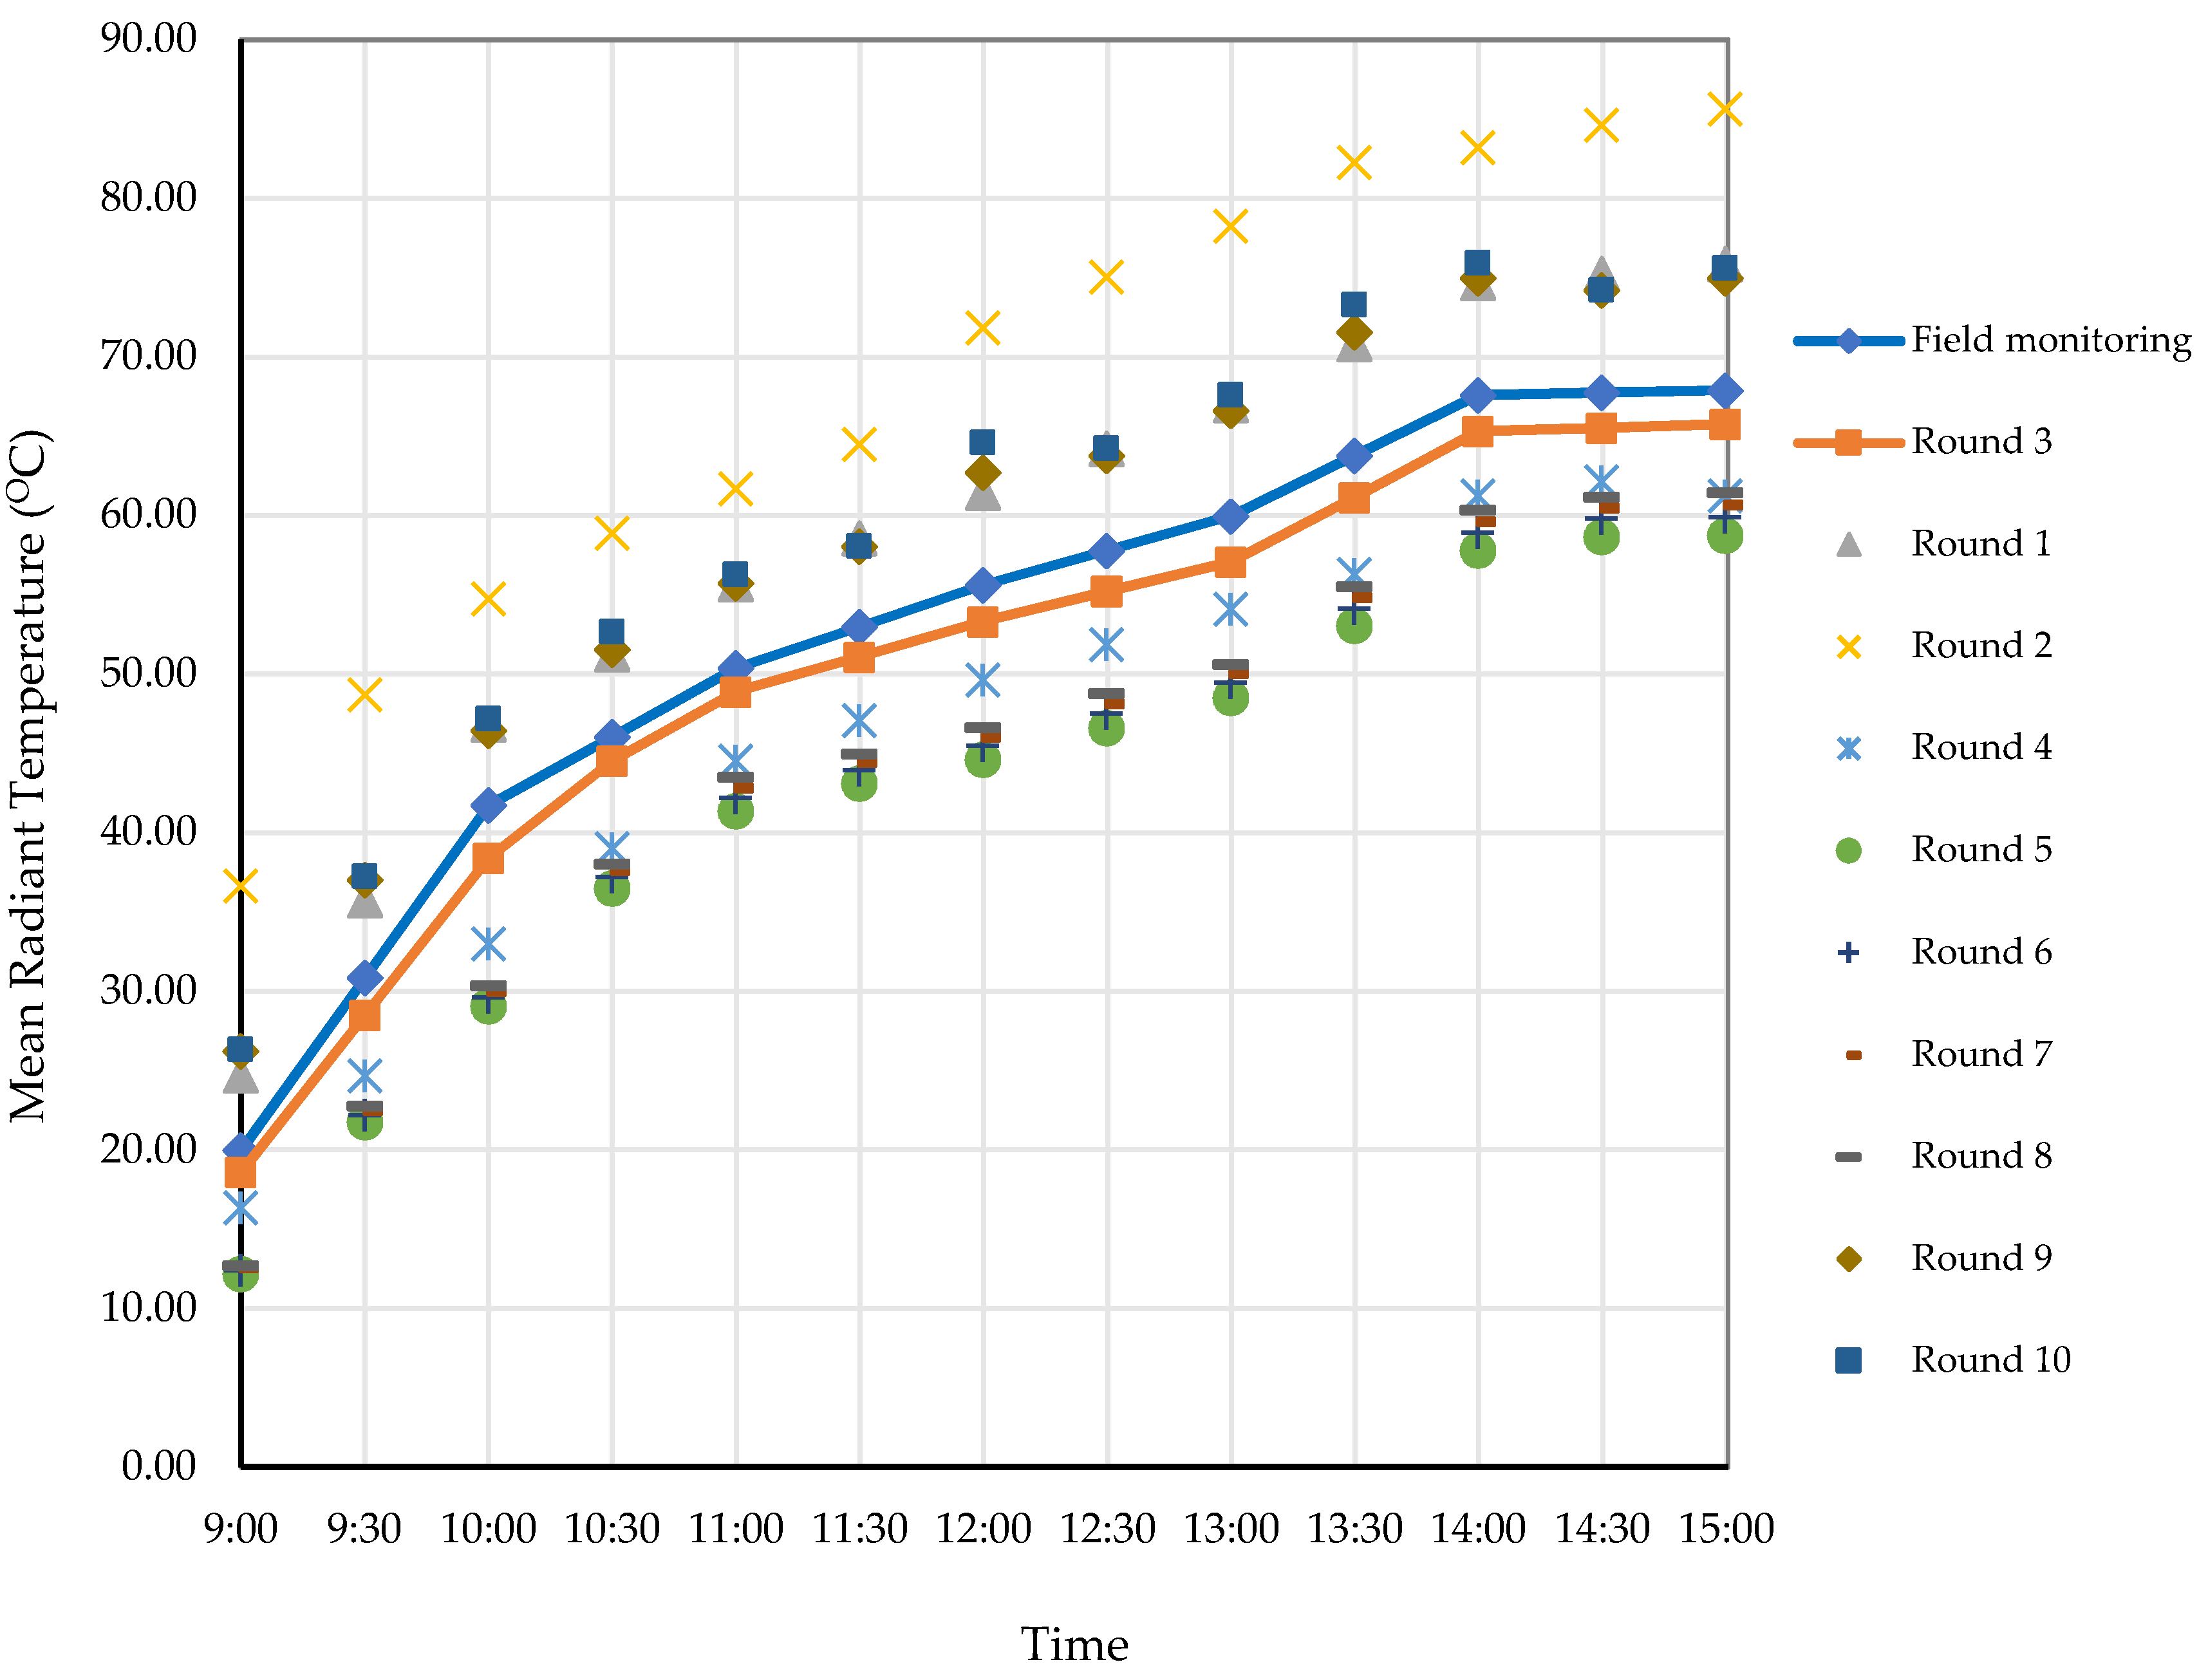
Before modeling, the data were calibrated to bring the simulations closer to reality by comparing the Tmrt values from the field and simulation. The collected data and the simulated data closely matched.
Figure 6 shows the mean radiant temperature graph of the 11 datasets. The field monitoring graph represents the actual data from the field. All graphs were plotted during the same period from 9:00 a.m. to 3:00 p.m. to compare the differences.
A base case model of the study area was created using the calibration between the field Tmrt and calculated Tmrt values for ten calibration rounds, each given a different root mean square error (RMSE). The RMSE value from Round 3 was in the acceptable range, between 4.0 and 7.5. Based on Salata et al.’s [
41] study, the calibration factor in this cycle will be applied to the next step. The calibration results are shown in
Table 1.
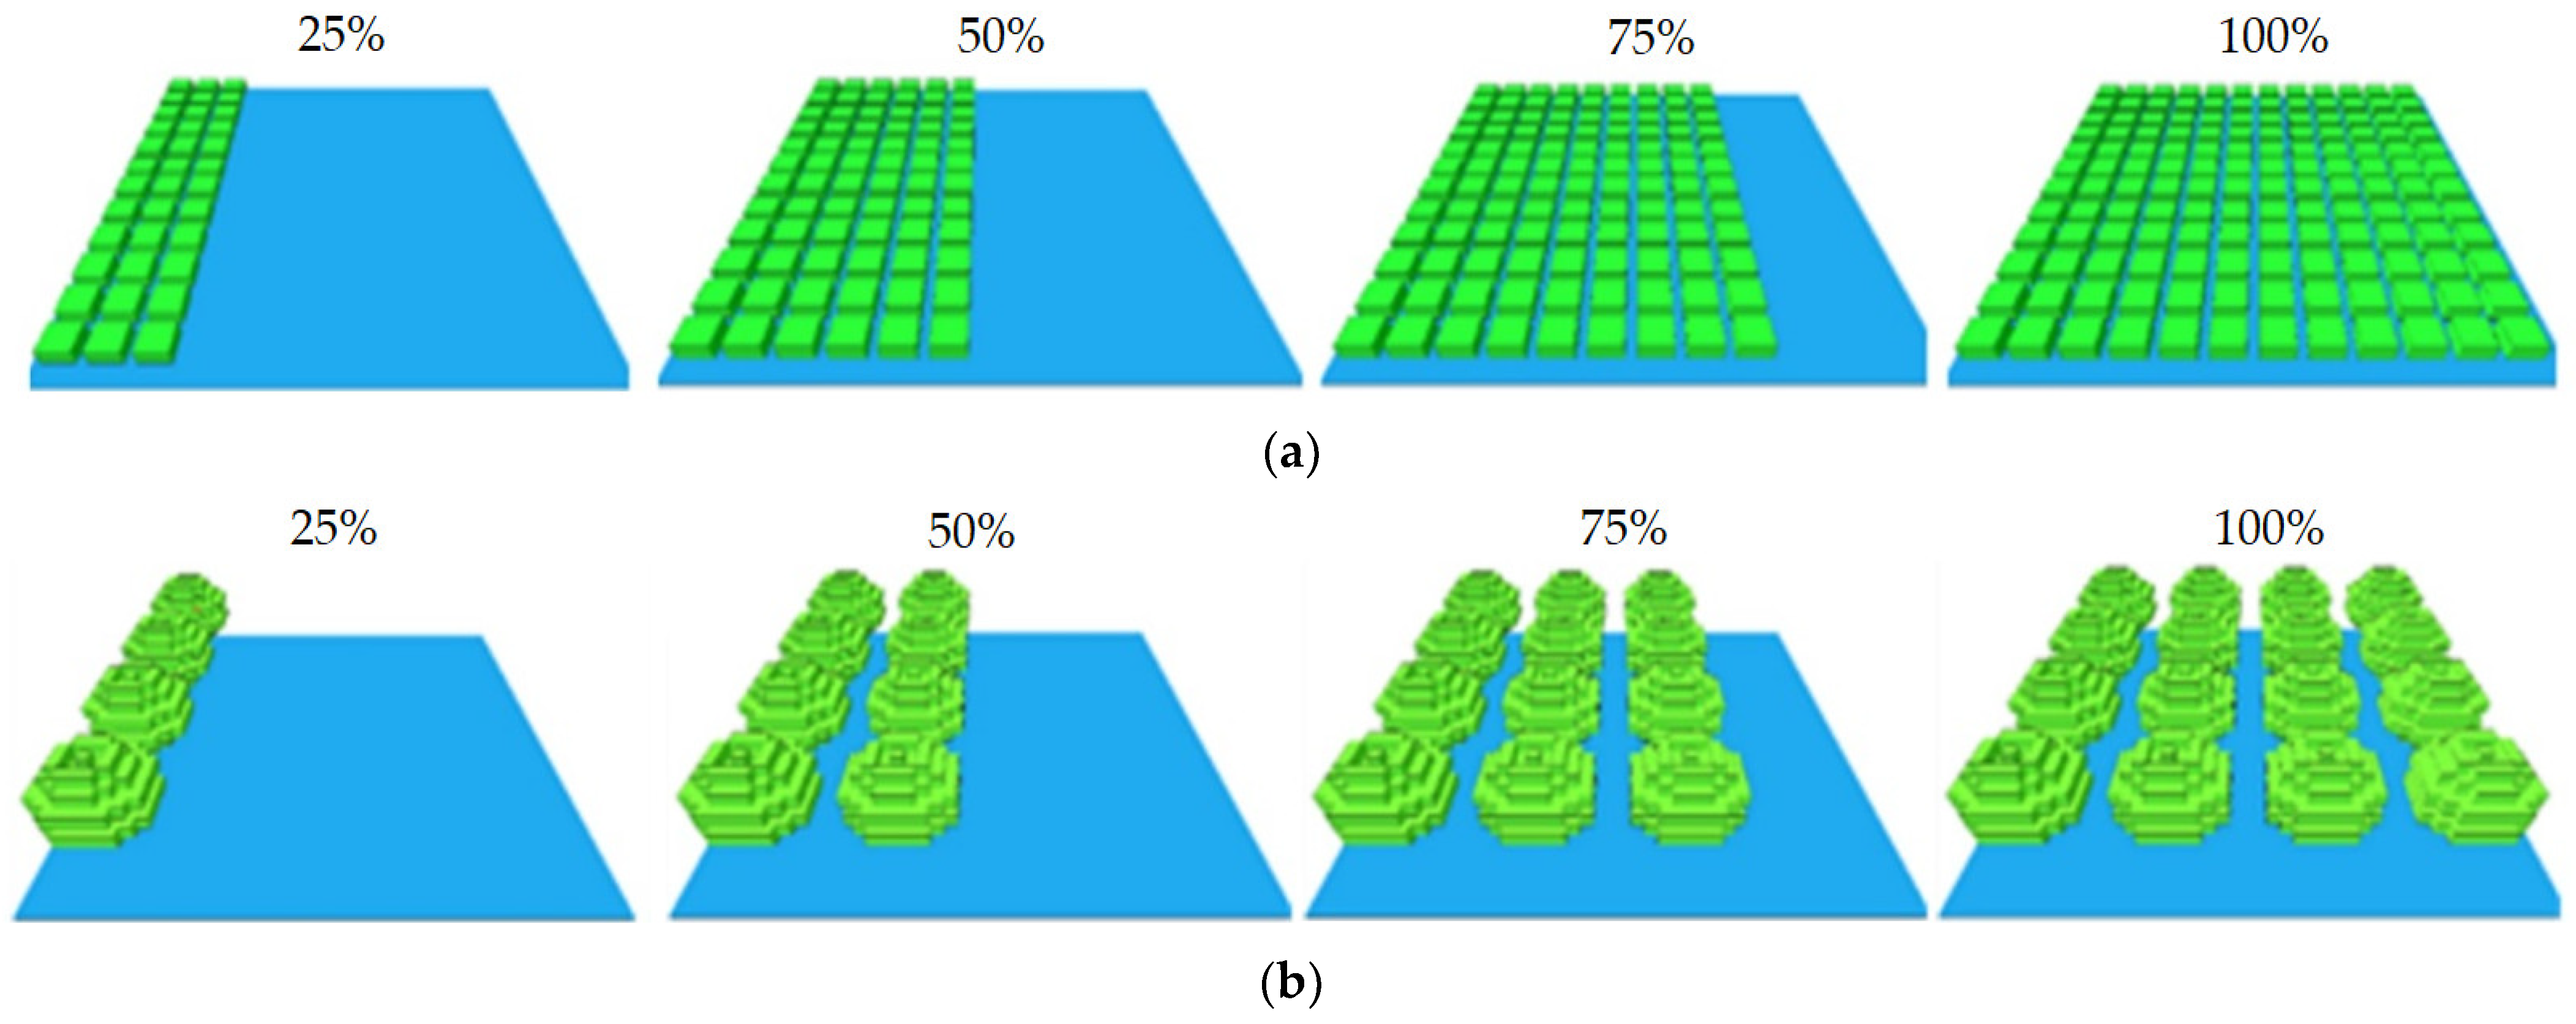
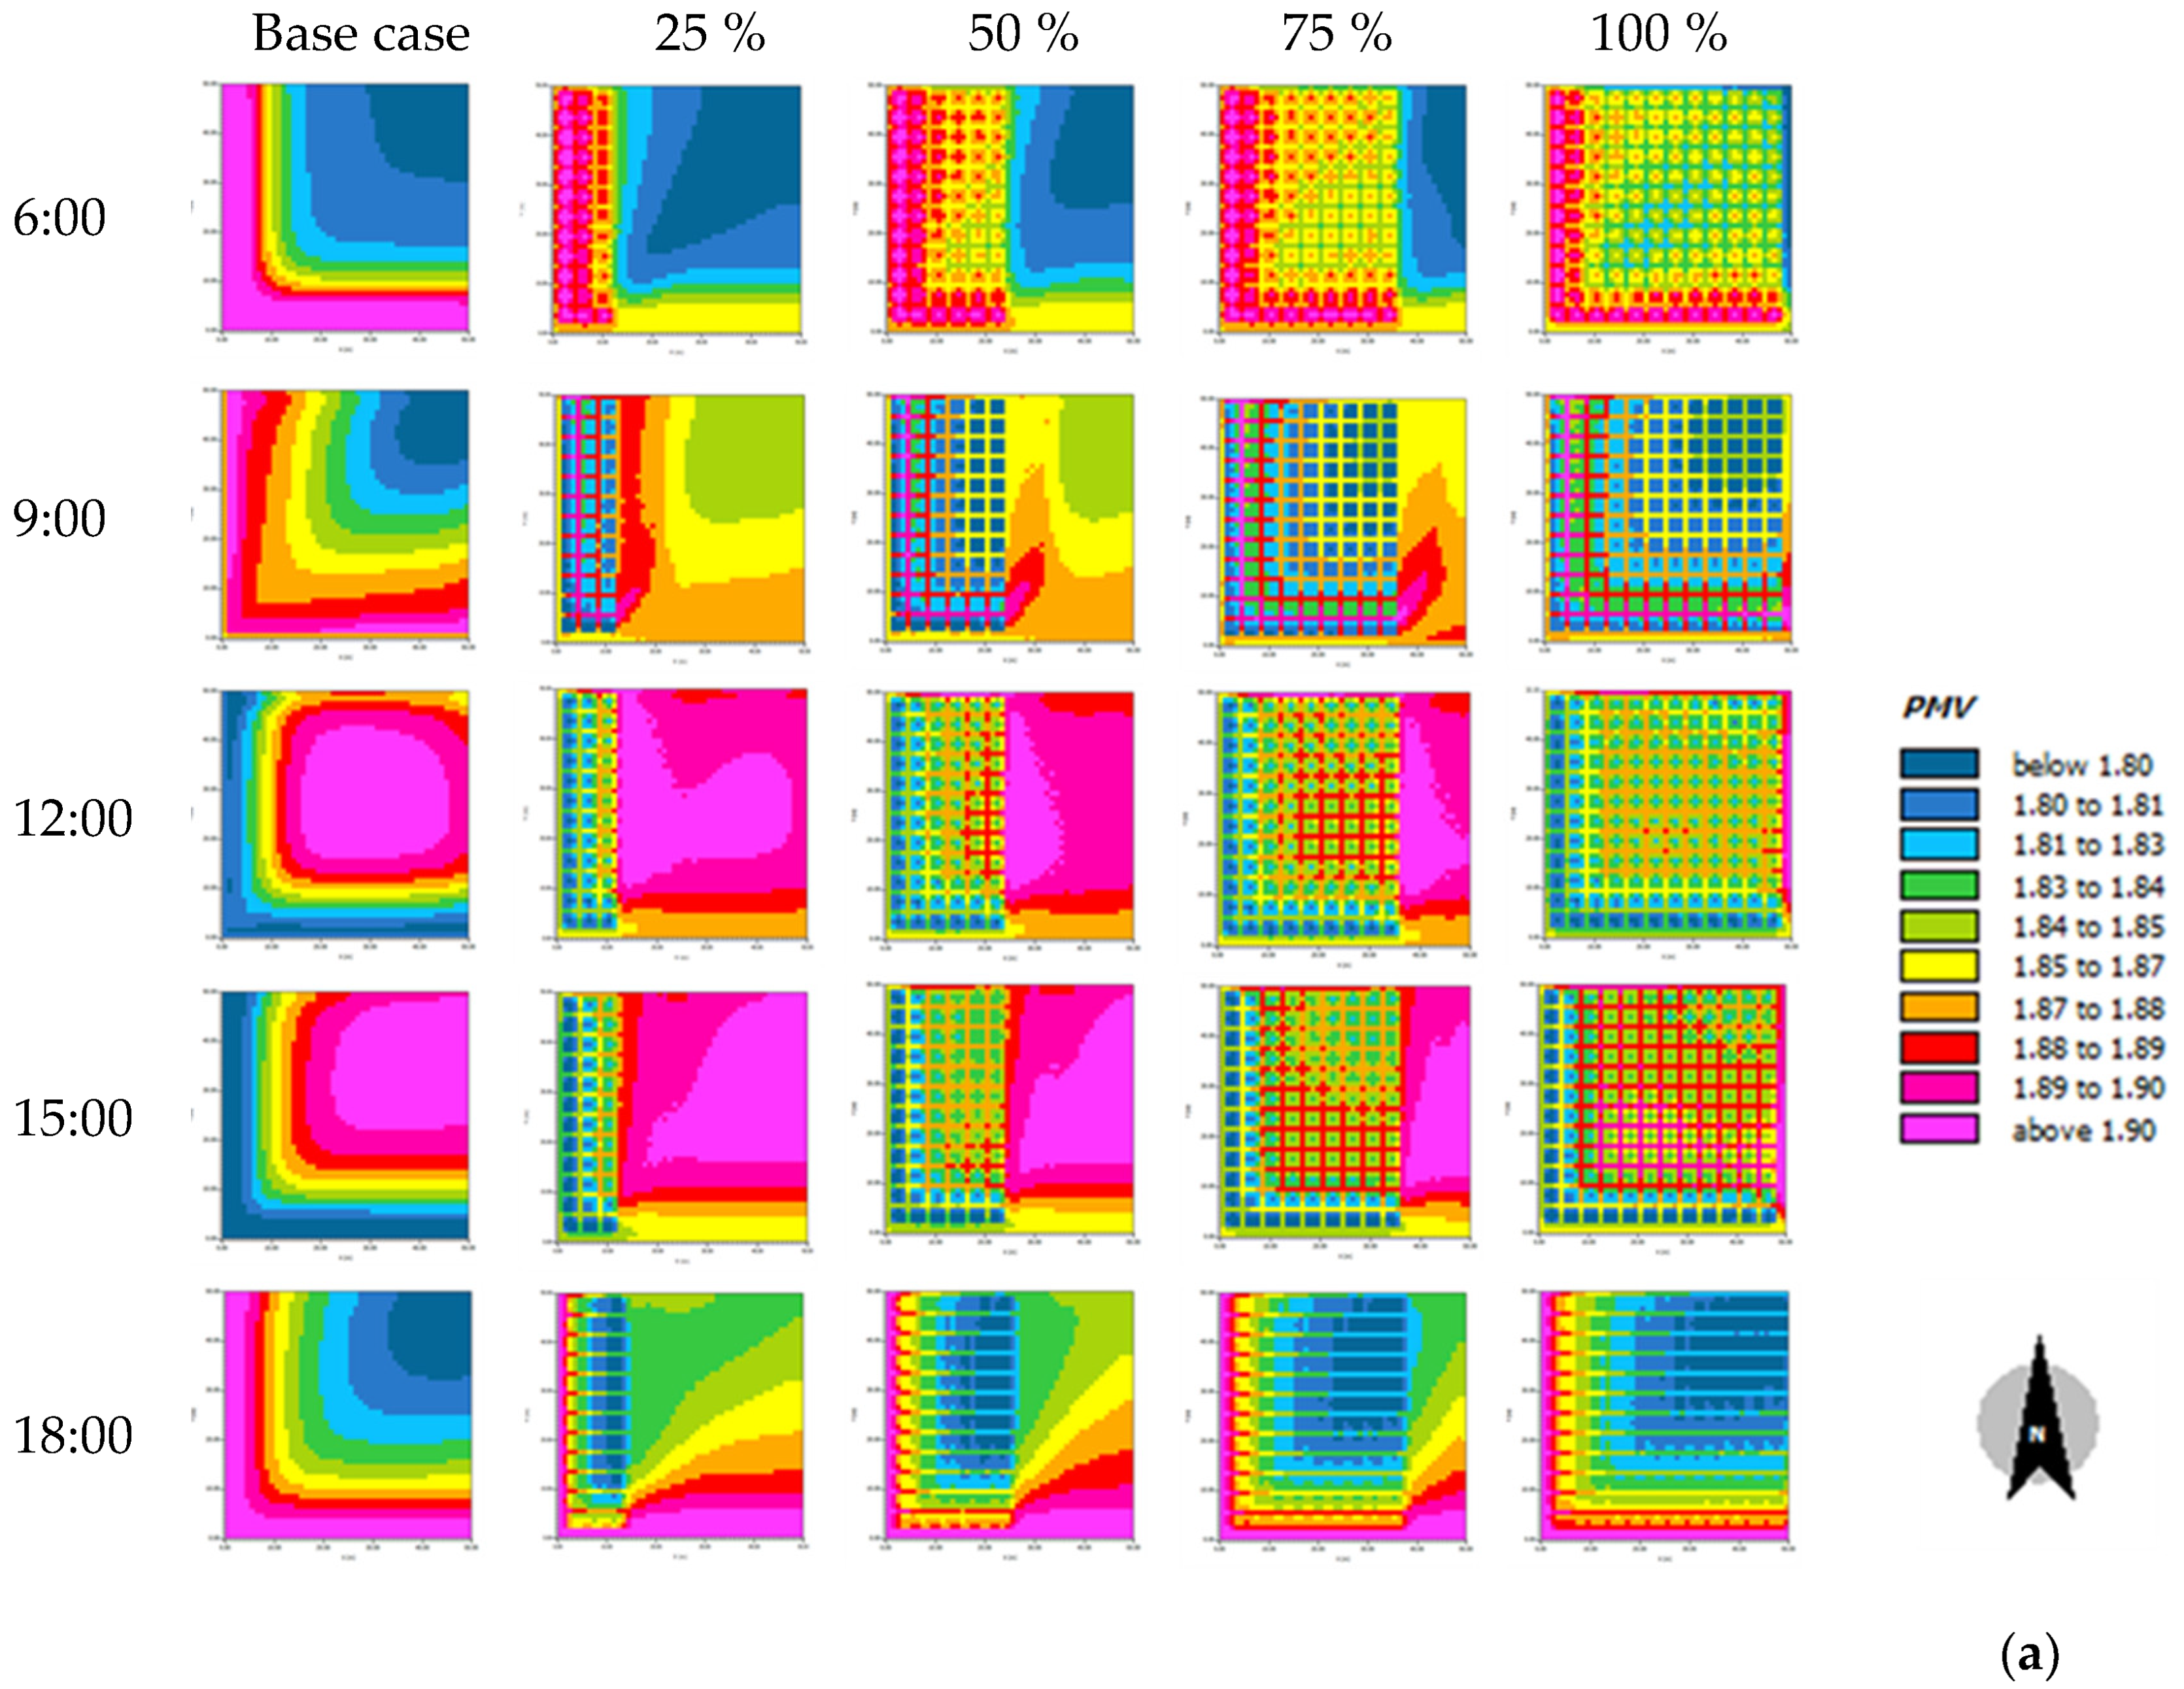
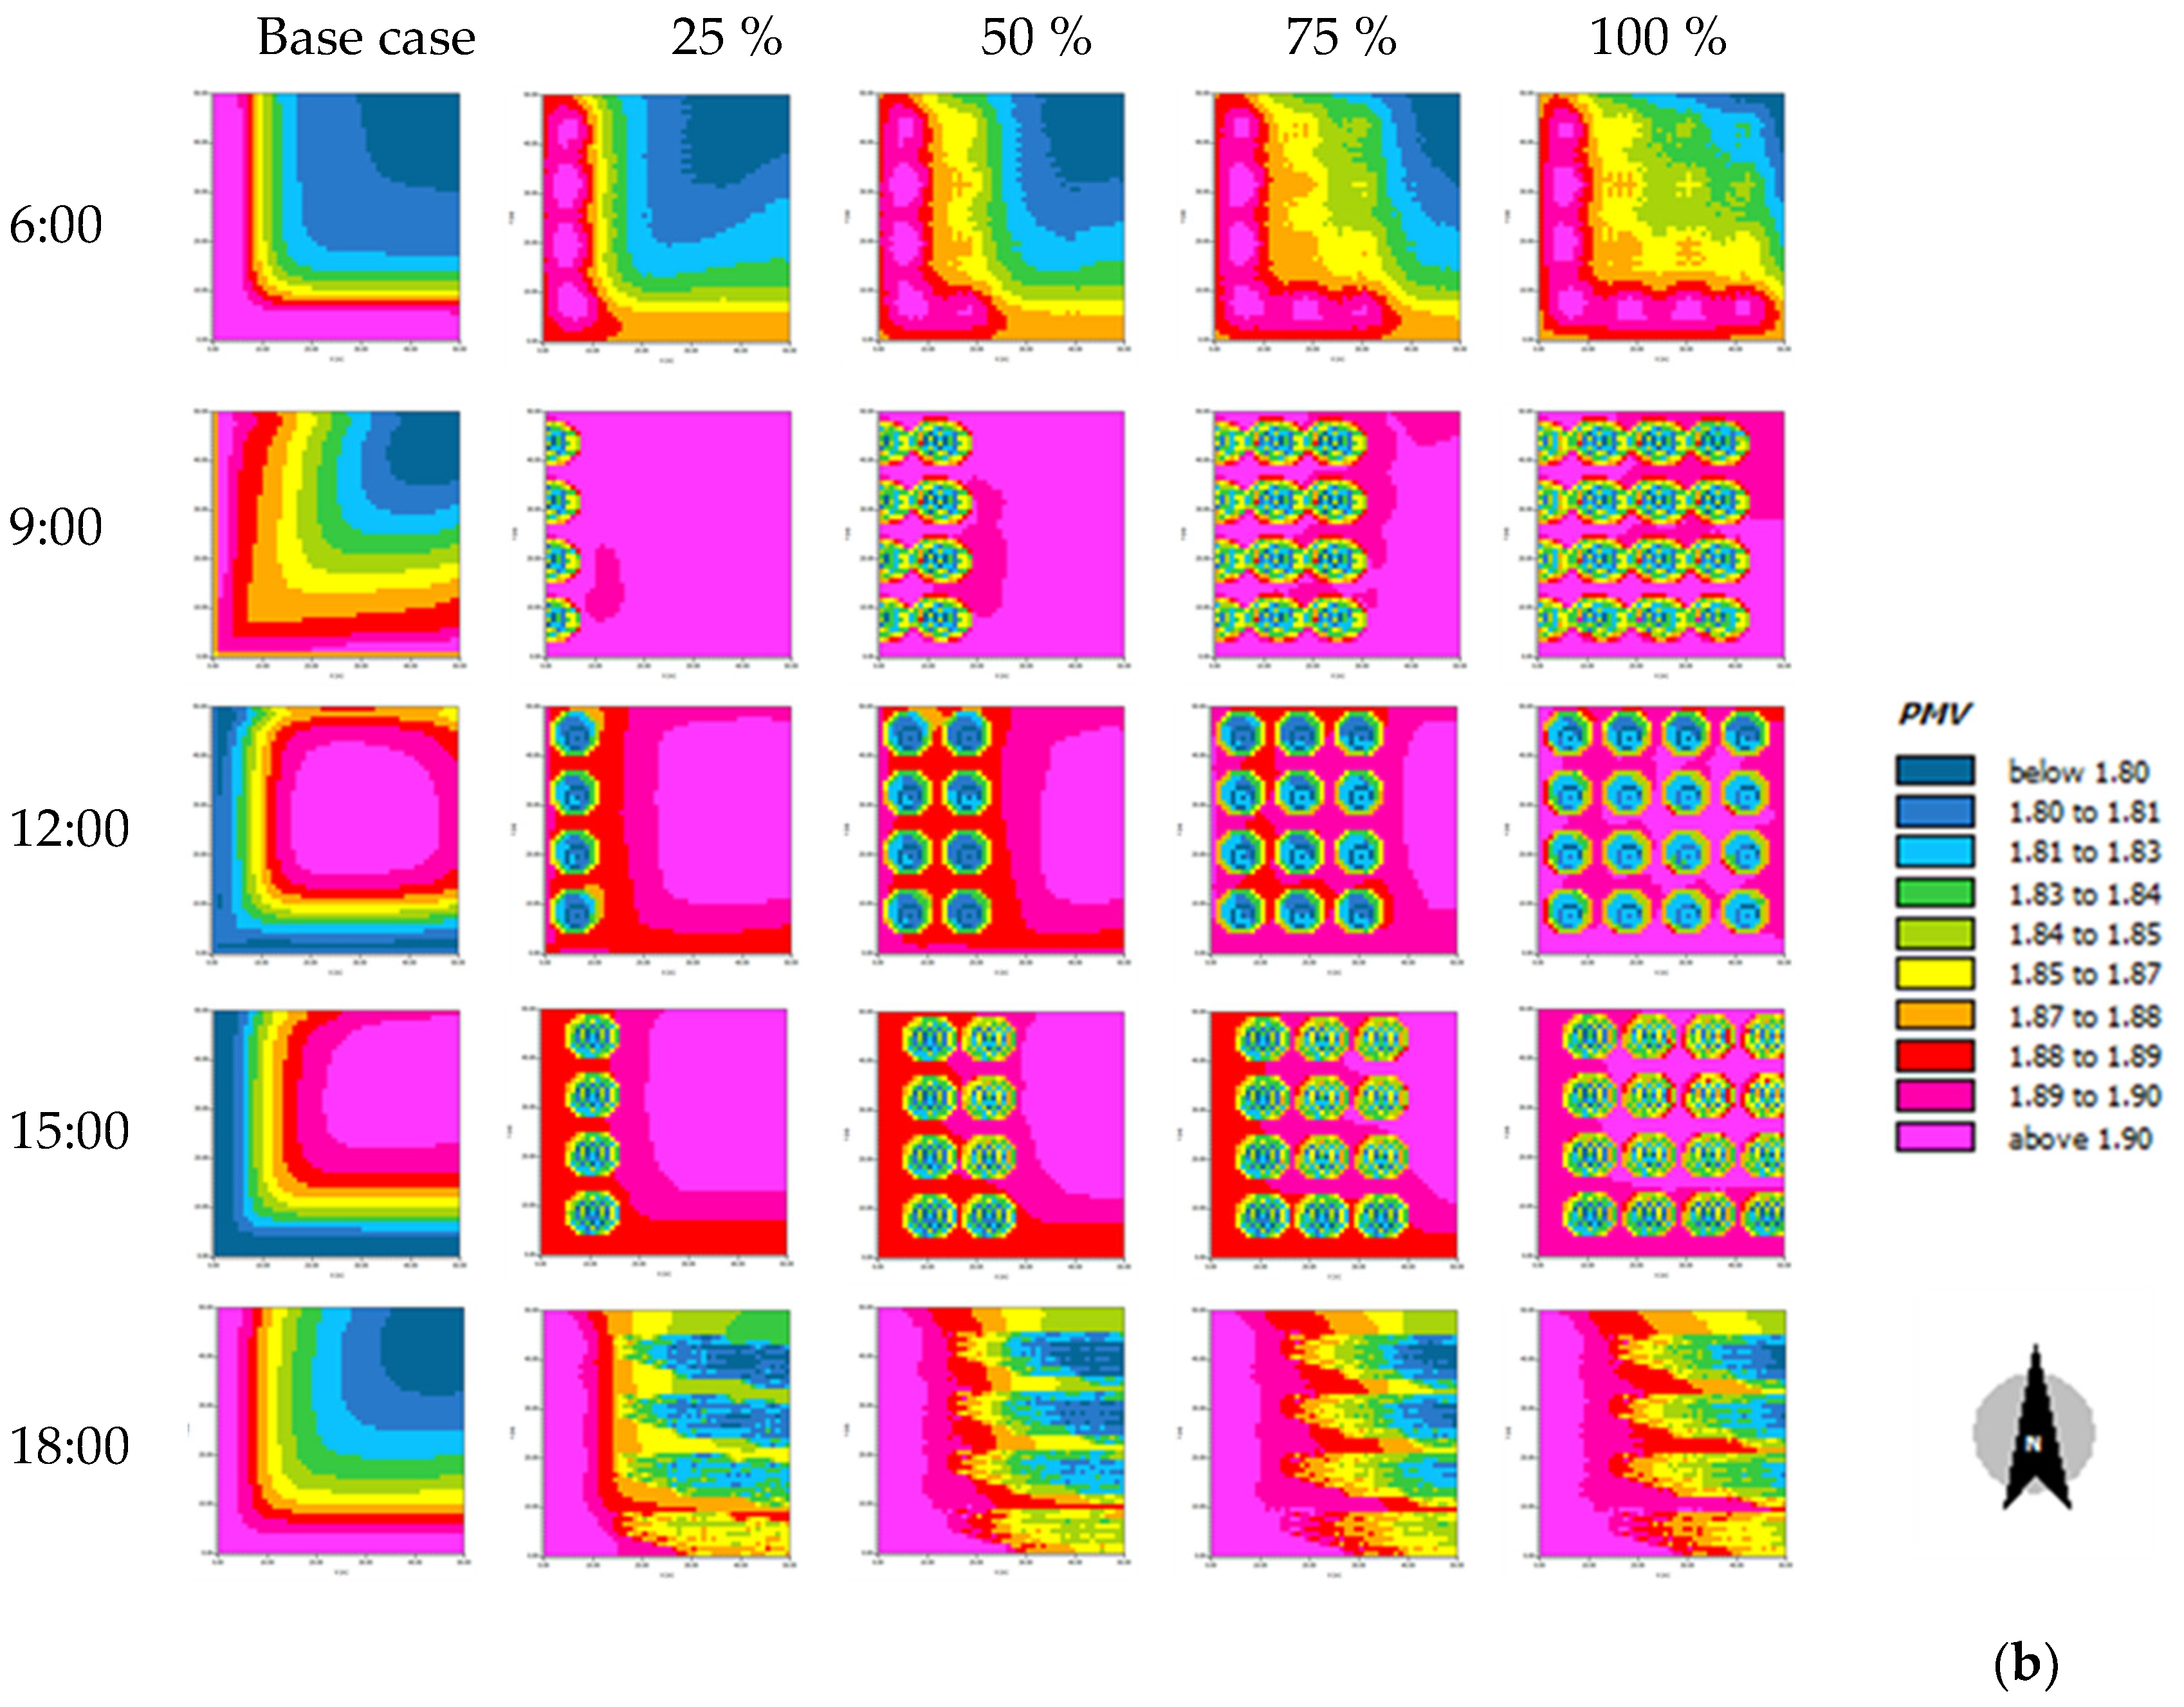
Next, the researchers created an alternative model, where the first alternative case was placing shrubs over 25%, 50%, 75%, and 100% of the study area, as shown in
Figure 7a, and the second alternative case was placing trees over 25%, 50%, 75%, and 100% of the area, as shown in
Figure 7b.
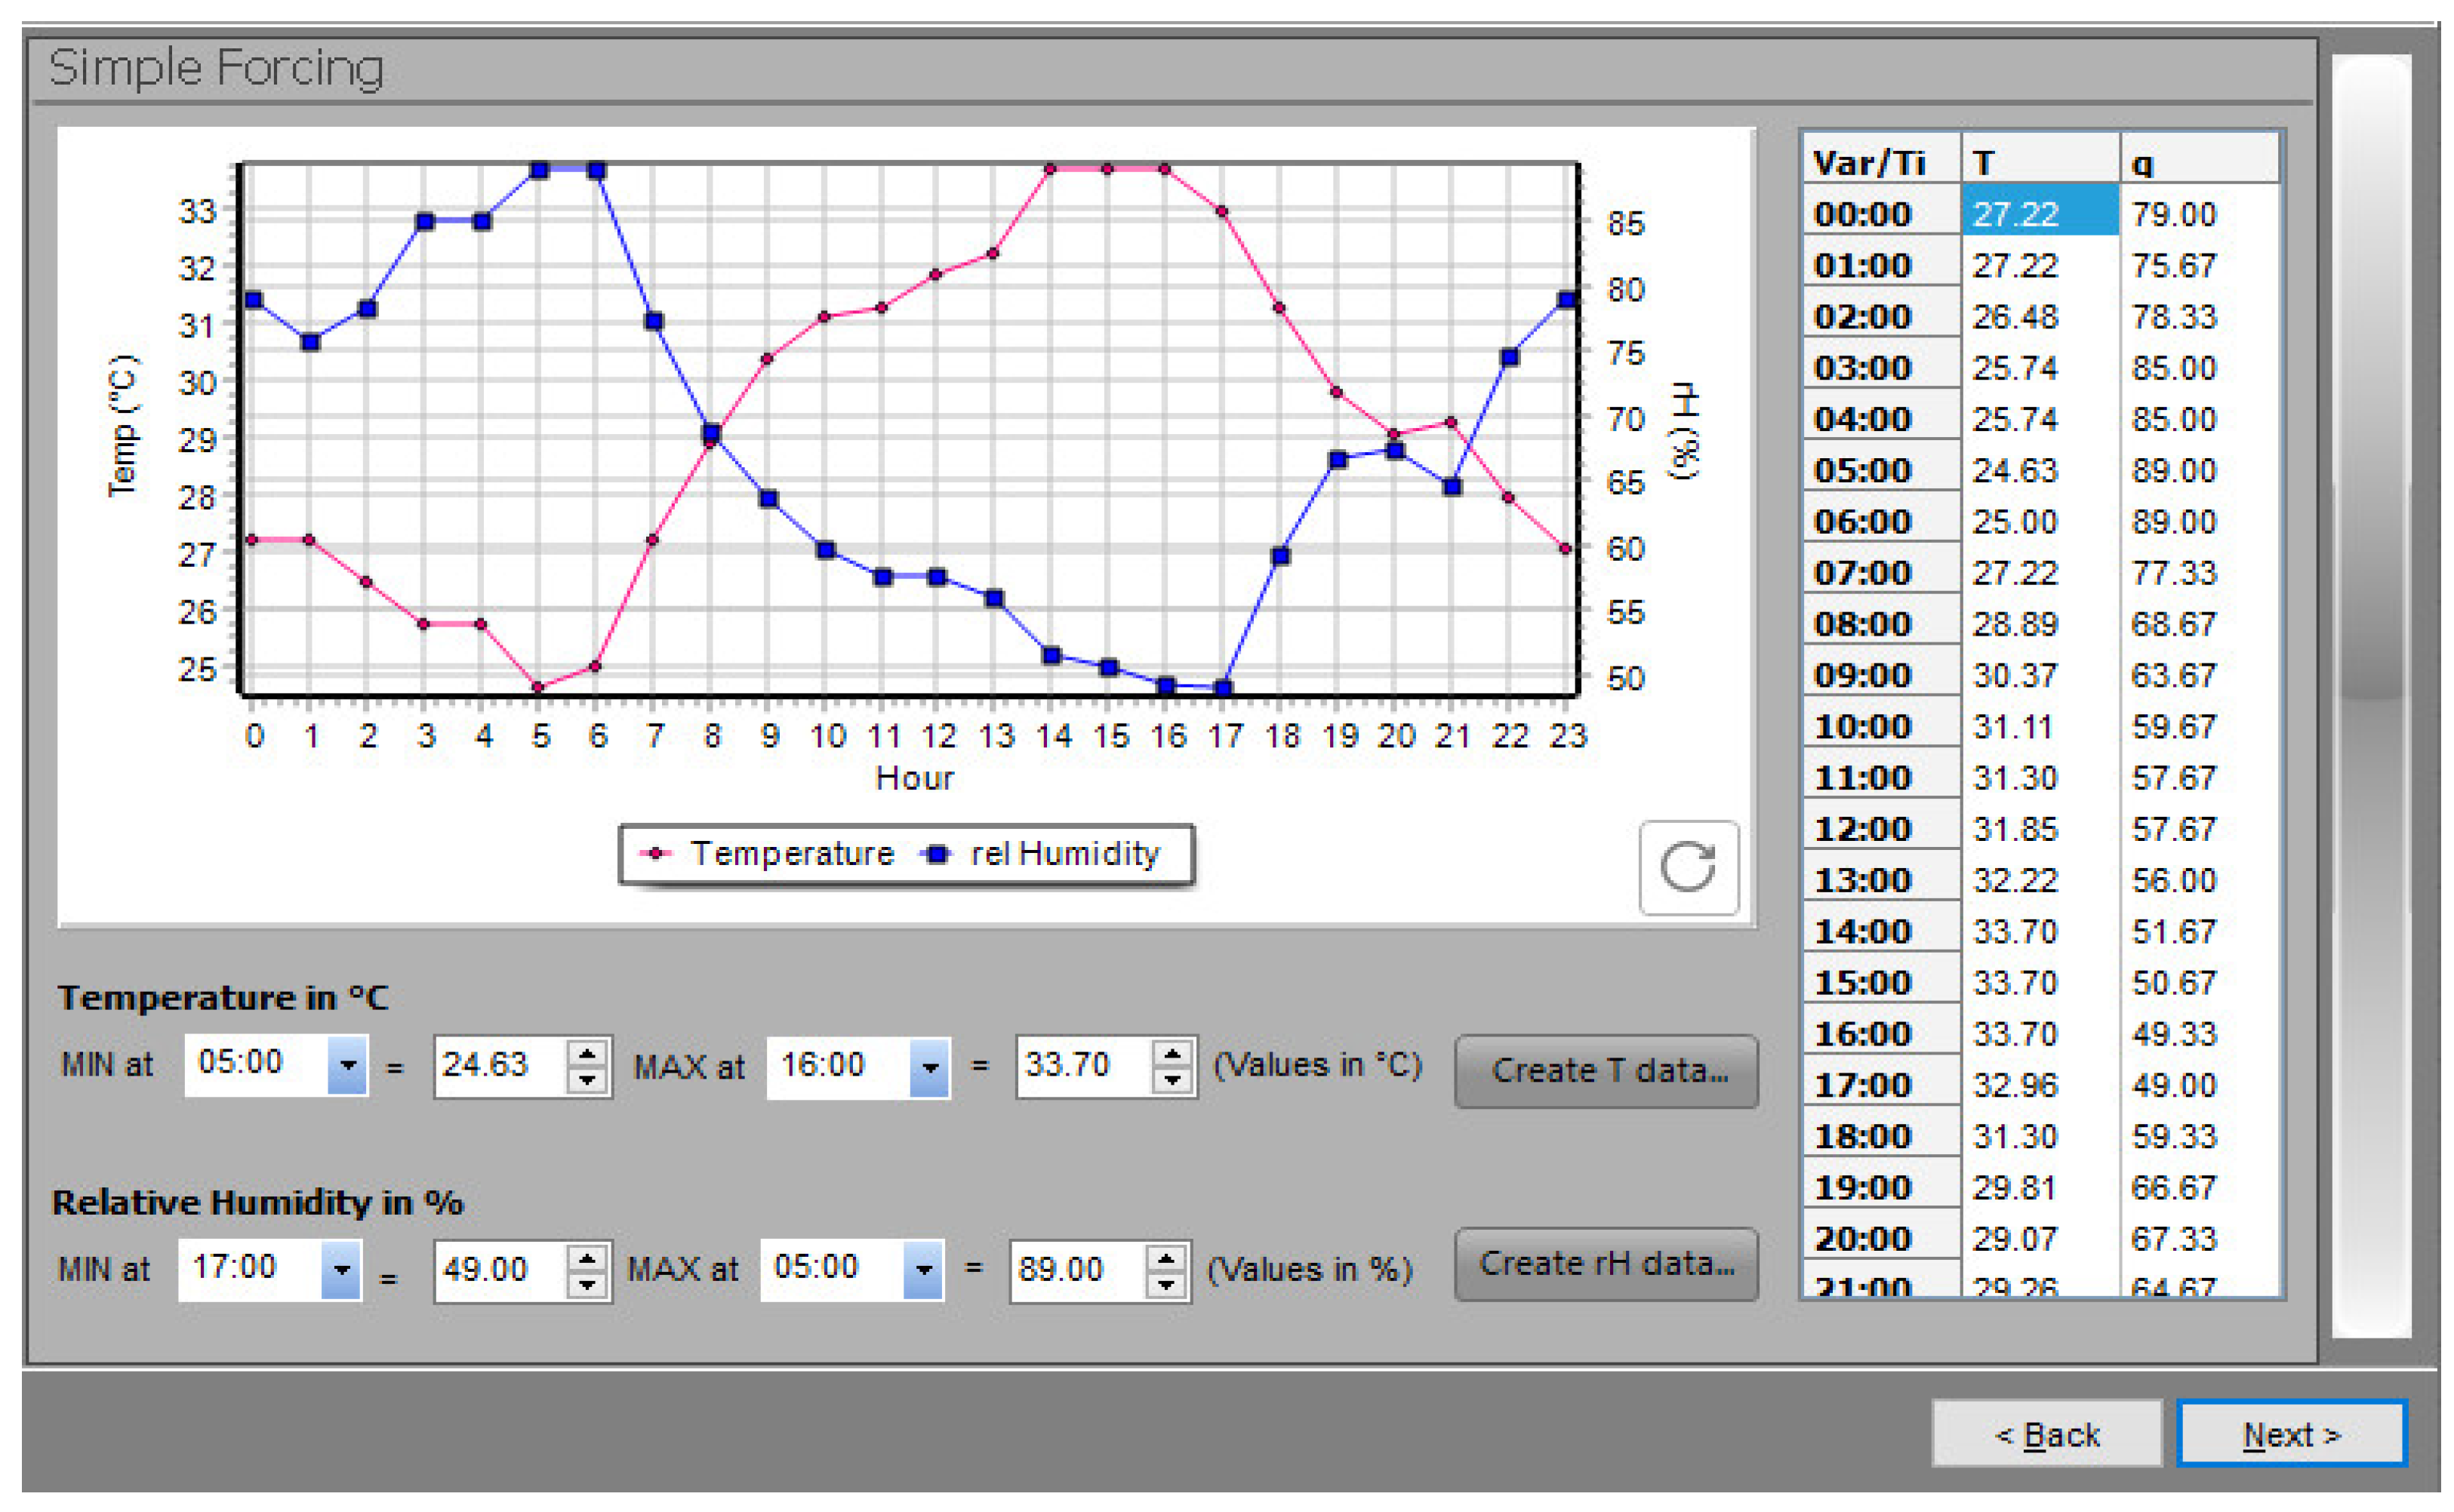
This study simulated a summer scenario to observe changes in the PMV and PET temperatures influenced by trees to create alternative case 1 and alternative case 2. The simulation date was April 13 from 5:00 a.m. to 8:00 p.m., according to this area’s design objectives (this area was designed for daytime activity). Two alternative cases were created using air temperature, relative humidity, wind direction, and speed data in the simulation from the Meteorological Department, Chiang Mai Airport Station, which is the closest station with reliable information in the study area. The average wind speed mostly came from the southwest at 2.28 m/s. The information that was put into the ENVI-met program is shown in
Figure 8.
The blue curve shows the mean of the relative humidity, with its highest in the morning and its lowest in the evening, while the red line represents the mean temperature at the highest point and the lowest point, opposite to relative humidity.
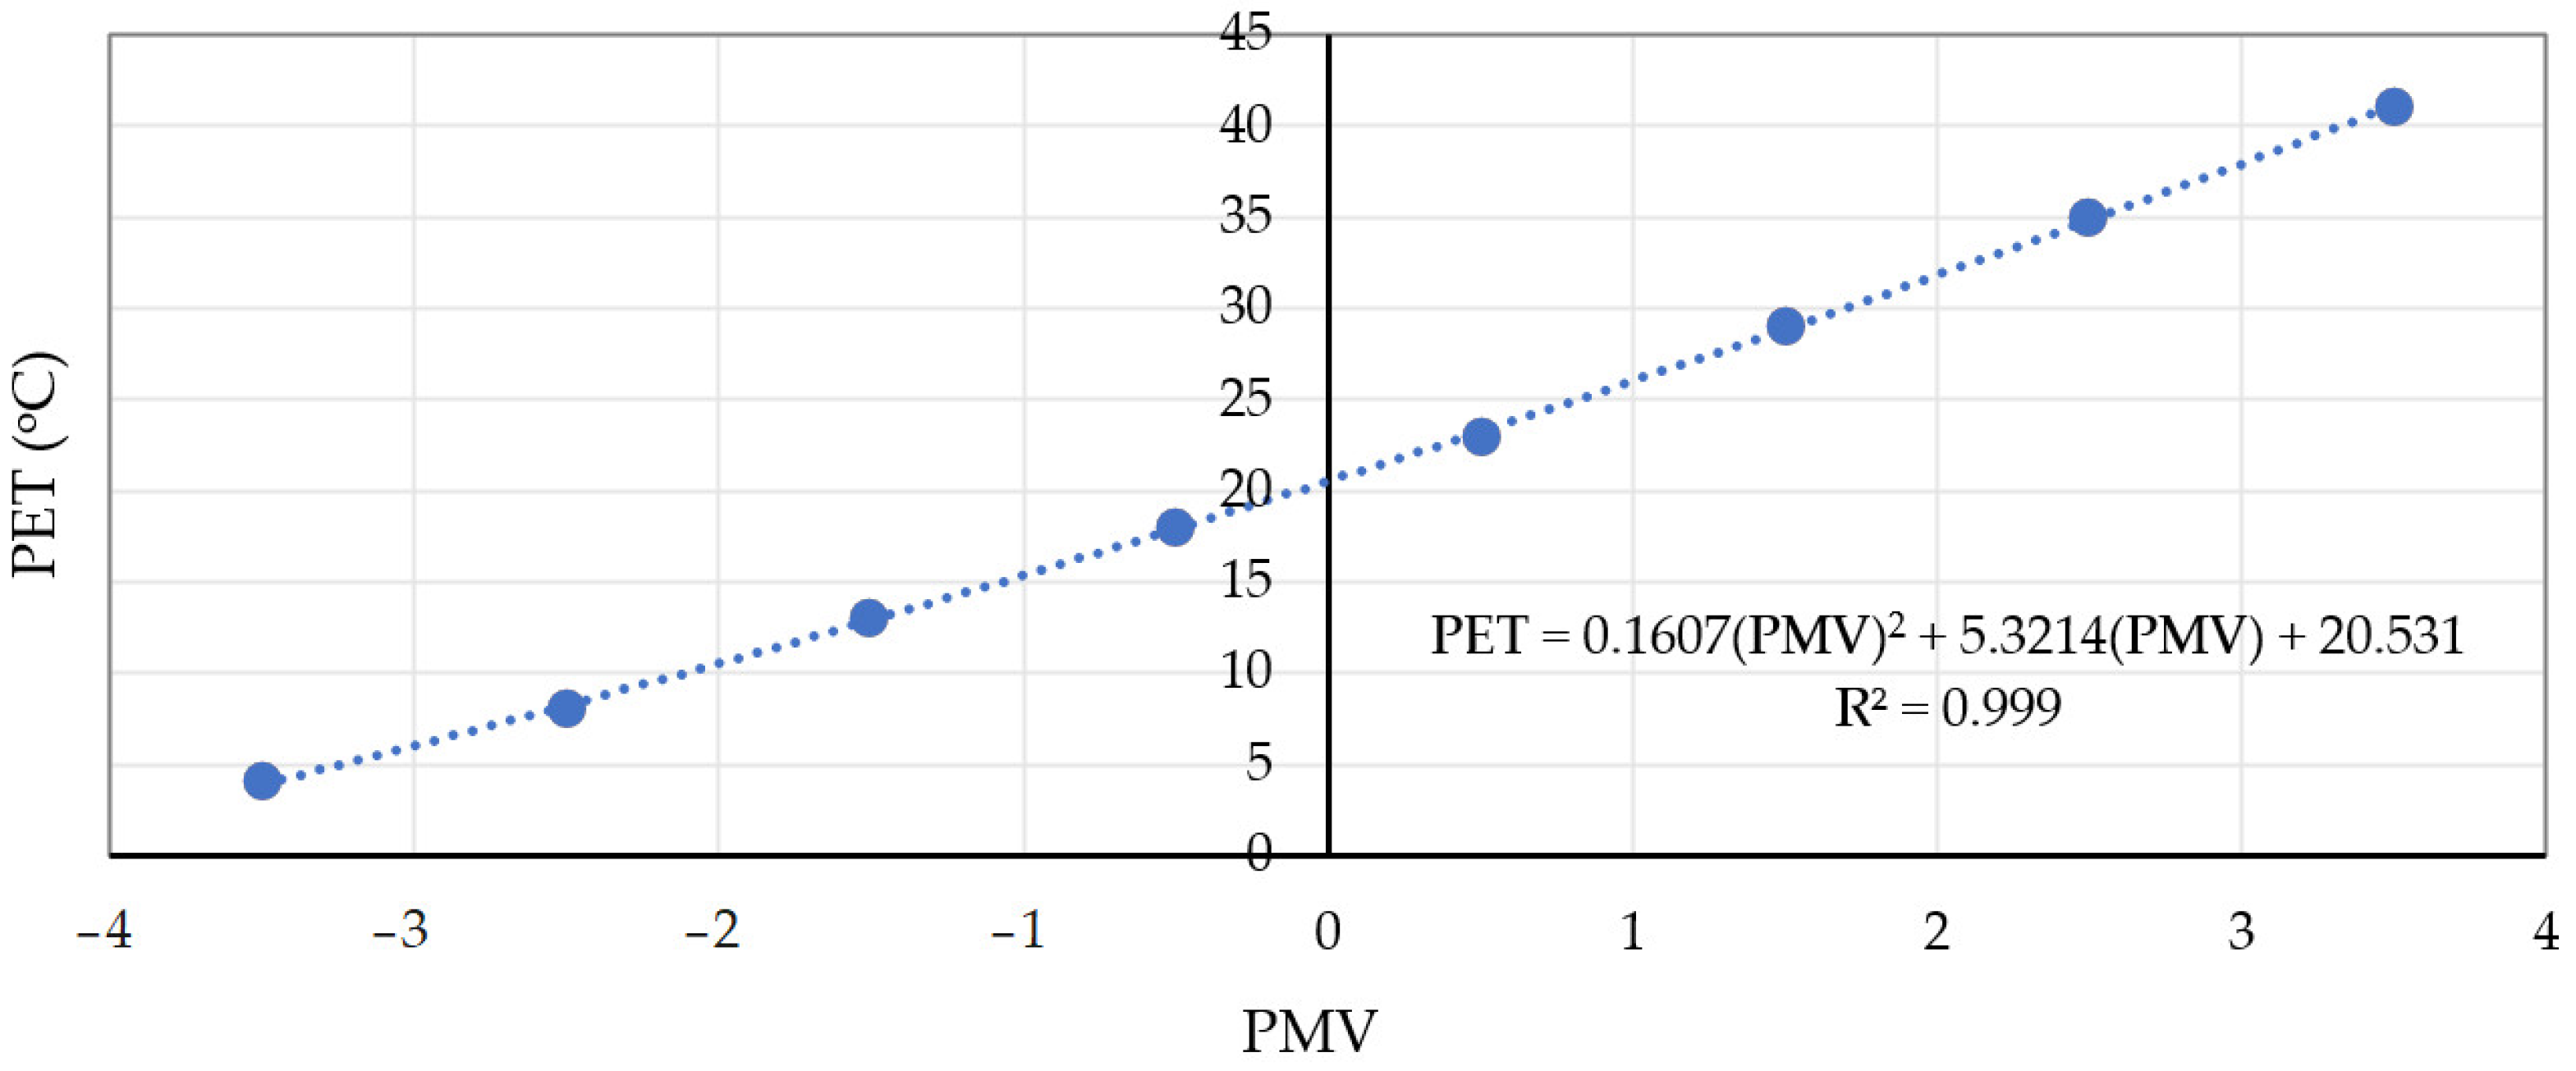
After the simulation in the ENVI-met program, the PMV temperature values were obtained, but they were not the PET values. Therefore, it was necessary to convert the PMV values into PET values. According to a study by Matzarakis and Mayer [
42], there is a relation table to convert between PMV and PET values when plotting a graph, with the x-axis representing the PMV value and the y-axis representing the PET value. Therefore, it can be displayed as shown in
Figure 9.
The x-axis in
Figure 9 represents the PMV value, which ranged from −4 to 4, while the y-axis represents the PET value, which ranged from 0 to 45.
After creating the base case model and converting the PMV values, the next step was to simulate the alternative model and calculate the eco−efficiency to compare the efficiency of the trees affecting the outdoor thermal comfort using the following in Equation (2).
Finally, the last step was analyzing and concluding the study. The results of the alternative case simulation can be found in the next section.
3. Results
This section shows the results obtained from the simulation of the alternative model. The color chart shows the PMV in the study area. The date of the simulation was the 13 April between 5:00 a.m. and 8:00 p.m., using air temperature, relative humidity, wind direction, and wind speed data as the main parameters. The simulations started at 6:00 a.m., 9:00 a.m., 12:00 p.m., 3:00 p.m., and 6:00 p.m. from the ENVI-met program to observe the differences in each period and the layout of shrubs and trees. The result of Alternative 1 is shown in
Figure 10a, and Alternative 2 is shown in
Figure 10b.
The legend in
Figure 10 shows the predicted mean vote index (PMV) ranging from 1.74 to 1.90 (the PMV is in the range of −3 to 3, rated according to how people feel in each area, where + 3 means hot, + 2 means warm, + 1 means slightly warm, 0 means neutral, −1 means slightly cool, −2 means cool, and −3 means cold).
The PMV value for each alternative approach was obtained from the simulation. Compared to the base case, increasing the number of trees affected the temperature and relative humidity in both alternative cases; the temperature decreased while the relative humidity increased. Therefore, it can be concluded that increasing the number of trees will increase the study area’s outdoor thermal comfort. Furthermore, when the data from the simulation results were added to the graph, it was found that the PMV in the trees case decreased more than in the shrubs case; at 25%, the PMV in the trees case dropped by a maximum of 1.14, while the shrubs case reduced by a maximum of only 0.33, and at 50, 75, and 100%, trees had a more significant reduction in PMV than shrubs.
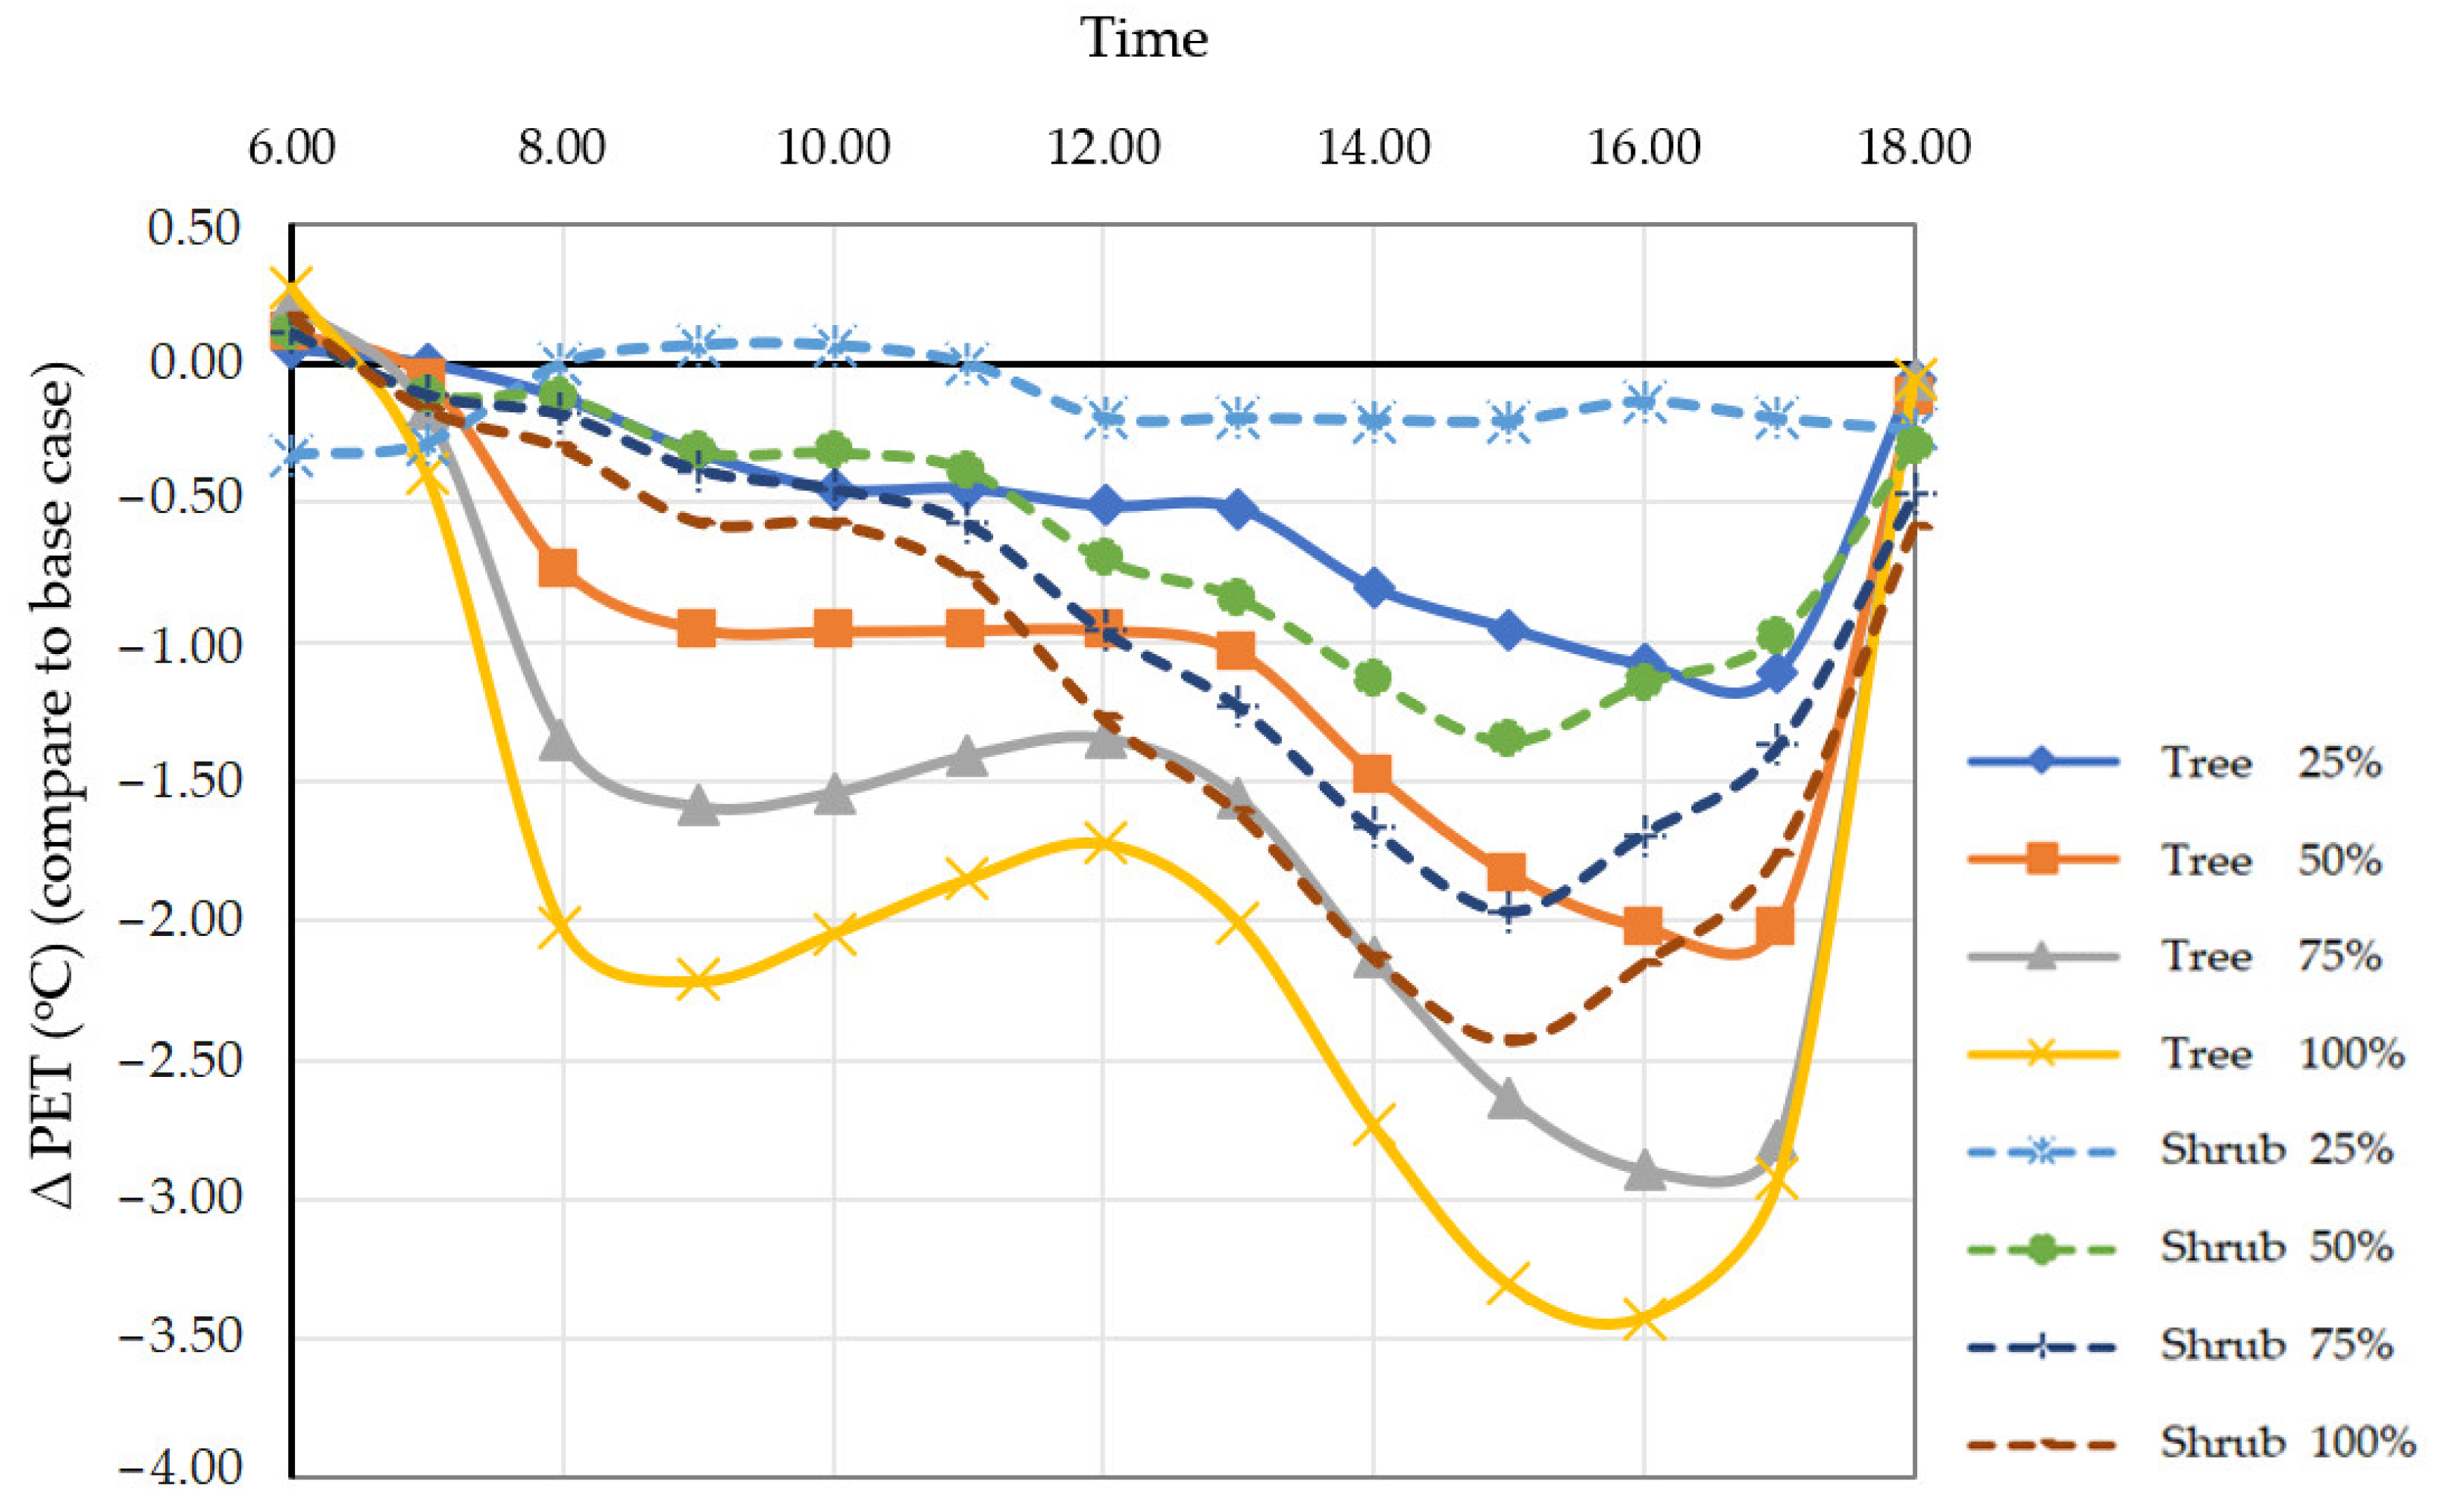
After the PMV values were converted to PET values, the PET from the trees still decreased more than the shrubs with the same number of plants. In
Figure 11, each line represents an alternative approach, which can be divided into two main alternatives: adding shrubs and trees. Each alternative has four patterns: adding greenery at a rate of 25, 50, 75, and 100%, therefore resulting in eight alternatives.
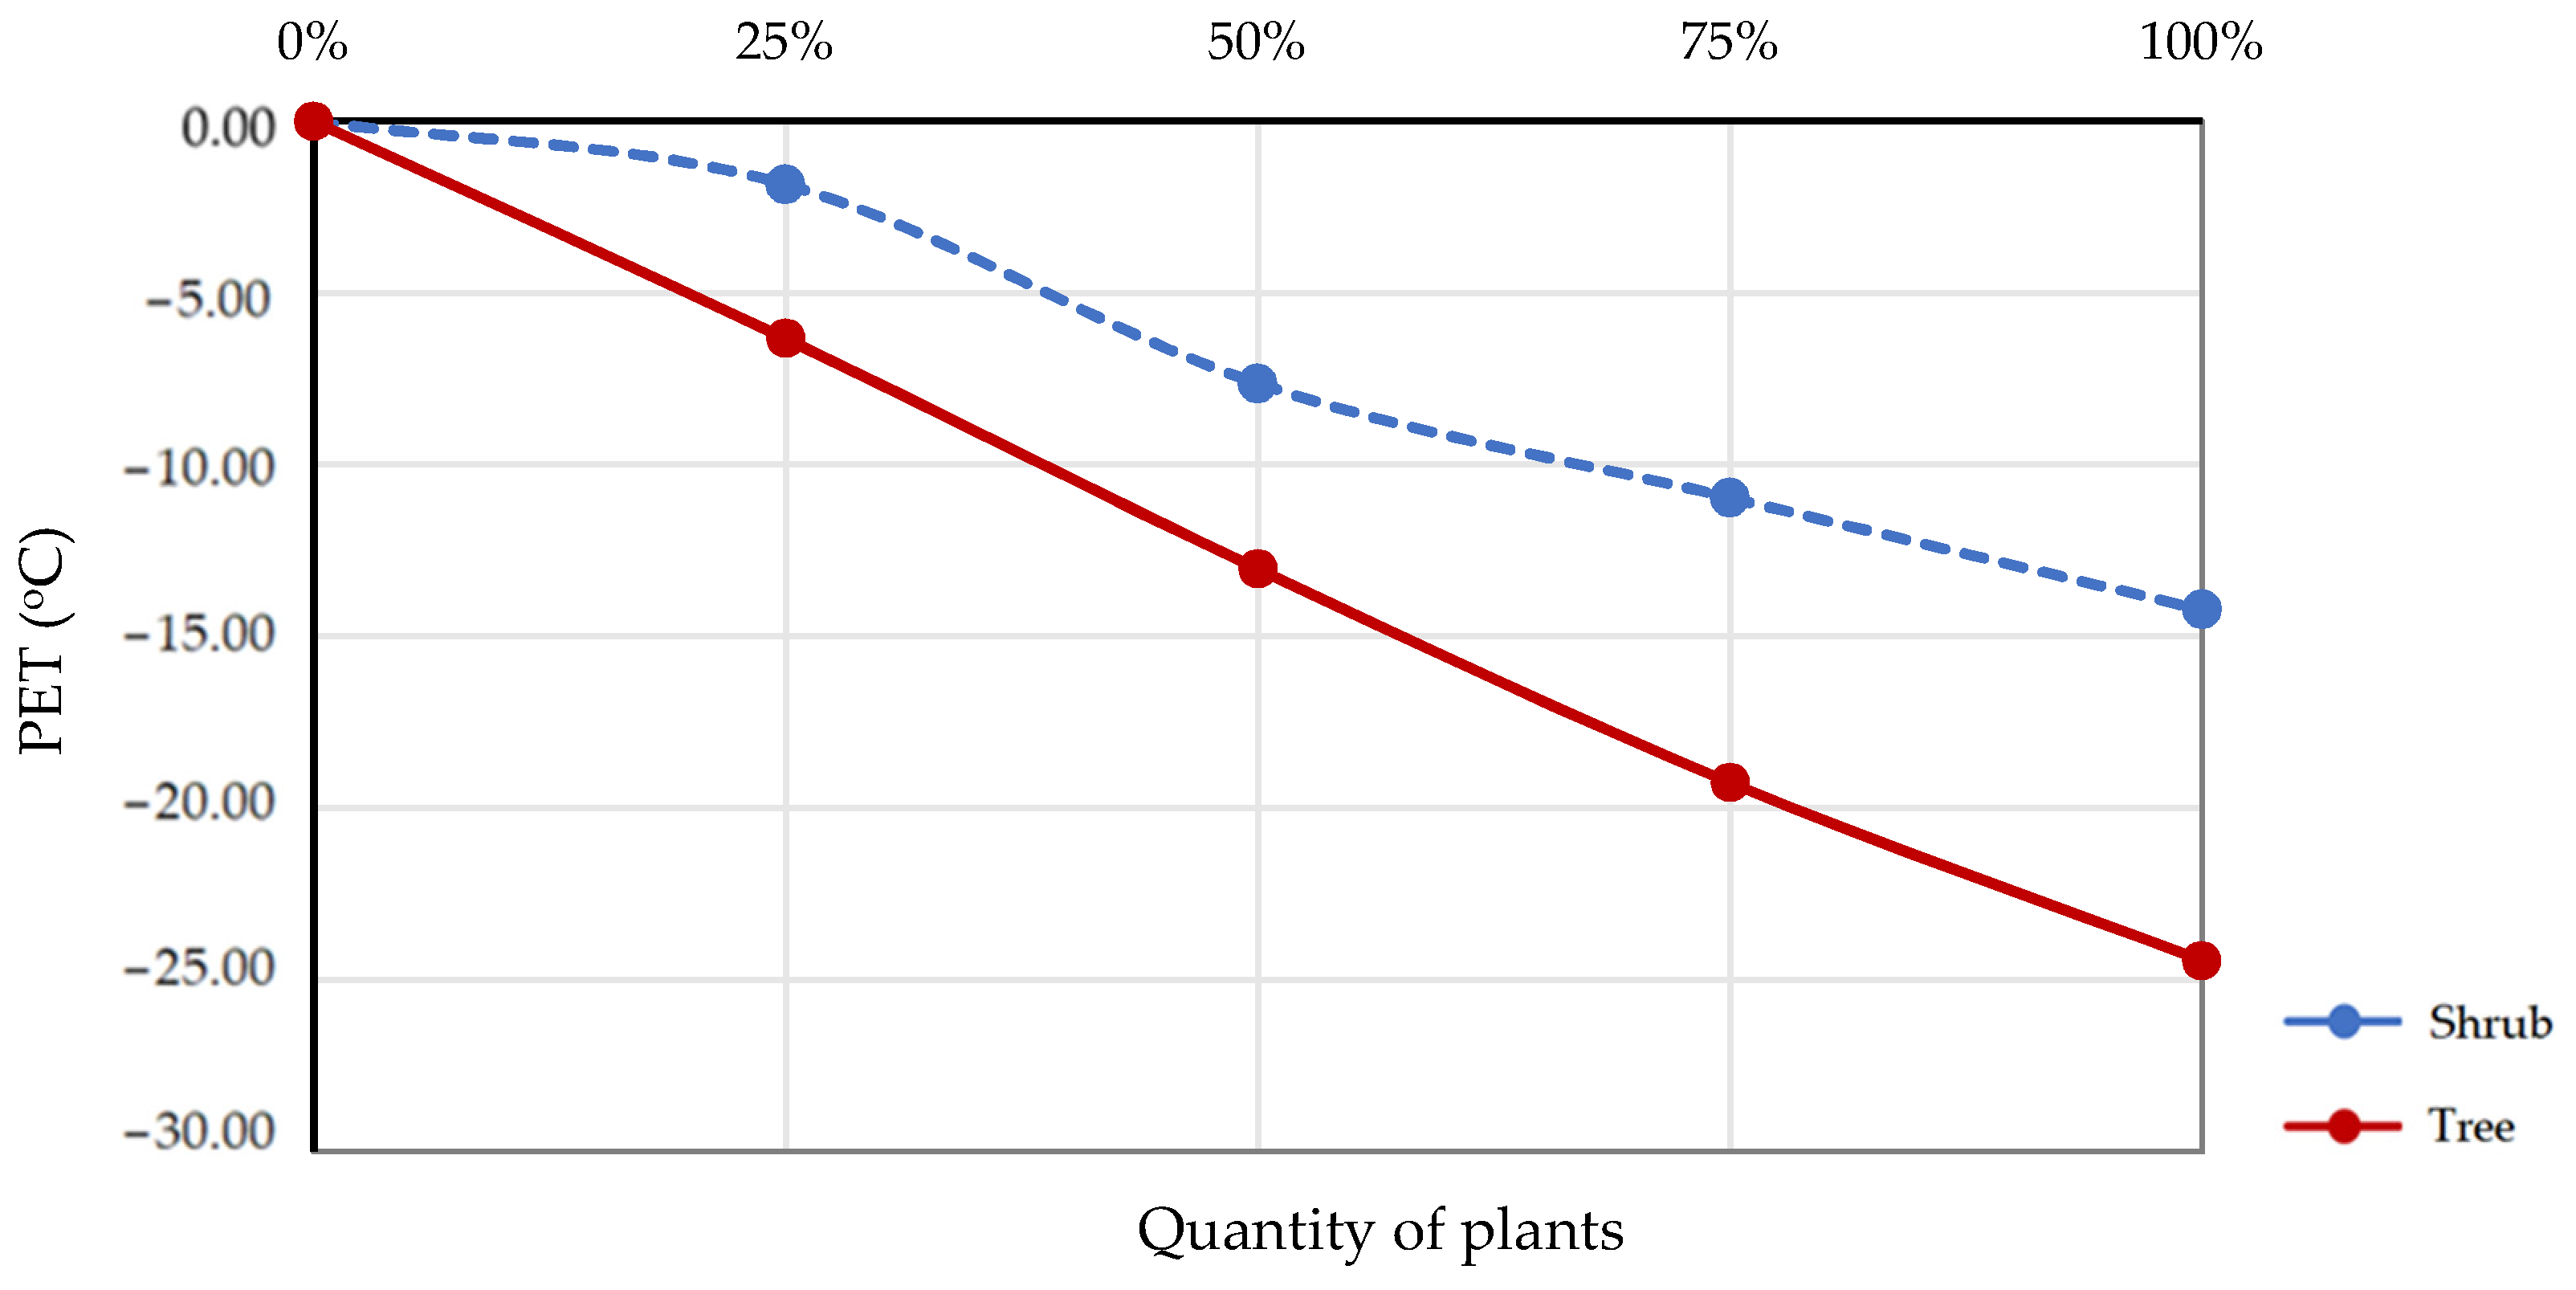
In the shrubs case, the PET values begin to change rapidly after the number of shrubs was more than 30%, while in the trees case, the PET values changed at a nearly constant rate, as shown in
Figure 12.
In
Figure 12, the dotted line shows the decrease in PET values due to adding more shrubs, while the continuous line shows the decrease in PET values due to the increasing number of trees. The trees were more effective at increasing the outdoor thermal comfort than shrubs when comparing the same quantities. It was also found that the more plants added, the lower the PET value was. However, if only PET values were compared, it may not be possible to determine which cases were the most effective because it also needs to be compared with the cost, as if the number of trees increases, the cost will be higher. Comparisons between the change in the PET value and the cost of each case can be seen in
Table 2.
The data in
Table 2 were used to calculate the environmental improvement cost eco-efficiency according to Equation (2). The results of the eco-efficiency calculations can be seen in
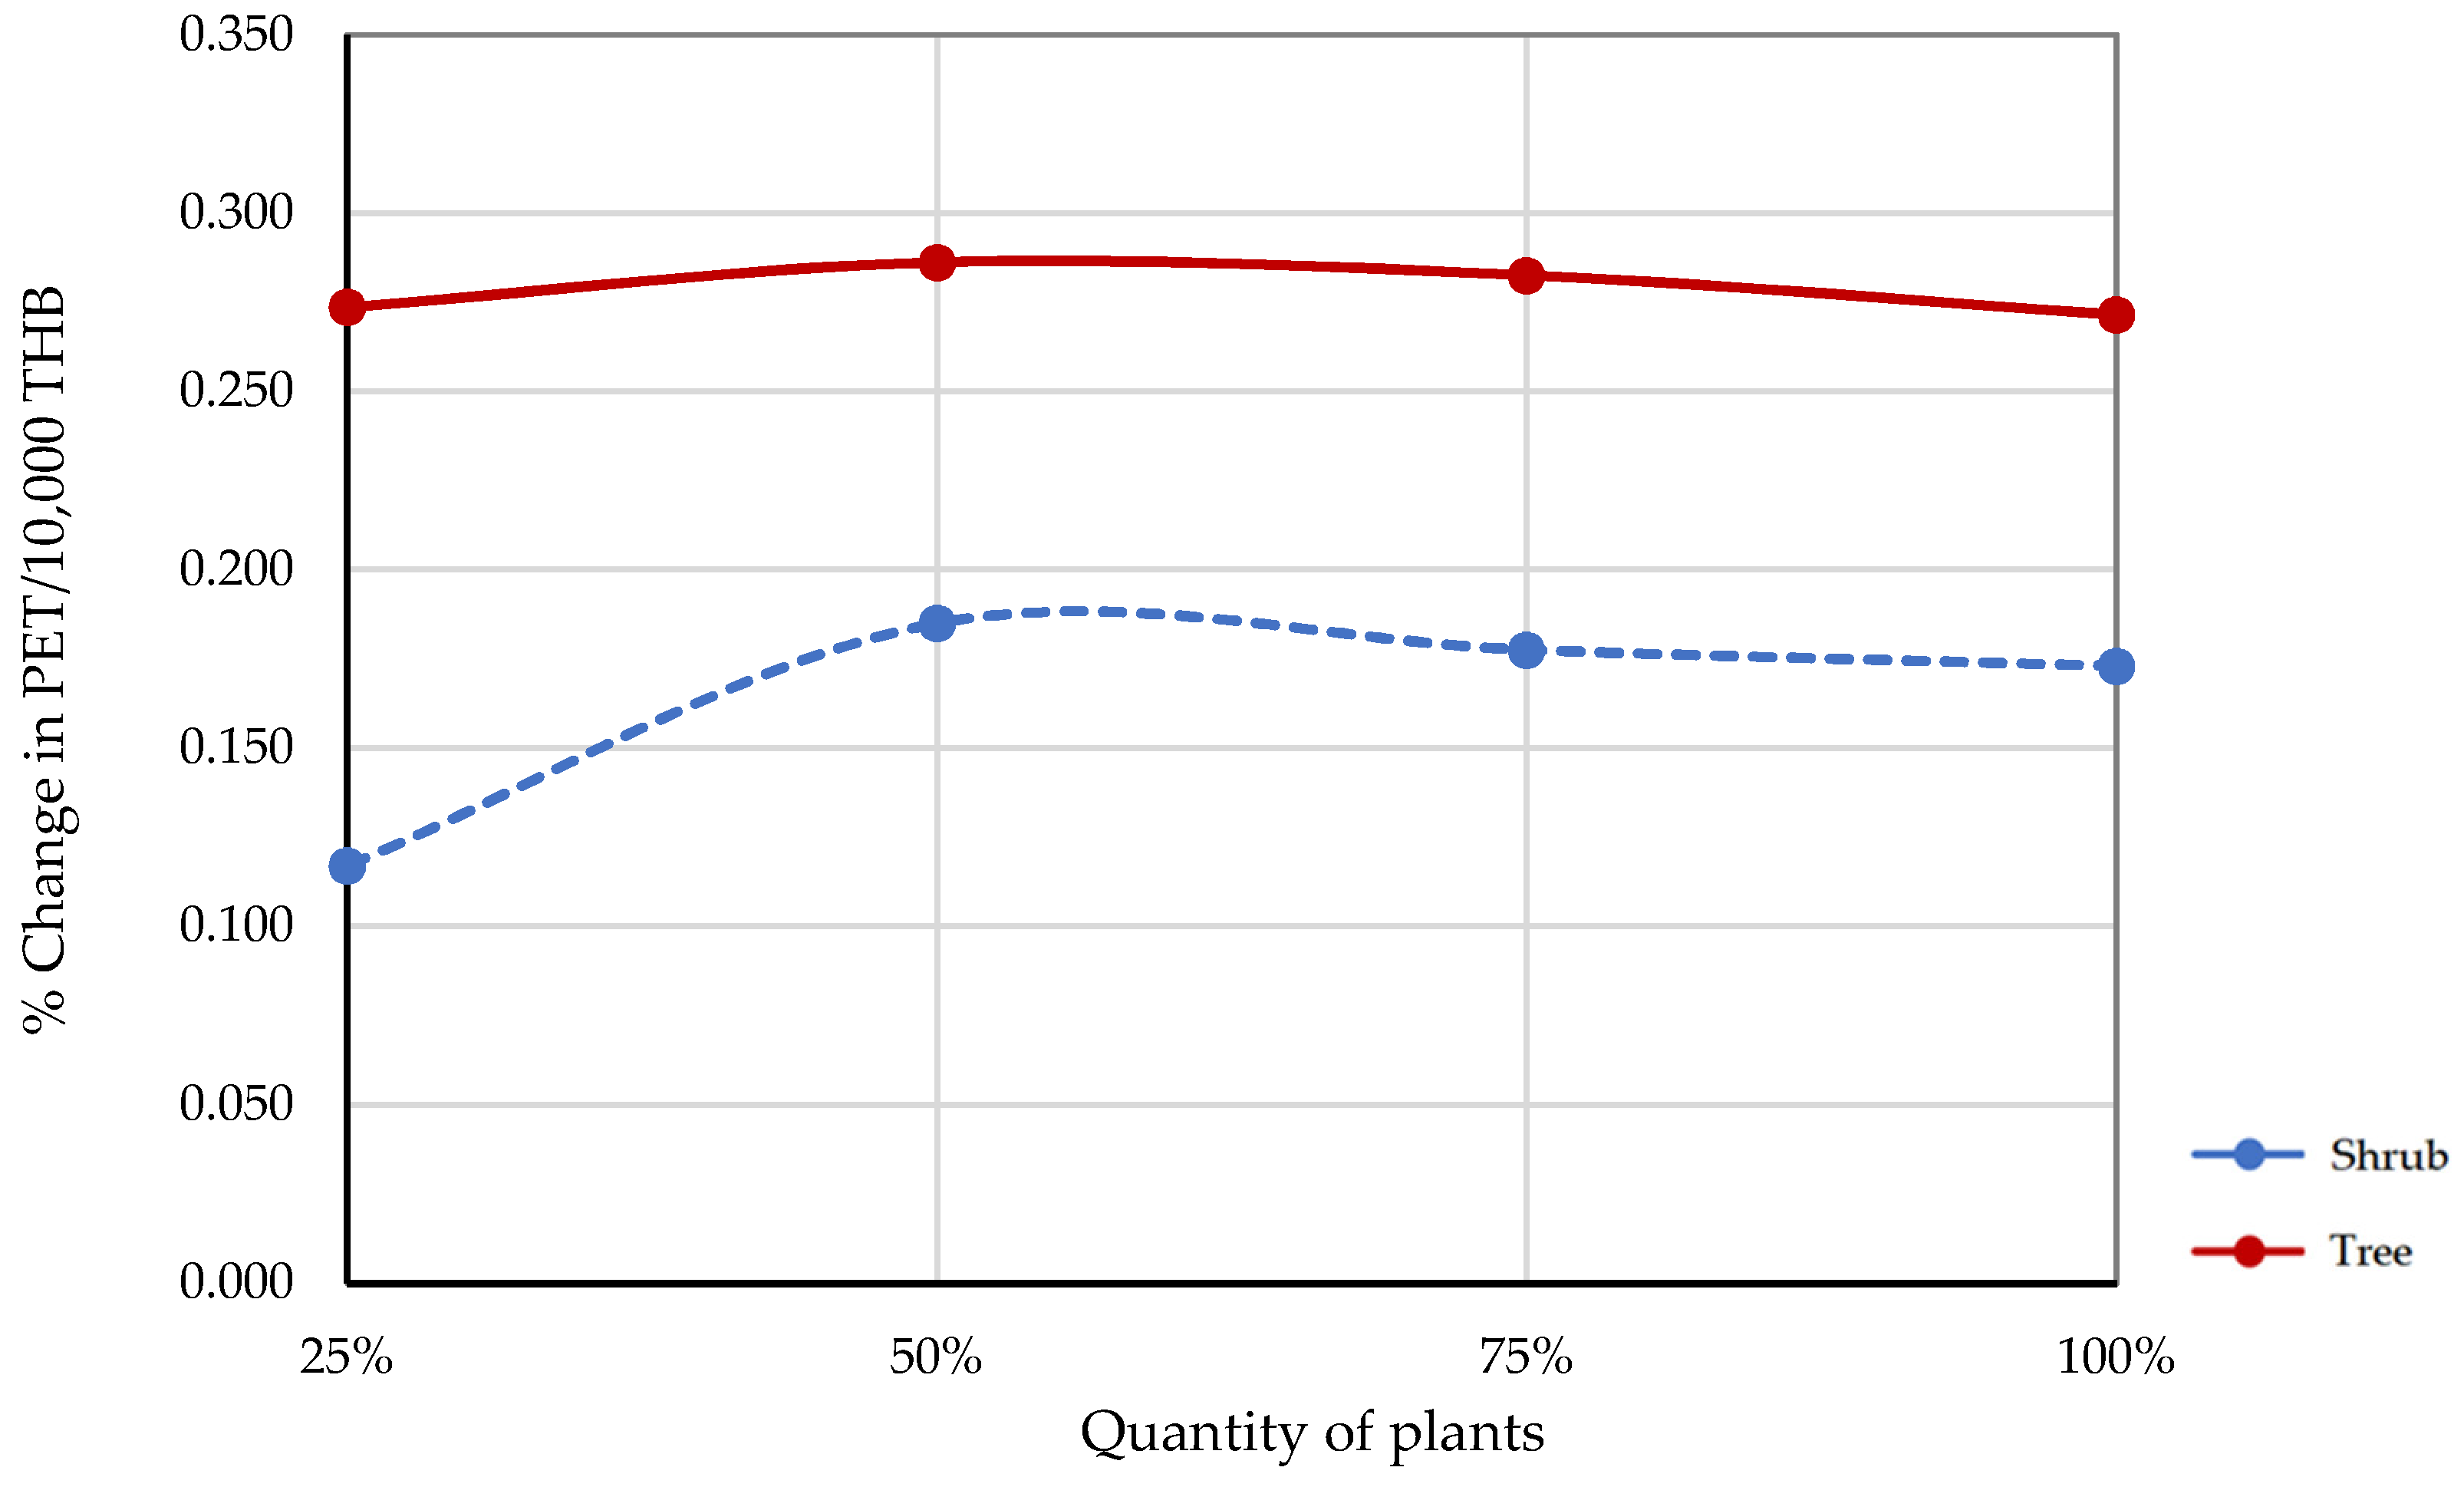
Figure 13.
In
Figure 13, the dotted line represents the efficiency of shrubs for all four alternatives. In comparison, the continuous line represents the trees efficiency of the four alternatives, calculated from the reduction in PET cost relative to the cost according to Equation (2). This change in PET value relative to cost indicated the appropriate number of plants for designing an outdoor open space. Comparatively, in the case of 50% plant quantity, a cost of THB 10,000 will result in a reduction of the PET value by around 0.28, but this reduction was only 0.18 for shrubs. Additionally, the trend in the graph should be considered, as the graphs for each alternative reached a maximum between 25% and 100%, indicating that increasing the number of trees may not be profitable. The graph of the tree case had a higher eco-efficiency than the shrubs in all cases. For both cases, eco-efficiency initially tended to increase by 50%. After that, the shrub line showed an increasing trend, while the trees only showed a slight increase. The orange line tended to stay quite constant, but the graph of shrubs exhibits a noticeable change. In addition, the highest eco-efficiency will be at 50% plant coverage, and after 50%, the graph decreased in both cases, indicating that the optimum number of plants in this study was approximately 50%. This finding suggests that putting trees in over 50% of the space will increase expenses and decrease eco-efficiency.
4. Discussion
This study investigated the environmental improvement cost via the eco-efficiency of trees affecting the outdoor thermal comfort using calibrated weather data from stations for simulations. In the ENVI-met simulation program, PET values were obtained and compared with the costs used in each case study. The results showed that the eco-efficiency of trees was higher than that of shrubs in all cases. There are three important findings from the discussion, which could be simplified and explained as follows:
- (1)
Trees and shrubs can increase thermal comfort, especially in extreme cases. The results showed that at 2:30 p.m., adding at least 50% shrubs in an area can significantly reduce the PMV because it increases the relative humidity of the air. In addition, the plant photosynthesis process can also reduce some of the solar radiation [
43]. For 25% shrub coverage, the PMV value was almost unchanged. These results were consistent with the study of Chang et al. [
44], which suggested that open spaces in urban areas should have at least 30% of shrubs to increase thermal comfort. In the case of trees, they provided significant thermal comfort improvement in the late morning (8:00 a.m.–10:00 a.m.) and late afternoon (3:00 p.m.–5:00 p.m.). It is likely that using trees will help absorb and block more solar radiation than shrubs because the trees provide more cover than shrubs due to their height;
- (2)
Trees are more effective than shrubs in reducing temperature and increasing thermal comfort. The possible main reason for the trees better performance is because trees have more shading, which can block and absorb more solar radiation than shrubs. In addition, trees have gaps for the wind to blow through at human height, while most shrub lines will block the wind, meaning trees can significantly reduce PET values more than shrubs [
1,
45], which means that the eco-efficiency of trees is higher than the shrubs in all cases;
- (3)
While more trees means higher thermal comfort, 50% of trees gave the highest eco-efficiency. This issue is because the rate of cost increase is higher than the rate of PET change. However, plant selection might play a role. For example, younger trees cost less to purchase, transport, and install, but may take a few years for them to perform at full capacity. Alternatively, local species may require less maintenance and cost less than imported trees;
- (4)
Based on these findings, it can be stated that the potential for trees to improve thermal comfort in outdoor open spaces, particularly in an urban area, is greater compared to shrubs. The findings are also consistent with the Konarska et al.’s [
46] study, which found that a single urban tree has the capacity to minimize heat stress in urban environments, and also highlights the significance of urban trees in impacting the health and well-being of local residents [
47].
Eventually, the contributions of the study are essential for urban planning because urban vegetation will influence the physical and biological characteristics of that area and increase ecosystem services of the area surrounding the green spaces, as well as increase the property values and human well-being. Planning and selecting suitable plants will result in a better and more livable urban environment, since a lack of adequate planning can cost resources or even the quality of life for inhabitants and residents.
There are several limitations to this exploratory study. First, the eco-efficiency in this model does not address all ecosystem benefits. Aesthetics, stormwater management, property values, and human activities may be considered further in future models. Secondly, different trees and shrubs may have different shapes, canopy densities, and maintenance requirements. The study only addressed the most common street trees, but plant selections are an important part of spatial design and should be considered further in the future design processes. For example, deciduous trees may lose their leaves over the dry season of Thailand, which is the season with the most extreme temperatures. Thirdly, the costs of trees and maintenance were highly estimated by the local stores and were not compared to other databases, which reduced the generalizability of this study. Furthermore, tree costs vary greatly based on species, sizes, and health of the trees. Additional seasons should be examined for future research to compare the annual trend and obtain more effective insights. Furthermore, validating the data is necessary to provide the most trustworthy results. However, the authors believe that the study still provides a strong base point for future research in eco-efficiency of urban plants, and these limitations should be carefully addressed in the upcoming studies.
5. Conclusions
This research aims to investigate the eco-efficiency of trees in the comfort of outdoor spaces, as measured by the ratio between the change in the physiological equivalent temperature (PET) and the cost of the trees in the design. Using the ENVI-met application, one may acquire PET values. Field data were collected and compared to station data to calibrate and develop a base case model. After the base case model was established, shrub and tree models were produced by adding plants to between 25% and 100% of the research area. Then, each design’s eco-efficiency was determined based on the investigated cost obtained from plants shop in the Chiang Mai area. In all cases, adding additional trees to the study site increased the eco-efficiency values more than adding shrubs, and increasing tree coverage to 50% resulted in the highest eco-efficiency compared to the other alternatives. In contrast, adding shrub coverage at 25% produced the lowest eco-efficiency. The results of this study will present an alternate design strategy that aids outdoor space designers in their decision-making on the type and quantity of trees that are appropriate for their investment in developing outdoor public space areas.
Author Contributions
Conceptualization, K.T., T.K.N.A. and D.R.; methodology, N.P., S.T. and D.R.; validation, N.P. and D.R.; formal analysis, N.P. and D.R.; investigation, N.P. and S.T.; resources, T.K.N.A., P.S. (Pongsakorn Suppakittpaisarnand), P.T. (Prattakorn Sittisom) and D.R.; data curation, N.P.; writing—original draft preparation, K.T., N.P. and D.R.; writing—review and editing, D.R. and P.S. (Pongsakorn Suppakittpaisarnand); supervision, K.T., P.S. (Pongsakorn Suppakittpaisarnand) and D.R.; project administration, T.K.N.A. and D.R. All authors have read and agreed to the published version of the manuscript.
Funding
This research has received funding support from the NSRF via the Program Management Unit for Human Resources & Institutional Development, Research and Innovation (grant number B16F640172).
Institutional Review Board Statement
Not applicable.
Informed Consent Statement
Not applicable.
Data Availability Statement
Not applicable.
Acknowledgments
The authors wish to thank support staff from the City Research and Development Center (City R&D), Faculty of Engineering, Chiang Mai University, and the Center of Excellence in Natural Disaster Management (CENDiM), Chiang Mai University, Thailand.
Conflicts of Interest
The authors declare no conflict of interest.
References
- Rinchumphu, D.; Phichetkunbodee, N.; Pomsurin, N.; Sundaranaga, C.; Tepweerakun, S.; Chaichana, C. Outdoor thermal comfort improvement of campus public space. Adv. Technol. Innov. 2021, 6, 128. [Google Scholar] [CrossRef]
- Priya, U.K.; Senthil, R. A review of the impact of the green landscape interventions on the urban microclimate of tropical areas. Build. Environ. 2021, 205, 108190. [Google Scholar] [CrossRef]
- He, B.-J.; Wang, J.; Liu, H.; Ulpiani, G. Localized synergies between heat waves and urban heat islands: Implications on human thermal comfort and urban heat management. Environ. Res. 2021, 193, 110584. [Google Scholar] [CrossRef] [PubMed]
- Al-Sallal, K.A.; AboulNaga, M.M.; Alteraifi, A.M. Impact of urban spaces and building height on airflow distribution: Wind tunnel testing of an urban setting prototype in Abu-Dhabi city. Archit. Sci. Rev. 2001, 44, 227–232. [Google Scholar] [CrossRef]
- Alobaydi, D.; Mohamed, H.; Attya, H. The impact of urban structure changes on the airflow speed circulation in historic Karbala, Iraq. Procedia Eng. 2015, 118, 670–674. [Google Scholar] [CrossRef]
- Gatto, E.; Buccolieri, R.; Aarrevaara, E.; Ippolito, F.; Emmanuel, R.; Perronace, L.; Santiago, J.L. Impact of urban vegetation on outdoor thermal comfort: Comparison between a Mediterranean city (Lecce, Italy) and a northern European city (Lahti, Finland). Forests 2020, 11, 228. [Google Scholar] [CrossRef]
- Edwards, D.J.; Holt, G.D.; Harris, F.C. A comparative analysis between the multilayer perceptron “neural network” and multiple regression analysis for predicting construction plant maintenance costs. J. Qual. Maint. Eng. 2000, 6, 45–61. [Google Scholar] [CrossRef]
- Zhao, Q.; Lian, Z.; Lai, D. Thermal comfort models and their developments: A review. Energy Built Environ. 2021, 2, 21–33. [Google Scholar] [CrossRef]
- Blazejczyk, K.; Epstein, Y.; Jendritzky, G.; Staiger, H.; Tinz, B. Comparison of UTCI to selected thermal indices. Int. J. Biometeorol. 2012, 56, 515–535. [Google Scholar] [CrossRef]
- Matzarakis, A.; Mayer, H.; Iziomon, M.G. Applications of a universal thermal index: Physiological equivalent temperature. Int. J. Biometeorol. 1999, 43, 76–84. [Google Scholar] [CrossRef]
- Srivanit, M.; Auttarat, S. Thermal comfort conditions of urban spaces in a hot-humid climate of chiang mai city, thailand. In Proceedings of the The 9th International Conference on Urban Climate, Toulouse, France, 20–24 July 2015. [Google Scholar]
- Auliciems, A.; Szokolay, S.V. Thermal comfort. In Proceedings of the PLEA: Passive and Low Energy Architecture International, Kushiro, Japan, 8-10 January 1997. [Google Scholar]
- Honjo, T. Thermal comfort in outdoor environment. Glob. Environ. Res. 2009, 13, 43–47. [Google Scholar]
- Zare, S.; Hasheminejad, N.; Shirvan, H.E.; Hemmatjo, R.; Sarebanzadeh, K.; Ahmadi, S. Comparing Universal Thermal Climate Index (UTCI) with selected thermal indices/environmental parameters during 12 months of the year. Weather. Clim. Extrem. 2018, 19, 49–57. [Google Scholar] [CrossRef]
- Baizhan, L.; Meilan, T.; Hong, L.; Xiaolei, M.; Wenjie, Z. Occupant’s perception and preference of thermal environment in free-running buildings in China. Indoor Built Environ. 2010, 19, 405–412. [Google Scholar] [CrossRef]
- Srivanit, M.; Jareemit, D. Human thermal perception and outdoor thermal comfort under shaded conditions in summer: A field study in an institutional campus. In Proceedings of the Proceeding of the 6th International Conference on Sustainable Energy and Environment (SEE 2016), Bangkok, Thailand, 28–30 November 2016. [Google Scholar]
- Wattanachai, P.; Sundaranga, C.; Kridakorn Na Ayutthaya, T.; Phichetkunbodee, N.; Rinchumphu, D. Study of Universal Thermal Comfort Index in housing estate public space in Bangkok, Thailand. J. Des. Built Environ. 2021, 21, 10–18. [Google Scholar] [CrossRef]
- Sayad, B.; Alkama, D.; Rebhi, R.; Menni, Y.; Ahmad, H.; Inc, M.; Sharifpur, M.; Lorenzini, G.; Azab, E.; Elnaggar, A.Y. Outdoor thermal comfort optimization through vegetation parameterization: Species and tree layout. Sustainability 2021, 13, 11791. [Google Scholar] [CrossRef]
- Othman, H.A.S.; Alshboul, A.A. The role of urban morphology on outdoor thermal comfort: The case of Al-Sharq City—Az Zarqa. Urban Clim. 2020, 34, 100706. [Google Scholar] [CrossRef]
- Lane, M.A.; Walawender, M.; Brownsword, E.A.; Pu, S.; Saikawa, E.; Kraft, C.S.; Davis, R.E. The impact of cold weather on respiratory morbidity at Emory Healthcare in Atlanta. Sci. Total Environ. 2022, 813, 152612. [Google Scholar] [CrossRef]
- Ebi, K.L.; Capon, A.; Berry, P.; Broderick, C.; de Dear, R.; Havenith, G.; Honda, Y.; Kovats, R.S.; Ma, W.; Malik, A.; et al. Hot weather and heat extremes: Health risks. Lancet 2021, 398, 698–708. [Google Scholar] [CrossRef]
- Benevolenza, M.A.; DeRigne, L. The impact of climate change and natural disasters on vulnerable populations: A systematic review of literature. J. Hum. Behav. Soc. Environ. 2019, 29, 266–281. [Google Scholar] [CrossRef]
- Yang, Y.; Bai, Y.; Zhang, R.; Zhu, X. The effect of thermal environment on stress and thermal comfort of college students under acute stress. Indoor Built Environ. 2022, 31, 2226–2239. [Google Scholar] [CrossRef]
- Aram, F.; Higueras García, E.; Solgi, E.; Mansournia, S. Urban green space cooling effect in cities. Heliyon 2019, 5, e01339. [Google Scholar] [CrossRef] [PubMed]
- Erell, E.; Pearlmutter, D.; Williamson, T. Urban Microclimate: Designing the Spaces between Buildings; Routledge: Oxfordshire, UK, 2012. [Google Scholar]
- Herb, W.R.; Janke, B.; Mohseni, O.; Stefan, H.G. Ground surface temperature simulation for different land covers. J. Hydrol. 2008, 356, 327–343. [Google Scholar] [CrossRef]
- Gremmen, N.J.M.; Smith, V.R.; van Tongeren, O.F.R. Impact of trampling on the vegetation of subantarctic Marion Island. Arct. Antarct. Alp. Res. 2003, 35, 442–446. [Google Scholar] [CrossRef]
- Tan, C.L.; Wong, N.H.; Tan, P.Y.; Jusuf, S.K.; Chiam, Z.Q. Impact of plant evapotranspiration rate and shrub albedo on temperature reduction in the tropical outdoor environment. Build. Environ. 2015, 94, 206–217. [Google Scholar] [CrossRef]
- Deng, L.; Jia, X.; Wang, W.; Hussain, S.A. Revealing impacts of trees on modeling microclimate behavior in spaces between buildings through simulation monitoring. Buildings 2022, 12, 1168. [Google Scholar] [CrossRef]
- Akbari, H.; Pomerantz, M.; Taha, H. Cool surfaces and shade trees to reduce energy use and improve air quality in urban areas. Sol. Energy 2001, 70, 295–310. [Google Scholar] [CrossRef]
- Hanson, P.; Frank, M. The Human Health and Social Benefits of Urban Forests; Dovetail Partners, Inc.: Minneapolis, MN, USA, 2016. [Google Scholar]
- Bertram, C.; Rehdanz, K. The role of urban green space for human well-being. Ecol. Econ. 2015, 120, 139–152. [Google Scholar] [CrossRef]
- Caynes, R.J.C.; Mitchell, M.G.E.; Wu, D.S.; Johansen, K.; Rhodes, J.R. Using high-resolution LiDAR data to quantify the three-dimensional structure of vegetation in urban green space. Urban Ecosyst. 2016, 19, 1749–1765. [Google Scholar] [CrossRef]
- Christen, B.; Dalgaard, T. Buffers for biomass production in temperate European agriculture: A review and synthesis on function, ecosystem services and implementation. Biomass Bioenergy 2013, 55, 53–67. [Google Scholar] [CrossRef]
- Caiado, R.G.G.; de Freitas Dias, R.; Mattos, L.V.; Quelhas, O.L.G.; Filho, W.L. Towards sustainable development through the perspective of eco-efficiency—A systematic literature review. J. Clean. Prod. 2017, 165, 890–904. [Google Scholar] [CrossRef]
- Huppes, G.; Ishikawa, M. A framework for quantified eco-efficiency analysis. J. Ind. Ecol. 2005, 9, 25–41. [Google Scholar] [CrossRef]
- Bonyad, R.; Hamzenejad, M.; Khanmohammadi, M. Ranking the regenerative architecture indicators for assessment of research-educational building projects in Tehran, Iran. Smart Sustain. Built Environ. 2020, 9, 27–37. [Google Scholar] [CrossRef]
- Potsdam-Institut fur klimafolgenforschung EV. Final Report Summary—Reconciling Adaptation, Mitigation and Sustainable Development for Cities (RAMSES); EU Publications Office: The Community Research and Development Information Service (CORDIS): Luxembourg, 2018; Available online: https://cordis.europa.eu/project/id/308497/reporting (accessed on 15 January 2023).
- Beck, H.E.; Zimmermann, N.E.; McVicar, T.R.; Vergopolan, N.; Berg, A.; Wood, E.F. Present and future Köppen-Geiger climate classification maps at 1-km resolution. Sci. Data 2018, 5, 180214. [Google Scholar] [CrossRef] [PubMed]
- Wu, L.; Xia, H.; Wang, X.; Dong, Q.; Lin, C.; Liu, X.; Liang, R. Indoor air quality and passenger thermal comfort in Beijing metro transfer stations. Transp. Res. Part D: Transp. Environ. 2020, 78, 102217. [Google Scholar] [CrossRef]
- Salata, F.; Golasi, I.; de Lieto Vollaro, R.; de Lieto Vollaro, A. Urban microclimate and outdoor thermal comfort. A proper procedure to fit ENVI-met simulation outputs to experimental data. Sustain. Cities Soc. 2016, 26, 318–343. [Google Scholar] [CrossRef]
- Matzarakis, A.; Mayer, H. Heat stress in Greece. Int. J. Biometeorol. 1997, 41, 34–39. [Google Scholar] [CrossRef]
- Durand, M.; Murchie, E.H.; Lindfors, A.V.; Urban, O.; Aphalo, P.J.; Robson, T.M. Diffuse solar radiation and canopy photosynthesis in a changing environment. Agric. For. Meteorol. 2021, 311, 108684. [Google Scholar] [CrossRef]
- Chang, C.-R.; Li, M.-H. Effects of urban parks on the local urban thermal environment. Urban For. Urban Green. 2014, 13, 672–681. [Google Scholar] [CrossRef]
- Srivanit, M.; Jareemit, D. Modeling the influences of layouts of residential townhouses and tree-planting patterns on outdoor thermal comfort in Bangkok suburb. J. Build. Eng. 2020, 30, 101262. [Google Scholar] [CrossRef]
- Konarska, J.; Lindberg, F.; Larsson, A.; Thorsson, S.; Holmer, B. Transmissivity of solar radiation through crowns of single urban trees—Application for outdoor thermal comfort modelling. Theor. Appl. Climatol. 2014, 117, 363–376. [Google Scholar] [CrossRef]
- Rötzer, T.; Moser-Reischl, A.; Rahman, M.A.; Grote, R.; Pauleit, S.; Pretzsch, H. Modelling urban tree growth and ecosystem services: Review and perspectives. In Progress in Botany; Cánovas, F.M., Lüttge, U., Risueño, M.-C., Pretzsch, H., Eds.; Springer International Publishing: Cham, Switzerland, 2021; Volume 82, pp. 405–464. [Google Scholar]
Figure 1.
Research framework.
Figure 1.
Research framework.
Figure 2.
Study area at Faculty of Engineering, Chiang Mai University.
Figure 2.
Study area at Faculty of Engineering, Chiang Mai University.
Figure 3.
Installing instruments to collect field data, 17 June 2020.
Figure 3.
Installing instruments to collect field data, 17 June 2020.
Figure 4.
Example of data input into ENVI-met.
Figure 4.
Example of data input into ENVI-met.
Figure 5.
(a) A representative of a shrub (Ixora x williamsii Hort) and (b) a representative of a tree (Saraca indica L.), type of plants that are often used in Chiang Mai landscape designs.
Figure 5.
(a) A representative of a shrub (Ixora x williamsii Hort) and (b) a representative of a tree (Saraca indica L.), type of plants that are often used in Chiang Mai landscape designs.
Figure 6.
Comparison diagram of mean radiant temperature (Tmrt) from field monitoring and calibration Round 1 to Round 10.
Figure 6.
Comparison diagram of mean radiant temperature (Tmrt) from field monitoring and calibration Round 1 to Round 10.
Figure 7.
(a) Alternative 1, shrubs over 25%, 50%, 75%, and 100% of the study area; (b) alternative 2, trees over 25%, 50%, 75%, and 100% of the study area.
Figure 7.
(a) Alternative 1, shrubs over 25%, 50%, 75%, and 100% of the study area; (b) alternative 2, trees over 25%, 50%, 75%, and 100% of the study area.
Figure 8.
Temperature and relative humidity for April 13 in the ENVI-met program.
Figure 8.
Temperature and relative humidity for April 13 in the ENVI-met program.
Figure 9.
Relationship between PMV and PET.
Figure 9.
Relationship between PMV and PET.
Figure 10.
(a) Color chart showing PMV values of Alternative 1 from simulation; (b) Color chart showing PMV values of Alternative 2 from simulation.
Figure 10.
(a) Color chart showing PMV values of Alternative 1 from simulation; (b) Color chart showing PMV values of Alternative 2 from simulation.
Figure 11.
Change in PET compared to the base case from simulation results.
Figure 11.
Change in PET compared to the base case from simulation results.
Figure 12.
Comparison of PET change from trees and shrubs during the daytime.
Figure 12.
Comparison of PET change from trees and shrubs during the daytime.
Figure 13.
Results of eco-efficiency calculations (% change in PET/ THB 10,000).
Figure 13.
Results of eco-efficiency calculations (% change in PET/ THB 10,000).
Table 1.
Calibration results.
Table 1.
Calibration results.
| Round | 1 | 2 | 3 | 4 | 5 | 6 | 7 | 8 | 9 | 10 |
|---|
| TA (°C) | TA | TA | TA | TA | 1.1 × TA | 1.05 × TA | 0.9 × TA | 0.8 × TA | TA | TA |
| RH (%) | RH | RH | RH | RH | RH | RH | RH | RH | 1.05 × RH | 0.95 × RH |
| Vw (m/s) | 1.77 | 1.77 | 1.77 | 1.77 | 1.77 | 1.77 | 1.77 | 1.77 | 1.77 | 1.77 |
| S (W/m2) | S | 1.5 × S | 0.7 × S | 0.5 × S | S | S | S | S | S | S |
| AVR cal. Tmrt | 62.25 | 80.64 | 50.61 | 42.67 | 64.24 | 63.24 | 60.23 | 58.17 | 62.08 | 62.44 |
| AVR field Tmrt | 52.82 | 52.82 | 52.82 | 52.82 | 52.82 | 52.82 | 52.82 | 52.82 | 52.82 | 52.82 |
| RMSE | 10.44 | 28.25 | 4.63 | 10.83 | 12.21 | 11.31 | 8.74 | 7.20 | 10.28 | 10.61 |
Table 2.
Comparisons between change in PET value and cost of each case.
Table 2.
Comparisons between change in PET value and cost of each case.
| Alternative | Quantity | Cost (THB) | PET Change (%) |
|---|
| Shrub | 36 | 36,000 | 0.42 |
| 72 | 72,000 | 1.33 |
| 108 | 108,000 | 1.92 |
| 144 | 144,000 | 2.49 |
| Tree | 4 | 40,000 | 1.09 |
| 8 | 80,000 | 2.29 |
| 12 | 120,000 | 3.39 |
| 16 | 160,000 | 4.34 |
| Disclaimer/Publisher’s Note: The statements, opinions and data contained in all publications are solely those of the individual author(s) and contributor(s) and not of MDPI and/or the editor(s). MDPI and/or the editor(s) disclaim responsibility for any injury to people or property resulting from any ideas, methods, instructions or products referred to in the content. |
© 2023 by the authors. Licensee MDPI, Basel, Switzerland. This article is an open access article distributed under the terms and conditions of the Creative Commons Attribution (CC BY) license (https://creativecommons.org/licenses/by/4.0/).
