1. Introduction
As technology progresses, the expectations of developing green energy will increase with the growing global competition. However, the carbon dioxide generated through power generation still accounts for about one third of the worldwide emissions [
1]. According to statistics, the energy consumption of commercial buildings accounts for about 40% of global energy consumption [
2,
3], and most of the energy consumption comes from heating, ventilation, and air-conditioning (HVAC) systems [
4,
5]. Therefore, the energy-saving optimization of the building’s central air conditioning plays a pivotal role in sustainable development.
Much energy-saving optimization research of the building central air conditioning has been conducted in the area of optimization algorithms, as well as advance control strategies. For example, Shi et al. established dynamic programming algorithms based on the partial load characteristics of chillers to solve the optimal load distribution of chillers [
6]. Huang et al. proposed to optimize the number of chillers in operation by adjusting the cooling load nodes and condensating set temperature [
7]. Ma analyzed and compared various energy-saving strategies of chillers and found that the parallel operation strategy of the same type of chiller has the highest energy-saving benefit [
8]. Weng et al. described a unit optimization and simulation algorithm by studying the energy consumption of different unit configuration schemes under the same cooling demand [
9]. Relying on the cooling load estimation algorithm, Beghi et al. revealed a multi-unit energy-saving optimization method [
10]. Ma et al. considered the power consumption of the refrigeration unit and the cooling tower. They used the performance map and exhaustive search (PMES) method to solve the cooling water temperature with the minimum power consumption [
11]. Yu and Chan proposed a load-based speed control strategy to control the cooling water flow and cooling tower fan speed, which can reduce the annual power consumption of the HVAC system [
12]. Yu et al. provided a graded number of air-conditioning control strategies to improve the stability of indoor temperature and humidity [
13]. Based on the government’s electricity consumption data platform, Zhou et al. analyzed building energy consumption levels using data-mining methods and provided suggestions for energy conservation [
14]. However, implementation is complex, and users will not cooperate. Lei et al. used rough set theory to simplify the data of 100 civil public buildings. A neural network scheme is presented to predict building energy consumption [
15].
However, the above research on optimization algorithms and control strategies has limitations.
First limitation. Few investigations have been carried out on the building’s central air-conditioning operation framework for the low-latency, high-reliability, and safer energy-saving regulations. For instance, Lee et al. constructed an artificial intelligence implementation framework for building energy conservation and realized a three-level control of equipment, facilities, and buildings [
16]. However, this architecture is deployed locally in the building, which is costly and has poor reusability. Lee et al. used a combined algorithm to control the operation of air conditioners in the cloud, achieving higher energy efficiency [
17]. However, the implementation is more complicated, and the experimental object is a household split air conditioning. The advantages of cloud–edge–device collaboration technology have been widely certified, especially in terms of low latency, high reliability, and security [
18,
19,
20]. For example, Wen et al. used cloud–edge–device collaboration technology to effectively alleviate the decision-making pressure of single cloud computing or edge computing and improve the architecture’s real-time response capability, operational stability, and economy [
21]. Cloud computing can provide more efficient computing, and edge computing can offer a low delay. Only when cloud edge and end cooperate can they maximize the value of cloud and edge computing. Huang et al. used the cloud edge collaborative process monitoring method to train the model and perform fault detection at the edge layer in the cloud [
22].
Second limitation. Previous research ignores human comfort. Central air conditioning serves humans, but excessive energy-saving may adversely affect the indoor thermal comfort of the human body. Therefore, the control strategy of the central air conditioning needs to ensure the thermal comfort of the indoor human body. One of the classic prediction methods of human thermal comfort is the thermodynamic principle, such as the predicted mean vote (PMV) model proposed by Fanger [
23]. The main influencing variables of the PMV index are indoor temperature, indoor relative humidity, air velocity, clothing heat insulation rate, human metabolic rate, and radiation temperature. Fanger further improved the PMV model to estimate the average comfort level of all building occupants [
24]. Moreover, Taki verified that the PMV model could accurately predict the thermal comfort of the environment [
25]. However, the solution process of PMV is nonlinear, which can be improved by the neural network algorithm for its significant nonlinear approximation ability. A neural network is a neuron-based machine learning algorithm that learns the relationship between input (i.e., operating status, real-time environmental information) and output (i.e., comfort). If the operating status and real-time environmental information of the air conditioning are specified, the trained neural network model can predict the comfort level [
26].
Third limitation. Insufficient analysis of the comprehensive impact of the human–machine–environment factors on energy-saving control strategies. A stable power environment provides a guarantee for social power consumption. Using a unified power quality conditioner (UPQC) in a modern power environment, combined with distributed or artificial neural network technology, can effectively improve power quality [
27,
28]. Few approaches fully consider the comprehensive impact of the location of the building, room usage, number of people in the room, and control objects on energy-saving strategies. For example, the energy-saving effect of a similar control strategy is different for the same central air conditioning if the geographical location of the building is different [
29]. In addition, building orientation, area of the room, building structure materials and colors, etc., would all affect energy consumption [
30]. Khan et al. evaluated the energy-saving performance of the integrated use of phase change materials (PCM) in building envelopes and concluded that it is economically feasible to implement PCM in building envelope structures in some areas [
31]. For instance, Konstantinidou et al. studied the energy-saving optimization of building exterior wall structures based on phase change materials and optimized the indoor cooling demand and comfort time for typical office spaces [
32]. Farhan found that the color of the roof of the building will impact energy consumption [
33]. Moreover, Ma et al. found that the energy consumption of hospital buildings is much higher than that of office buildings and school buildings [
34], which means the flow of people in the building will also affect energy consumption. In summary, the optimal control of central air conditioning that considers the comprehensive impact of man–machine–environment factors is much more consistent with reality [
35,
36].
To cater to these limitations, this paper proposes an energy-saving and control framework for central air conditioning based on cloud–edge–device architecture. This framework establishes a neural network-based calculation and prediction model of indoor comfort. In addition, according to the operating state, the indoor comfort state index, and the building’s internal cooling load demand, an optimized energy-saving control scheme to ensure indoor comfort is designed. Finally, to ensure indoor comfort, this paper can reduce the energy consumption of building central air conditioning to the greatest extent through the implementation of different energy-saving control strategies.
2. Energy-Saving and Control Framework of the Central Air Conditioning Based on Cloud–Edge–Device Architecture
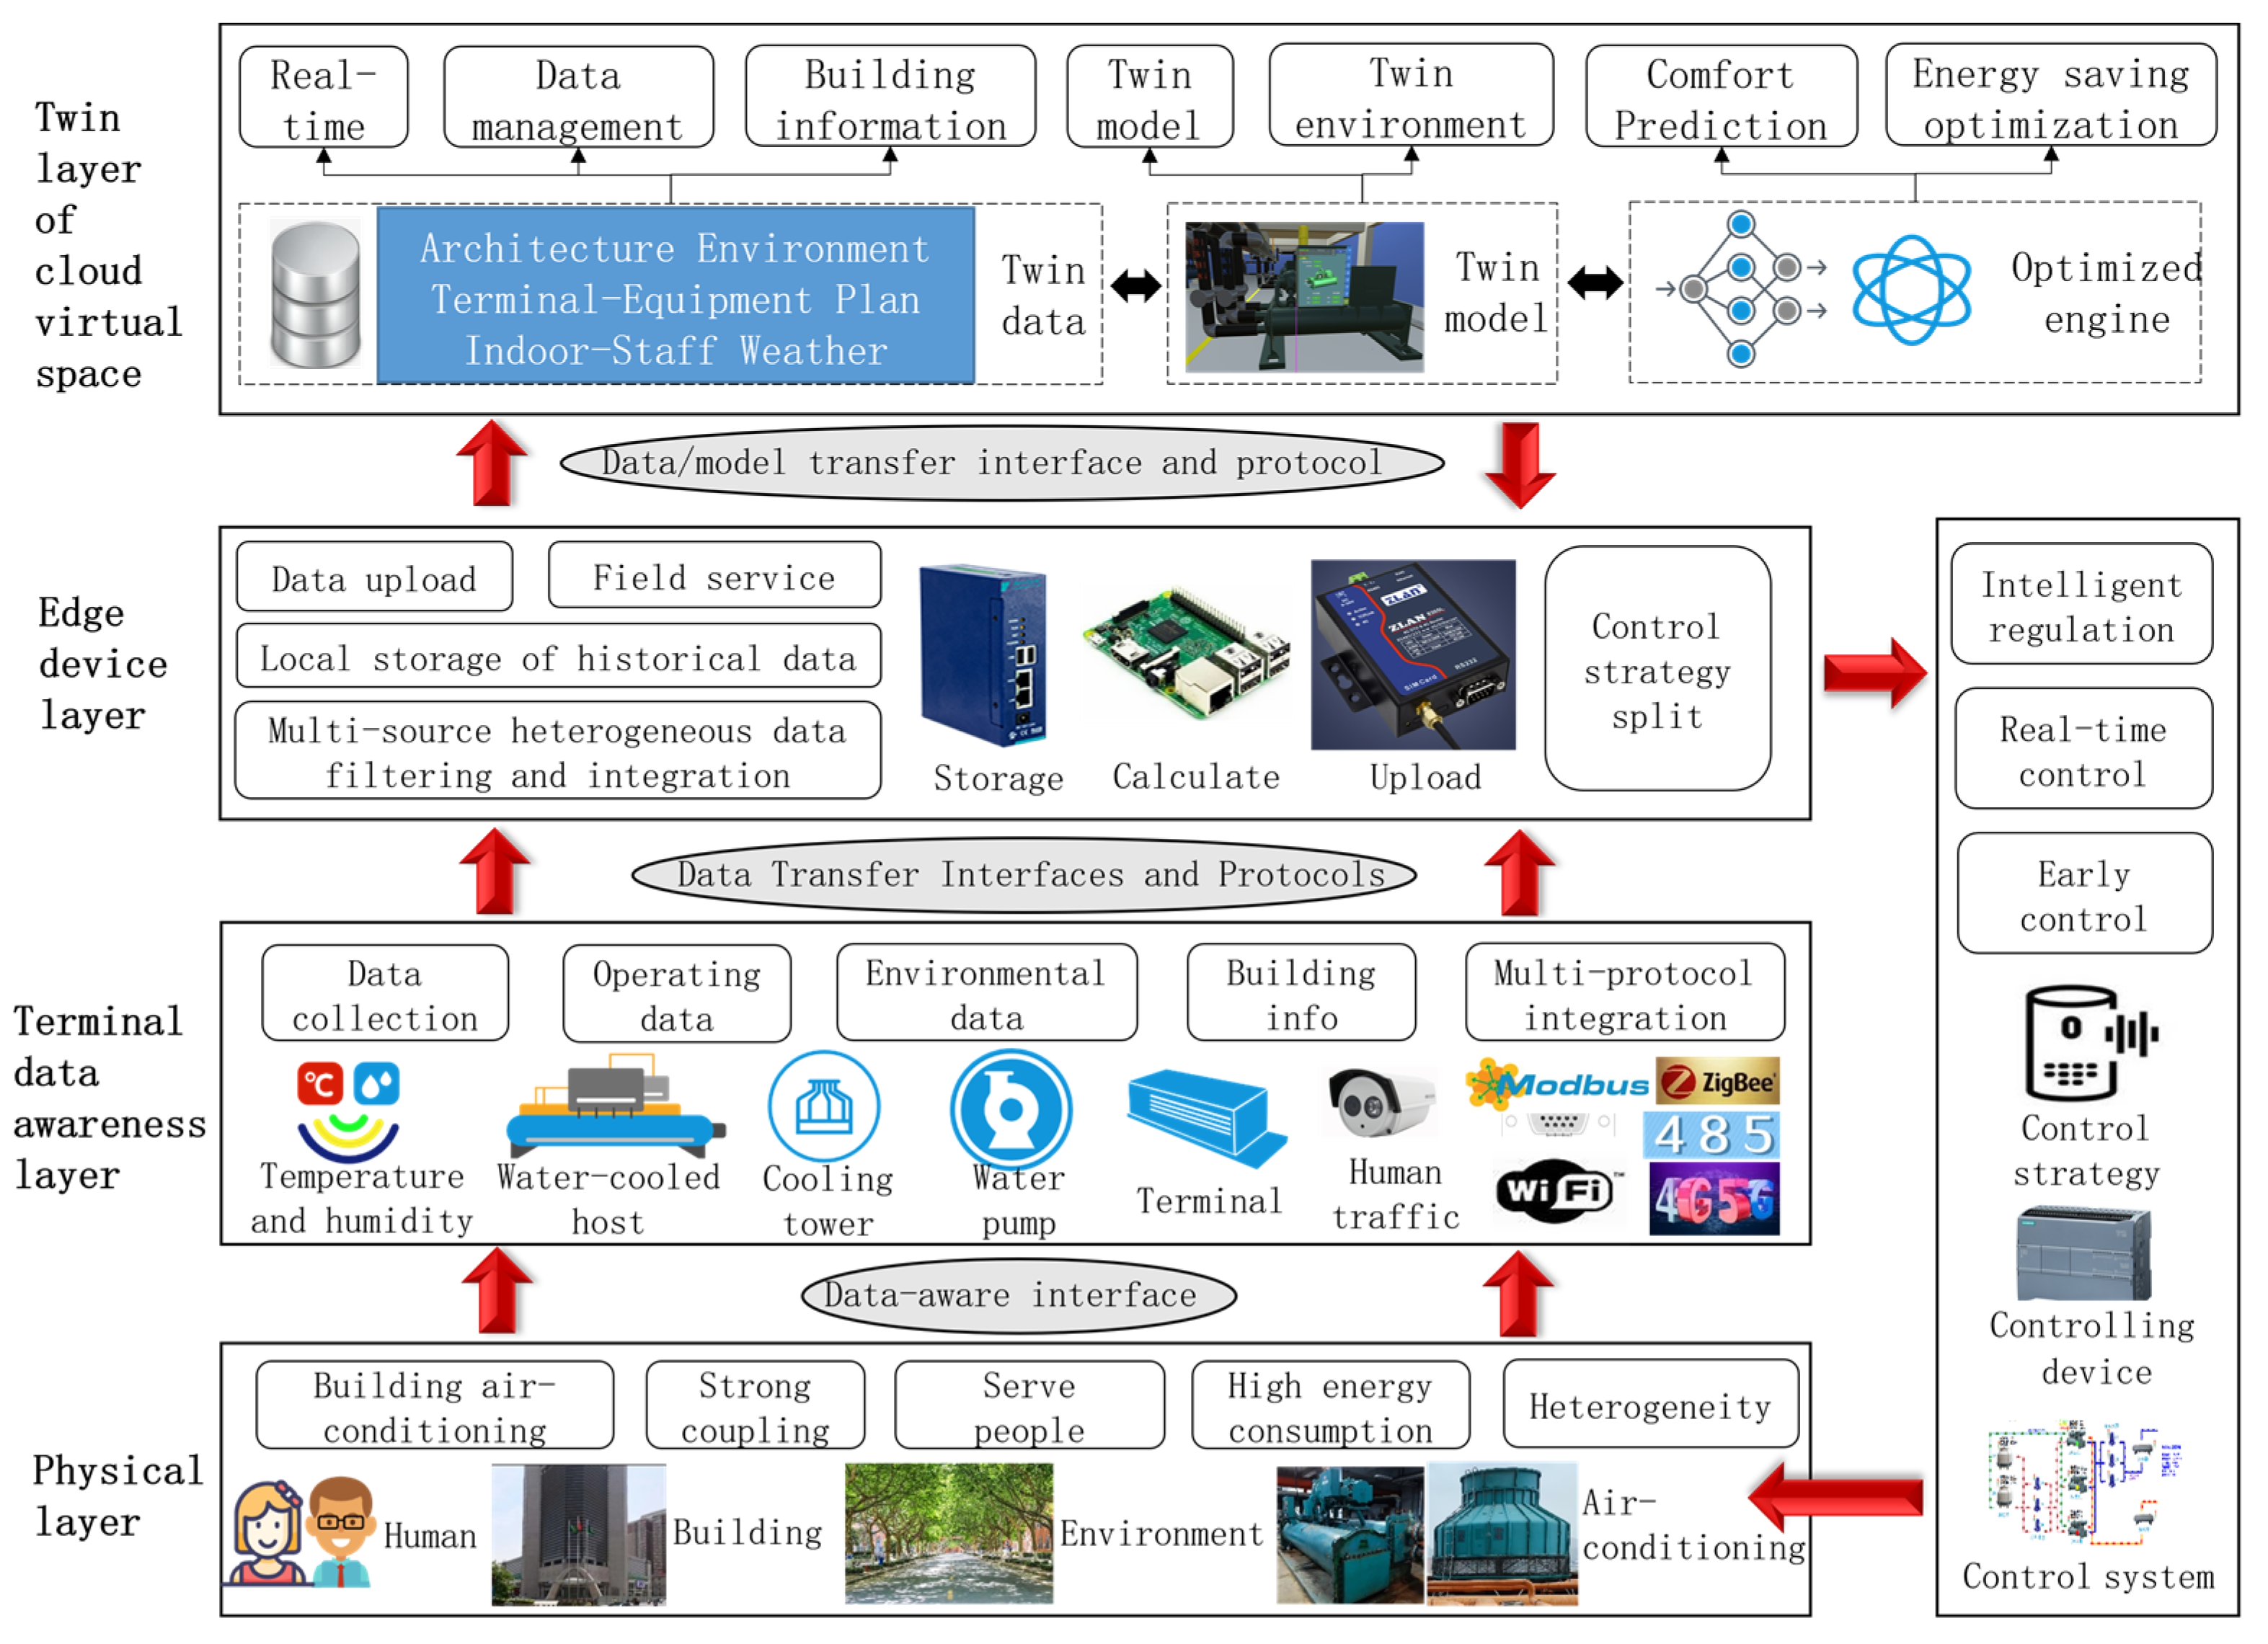
The operation mode based on the cloud–edge–device architecture has a character of low latency, high reliability and security, which is suitable for the energy-saving abilities of the central air conditioning that requires high real-time computing and a short cycle. For example, in the architecture, functions of the network forwarding, storage, computing, and intelligent data analysis are deployed at the edge layer to effectively reduce response delay, cloud pressure, and bandwidth costs. Moreover, the architecture can provide cloud services such as network-wide scheduling and computing power distribution. The proposed energy-saving and control framework is shown in
Figure 1, which includes the physical layer, the terminal data perception layer, the terminal intelligent control layer, the edge device layer, and the twin layer of the virtual cloud space. The framework provides an operation mode based on edge cloud computing, which integrates cloud computing technology and edge computing capabilities. Moreover, the framework represents a flexible cloud computing platform on edge infrastructure to form a cloud–edge–device collaboration.
- (1)
Physical layer
Central air conditioning is a strongly coupled system composed of units, operation environment, buildings, personnel, etc. For example, adjusting cooling water flow or cooling tower power has knock-on effects on the operating power of the chiller. In addition, the indoor and outdoor environments, room orientation, and number of people have an impact on energy-saving regulation strategies. Therefore, the energy-saving optimization analysis should fully consider these influencing factors, including not only the central air conditioning itself but also the construction where the central air conditioning is installed, environmental factors, and the people served by the air conditioning. Among them, the central air conditioning includes intercalated sub-components such as the refrigeration host, cooling tower, cooling water circulation pipeline, cooling water pump, chilled water pump, chilled water circulation pipeline, terminal device, etc. Environment refers to factors that have a significant impact on the temperature and humidity of a building, such as outdoor temperature, relative humidity, and wind speed. The building itself also affects the energy-saving control of the air conditioning through factors such as the height of the floor, the area, and the orientation of the room. Personnel is the service object; therefore, the purpose of the energy-saving regulation is to reduce system energy consumption on the premise of ensuring the thermal comfort of each person.
- (2)
Terminal data awareness layer
The diversity and integrity of terminal data collection are the premises to ensure the accuracy of energy-saving optimization and control strategies. The terminal data perception layer is used to collect the operation data of the central air conditioning, indoor and outdoor environmental data, building information, and people flow data. For these multi-source heterogeneous state data, the terminal data awareness layer designs the corresponding sub-modules of the terminal data perception layer based on multi-protocol fusion technologies such as MODBUS, 485, ZigBee, WIFI, 4G, and 5G. It mainly includes an indoor temperature and humidity collection module, operation data collection module for the air-conditioning host, cooling tower operation data collection module, cooling water pump and freezing water pump operation data collection module, terminal equipment operation data collection module, outdoor environment real-time information collection module and building flow collection module, etc.
- (3)
Terminal intelligent control layer
The terminal intelligent control layer realizes virtual control and energy-saving optimization through the online and real-time regulation of the air-conditioning host, cooling water pump, chilled water pump, cooling tower, and terminal equipment in the physical layer. The control layer is mainly composed of control strategy, control equipment, control method and control system. Among them, the control strategy includes the real-time control strategy and the advance control strategy (see
Section 4.2 for details). The real-time control strategy refers to the control system based on the state data from the perception layer, which calculates whether the current indoor human comfort is within the comfort range. If it exceeds the rated range, the power that needs to be adjusted for each sub-component is calculated, and the power of the central air conditioning is regulated. In contrast, as for the advance control strategy, the control system regulates the terminal fan in the designated room in advance according to the use time and the number of users of the room, including the time for the air conditioning to be turned on in advance, the set temperature and wind speed, etc. In addition, the advance control strategy can avoid energy waste during the non-use period and can ensure the appropriate range of human comfort in the room within the specified time.
- (4)
Edge device layer
The edge device layer is composed of indoor and outdoor edge equipment deployed. It can provide basic services for the terminal, such as querying historical data of local equipment operations and pre-processing data uploaded by the cloud. First of all, the edge device layer filters and integrates data from the air conditioning, environment, building and human body, which are collected by the terminal data perception layer. Then, the processed data is uploaded to the twin database of the cloud server to achieve local storage of historical data. At the same time, the equipment layer receives control strategies sent by the cloud layer, which are then decomposed into adjustment instructions, and finally transmitted into the control system of the terminal intelligent control layer.
- (5)
The twin layer of the cloud virtual space
The twin layer refers to the virtual object corresponding to the entire process of the operation of the air conditioning in the physical layer, including twin data, twin models and optimization engines. Among them, twin data comes from the terminal data awareness layer l, which can ensure the high fidelity of the twin model. Twin models not only include three-dimensional structure models of the central air conditioning, but also include process models, simulation optimization models and mechanism models. These models are consistent with the physical entity in the geometric structure, status, behaviors, and functions—for example, the thermal comfort prediction model and central air-conditioning energy-saving optimization control strategy model. In addition, the twin layer has the role of data center and business center and can perform model correction, model fusion, and environmental configuration.
These layers have interacted through functional interfaces. For example, the versatile and heterogeneous data collected by the terminal data perception layer is transmitted to the edge device. After the data is filtered by the edge device layer, it is uploaded to the cloud server. On the other hand, the data can be preserved in the local area to effectively reduce the pressure on the cloud server, such as the querying function of the historical operation. The cloud server predicts changes in the comfort of indoor humans by calculating the thermal comfort and formulating a control strategy, which will be sent to the edge device layer by the cloud server. The control strategy is then decomposed into the adjustment instruction. The terminal intelligent control layer receives the adjustment instruction issued by the edge device layer to the specified central air-conditioning equipment.
It can be seen that the energy-saving framework has achieved a closed loop of data collection, data processing, data transmission, intelligent energy-saving optimization, and feedback control. In the end, the framework has the potential to guarantee the smallest energy consumption of the building’s central air conditioning in the context of human comfort.
3. Thermal Comfort Prediction Model and Energy-Saving Optimization Control Strategy
Thermal comfort prediction models and reasonable control strategies are fundamental to the energy-saving optimization regulation of central air conditioning. The comfort state index (CSI) is used to quantize thermal comfort, which is described in detail in
Section 4.1. After obtaining the CSI value, the system formulates the corresponding control strategy of energy-saving optimization. Specifically, when the CSI value is less than 0, which means discomfort with cold, heating is required in the indoor environment. When the CSI is 0, the current indoor environment is comfortable. The current state is hot and uncomfortable if the CSI is greater than 0, indicating that the indoor environment has a cooling demand. It is necessary to increase the power of the central air conditioning.
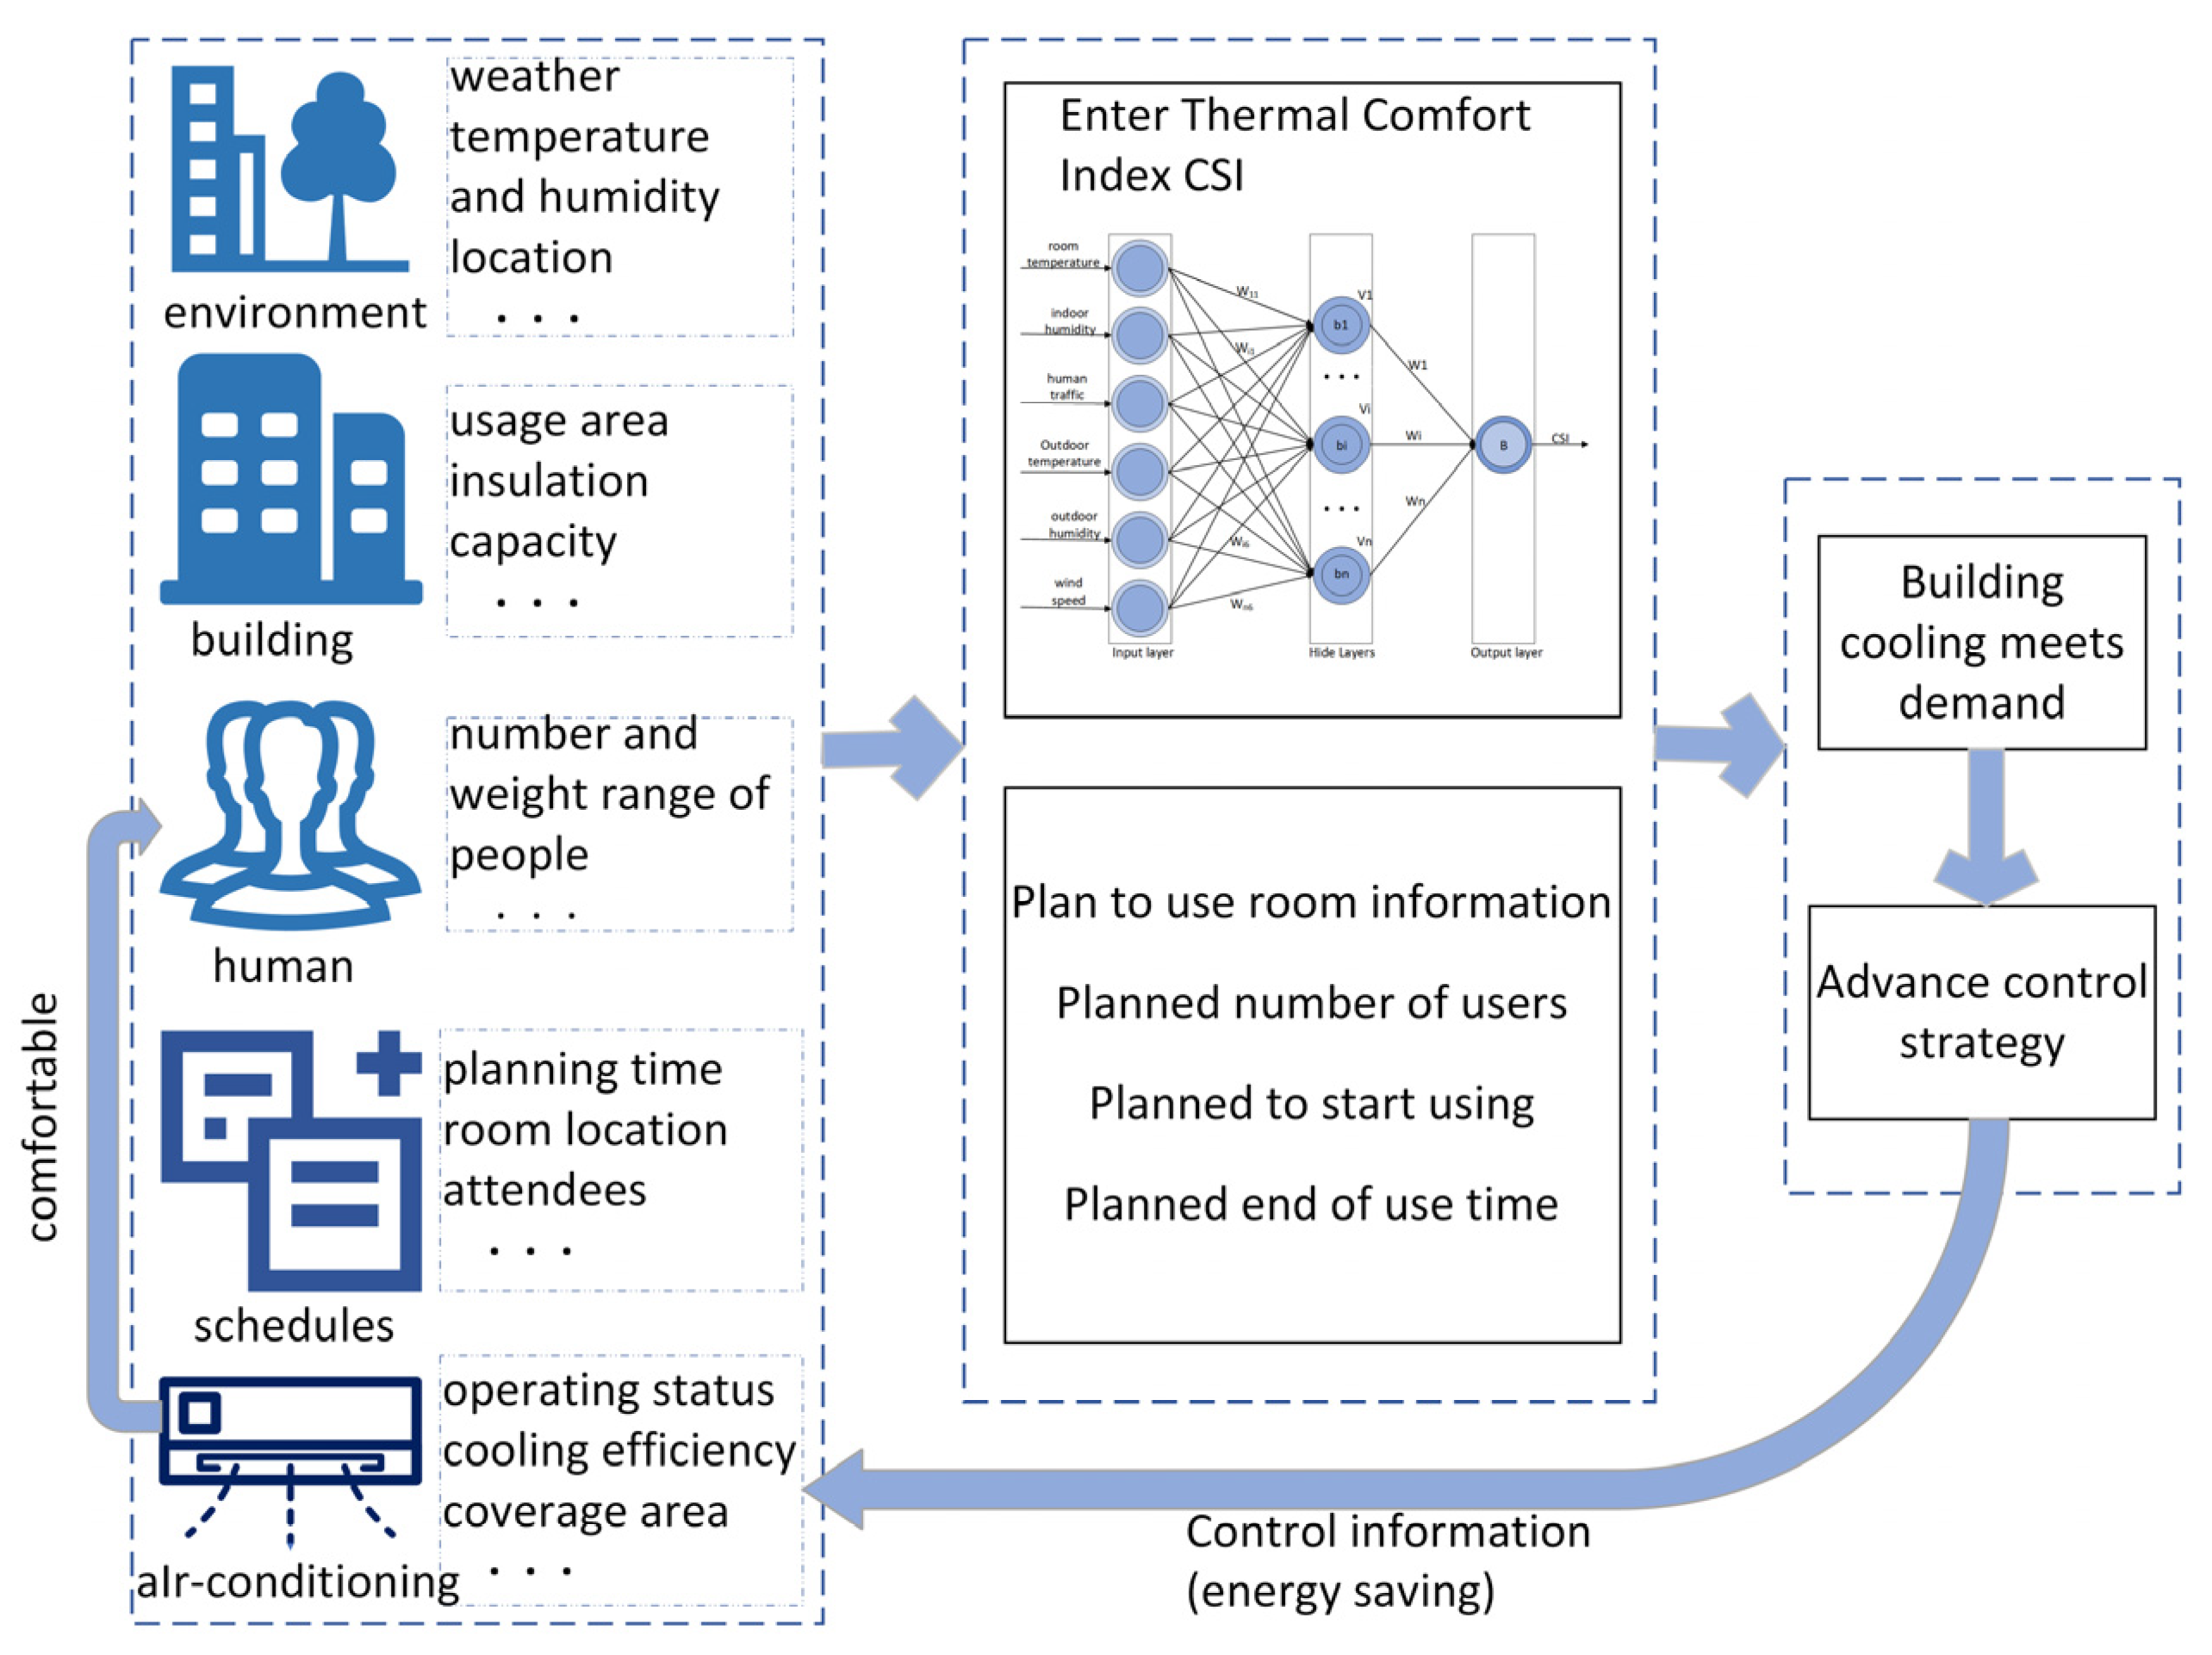
The process of thermal comfort prediction and the energy-saving control strategy are depicted in
Figure 2, including the real-time control strategy and the advance control strategy.
(1) Real-time control strategy. First, the CSI of indoor occupants is calculated through the thermal comfort prediction model based on the collected indoor and outdoor environmental information and personnel information. Then, the energy-saving optimization strategy of the cloud server is used to specify the optimal power adjustment strategy according to the CSI and the real-time operating parameters of the equipment. Then, the adjustment strategy is sent to the terminal intelligent control device through the edge device layer. Finally, corresponding adjustments are executed relying on the received power adjustment instructions.
(2) Advance control strategy. The system first reads the room usage schedule data that the building administrator synchronizes to the twin database. Then, the air conditioning is turned on in advance before the use time specified in the schedule to ensure the comfort of the designated room during the use time period. In the same way, the air conditioning is adjusted and shut down in advance before the end-of-use time to save as much energy as possible.
In the energy-saving framework established in
Section 3, the above steps are periodically executed to keep the energy consumption of the system at the lowest level and maintain the environmental comfort in the room within the expected range.
3.1. Thermal Comfort Prediction Model of the Indoor Environment
The thermal comfort prediction model of the indoor environment is indispensable to the energy-saving strategy, which is reflected by the CSI. The accuracy of the CSI prediction is decided by the predicted mean vote (PMV), representing the hot and cold sensation of most people in the same environment, as shown in Equation (1) [
19].
In Equation (1), M refers to the metabolic rate of the human body, and the unit is W/s. W represents the power of the human body, and the unit is W/s. Pa stands for indoor air water vapor pressure, the unit of which is Pa. Ta represents the indoor air temperature, Tcl represents the average radiation temperature of the clothing surface, and Tr is the average indoor radiation temperature, and their units are °C. fcl stands for the ratio of the covered surface area of the human body to the exposed surface area of the human body. hc describes the convective heat transfer coefficient, and the unit is W/s*m2* °C.
According to the analysis of the influencing factors of indoor comfort, variables that have a strong impact on thermal comfort are the environmental temperature and humidity, and the indoor personnel themselves. However, since the real-time data collected by the terminal data perception layer has a fixed interval time series, the model of prediction must have a strong long-term series ability to predict. This paper adopts the long short-term memory (LSTM) model to realize thermal comfort prediction, because it is able to preserve the memory of previous inputs and is considered effective for time series prediction [
37]. In addition, LSTM is an optimization of recurrent neural network (RNN). A “gate” structure in the LSTM on the basis of RNN is designed to solve the long-term dependency problem, as well as the gradient disappearance or explosion problem in RNN.
Figure 3 exhibits the structure of LSTM.
Ct−1 stands for the state of the neuron at time
t − 1,
Ct refers to the state of the current neuron,
ht−1 represents the output value at time
t − 1,
Xt is the input at time
t, and
ht is the output at time
t. It can be seen from
Figure 3 that there are three control gates in the LSTM neural unit, namely the forgetting gate
ft, the input gate
it and the output gate
Ot. The useless information learned at the previous moment according to
ht−1 and
Xt is removed by the forget gate, so that LSTM can memorize important information for a long time. The calculation of the forget gate
ft is revealed in Equation (2) [
38], where
σ(x) describes the activation function,
ω refers to the weight, and
b represents the bias. The input gate is used to judge the feature of the input information at time
t, which is used to update the neuron state. The output gate is used by the neuron to calculate the output value at the current moment.
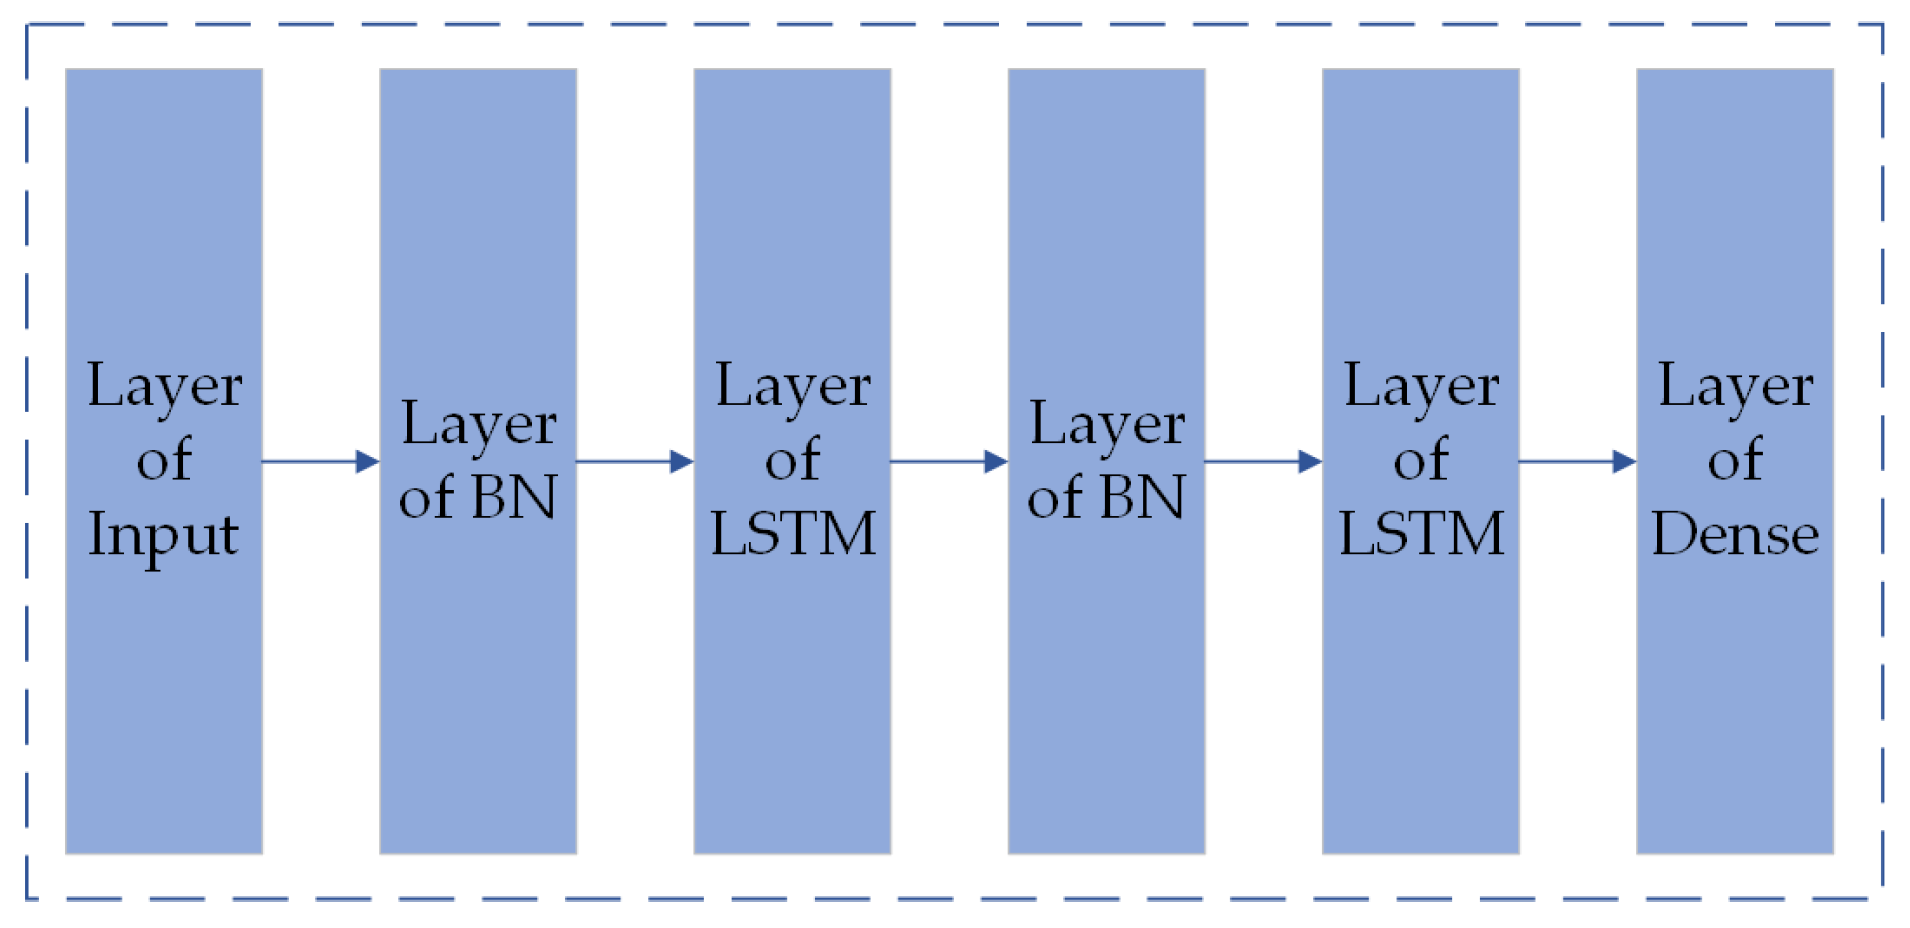
According to the above analysis, the LSTM model can transmit relevant feature information along the long-term sequence for prediction, thereby overcoming the influence of RNN’s short-term memory, and will lead to useful information being ignored. This mechanism is crucial for improving prediction accuracy. As indoor thermal comfort changes with alterations in environment and personnel, this paper uses an LSTM recurrent neural network to build a prediction model for indoor environmental thermal comfort, as illustrated in
Figure 4.
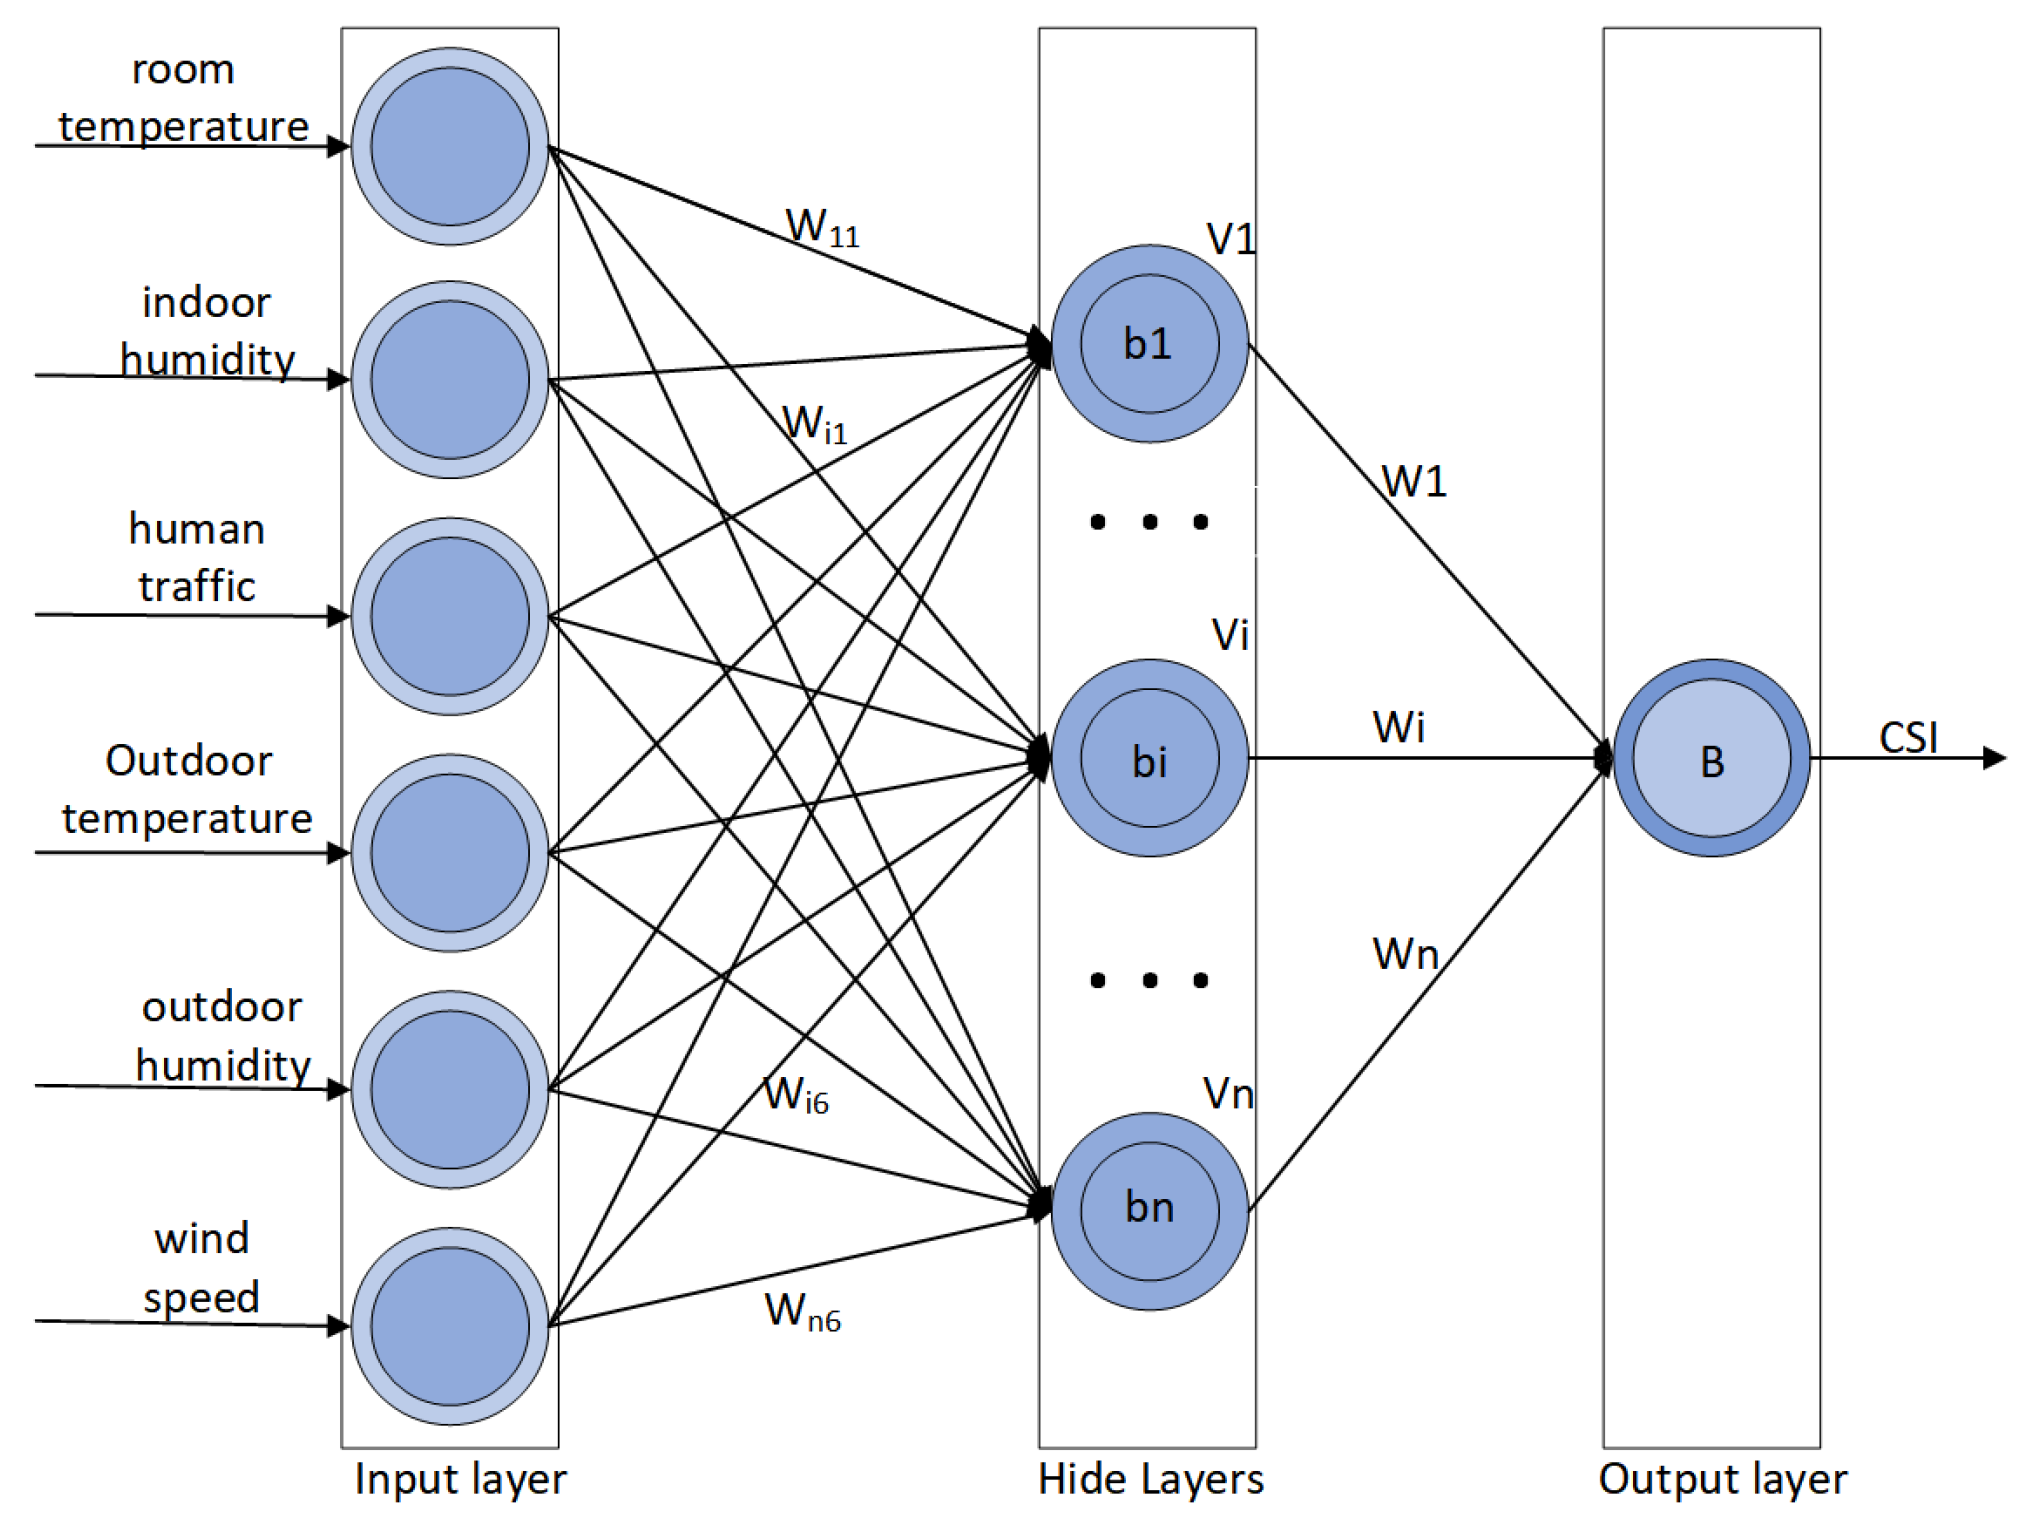
The network architecture of the prediction model in
Figure 4 includes an input layer, some hidden layers, and an output layer. The number of neurons in the input layer and output layer is six and one, respectively. In the input layer, the input parameters of the model are indoor temperature, indoor relative humidity, indoor traffic flow, outdoor temperature, outdoor relative humidity, and wind speed. Among them, the indoor temperature and humidity data is the average temperature and humidity in the room collected by the terminal data perception layer. The indoor flow of people is collected by the people flow collection module deployed in the room. The outdoor real-time environmental information collection module collects outside. The increase in the number of LSTM layers will bring about an exponential increase in time overhead and memory overhead. At the same time, when the number of LSTM layers exceeds three, the gradient disappearance between layers becomes obvious. Therefore, a two-layer LSTM neural network is used in the hidden layer.
The output of the prediction model is the CSI of the indoor environment. When CSI = 0, it indicates a comfortable state. When CSI > 0, it indicates thermal discomfort. When CSI < 0, it indicates cold discomfort. CSI was set at an interval of [−0.5, 0.5] in this study.
3.2. Design of the Energy-Saving Optimization Strategy
According to the calculation results of the thermal comfort in
Section 3.1, this section combines the design data, environmental data, equipment operation data of the building rooms to design an optimized energy-saving strategy. The prediction result in the CSI of thermal comfort will affect the decision of the energy-saving optimization algorithm. The algorithm will actively adjust the system power consumption when the CSI value is too small or less than the set interval.
The coefficient of performance (COP) of the central air-conditioning chiller unit is an index to measure energy consumption [
39]. As shown in Equation (3), it is the ratio of cooling capacity to power consumption.
According to Equation (3), when the workload rate of the main engine is closer to the load rate of the optimal working condition point, the COP value of the main engine is also greater. The energy consumption of the cooling host accounts for the largest proportion of the total energy consumption; thus, improving the COP of the cooling host is crucial to reduce the overall energy consumption of the central air conditioning. In addition, when the number of cooling hosts is fixed, the greater the cooling load demand in the building, the higher the overall energy consumption efficiency. Therefore, if the required cooling capacity of the building is fixed, the number of refrigeration units turned on essentially determines the efficiency performance of the overall energy consumption. In addition, chillers account for about 40% of energy consumption in the central air conditioning, and cooling towers account for more than 27% [
40]. Therefore, reasonable adjustment of the cooling tower power and the start–stop system and power of the refrigeration host can effectively reduce the overall energy consumption of the building.
From the above analysis, under the premise of ensuring the stability of the indoor thermal comfort index, this paper adopts the real-time optimization control strategy and the advance optimization control strategy for the central air conditioning, as follows.
- (1)
Real-time control strategy 1: Under the condition of a certain required cooling capacity, the number of central air-conditioning hosts are specified to drive the operating load rate of the central air-conditioning hosts close to the optimal operating point.
- (2)
Real-time control strategy 2: Under the condition of a stable operating load of the central air-conditioning host, the power of the cooling tower is adjusted to drive the central air conditioning to run stably and simultaneously reduce the overall energy consumption to a minimum.
The optimization control strategy in advance can calculate the turn-on time of the air conditioning in the corresponding room according to the room usage schedule in the twin database, such as setting the air volume, wind speed and other parameters in advance, as shown in
Figure 5.
- (1)
Advance control strategy 1: The air conditioning is turned on before the room is used to ensure the comfort of the room in advance, such as the reserved use of the meeting room.
- (2)
Advance control strategy 2: Before the end of room use (e.g., when you are about to leave work), the air conditioning is turned off or the air-conditioning load is adjusted in advance.
According to the above analysis, this paper establishes the optimization design model of the energy-saving optimization strategy. The design variables and the objective function are expressed by Equations (4) and (5), respectively. The constraints are represented by Equations (6)–(8).
In the energy-saving optimization strategy, the input includes building design data, geographical location data, equipment operation data, predicted indoor thermal comfort index, etc. Therefore, in Equation (4),
x1,
x2,
x3,
x4,
x5, and
x6 are, respectively, expressed as parameters such as predicted thermal comfort index, terminal equipment power, cooling tower power, main engine power, chilled water pump power, and cooling water pump power, as described in
Table 1.
The optimization goal of the energy-saving strategy is to minimize the overall energy consumption Ptotal of the central air conditioning. Under the condition of satisfying the cooling capacity of the required temperature, if the energy efficiency ratio of the refrigeration system is the largest, the total energy consumption Ptotal of the central air conditioning needs to be minimized. Ptotal is represented by Equation (5). Among them, Ph is the energy consumption of the central air conditioning, Ppco is the energy consumption of the cooling water pump, Ppci refers to the energy consumption of the chilled water pump, Pt stands for the energy consumption of the cooling tower, and Pend describes the energy consumption of the terminal equipment.
To ensure the consistency between the simulation platform and the actual status of the central air conditioning of the building and in order to improve the accuracy and reliability of the simulation, operating constraints are imposed on the cooling water pump and chilled water pump, and on the cooling tower.
(1) Operation constraints of cooling water pump and chilled water pump. The operating frequency of the water pump at full load is 50 HZ. When the operating frequency is lower than 60%, there will be a large waste of energy consumption. Therefore, there is a constraint for the cooling water pump and the chilled water pump, provided by Equations (6) and (7).
(2) Operation constraints of the cooling tower. It is the frequency of the fan that affects the cooling effect in the cooling tower; therefore, there is a constraint of Equation (8) on the cooling tower.
4. Experimental Results and Discussion
To verify the effectiveness and feasibility of the proposed method, this section conducts experiments on the designed prediction model of indoor environment thermal comfort and optimized energy-saving control strategy.
For the prediction model, the experimental environment and configuration are as follows. Subjects of the experiment are the central air conditioning of the Zhengzhou Post Building in Henan, as well as the offices and conference rooms of the building. The acquisition hardware includes sensors for indoor and outdoor temperature and humidity. The data collection time is from mid-June to the end of September 2022. The human body activity rate is set to 1.0 met-1.2 met. Clothing thermal resistance is set as 0.6 clo. In addition, the data, after being preprocessed, are divided into the training set, test set, and verification set according to 7:2:1, which the LSTM model verifies.
To optimize the energy-saving control strategy, this paper simulates the building’s indoor thermal environment and energy consumption through the Transient System Simulation Program (Trnsys). For example, we use Trnsys to set meteorological data and solar radiation. The energy-saving effect of the advance control strategy and the real-time control strategy are simulated by the thermal comfort value predicted using the prediction model in Trnsys.
4.1. Model Training and Result Analysis
According to the neural network model shown in
Figure 3, six input nodes are set in the experiment, two LSTM (long short-term memory) hidden layers are used for the middle layer, and an output layer is selected.
Linear rectification function (ReLU) is used as the activation function expressed by Equation (9) [
41]. The use of ReLu makes the output of some neurons in the neural network 0, which can alleviate the over-fitting problem.
The result of the designed thermal comfort model is displayed in
Figure 6. The logical process of the entire prediction of the model is as follows: the output value of each neuron is propagated forward, and the error (loss value) between the neuron and the actual value is propagated back. Meanwhile, the Adam optimizer is used to quickly repair the error during the training process. Therefore, the predicted result is close to the actual result.
The configuration parameter values of the model are shown in
Table 2. During the training process, the mean square error (MSE) is used as the loss calculation function. The middle two hidden layers have 32 neurons and 128 neurons, respectively. In order to prevent the phenomenon of over-fitting, a batch normalization (BN) layer is added between the input layer, each LSTM layer, and the output layer. Moreover, dropout is used between each layer of LSTM. In addition, the model optimizer is configured as Adam. To significantly speed up the training, the sliding time step is set to 10, and the training batch size is set to 128.
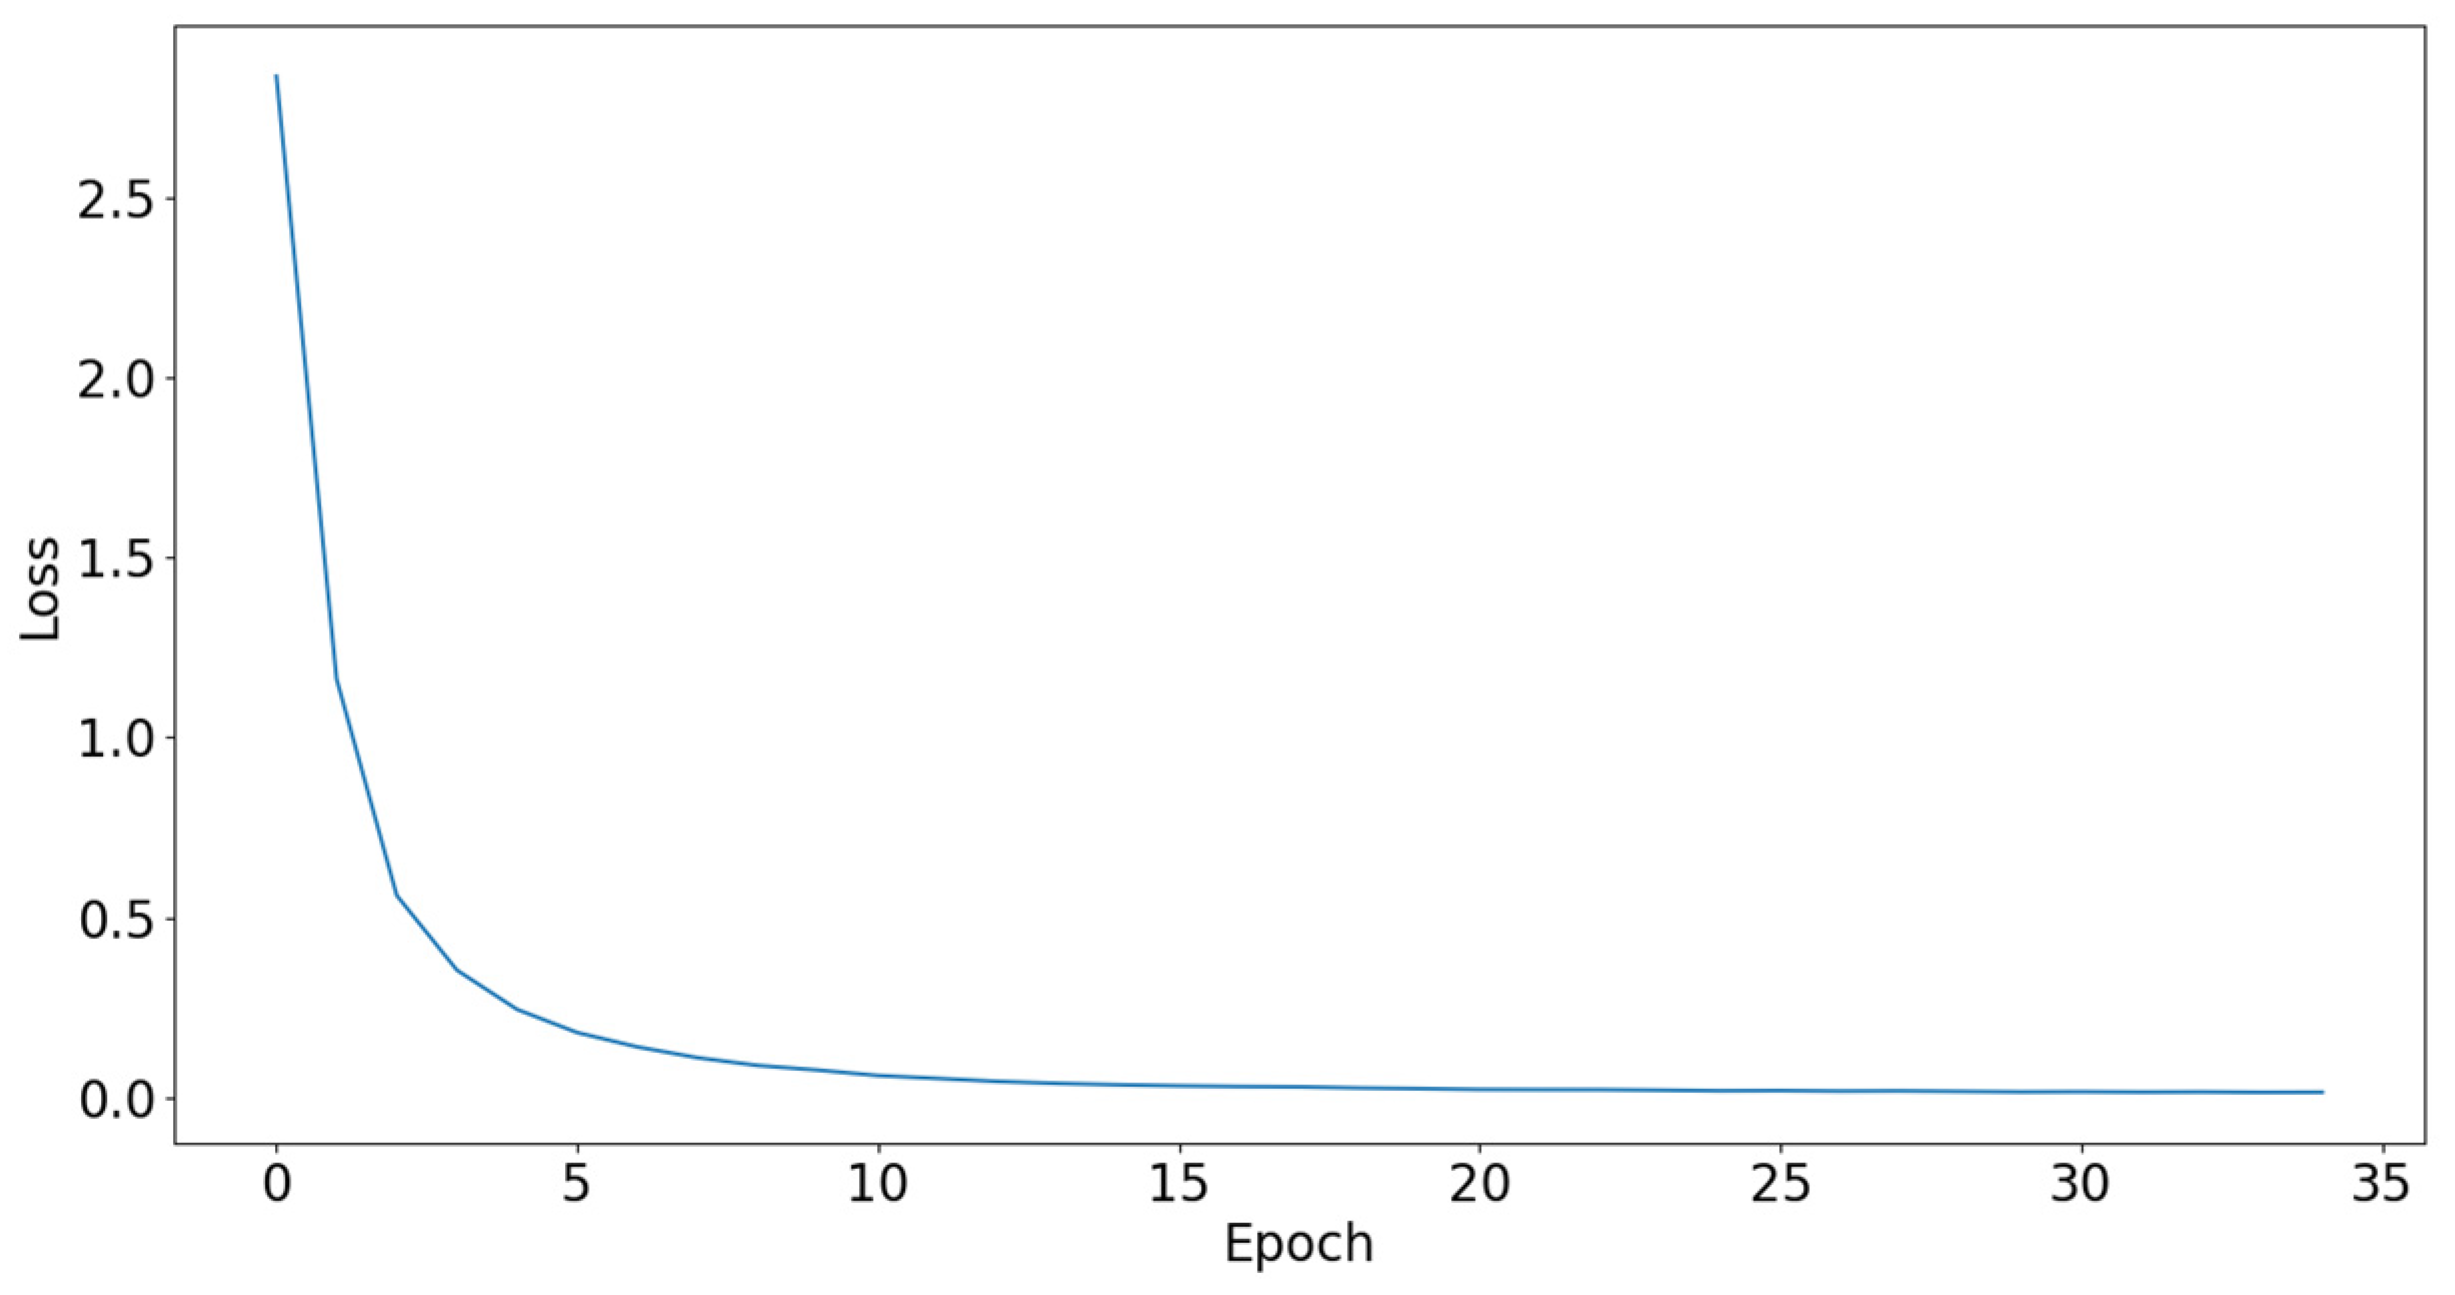
The convergence curve of model training is given in
Figure 7. It can be seen that the loss value is close to 0, indicating that the model has a positive convergence effect. After 13 rounds, the loss curve and the training loss curve tend to coincide. After 20 rounds, they tend to be stable.
After the model training is completed, the model’s performance needs to be measured using various evaluation indicators shown in
Table 3. MSE is the mean square error, RMSE stands for root mean square error, and MAE represents the mean absolute error.
From the analysis in
Figure 7 and
Table 3, it can be concluded that the error range of the indoor environmental thermal comfort model based on the LSTM neural network is very small, which proves that the prediction effect is remarkable.
4.2. Energy-Saving Strategy Simulation and Result Analysis
The energy consumption of air conditioning in office buildings is mainly determined by the cooling load. The demand for cooling load in the building depends on changes in the environment and working hours. This section analyzes the energy-saving strategy of the building’s air conditioning, simulates the summer working conditions with the highest energy consumption of the building’s central air conditioning, and tests the energy-saving effect of the proposed strategy introduced in
Section 4.2.
The operation simulation of the central air conditioning of an office building is established in Transient System Simulation Program (TRNSYS), as shown in
Figure 8. In the simulation platform, the usable building volume is set as 1500 m
2. The floor area of the building is 300 square meters, with a total of 10 rooms and two floors of cement brick wall structure. The central air conditioning includes three refrigeration hosts, three cooling towers, three cooling water pumps, three chilled water pumps, and one terminal water temperature control device. The capacity of a single refrigeration host is 2050 kW.
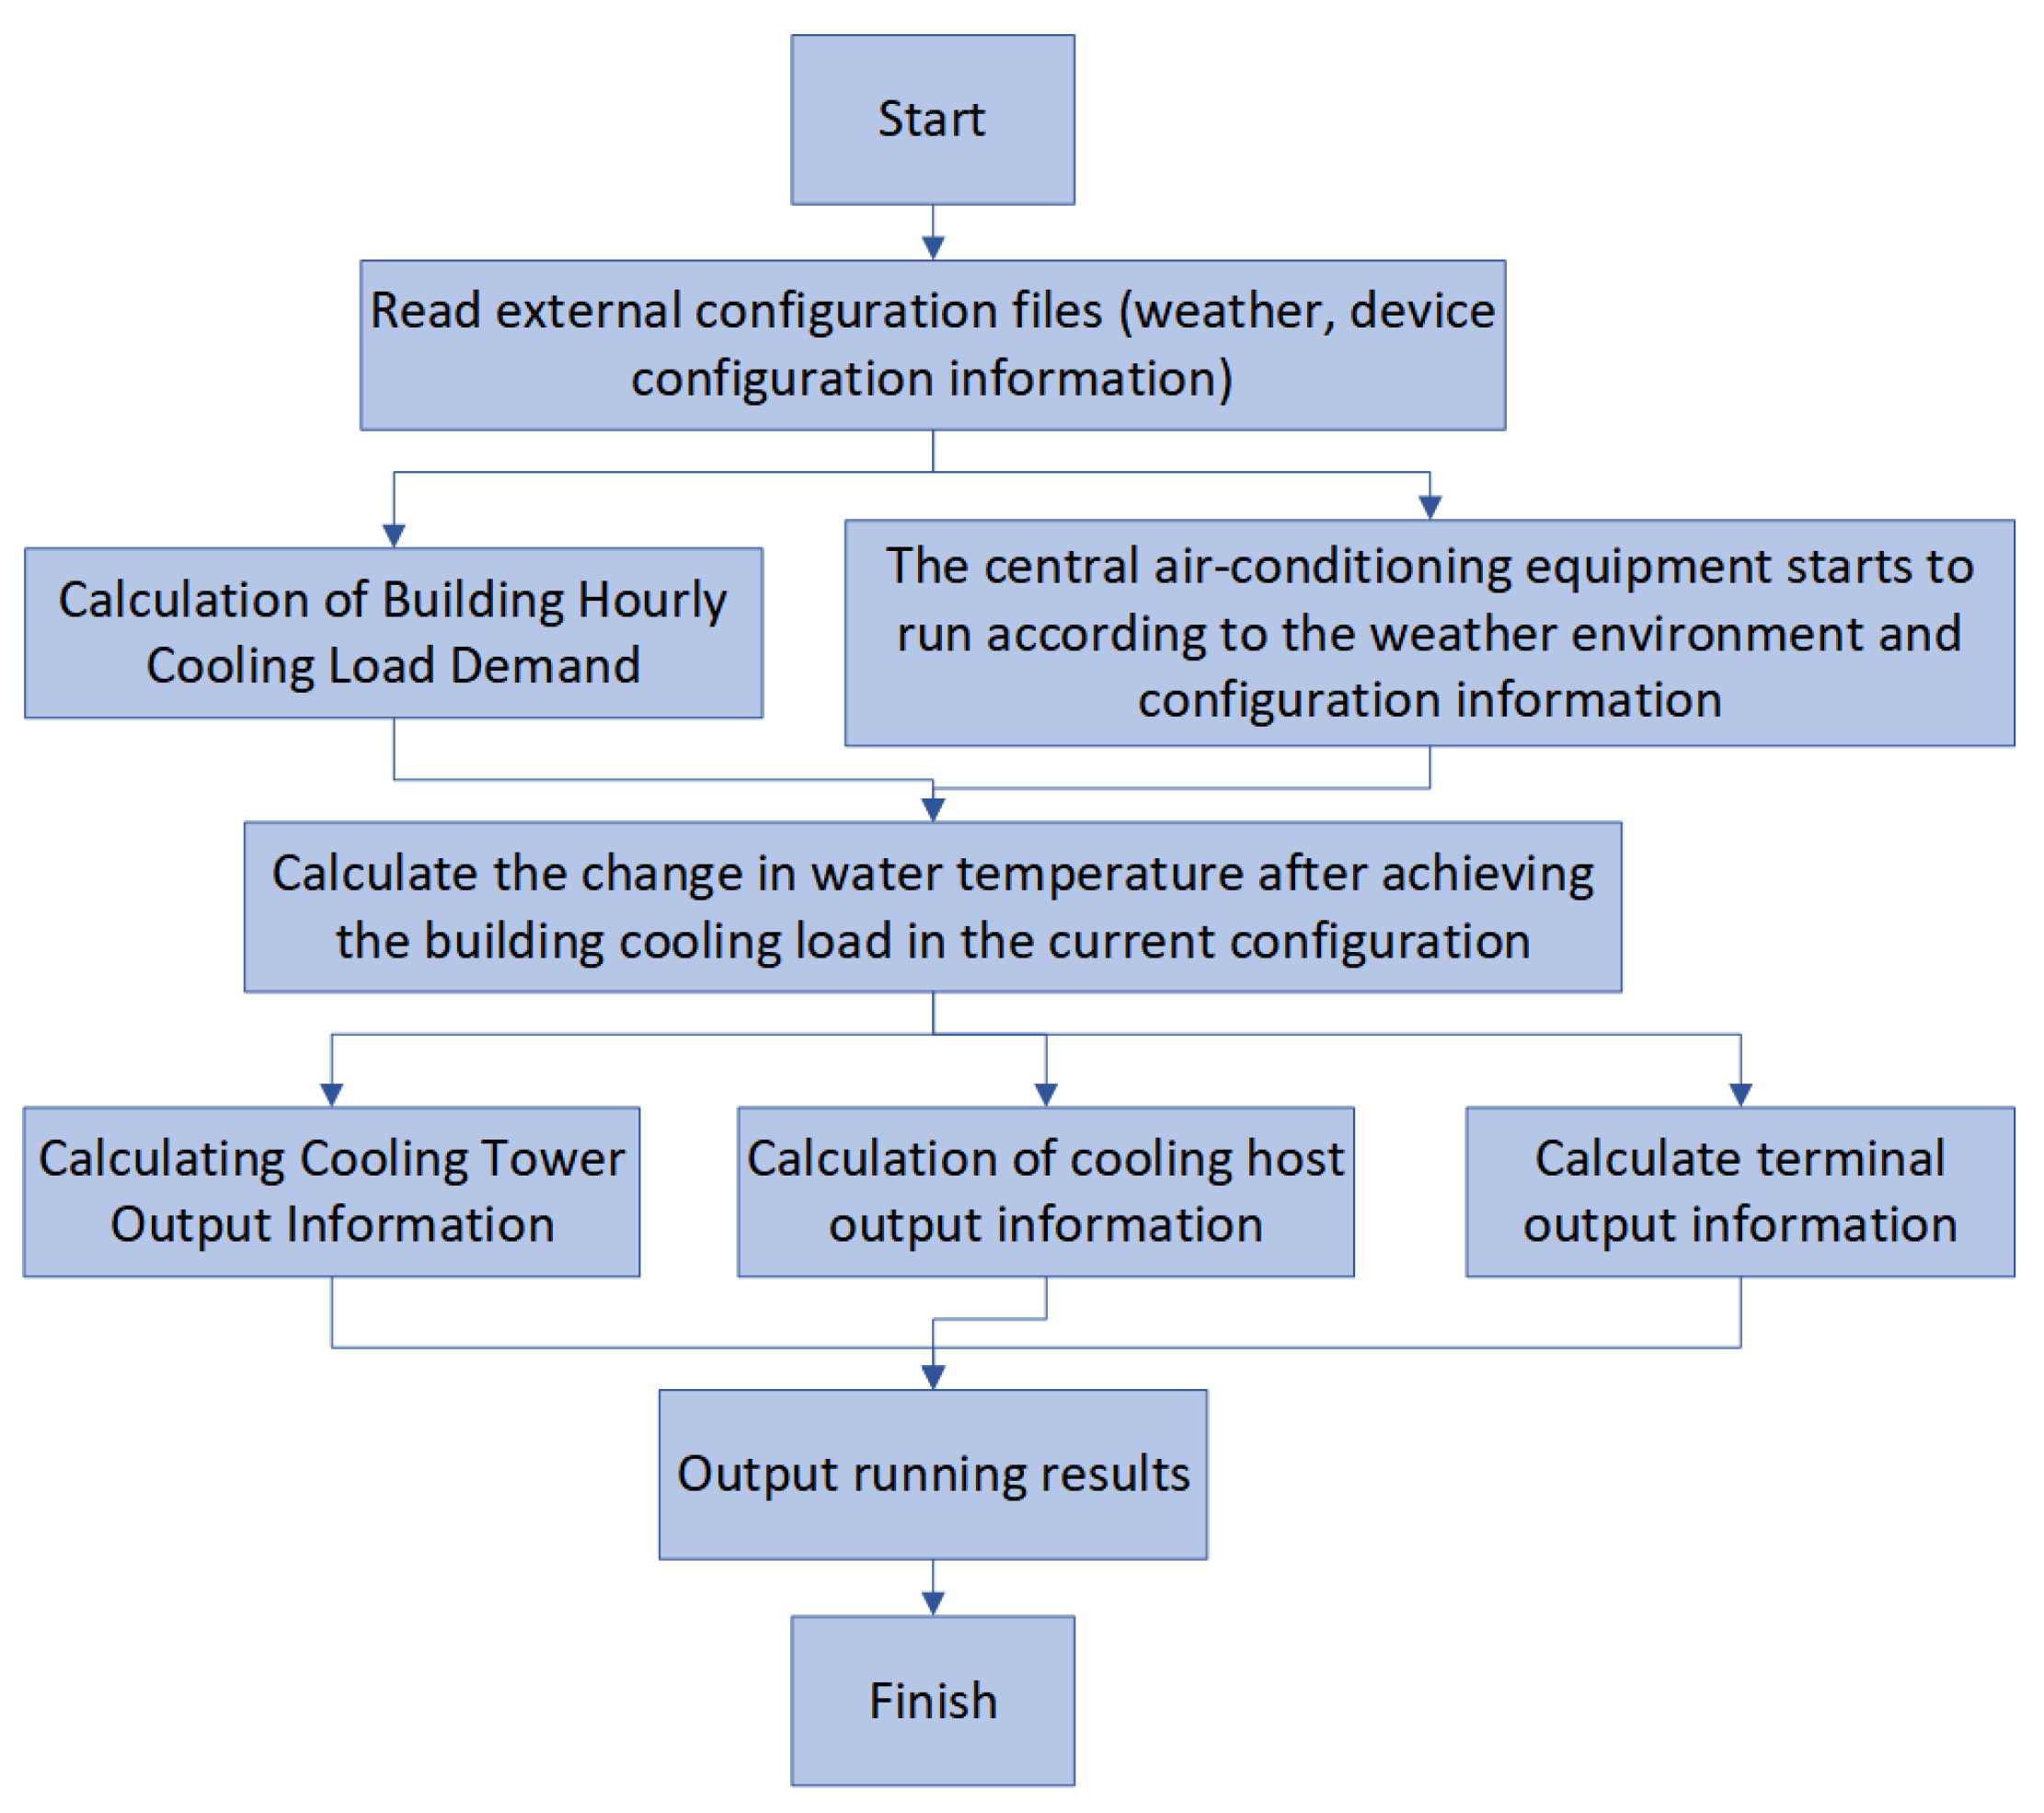
The simulation process is shown in
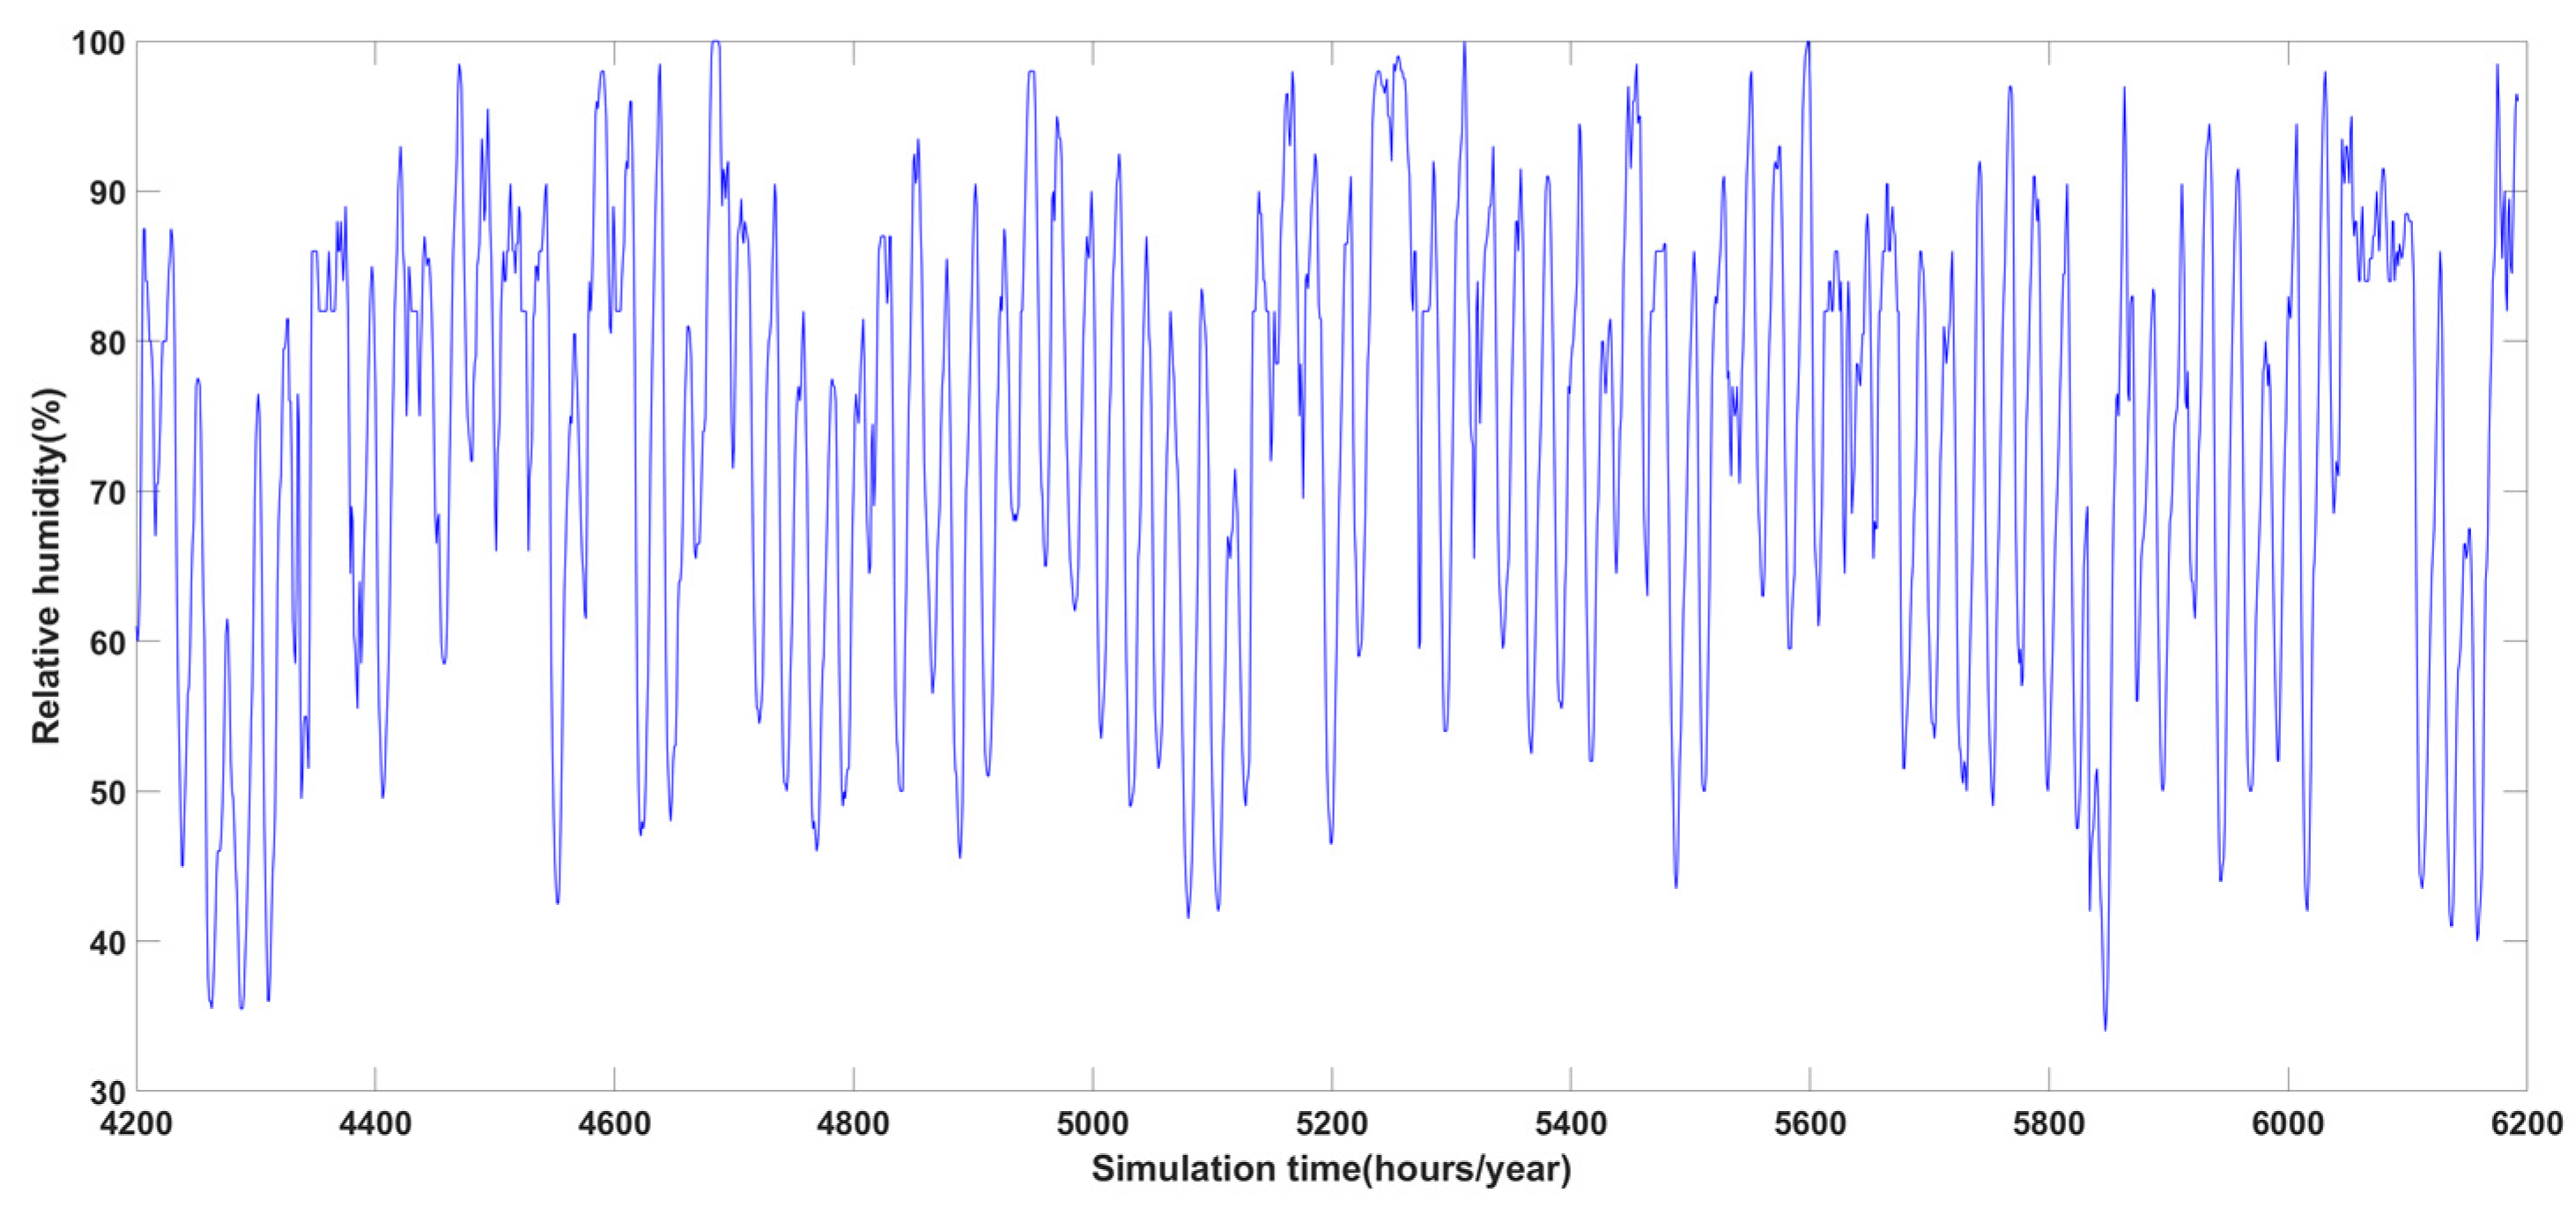
Figure 9. According to the latitude and longitude of the building site, the weather condition is exported by Meteonorm, a meteorological data viewing software. First, the external configuration file is read to obtain the ambient temperature and humidity from the end of June to mid-September 2022, as shown in
Figure 10 and
Figure 11.
Then, the cooling load demand of the building is calculated. During the simulation process, the building use time is set as 9:00–17:00 from Monday to Friday during working hours and rest on weekends. The indoor temperature of the building is set at 26 °C during working hours and a maximum of 30 °C at other times. The cooling load demand of the building is shown in
Figure 12.
After the weather, equipment information, building cooling load demand and other conditions are determined, the real-time control strategy and the advance control strategy are simulated. The differences in energy consumption before and after using the optimized energy-saving strategy are verified.
4.2.1. Real-Time Control Strategy Simulation
The real-time control strategy mainly controls two pieces of equipment that consume a large proportion of the energy of the central air conditioning: the refrigeration host and the cooling tower. The summer weather in Zhengzhou, where the building is located, is relatively hot, but there are almost no extreme weather conditions. As a result, the building load rarely reaches the peak, and the central air conditioning usually operates under partial load. Therefore, the energy reduction in the refrigeration host means the energy reduction in the overall central air conditioning of the building.
In general, the number of refrigeration hosts in central air conditioning depends on the experience of the on-site operator. For this reason, by default, in the case of normal work in summer, two hosts are usually turned on. Comparatively, a host is turned on when the building cooling load is light. In the case of high temperature, three hosts will be turned on at the same time. Since the number of chillers to be turned on depends on the experience of the on-site operators, it has a hysteresis to the change of the cooling load of the building, and the COP value of the chiller will change with the load rate. By calculating the interval between the building cooling load and the host COP value load rate, the energy consumption performance of the cooling host can be effectively improved and the number of enabled hosts can be specified. For this reason, the power consumption of different numbers of units turned on and the influence of adjusting the power consumption of the cooling tower on the overall energy consumption of the central air conditioning is tested separately below.
- (1)
The power consumption test of different numbers of available hosts
According to the building cooling load demand shown in
Figure 12, the building’s maximum cooling load per hour is about 54,500 kj/hr, and the top daily load date is 29 August. The building cooling load on 23 August was relatively moderate. In this simulation, on 29 August and 23 August 2022, during the 8-h working time, different energy consumption values of the central air conditioning are calculated when one, two, or three refrigeration hosts are turned on respectively. The calculation results are shown in
Table 4.
In the case of a high demand for building cooling load, the energy consumption of turning on two cooling hosts is 1% more than that of three cooling hosts. In contrast, running three engines at the same time consumes about 10 times as much energy as running only one cooling engine. When the cooling load demand of the building is appropriate, it turning on two cooling hosts is the most energy-efficient option. In contrast, turning on three hosts consumes 48.1% more energy than turning on two hosts, and turning on one host consumes 517.1% more energy than that of two hosts. Through the above analysis, when the building cooling load reaches a certain level, increasing the number of turned-on cooling hosts can effectively reduce the energy consumption.
- (2)
The effect test of adjusting the cooling tower power
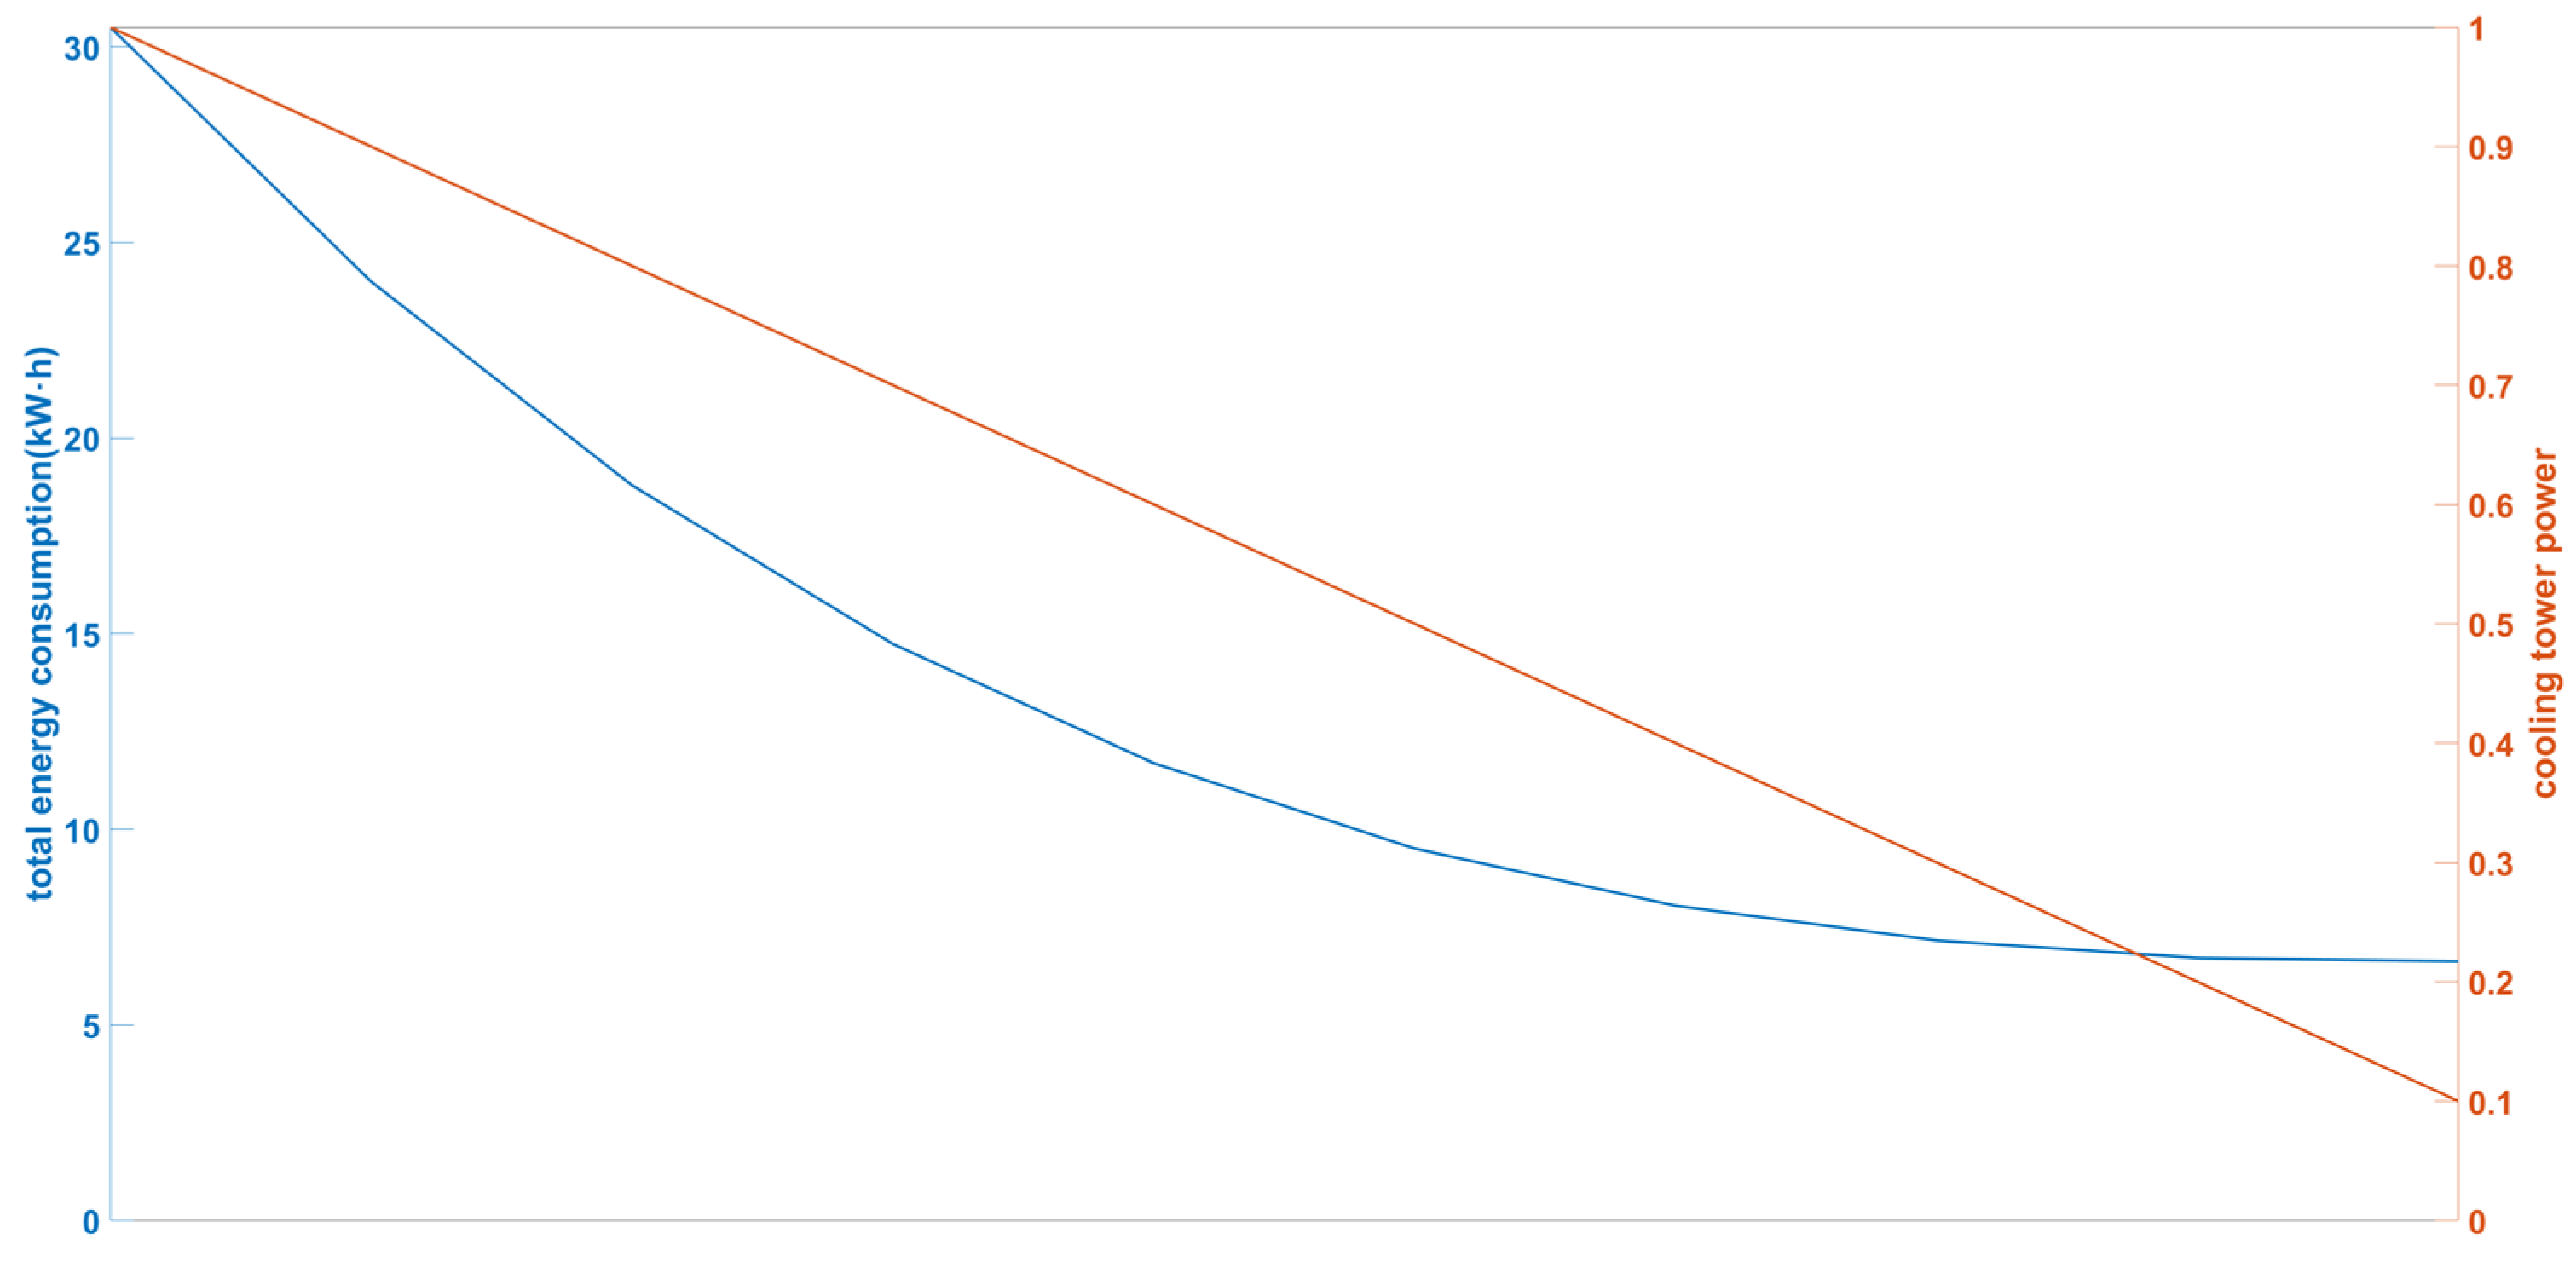
It is known that the air-conditioning administrator controls the cooling tower by switching the power supply. The energy consumption of the cooling tower also accounts for a relatively high proportion of the energy consumption of the central air conditioning when the refrigeration host is running stably. While keeping the indoor temperature within the set range, the total energy consumption is calculated by adjusting the power of the cooling tower. As displayed in
Figure 13, the relationship between the power ratio of the cooling tower and the total energy consumption of the central air conditioning is obtained.
The two experiments abovementioned can verify the energy-saving performance of the real-time control strategy. When the demand for building cooling increases, increasing the number of cooling hosts can reduce the energy waste by at least 1%. When the central air-conditioning refrigeration host is stable, the power reduction in the cooling tower can also save up to about 60% of the energy consumption.
4.2.2. Advance Control Strategy Simulation
There are two meeting rooms available by appointment in the Zhengzhou Post Building. Among them, meeting room A is 6 m long, 4.5 m wide and 3.3 m high. Conference room B is 5 m long, 4 m wide and 3.3 m high. In addition, the reserved usage time of the conference room is stored in the schedule table in the cloud database.
Assume that meeting room A is used 3 times a week, and the duration of each use is 3 h. Meeting room B is used 5 times a week, 2 h each time on average. During the experiment, to ensure that the indoor comfort index during the use period is within the comfort range, the air conditioning is set to be turned on one hour in advance, and the power load is gradually increased. At the same time, the indoor cooling load is gradually reduced one hour before the end of use of the room.
The schedule is loaded into the operation simulation platform TRNSYS, and 3 weeks are stochastically selected to test.
Table 5 represents the test result of the energy-saving effect. It can be seen that the early control strategy has a significant effect on energy-saving, which can save an average of 4% of energy consumption under preset conditions.
We performed a lot of optimizations to the model. It can be seen from the model training in
Section 4.1 that the convergence curve of model training is smooth, and the loss value approaches 0. It can be seen from the training results that MSE is 0.0093, RMSE is 0.0963 and MAE is 0.0777, which proves that the prediction error of the indoor environmental thermal comfort prediction model is small.
In
Section 4.2, we conducted detailed simulation experiments on energy-saving strategies. In the simulation experiment of real-time control strategy, the difference in the number of open refrigeration hosts has a tremendous influence on the energy consumption of the central air-conditioning system. When the cooling load demand is at the highest level in the experimental period, starting one and two hosts will increase energy consumption by 1% and 1071.5% compared with starting three hosts, that is, the maximum energy consumption can be saved by 91% when three hosts are started under a high load. When the cooling load demand is at the medium level in the experimental period, starting one and three hosts will increase the energy consumption by 48.1% and 517.1% compared with starting two hosts. Starting two hosts at medium load can save 84% of energy consumption. When the central air conditioning system runs stably, the real-time control strategy can save about 60% of energy consumption by adjusting the cooling tower power. In the simulation experiment of the advance control strategy, using the advance control strategy can save 4% energy consumption on average.
5. Conclusions
This paper proposes an energy-saving framework for central air conditioning based on deploying cloud–edge–device architecture. This framework can realize a low-delay, high-reliability, low-cost, and reusable energy-saving regulation of central air conditioning terminal equipment. Moreover, it can effectively reduce overall energy consumption. On this basis, a human comfort prediction model based on an LSTM cyclic neural network is established. This research provided an energy-saving control strategy combining man–machine–environment factors to ensure the thermal comfort of indoor personnel.
The cloud–edge–device architecture is used to ease the decision-making pressure of single cloud computing, which can reduce the delay of data transmission, and improve the operation stability and system security of the framework. According to the indoor and outdoor environmental parameters and indoor occupants, a prediction model of indoor environmental thermal comfort is designed. The proposed thermal comfort prediction model based on LSTM is verified. According to the operating status of the central air conditioning, the indoor comfort state index and the building’s internal cooling load demand, an energy-saving control scheme to ensure indoor comfort is designed. The real-time control strategies and advance control strategies are tested on an office building in Zhengzhou through the TRNSYS simulation test, which have a significant energy-saving effect.
In the experimental results in
Section 4, the prediction accuracy of the human thermal comfort model based on LSTM is higher, with MSE of 0.0093, RMSE of 0.0963 and MAE of 0.0777. Through the simulation experiment of the energy-saving strategy, the advantages of real-time control strategy and advance control strategy for energy-saving are proved. Among them, real-time control strategy can save from 84% to 91% of energy consumption, depending on the environment. The advance control strategy saves an average of 4%.
However, it should be noted that this study mainly considered the adult group in the office building environment. In addition, because the hosts of the cooling and heating systems in the building are different, only the energy-saving optimization of the cooling environment is studied. Further research is required for different age groups and that which covers energy-saving studies for heating systems. The following research should use actual field experiments to verify the effect.
