Article

Does Government Purchasing Science and Technology Public Service Promote Regional S&T Innovation Ability? Evidence from China

1
Jingjiang College, Jiangsu University, Zhenjiang 212013, China
2
School of Management, Jiangsu University, Zhenjiang 212013, China
3
Department of Mechanical and Manufacturing Engineering, University of Calgary, Calgary, AB T2N 1N4, Canada
*
Author to whom correspondence should be addressed.
Sustainability 2023, 15(3), 2354; https://doi.org/10.3390/su15032354
Submission received: 21 December 2022 / Revised: 24 January 2023 / Accepted: 25 January 2023 / Published: 28 January 2023

Abstract

:
During the development of scientific and technological innovation, the importance of Government Purchasing Public Services (GPPS) in the field of science and technology (S&T) has become increasingly prominent. To investigate the relationship between Government Purchasing Science and Technology Public Services (GPSTPS) and regional S&T innovation ability, this paper first constructs a PMC index model to estimate GPSTPS objectively. Then, the spatial econometric model is adopted to explore the impact of GPSTPS policy on the regional S&T innovation ability based on the provincial panel data from 2008 to 2017 in China. Results show that: (1) Regional S&T innovation ability has a significant spatial positive correlation in geographical space from 2008 to 2017. (2) From the overall perspective, the GPSTPS policy does not play a role in improving the regional S&T innovation ability. (3) From the perspective of subregions, there are differences in the impact of GPSTPS on the regional S&T innovation ability between the eastern, central and western regions of China. (4) From the perspective of spatial spillover effect, the policy of GPSTPS has a positive spatial spillover effect on the improvement of regional S&T innovation ability in the eastern region, while the effect is not obvious in central and western regions.

1. Introduction

Nowadays, improving scientific and technological innovation ability has become the theme of the times. Enhancing regional science and technology (S&T) innovation ability is the basis for promoting the regional economic level and constructing an innovative country. Regional S&T innovation is a part of sustainable development, and regional S&T innovation itself should have a focus on sustainable development. Progress in regional S&T innovation is the driving force behind sustainable development, which is a subtopic of sustainability. In recent years, the pressure of upgrading China’s economic structure has continued to increase. Under the pressure, the regions have more urgent demand for S&T public services such as common technology R&D, technology transfer and promotion, popularization of science and so on. China has always attached great importance to the construction of public S&T service systems. In 2012, the State Council issued the “Opinions on Deepening the Reform of Science and Technology System and Accelerating the Construction of National Innovation System”, which regards improving ability of S&T public services as an important measure for the reform of S&T management systems. In 2019, the Ministry of Science and Technology issued the “Several Policies and Measures on Supporting Scientific and Technological SMEs to Accelerate Innovation and Development in the New Era”, which clearly proposed to improve China’s S&T innovation ability by increasing the supply of S&T public services. However, the market-oriented supply of S&T public services is insufficient, and the contradiction between supply and demand in S&T public services hinders the improvement of regional innovation ability. Therefore, as an important S&T policy, Government Purchasing Science and Technology Public Service (GPSTPS) has attracted much attention because it helps to provide professional and personalized S&T services, improve the supply efficiency of S&T public services and accelerate the transfer of government functions [1]. Enhancing the quality of S&T public services and implementing the policy of GPSTPS are important measures to promote regional S&T innovation ability.
China began to implement Government Purchasing Public Service (GPPS) in the 1990s. As a means of public governance, GPPS policy has become an important way to promote the construction of service-oriented government. In the early stage of policy implementation, purchase objects mainly focused on basic public services such as medical and healthcare, elderly-care services and community services. In recent years, with the urgent demand for S&T public services and the state’s strong call for GPPS policy, GPSTPS policy has begun to be widely implemented in various regions. S&T public services refer to the services provided by governments dominantly to satisfy the needs of innovation subjects, promoting the transformation and industrialization of technological achievements. Over the years, central and local governments have actively issued policies on GPSTPS, so as to increase the supply of S&T services and enhance the regional S&T innovation ability. With the help of PKULAW, which is a professional legal inquiry software in China, 412 laws and policies are retrieved through taking “Government Purchasing Science & Technology Public Service” as keywords during 2008–2017. For example, the “Several Opinions on Accelerating the Implementation of Innovation-Driven Development Strategy” issued by the State Council in 2015 pointed out that the procurement of science and technology services and products is supposed to be increased and the implementation of GPPS on S&T services is encouraged, so as to improve the application of innovative products. GPSTPS also faces some obstacles during the practices. Localities are supposed to explore the optimal purchase mode which is suitable for the characteristics of S&T public services, and the purchase boundary of GPSTPS should be determined.
Implementation of GPSTPS policy contributes to improving the supply efficiency of S&T public services and stimulating the vitality of regional innovation. However, as an important S&T policy tool, does GPSTPS policy effectively promote the regional S&T innovation ability? For this question, there is still little convincing empirical research, and the current paper tries to answer it scientifically. Considering the phenomenon of policy diffusion in GPSTPS, the current research takes spatial dependence and correlation into account. Based on the panel data of 30 provinces in China from 2008 to 2017, this paper constructs the spatial econometric model, so as to empirically analyze the driving effect and spatial spillover effect of GPSTPS on the regional S&T innovation ability, and further explore the regional differences of above effects.
Different from the previous studies, the main contributions of this paper are as follows.
  • This paper explores the impact and the spatial spillover effect of GPSTPS policy on the regional S&T innovation ability in China. At present, most studies assume that there is no spatial dependence between different regions, which greatly reduces the credibility of the conclusions. The current research adopts the spatial econometric model and explores the influence of GPSTPS policy on regional S&T innovation ability, considering the spatial spillover effect and regional regression differences.
  • To investigate the relationship between GPSTPS policy and regional S&T innovation ability, this paper measures GPSTPS policy from the perspective of policy texts. The policy modeling consistency (PMC) index model, a prevailing policy evaluation method, is creatively applied to GPSTPS policy. By constructing a PMC evaluation index system and PMC evaluation model of GPSTPS policy, the quantitative score, which is the PMC score of GPSTPS policy, can be obtained. Taking the evaluation score of GPSTPS policy at each region as the core explanatory variable, this paper constructs a spatial econometric model to empirically analyze the effect of GPSTPS policy on regional S&T innovation ability.
The rest of this paper is organized as follows. Section 2 is a literature review and mechanism analysis, which introduces the research objects by reviewing literature. Section 3 introduces the research methods and materials, and variables are determined in this part. A spatial econometric model is selected and constructed in Section 4. We discuss the results in Section 5, which includes the regression analysis of spatial econometric model, subregional heterogeneity analysis and analysis of spatial spillover effect. Section 6 is a conclusion.

2. Literature Review and Mechanism Analysis

Regional S&T innovation ability began with the “Theory of Economic Development” proposed by Joseph Alois Schumpeter. Since EM Rogers and JK Larsenapplied the concept of innovation at the regional level, academia has shifted the research focus from the national perspective to regional innovation [2]. The research on the impact of GPSTPS policy on regional S&T innovation ability can be traced back to the research on the effect of S&T public services on S&T innovation ability. Since the GPSTPS policy is aimed at increasing the supply of S&T public services, investigating the effect of S&T public services on S&T innovation ability can lay a foundation for the current research. Nowadays, the existing research at home and abroad mainly focuses on qualitative methods to analyze the mechanism of S&T public services on S&T innovation ability. For example, Bozeman [3] and Li [4] believe that the appropriate content of S&T public services and correct service supply mode can accelerate the allocation of innovation resources and improve the S&T innovation ability. In addition, Xiao points out that the high-quality S&T public services provided by governments is beneficial to alleviating the problems of insufficient resources faced by innovation subjects in markets [5]. This conclusion also further provides a basis for the current research, which aims to explore the effect of GPSTPS on S&T innovation ability. Sternberg’s research on the development of regional S&T innovation in Europe shows that the public services related to innovation, such as the transformation of S&T achievements, are the key factors influencing the regional S&T innovation ability [6]. Boldrini et al. believe that Sci-Tech parks, technology research centers initiated and established by governments, effectively overcome the disadvantage of innovation ability of small and medium-sized enterprises, and effectively promote regional S&T innovation in the process of European integration [7]. At the same time, many scholars conducted a series of empirical studies on the influence of S&T public services on S&T innovation ability. For example, Liu et al. construct the quality evaluation index system of S&T public services. Based on the threshold effect of absorption capacity, they analyzed the effect of S&T public services’ quality on regional S&T innovation ability [8]. Taking 18 cities in Hubei Province in China as an example, Wang and Yan evaluate the S&T public services with the factor analysis method [9]. They point out that S&T public services are an important factor in promoting regional S&T innovation ability. In conclusion, the exploration of the relationship between S&T public services and regional S&T innovation ability can provide the theoretical and empirical support for the research on the impact of GPSTPS policy on S&T innovation ability.
Government procurement is an important management system to optimize the allocation of public resources. Although there are theoretical differences between government procurement and GPPS, the connotation of the two concepts is basically the same. Therefore, this paper reviews the research on the relationship between government procurement and S&T innovation, so as to provide the references for current research. Ai and Chen take the procurement amount as the index to measure government procurement and explored the relationship between government procurement and innovation based on the grey correlation analysis model [10]. Sun investigates the role of government procurement in promoting S&T innovation from the perspective of cointegration analysis [11]. Tian constructs the evaluation model of government procurement promoting innovation and made a specific design for government procurement from the perspective of subjects, mode, system and mechanism [12]. Moreover, in view of the problems existing in the government procurement promoting S&T innovation, scholars have summarized some conclusions. For example, adverse selection [13] and less supervision [14] of innovation subjects usually occur in the process of procurement. Aiming at the problems in government procurement promoting S&T innovation, targeted solutions have been put forward [15,16,17].
To sum up, although the research on the relationship between GPSTPS policy and S&T innovation ability is still deficient in academic circles, the research on the impact of S&T public services on S&T innovation and the research on government procurement to promote S&T innovation both provide a theoretical basis for the current research. Through literature review, it can be found that S&T public services can promote S&T innovation, and there is connection between government procurement and innovation. Therefore, it is reasonable and significant to study the impact of GPSTPS policy on S&T innovation ability. At the same time, as an institutional innovation, GPSTPS is a policy product under the people’s increasing demand for S&T services and the lack of market supply. Therefore, it is necessary to study the relationship between GPSTPS policy and S&T innovation. Based on the above analysis, the current research adopts the spatial econometric model, combined with quantitative evaluation of GPSTPS policy, to investigate the impact of GPSTPS policy on regional S&T innovation ability, so as to provide the theoretical support for improving China’s S&T innovation ability and further developing GPSTPS policy.

3. Materials and Methods

3.1. Research Design

3.1.1. Spatial Autocorrelation Test

Before conducting spatial econometric analysis, it is necessary to carry out the spatial autocorrelation test to judge whether there is a spatial correlation between different regions’ S&T innovation ability. Only when there is spatial correlation is it necessary to further construct a spatial econometric model. This paper adopts Moran’s I, which is the global spatial autocorrelation index, to judge whether there is spatial correlation between different regions in terms of S&T innovation ability. Moran’s I is calculated as follows.
M o r a n s   I = i = 1 n j = 1 n w i j ( X i X ¯ ) ( X j X ¯ ) S 2 i = 1 n j = 1 n w i j
where S 2 = 1 n i = 1 n ( X i X ¯ ) 2 ; X ¯ = 1 n i = 1 n X i . X i , X j represents the S&T innovation ability in the i,jth region, respectively. w i j is the element of the ith row and the jth column in the spatial weight matrix. n represents the number of different regions. The value range of Moran’s I is [−1,1]. When the value of Moran’s I is greater than 0, it indicates that there is a positive spatial correlation between different regions in terms of S&T innovation ability. When the value is less than 0, it means there is negative spatial correlation. And if the value of Moran’s I is equal to 0, it indicates that there is no spatial correlation between different regions in terms of S&T innovation ability.

3.1.2. Selection of Spatial Weight Matrix

The spatial weight matrix is applied to describe the distance relationship between individuals in spatial econometrics. The spatial weight matrix mainly includes the adjacent spatial weight matrix (assuming that the connection between individuals only exists in the regions with a common boundary), the geographical distance spatial weight matrix (assuming that the spatial connection of two regions is inversely proportional to the distance between them) and the economic distance spatial weight matrix. Due to the lack of data in Tibet, China, the adjacent spatial weight matrix cannot reflect the spatial relationship between regions truly, and the economic distance spatial weight matrix is the extension of the geographical distance spatial weight matrix. Therefore, the current research applies the geographical distance spatial weight matrix to carry out spatial econometric analysis. The specific formula of spatial weight matrix applied in this paper is set as follows.
w i , i = { 1 d i , j , i j 0 , i = j
where d i , j represents the surface distance between province i and province j. Specific values of d i , j can be calculated by extracting the longitude and latitude data from the National Basic Geographic System Database.

3.1.3. Construction of Spatial Econometric Model

In order to investigate the impact of GPSTPS policy on regional S&T innovation ability, this paper constructs the spatial econometric model by taking the evaluation score of GPSTPS policy as the core explanatory variable and the regional S&T innovation ability as the explained variable. Due to the uncertainty of specific forms related to S&T innovation ability, this paper constructs the spatial lag model (SLM) that includes dependent variables, the spatial error model (SEM) that includes error terms and the spatial Durbin model (SDM) that includes both spatial lag endogenous variables and spatial error exogenous variables.
(1) Spatial lag model (SLM)
y i t = ρ i = 1 n w i j y i t + γ 1 p o l i t + β X i t + μ i + λ t + ε i t
(2) Spatial error model (SEM)
y i t = γ 2 p o l i t + β X i t + μ i + λ t + φ i t φ i t = δ t = 1 n w i j φ j i + ε i t
(3) Spatial Durbin model (SDM)
y i t = ρ i = 1 n w i j y i t + γ 3 p o l i t + β X i t + η w i j p o l i j t + i = 1 n w i j θ X i j t + μ i + λ t + ε i j
where i represents the province and t represents the year. y i t refers to the S&T innovation ability of the ith province in the jth year. p o l i t refers to the evaluation score of GPTSPS policy of the ith Province in the jth year. w i j is the spatial weight matrix. X i t is the matrix of other control variables of the ith province in the jth year. γ 1 , γ 2 , γ 3 are the estimation coefficients of the core explanatory variable, which is the evaluation score of GPTSPS policy. β is the coefficient matrix of other control variables. ρ is the spatial autocorrelation coefficient. μ i , λ t refer to the individual fixed effect and time fixed effect respectively. ε i t is the random error term, which obeys normal distribution. w i j y i t , w i j p o l i j t , w i j X i j t are the spatial lag terms of S&T innovation ability, GPSTPS policy and other control variables, respectively. η is the spatial lag coefficient of GPTSPS policy. θ is the matrix of other variables’ spatial lag coefficient.
Considering the hysteresis of GPSTPS policy on regional S&T innovation ability and the endogenous problem of the model, we control the time of explanatory variable and control variable in the model to be one year later than the time of the explained variable.

3.2. Index Selection

3.2.1. Variable Determination

(1) Explained variable—regional S&T innovation ability
Nowadays, the measurement of regional S&T innovation ability can be divided into two categories. One of the common practices is applying a single index to measure the regional S&T innovation ability, such as the number of patent applications and authorizations [18], the gross value of high-tech industry [19], the sales revenue of new products [20,21], etc. Another common practice is constructing the index system to measure the regional S&T innovation ability [22,23,24]. For example, Li and Zhu constructed a comprehensive index system of regional S&T innovation ability from three aspects, which are innovation investment, innovation performance and innovation environment [22]. Compared with a single index, the measurement results of a comprehensive index system can reflect the regional S&T innovation ability more scientifically and comprehensively. This paper applies the S&T innovation ability index in “Report of Regional Innovation Ability in China” issued by the China Science & Technology Development Strategy Research Group to measure the regional S&T innovation ability of each province. Based on the theory of regional innovation system, the “Report of Regional Innovation Ability in China” constructs an index system including knowledge acquisition, knowledge creation, enterprise innovation, innovation performance and innovation environment, so as to calculate the S&T innovation ability index of each province in China with comprehensiveness, authority and objectivity.
(2) Explanatory variable—GPSTPS policy
Economic activities and public governance activities must depend on policy guidance. Policy text is the core element of the policy. Based on GPSTPS, this paper makes the policy text analysis and policy content evaluation, attempting to construct a relationship model between GPSTPS policy and regional S&T innovation ability from the perspective of policy texts. With the aid of the PMC index model, this paper analyzes the rationality and feasibility of GPSTPS policy, obtaining the evaluation scores (PMC index) of GPSTPS policy of each province. Nowadays, most of the existing literature evaluates policies after the policy implementation, which belongs to a post-implementation evaluation method. However, this kind of method neglects the value of policy itself and cost is higher. The PMC index model aims at the policy itself and analyzes internal consistency, advantages and disadvantages of a policy from various dimensions. It is an advanced policy evaluation method in the world. Evaluating GPSTPS policy with PMC index model mainly includes the following two steps.
(1) The first step is constructing a PMC evaluation index system of GPSTPS policy.
To obtain the evaluation score (PMC index) of each policy, constructing a PMC evaluation index system is the first step. Based on the basic characteristics of S&T policy and the Omnia Mobilis hypothesis, a PMC evaluation index system of GPSTPS policy is constructed, which is shown in Table 1, including 10 primary variables and 43 secondary variables.
(2) The second step is calculating the PMC index score of GPSTPS policy.
Based on the PMC evaluation index system, the collected GPSTPS policies can be evaluated objectively. For a GPSTPS policy, the measurement of its PMC index score needs the following three steps. (1) Firstly, the secondary variables are assigned values according to Formulas (6) and (7). Secondary variables obey the [0, 1] distribution. If the relevant information of a secondary variable appears in the policy text, then the secondary variable is assigned to 1, otherwise the value is 0. (2) Secondly, the values of 10 primary variables can be calculated through Formula (8). That is, the score of each primary variable is the sum of the values of corresponding secondary variables divided by the number of secondary variables. (3) The PMC index score of each policy can be obtained by Formula (9). The PMC index score is the sum of scores of the primary variables.
X N [ 0 , 1 ]
X = { X R : [ 0 ~ 1 ] }
X t ( j = 1 n X t j T ( X t j ) )
P M C = [ X 1 ( i = 1 6 X 1 i 6 ) + X 2 ( j = 1 3 X 2 j 3 ) + X 3 ( k = 1 6 X 3 k 6 ) + X 4 ( l = 1 5 X 4 l 5 ) + X 5 ( m = 1 3 X 5 m 3 ) + X 6 ( n = 1 4 X 4 n 4 ) + X 7 ( p = 1 5 X 7 p 5 ) + X 8 ( q = 1 3 X 3 q 3 ) + X 9 ( r = 1 4 X 4 r 4 ) + X 10 ( s = 1 4 X 4 s 4 ) ]
(3) Control variables
In addition to GPSTPS policy, the regional S&T innovation ability is also affected by other factors. Referring to the existing literature, the following variables are taken as control variables.
Economic level. The level of economic development has a significant impact on the investment intensity of regional S&T innovation. The higher the level of economic development, the greater the investment intensity of innovation elements and the stronger the initiative of innovation subjects [32,33], which is conducive to the development of regional S&T innovation ability. GDP per capita is used to measure the regional economic level, which is recorded as pgdp.
Degree of marketization. Regions with a higher degree of marketization usually have a more equal, tolerant and standardized market environment. Marketization environment improves regional S&T innovation ability through increasing market competition and reducing innovation cost. In this paper, the marketization index of each province in China which is calculated by Wang et al. [9] is adopted to measure the degree of marketization and it is recorded as market.
Level of opening up. Opening to the outside world is beneficial to introducing the foreign high-level technology. The introduction of advanced technology can realize cross-regional technology learning and limitation, improving the local S&T innovation ability [34,35,36]. This paper adopts the proportion of the import and export trade of the province to the regional GDP to measure the level of opening up, which is recorded as open.
Human capital. Human capital is the key factor of regional S&T innovation. The proportion of population with a college degree or above in a region can directly reflect the structural characteristics of regional human capital [37]. Therefore, this proportion is taken as the proxy variable of human capital, which is recorded as hc.
Level of R&D investment. The level of R&D investment is closely related to the S&T innovation ability. High level of R&D investment contributes to the allocation and supply efficiency of regional innovation resources, stimulating the vitality of regional S&T innovation and promoting regional S&T innovation ability [8]. The proportion of R&D expenditure to GDP of each province is applied to measure the level of R&D investment, recorded as rdi.
Urbanization level. Urbanization is the process of spatial agglomeration of innovative elements such as industry and population. Urbanization can provide an active environment for the positive spillover of talents and technologies [38], and also promote governments to increase investments in innovation [20], thus laying a foundation for improving regional S&T ability. This paper uses the proportion of urban population in each province to measure the urbanization level, recorded as urb.
Industrial structure. Regional industrial structure and S&T innovation are interrelated. The optimization and upgrading of industrial structure can provide a broad market for the application of S&T innovation [39], so as to improve regional S&T innovation ability. The industrial structure hierarchy coefficient is applied to measure this control variable [40], which is recorded as is. i s = i = 1 3 s i i , where s i is the proportion of the production in the ith industry to GDP. The greater the industrial structure hierarchy coefficient, the higher the level of industrial structure of the region.
Variables involved in this paper and their corresponding measurement methods are shown in Table 2.

3.2.2. Variable Source

Considering the continuity of the data, this paper uses the panel data of 30 provinces in China from 2008 to 2017 (excluding Tibet, where data is seriously lacking, and also excluding Hong Kong, Macao and Taiwan). For the explained variable, data of the S&T innovation ability index, which is used to measure the regional S&T innovation ability, comes from the “Report of Regional Innovation Ability in China”. For the control variables, the data are mainly from the “China Statistical Yearbook” (http://www.stats.gov.cn/tjsj/ndsj/) and “Marketization Index of China’s provinces”. Finally, in order to obtain the data of the explanatory variable, that is, the PMC index score of GPSTPS policies, it is necessary to collect GPSTPS policies in each province. To exhaust the GPSTPS policies in each province and ensure the comprehensive and detailed policy texts, this paper takes the official websites of local governments and China Government Procurement Website as the main data sources. Furthermore, the software of PKULAW (http://www.pkulaw.net/) is also an important tool, which is a legal inquiry software. GPSTPS policies are collected through retrieving the keywords and browsing the laws and regulations released on the software and government websites. It is noteworthy that GPSTPS policies are important components of S&T policies. Policies, regulations or relevant opinions of GPSTPS often exist in the policies related to S&T or innovation topics. Therefore, in addition to the precise search with “GPSTPS” as the keyword, it is also necessary to pay attention to the policy texts with the keywords or themes of “S&T”, “innovation” and so on. Significantly, in order to obtain comprehensive GPSTPS policies, “full text” and ambiguous retrieving rules should be made when searching policies by keyword retrieval. GPSTPS policies in 30 provinces should be covered thoroughly and the time span is determined as 2008–2017. Through policy collection, 412 GPSTPS policies are finally determined as the research objects. Not only are the guiding and programmatic documents of GPSTPS incorporated, such as policies about purchase catalogue, purchase object, etc., but also the supporting documents of GPSTPS are contained, such as policies about evaluation and supervision, and performance appraisal. And the change trend in the number of GPSTPS policies from 2008 to 2017 is shown in Figure 1 below. According to the PMC evaluation index system of GPSTPS policy and the calculation formulae, the PMC index score of GPSTPS of 30 provinces in each year is obtained. In order to eliminate the possible heteroscedasticity caused by different dimensions among variables, the data of variables are logarithmically processed.

4. Results

4.1. Spatial Autocorrelation Test

In order to explore whether there is a spatial correlation in S&T innovation ability between 30 provinces, this paper constructs the geographical distance spatial weight matrix and calculates the global Moran’s I index of S&T innovation ability of 30 provinces in China from 2008 to 2017. Results of Moran’s I are shown in Table 3.
It can be learned from Table 3 that the regional S&T innovation ability in each year from 2008 to 2017 has passed the significance test at the 5% level, and the values of Moran’s I are all positive, which indicates that there is an obvious spatial positive autocorrelation of the regional S&T innovation ability between 30 provinces in China. In other words, regional S&T innovation ability has spatial correlation in geographical space from 2008 to 2017.
In order to better confirm and present the spatial correlation of regional S&T innovation ability, 2008, 2011, 2014 and 2017 are selected as observation years, and Moran’s I scatter diagrams are drawn with the help of STATA15 software. As shown in Figure 2, Figure 3, Figure 4 and Figure 5, S&T innovation ability of 30 provinces is mainly distributed in the first quadrant (high–high agglomeration) and the third quadrant (low–low agglomeration), which means that the regional S&T innovation ability has strong spatial correlation.
To sum up, the practice of adopting the spatial econometric model in this paper to study the relationship between regional S&T innovation ability and GPSTPS policy has strong applicability and necessity.

4.2. Selection of Spatial Econometric Model

Based on the spatial correlation test, it is proved that there is spatial effect in China’s regional S&T innovation ability. Therefore, the next step is to choose a spatial econometric model to analyze the influencing factors and explore the spatial effect. Before analyzing the spatial panel data, this paper carries out the Lagrange multiplier (LM) test, the likelihood ratio (LR) test and the Hausman test, respectively, to select the spatial econometric model.
(1) Firstly, the possibility of the presence of spatial interaction effects in the model is examined. This is performed through a hypothesis test to check the possibility of the presence of spatial error or spatial lag in the model. The LM test is conducted to judge the spatial lag term and spatial error term. Results are shown in Table 4. According to the LM test results, the test values in spatial error and spatial lag are both significant at the level of 5%, rejecting the assumption of no spatial lag term and no spatial error term. Therefore, this paper selects the spatial Durbin model (SDM) which includes both spatial error term and spatial lag term.
(2) For the sake of rigor, the LR test is carried out to further investigate whether the SDM will degenerate to the SEM or SLM. Results of the LR test are shown in Table 5, rejecting the hypothesis that the SDM can degenerate into the SEM or SLM. Results of the LR test verify the rationality of applying the SDM in this paper.
(3) Finally, the Hausman test is used to determine the individual fixed-effect model or individual random-effect model. In the current research, the statistical quantity in the Hausman test is 72.32, rejecting the null hypothesis of random effect at the significance level of 1%. Therefore, the fixed-effect model is selected. Specifically, we have controlled both spatial fixed effect and time fixed effect.
Based on the above analysis, the current research finally adopts SDM with individual fixed effect to carry out the regression analysis of the influencing factors of regional S&T innovation ability.

5. Discussion

5.1. Regression Analysis of Spatial Econometric Model

In order to obtain more robust results, the estimation results of the SDM are compared with the results of the SLM and SEM. Corresponding regression results are shown in Table 6.
According to the estimation results in Table 6, it can be found that, there is not much difference between the regression results of the SDM and the results of other models, indicating that the SDM model is stable. The specific regression results of the SDM are as follows.
Firstly, there is a spatial positive correlation in S&T innovation ability in China. According to the regression results of the SDM in Table 6, rho, which is the spatial correlation coefficient, is significantly positive at the level of 1%, indicating that China’s regional S&T innovation ability has a significant positive correlation between 30 provinces. The result indicates that the improvement of S&T innovation ability of a province will have a significant impact on the improvement of S&T innovation ability of its neighboring provinces. For example, the outstanding S&T innovation ability in Shanghai has driven the improvement of S&T innovation ability of its surrounding provinces such as Jiangsu.
Secondly, the effect of GPSTPS policy on improving regional S&T innovation ability is not obvious. It can be seen from Table 6 that the influencing coefficient of pol in regression results of the SDM is positive, but it is not significant. The result shows that GPSTPS policy is positively correlated with regional S&T innovation ability, but the effect between them is not obvious. That means there is no significant positive correlation between GPSTPS policy and the improvement of S&T innovation ability. The possible reasons are as follows. (1) From the macro perspective of policy system, the policy system for GPSTPS is not sound and perfect. Although laws and regulations at the national level such as “Government Procurement Law of the People’s Republic of China” have mentioned to make extensive use of social forces to improve the supply efficiency of S&T public services and adopt the policy of GPSTPS, local governments rarely define the specific purchase contents, purchase objects and purchase methods of GPSTPS, which leads to low implementation efficiency and unsound implementation effect of GPSTPS. Therefore, due to the imperfect policies of GPSTPS, the regional S&T innovation ability cannot be improved. (2) From the micro perspective of purchase content, the purchase scope of GPSTPS policy is relatively narrow. Nowadays, the specific purchase contents in GPSTPS are mostly limited to basic fields such as S&T information, S&T appraisal and S&T personnel training, while there is little practice in purchasing more professional S&T services such as S&T finance, S&T promotion and so on. As a result, regional S&T innovation ability cannot be improved without professional and abundant S&T services supply. The typical case behind this econometric finding is the province of Anhui, where the S&T innovation ability is low. Through retrieving the GPSTPS policy in Anhui, it can be found that there are few regulations or policies that define the specific purchase contents, purchase objects and purchase methods. Imperfect GPSTPS policies in Anhui hinders the improvement of regional S&T innovation ability.
Considering the endogenous of GPSTPS policy in the process of influencing regional S&T innovation ability, this paper adopts the method of instrumental variable to address and explain the problem. Specifically, since the lag of the explanatory variable can eliminate the impact of the current period to a certain extent and eliminate the endogenous problem, the lag of the explanatory variable is taken as the instrumental variable. Because the above model adopts fixed effect, the dispersion transformation is performed first and then the two-stage least squares method is used for intra-group estimation. The results of the test using Stata software show that the instrumental variable method can effectively explain the potential endogenous problems of the model.

5.2. Subregional Heterogeneity Analysis

From an overall perspective, there is no significant correlation between GPSTPS policy and the improvement of S&T innovation ability in China. However, considering the wide geographical distribution of China and the spatial differences in terms of economic development, this paper further explores the regional differences of the relationship between GPSTPS policy and regional S&T innovation ability. According to the standard division of the central, eastern and western regions of China that is stipulated by the National Bureau of Statistics, 30 provinces in the current research are divided into subsamples of the eastern region, the central region and the western region. Then, empirical evaluation is carried out again by using the SDM based on the data of the subregions. Specific regression results are shown in Table 7.
According to the regression results of the SDM that are based on data of the subregions, the regression coefficient of GPSTPS policy is significantly positive in the eastern region, indicating that GPSTPS policy can promote the S&T innovation ability in the eastern region of China. Possible reasons for the results are concluded as follows. On the one hand, the economic development in the east of China is of a higher level, and the eastern region has perfect infrastructure to promote the flow of innovation elements, which creates a superior innovation environment for innovation subjects. On the other hand, policies of GPSTPS in the eastern region are relatively sound and comprehensive, and the quality of S&T public services has been improved, which lays a foundation for the improvement of S&T innovation ability. The role of S&T public services in promoting the regional S&T innovation is mainly reflected in the following two aspects. Firstly, high-quality S&T public services can provide innovation subjects with innovation platform, innovation information database, etc. Such S&T public services can help innovation subjects grasp the latest S&T information and excavate the S&T demand, so as to reduce the innovation cost and improve regional S&T innovation ability. Secondly, in the process of S&T innovation, S&T subjects are facing risks caused by information asymmetry or the lack of professional knowledge. S&T public services purchased by governments can incorporate innovation subjects into the S&T innovation network and provide them with consulting services such as S&T information, relevant policies and supervision services, so as to reduce the risks and improve S&T innovation ability. Under this background, GPSTPS can provide a policy guidance and guarantee for the eastern region, which has superior resource endowment. Therefore, in the eastern region of China, GPSTPS policy plays a vital role in promoting the regional S&T innovation ability. However, in the western and central regions, the regression coefficients of GPSTPS policy have not passed the significance test, indicating that the effect of GPSTPS policy on the improvement of S&T innovation ability in the western and central regions is not obvious. The typical cases behind this econometric conclusion are the provinces of Jiangsu, Hunan and Gansu. As an eastern region, Jiangsu possess high economic development level, perfect S&T innovation infrastructure and improved S&T public service; thus, GPSTPS policy can promote the S&T innovation ability effectively. However, without a superior innovation environment, GPSTPS policy cannot promote the improvement of regional innovation ability in Hunan and Gansu.

5.3. Analysis of Spatial Spillover Effect

In order to analyze the spillover effect of GPSTPS policy on regional S&T innovation ability more comprehensively, this paper adopts a partial differential method to analyze the direct and indirect effect of spatial spillover. Based on the SDM, the current research explores the direct and indirect effects of S&T innovation ability in the central, western and eastern regions. The results are shown in Table 8. Direct effect analysis can reflect the impact of GPSTPS policy on the local S&T innovation ability, while indirect effect analysis reflects the impact of GPSTPS policy on the adjacent regions’ S&T innovation ability.
(1) Eastern region
In the direct effect, the coefficient of GPSTPS policy is 1.046, which is significant at the level of 5%. The result indicates that, in the eastern region, GPSTPS policy has a positive effect on promoting the local S&T innovation ability. The larger the PMC index, the higher the feasibility and rationality of GPSTPS policy. A sound and comprehensive GPSTPS policy can improve the quality of S&T public services. The role of S&T public services in promoting regional S&T innovation is described in Section 5.2. In the indirect effect, the coefficient of GPSTPS policy is positive and significant, indicating that the GPSTPS policy has a positive spatial spillover effect on the neighboring provinces’ S&T innovation ability. The possible reason is that in order to strengthen the communication and narrow the differences between provinces, local governments often implement the same policy in areas with similar economic development, which is also known as policy diffusion in the field of policy science. Therefore, based on the geographical distance spatial weight matrix, the adjacent provinces in the eastern region often adopt the same GPSTPS policy, which promotes the local S&T innovation ability.
(2) Central and western regions
It can be seen from Table 8 that the coefficients of GPSTPS policy in the direct effect in the central and western regions are both positive, but they are not significant. The results indicate that GPSTPS policy in central and western regions has a positive role in promoting the local S&T innovation ability, while the effect is not obvious. The possible reasons for the insignificant effect in the central and western region are concluded as follows. S&T public services are highly specialized. However, in the central and western regions, especially the western regions, one of the regional characteristics is the poor infrastructure and there are few producers who supply S&T public services. This means that the purchase objects in GPSTPS are relatively lacking, which restricts the implementation of the GPSTPS policy and hinders the improvement of local S&T innovation ability. Furthermore, the indirect effects in the central and western regions are also positive and nonsignificant. The result indicates that the spatial spillover effect of GPSTPS policy on the improvement of adjacent provinces’ S&T innovation ability is not obvious in the central and western regions. The possible reason for the results may be the imperfect policy system, and the unsound policy cannot influence on the other regions’ S&T innovation ability.

6. Conclusions

6.1. Research Conclusions

S&T innovation ability is the primary productive force, and it can promote the comprehensive and sustainable development of the economy and society. This paper investigates the impact of GPSTPS policy on regional S&T innovation ability and aims to promote the sustainable development in China. Based on the panel data of 30 provinces from 2008 to 2017 in China, this paper constructs the PMC index model and spatial econometric model of GPSTPS policy, investigating the relationship between GPSTPS policy and regional S&T innovation ability. Results show that: (1) There is a positive and significant spatial correlation in regional S&T innovation ability between 30 provinces in China. (2) On the whole, the GPSTPS policy does not play a vital role in improving the regional S&T innovation ability. (3) From the perspective of subregions, the effect of GPSTPS policy on the improvement of S&T innovation ability is not obvious in the central and western regions. However, GPSTPS policy obviously promotes the regional S&T innovation ability in the eastern region of China. (4) From the perspective of spatial spillover effect, GPSTPS policy has a positive spatial spillover effect on the improvement of regional S&T innovation ability in the eastern region, while the spatial spillover effect of the policy on S&T innovation ability is not obvious in central and western regions.
Research on regional S&T innovation development in Europe shows that public S&T services supported by governments, such as S&T parks and technology research and development centers established by governments, can effectively overcome the shortcomings of small and medium-sized enterprises’ innovation and promote regional S&T innovation in the process of the European integration. Compared with the results of this study, it is found that the public S&T services supported by European governments can effectively promote regional S&T innovation ability.

6.2. Theoretical and Practical Implications

According to the empirical analysis, with the aim of improving the regional S&T innovation ability, the following implications are summarized.
(1) The top design must be enhanced, and a sound GPSTPS policy system should be constructed. Considering the role of GPSTPS policy in promoting the regional S&T innovation ability, local governments should improve the GPSTPS policy and pay attention to the quality and quantity of the policies. According to the constructed PMC index model of GPSTPS policy in the current research, governments can evaluate the local polices and optimize the GPSTPS polices based on the PMC index. Only an effective and perfect GPSTPS policy can promote the regional S&T innovation ability. For example, the GPSTPS policy system which specifies the purchase contents, purchase objects and purchase procedures should be initiated through considering the characteristics of S&T. In addition, in order to guarantee the implementation effect of GPSTPS policy, the supporting policies, such as the evaluation and supervision system, should be initiated.
(2) Positive spatial correlation of S&T innovation ability between provinces should be fully utilized and the provincial cooperation can be strengthened. Empirical analysis shows that there is a significant spatial correlation in S&T innovation ability between provinces. Therefore, through building industrial chains, sharing S&T public services platforms and making full use of R&D platforms, provinces can cooperate with each other, so as to improve the regional S&T innovation ability.
(3) Differentiated policies should be implemented in the eastern, central and western regions. According to the empirical results of the effect of GPSTPS policy on S&T innovation ability in the eastern, central and western region of China, local governments should adopt differentiated policies and implement targeted strategies according to local conditions to improve the S&T innovation ability. In the western region of China, due to the poor infrastructure and low supply level of S&T public services, the primary task of governments in western regions is to improve infrastructure, promote the rationalization of industrial institutions and strengthen the human capital, so as to lay a solid foundation for the implementation of GPSTPS policy. For the central region of China, governments should optimize the policy environment of GPSTPS. Nowadays, the policy terms of GPSTPS are not serious and the operability is poor. In order to maximize the effect of GPSTPS policy on regional innovation ability, local governments should specify the purchase contents, purchase objects and purchase procedures of GPSTPS. In addition, in order to implement GPSTPS policy, the evaluation and supervision system is essential. In the eastern region of China, GPSTPS policy has a significant effect on improving the regional S&T innovation ability. Therefore, local governments should further improve the GPSTPS policy and strengthen the quality of S&T public services. Policy diffusion effect of GPSTPS need to be paid attention to, so as to drive the improvement of S&T innovation ability in surrounding areas.

6.3. Limitations and Guidelines for Future Research

First, there is still room for the improvement of the PMC evaluation index system of GPSTPS policy. Researchers can design a more comprehensive index system for GPSTPS policy, so as to achieve more reasonable and accurate evaluation scores.
Second, this paper has conducted the research on the national level, and at the western, eastern and western regional level. Researchers who are interested in a particular area can also apply the model constructed in this paper to study a city group level or prefecture-level city.
In summary, science and technology is a double-edged sword. When it promotes social progress, S&T has also led to an increasingly serious global ecological crisis due to the abuse of technology by humans. People blindly use science and technology, over-exploit and utilize natural resources, and the ecological balance has been destroyed, leading to the environmental crisis. Therefore, human beings should minimize the negative effects of science and technology while making use of it.

Author Contributions

Conceptualization, Y.Z. and D.Z.; methodology, Y.Z.; software, D.Z.; formal analysis, Y.Z.; investigation, Z.L.; data curation, Z.L.; writing—original draft preparation, Y.Z.; writing—review and editing, D.Z.; supervision, Z.L. All authors have read and agreed to the published version of the manuscript.

Funding

This study was funded by the National Nature Science Foundation of China under Grant number 72243005, the China Scholarship Council (202208320284) and Jiangsu Provincial Department of Education Fund of Philosophy and Social Science (2017SJB2176).

Informed Consent Statement

Informed consent was obtained from all subjects involved in the study.

Data Availability Statement

The data that support the findings of this study are available from the corresponding author upon reasonable request.

Conflicts of Interest

The authors have no relevant financial or non-financial interests to disclose.

References

  1. Zhang, H.; Li, K. Research on Government Purchase of Science and Technology Service Model Based on Market Orientation. Sci. Technol. Manag. Res. 2016, 36, 32–36. [Google Scholar]
  2. Rogers, E.M.; Larsen, J.K. The consensus development process for medical technologies: A cross-cultural comparison of Sweden and the United States. JAMA 1982, 248, 1880–1882. [Google Scholar] [CrossRef] [PubMed]
  3. Bozeman, B. Technology transfer and public policy: A review of research and theory. Res. Policy 2000, 29, 627–655. [Google Scholar] [CrossRef]
  4. Li, T.; Ma, J.; Hou, X. A Case Study on the Government Demand-Oriented Scientific and Technical Service Innovation: Based on the Sample of Dongguan Songshan Lake High-tech Zone. Sci. Sci. Manag. ST 2016, 37, 58–66. [Google Scholar]
  5. Xiao, W. Functional Orientation and Organizational Innovation of Public Service Platform for Small and Medium-Sized Enterprises. Study Explor. 2014, 23, 104–107. [Google Scholar]
  6. Sterngerg, R. Innovation networks and regional development: Evidence from the European regional innovation survey (ERIS): Theoretical concepts, methodological approach, empirical basis and introduction to the theme issue. Eur. Plan. Stud. 2000, 8, 389–407. [Google Scholar] [CrossRef]
  7. Boldrini, J.C.; Schieb-Bienfait, N.; Chene, E. Improving SMEs’ guidance within public innovation supports. Eur. Plan. Stud. 2011, 19, 775–793. [Google Scholar] [CrossRef]
  8. Liu, Q.; Guo, X. Research on Effect of Science and Technology Public Service Efficiency on Regional Innovation Ability: GMM Analysis Based on Provincial Dynamic Panel. Sci. Technol. Manag. Res. 2021, 41, 110–116. [Google Scholar]
  9. Wang, S.; Yan, P. Research on Evaluation System of Public Science and Technology Service Ability in Hubei Province Based on Factor Analysis. Sci. Technol. Manag. Res. 2015, 35, 58–63. [Google Scholar]
  10. Ai, B.; Chen, X. The Relationship Between Government Procurement and Independent Innovation. Manag. World 2008, 28, 169–170. [Google Scholar]
  11. Sun, L. An Empirical Study on the Impact of Government Procurement on the Development of High-Tech Industry in China; Donghua University: Shanghai, China, 2014. [Google Scholar]
  12. Tian, Y. Research on Government Procurement System to Support Independent Innovative Products; Wuhan University of Technology: Wuhan, China, 2009. [Google Scholar]
  13. Zhang, Q.; Wang, X. Study on Two Stage Government Procurement Policy to Support Independent Innovation. J. Syst. Manag. 2010, 19, 147–150. [Google Scholar]
  14. He, J.; Zhang, L. Bottleneck Restraints of Independent Innovation Supplier in Government Procurement. J. Tianjin Norm. Univ. Soc. Sci. 2010, 23, 58–62. [Google Scholar]
  15. Siemiatycki, M. Implications of Private-Public Partnerships on The Development of Urban Public Transit Infrastructure: The Case of Vancouver. J. Plan. Educ. Res. 2006, 26, 137–151. [Google Scholar] [CrossRef] [Green Version]
  16. Lember, V.; Kalvet, T.; Kattel, R. Urban Competitiveness and Public Procurement for Innovation. Urban Stud. 2011, 48, 1373–1395. [Google Scholar] [CrossRef]
  17. Uyarra, E.; Edler, J.; Garcia-Estevez, J. Barriers to innovation through public procurement: A supplier perspective. Technovation 2014, 34, 631–645. [Google Scholar] [CrossRef]
  18. Liu, Q.; Guo, J.; Xu, N. The Impact of the Quality of Public Science and Technology Services on the Level of Regional Innovation—Analysis of the Threshold Effect Based on Absorptive Capacity. Forum Sci. Technol. China 2021, 5, 77–87. [Google Scholar]
  19. Zhao, L.; Zhang, Y. Threshold Effects of Social Capital on Regional Innovation Capability from the Institutional Environments Perspective. Sci. Technol. Prog. Policy 2015, 32, 44–48. [Google Scholar]
  20. Qiu, Y.; Li, Y. On Urban Innovation Ability Influenced by Urbanization: A Case Study of the 28 Cities of the City Clusters Along the Middle Reaches of the Yangtze River. J. Hunan Univ. Sci. Technol. Soc. Sci. Ed. 2017, 20, 52–57. [Google Scholar]
  21. Zhou, D.; Zhang, H. Spatial-Temporal Dynamics of Regional Innovation Convergence of China. Forum Sci. Technol. China 2015, 24, 11–15. [Google Scholar]
  22. Li, S.; Zhu, S. Has S&T evaluation effectively promoted regional S&T innovation? A study from the policy-driven perspective. Sci. Res. Manag. 2021, 42, 11–17. [Google Scholar]
  23. Zhou, W.; Xiang, Y. An Empirical Study on Key Factors of Regional Innovative Capability About China’s Provinces and Cities. Sci. Res. Manag. 2015, 36, 29–35. [Google Scholar]
  24. Huang, D.; Yang, C. Study on the Convergence of Regional Innovation Capacity Based on Spatial Effect. Soft Sci. 2017, 31, 44–48. [Google Scholar]
  25. Estradama, R. Policy Modeling: Definition, Classification and Evaluation. J. Policy Model. 2011, 33, 523–536. [Google Scholar] [CrossRef]
  26. Zhang, Y.; Gen, Z. The Quantitative Evaluation of Regional Science and Technology Innovation Policy: Based on the index of PMC Model. Sci. Technol. Manag. Res. 2015, 25, 26–37. [Google Scholar]
  27. Mao, Z.; Mei, H. Analysis of Domestic and Foreign Policies in Artificial Intelligence from the Perspective of Policy Instruments. J. Intell. 2020, 39, 74–81. [Google Scholar]
  28. Zhang, Y.; Zhou, Y. Policy Instrument Mining and Quantitative Evaluation of New Energy Vehicles Subsidies. China Popul. Resour. Environ. 2017, 27, 188–197. [Google Scholar]
  29. Dong, J.; Quan, Y.; Lijun, Y.; Xiuting, L. Research on Quantitative Evaluation of Single Real Estate Policy Based on PMC Index Model—Taking China’s Housing Rental Policy Since the 13th Five-Year Plan as an Example. Manag. Rev. 2020, 32, 3–13. [Google Scholar]
  30. Shi, T.; Yang, S.; Chunxi, W.; Wenjun, T. Quantitative Evaluation of The Transformation Policy of Scientific and Technological Achievements-Based on PMC Index Model. Sci. Manag. Res. 2020, 38, 29–33. [Google Scholar]
  31. Wang, J.; Yang, Q.; Zhang, Y. Quantitative Evaluation of Civil-Military Integration Policy Based on PMC-AE Index Model. J. Intell. 2019, 38, 66–73. [Google Scholar]
  32. Zeng, C.; Liu, Q.; Zhang, Y. Coordination Between Sci-Tech Input and Level of Regional Economic Development. Sci. Res. Manag. 2013, 34, 203–210. [Google Scholar]
  33. Zhou, M.; Shen, W. Research on the Mechanism of R&D Investment on Regional Innovation Capacity: Based on Empirical Evidence of Intellectual Property Protection Intensity. Sci. Sci. Manag. ST 2018, 39, 26–39. [Google Scholar]
  34. Zhu, Y.; Wang, W. Environmental Regulation, Opening Up and Independent Innovation: An Empirical Study Based on Inter Provincial Dynamic Panel Data. Inq. Econ. Issues 2015, 10, 33–44. [Google Scholar]
  35. Cao, X.; Yu, J. Research on Regional R&D Innovation Efficiency in Chinese Provinces with the Perspective of Innovation Driven: Based on Projection Pursuit and Stochastic Frontier Analysis Model. Sci. Sci. Manag. ST 2015, 36, 124–132. [Google Scholar]
  36. Zhao, Z.; Zhou, J.; Shen, N. An Empirical Study on The Impact of Financial Development and Regional Innovation Efficiency: Based on The Mediation Effect of Opening Degree. Stud. Sci. Sci. 2016, 34, 1408–1416. [Google Scholar]
  37. Gao, L.; Ma, J. Innovation, Upgrading of Labor Factors and Regional Economic Growth. J. Southwest Minzu Univ. Humanit. Soc. Sci. 2019, 40, 95–101. [Google Scholar]
  38. Qiu, Y. Technological Innovation Effect of Urbanization: An Empirical Study Based on China’s Regional Panel Data from 1990 to 2010. Chin. J. Popul. Sci. 2013, 21, 26–35. [Google Scholar]
  39. Hatipoglu, O. The relationship between inequality and innovative activity: A chumpeterian theory and evidence from cross-country data. Scott. J. Political Econ. 2012, 59, 224–248. [Google Scholar] [CrossRef]
  40. Zeng, J.; Zhou, D. Regional Characteristics, Industrial Structure, and the Performance of Urban Innovation—Based on a Quasi-natural Experiment on Innovative City Pilots. China Public Adm. Rev. 2019, 1, 66–97. [Google Scholar]
Figure 1. Change trend of the number of GPSTPS policies.
Sustainability 15 02354 g001
Figure 2. Moran’s I scatter chart of regional S&T innovation ability in 2008.
Sustainability 15 02354 g002
Figure 3. Moran’s I scatter chart of regional S&T innovation ability in 2011.
Sustainability 15 02354 g003
Figure 4. Moran’s I scatter chart of regional S&T innovation ability in 2014.
Sustainability 15 02354 g004
Figure 5. Moran’s I scatter chart of regional S&T innovation ability in 2017.
Sustainability 15 02354 g005
Table 1. PMC evaluation index system of GPSTPS policy.
Primary VariableSecondary VariableResources of Variable
(X1) Nature of policy(X1:1) Forecast, (X1:2) Suggest, (X1:3) Supervise, (X1:4) Describe, (X1:5) Feedback, (X1:6) GuideRuize Estradama [25]
(X2) Prescription of policy (X2:1) Long term, (X2:2) Medium term, (X2:3) Short termRuize Estradama [25]
(X3) Field of policy(X3:1) Environment, (X3:2) Economic, (X3:3) Technology, (X3:4) Politics, (X3:5) Sociology, (X3:6) OthersZhang and Gen [26]; Mao and Mei [27]
(X4) Subject of policy(X4:1) the State Council, (X4:2) National ministries and commissions, (X4:3) Provincial & municipal prefectural committees, (X4:4) Provincial & municipal departments and bureaus, (X4:5) District committeesZhang and Zhou [28]
(X5) Object of policy(X5:1) Local governments, (X5:2) S&T service institutions, (X5:3) ConsumersConstructed by authors
(X6) Content of policy(X6:1) Specific objects of S&T services (Purchase content), (X6:2) Purchase mode, (X6:3) Producers of S&T services (Purchase object), (X6:4) Evaluation and supervision Constructed by authors
(X7) Effect level(X7:1) Law, (X7:2) Administrative regulation, (X7:3) Department rule, (X7:4) Normative document, (X7:5) Industrial stipulationDong et al. [29]
(X8) Policy tool(X8:1) Supply type, (X8:2) Demand type, (X8:3) Environment typeShi et al. [30]
(X9) Policy evaluation(X9:1) Sufficient foundation, (X9:2) Clear objectives, (X9:3) Detailed planning, (X9:4) Scientific schemeWang, Yang and Zhang [31]
(X10) Function of policy(X10:1) Standardization and guidance, (X10:2) Institutional constraints, (X10:3) Increasing the supply of S&T services, (X10:4) Encouraging S&T innovationConstructed by authors
Table 2. Variables and measurement methods.
VariableVariable SymbolMeasurement Method
Regional S&T innovation abilityinnoS&T innovation ability index, which is achieved from “Report of Regional Innovation Ability in China”.
GPSTPS policypolPMC index score of GPSTPS policies in each province.
Economic levelpgdpGDP per capita in each province.
Degree of marketization marketMarketization index of each province, which is achieved from “Marketization Index of China’s provinces”.
Level of opening up openProportion of the import and export trade of each province to the regional GDP.
Human capitalhcProportion of population with a college degree or above in each province.
Level of R&D investmentrdiProportion of R&D expenditure to GDP of each province
Urbanization levelurbProportion of urban population in each province.
Industrial structureisIndustrial structure hierarchy coefficient in each province.
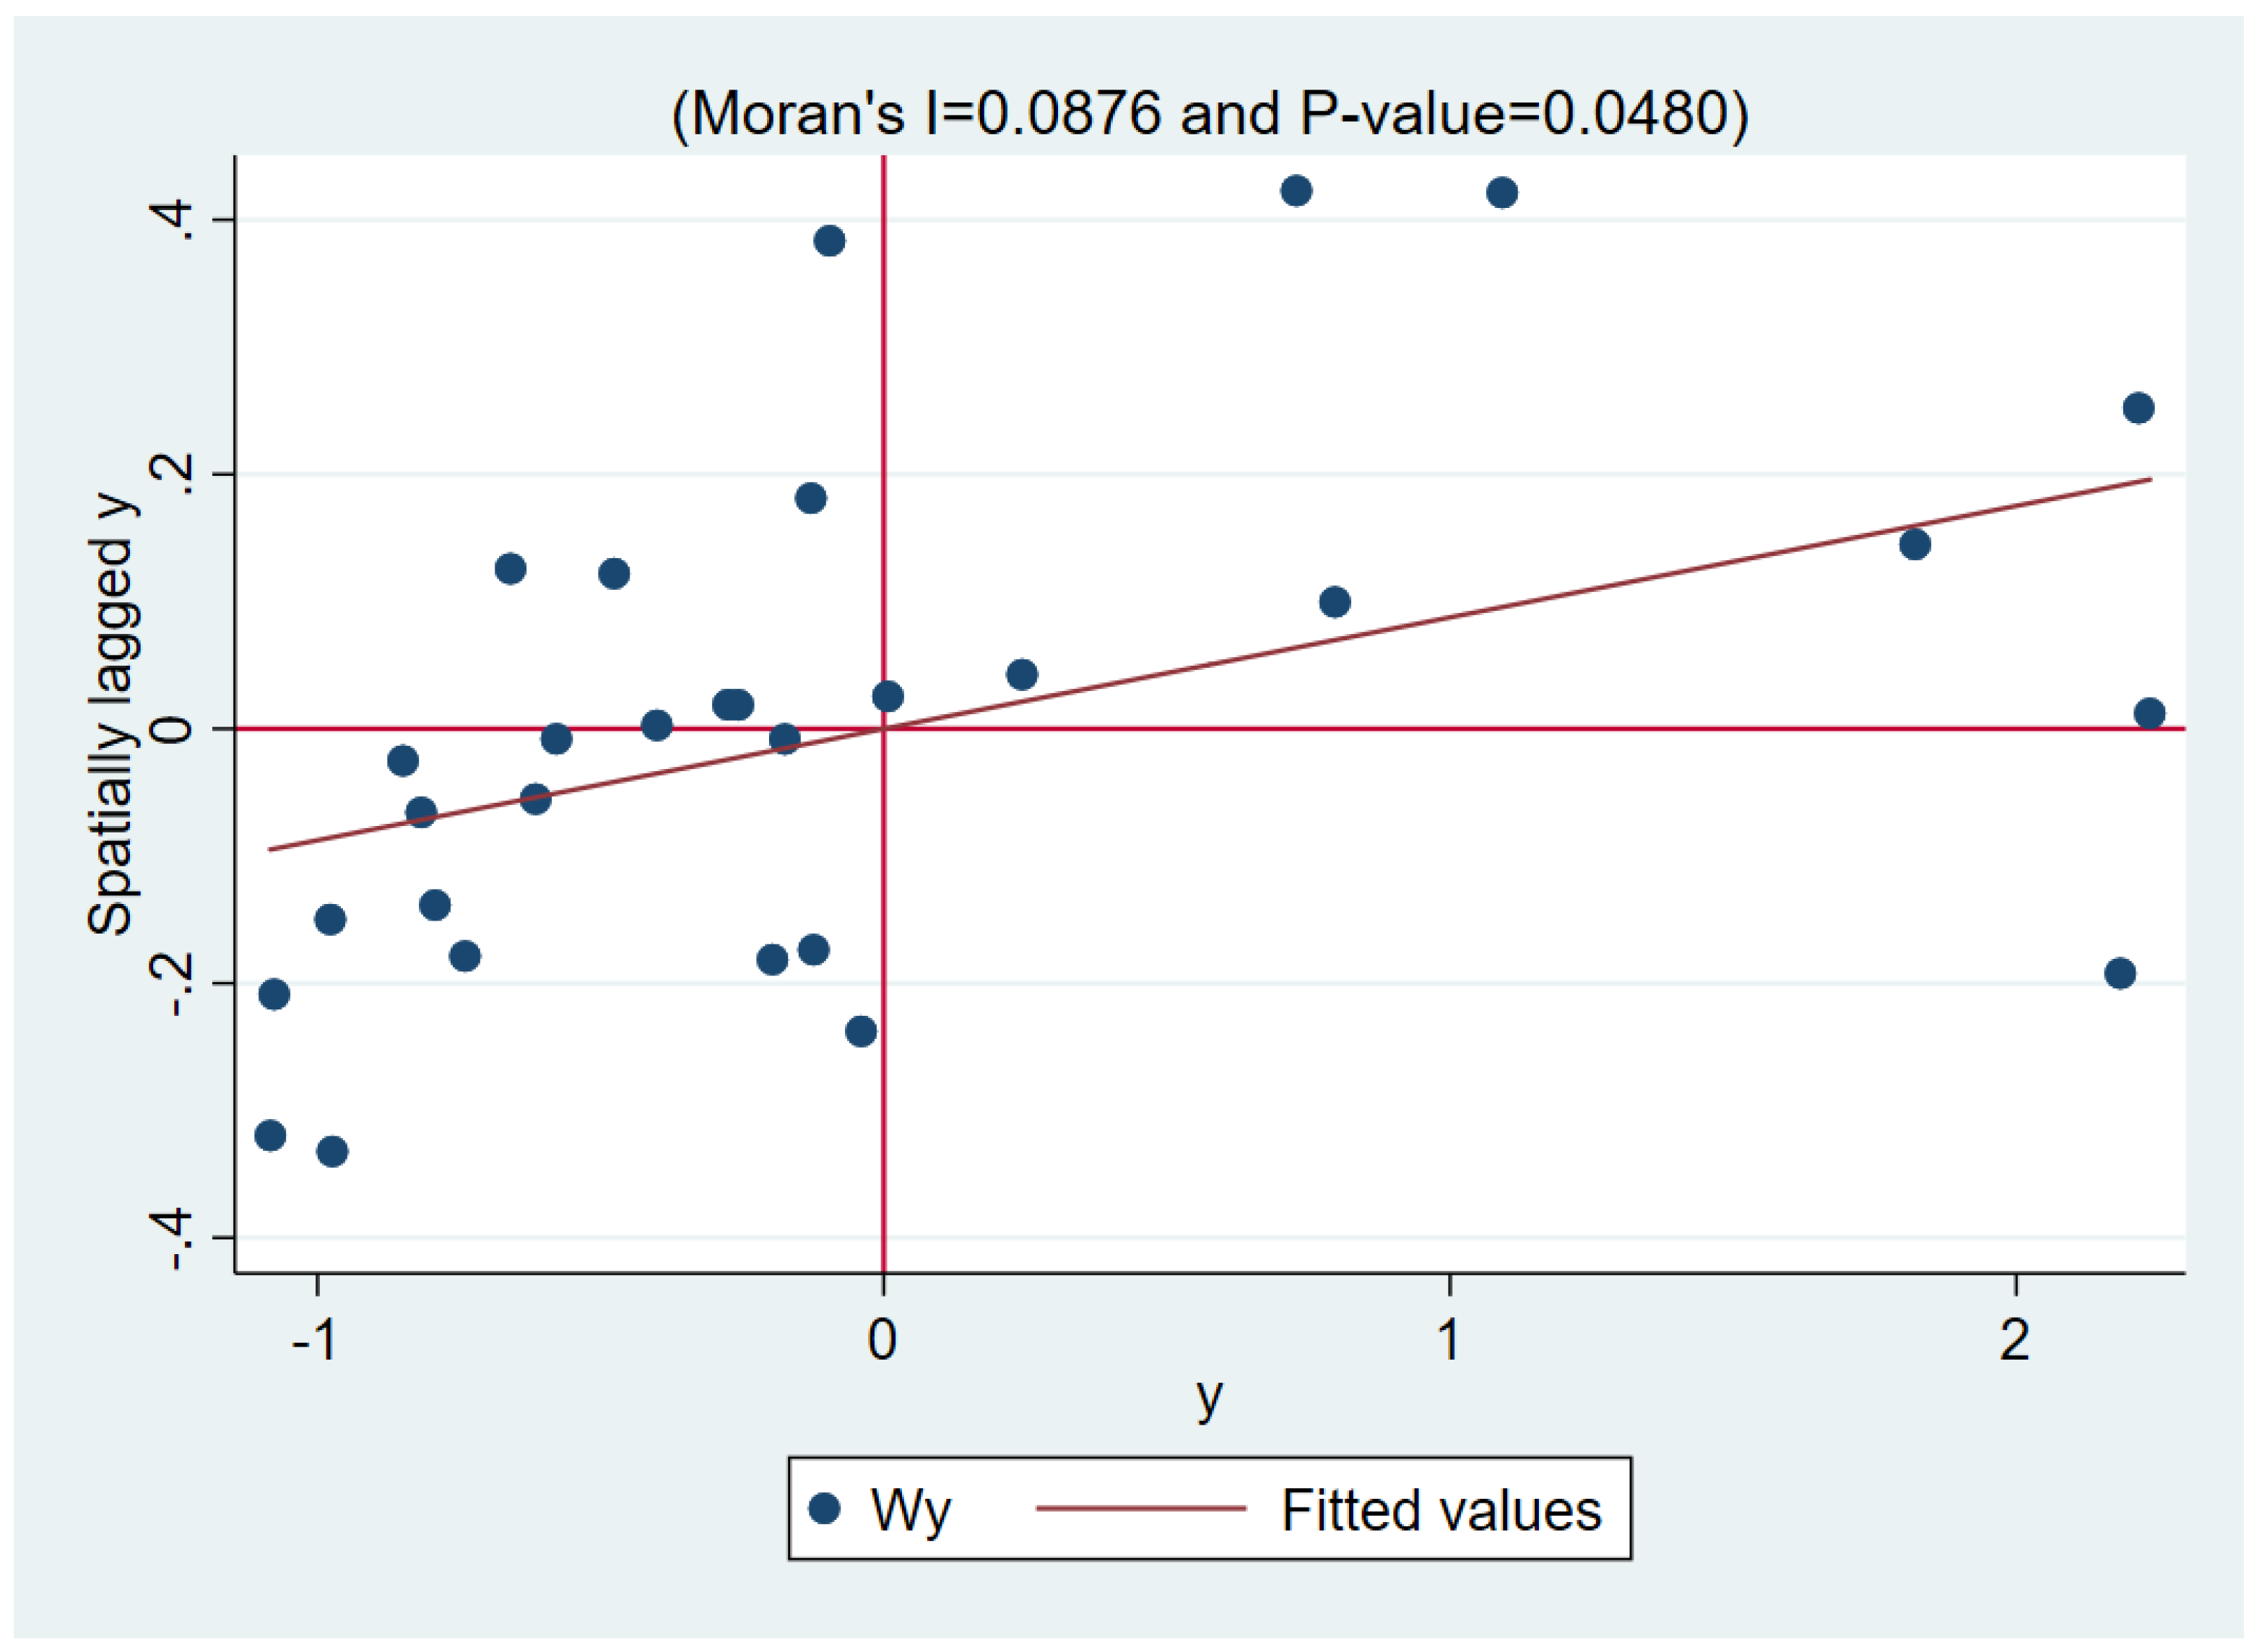
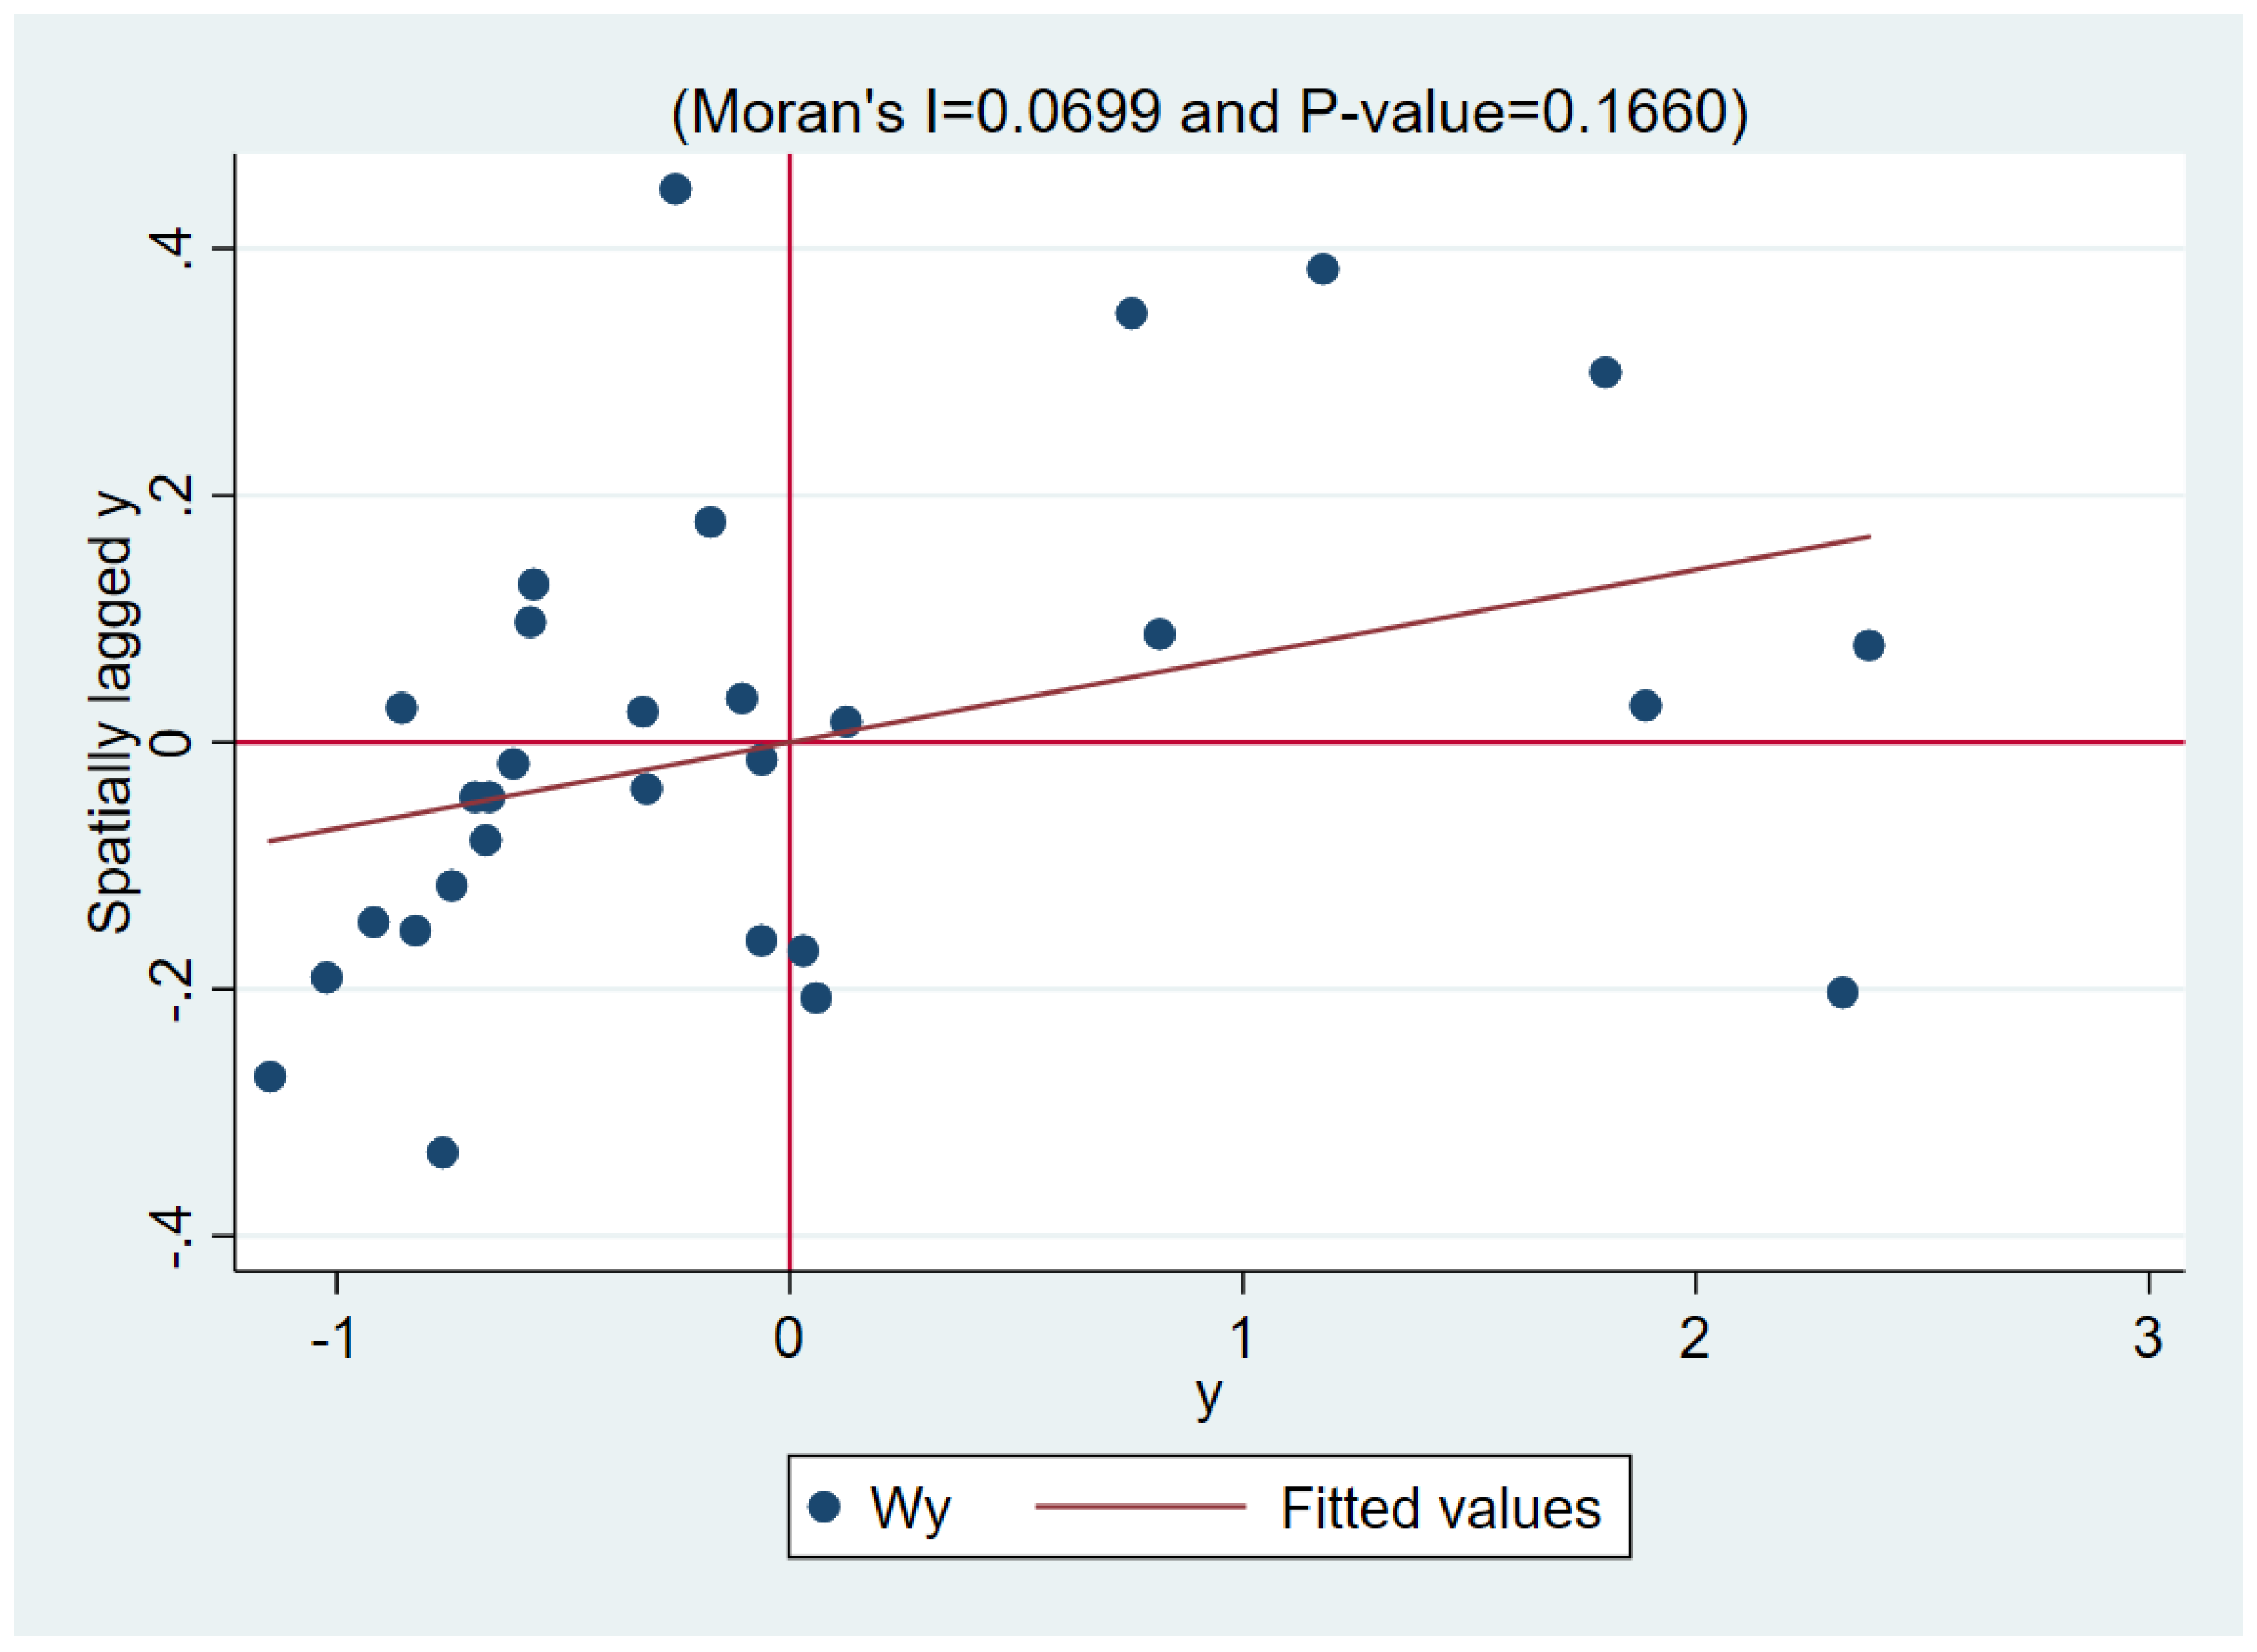
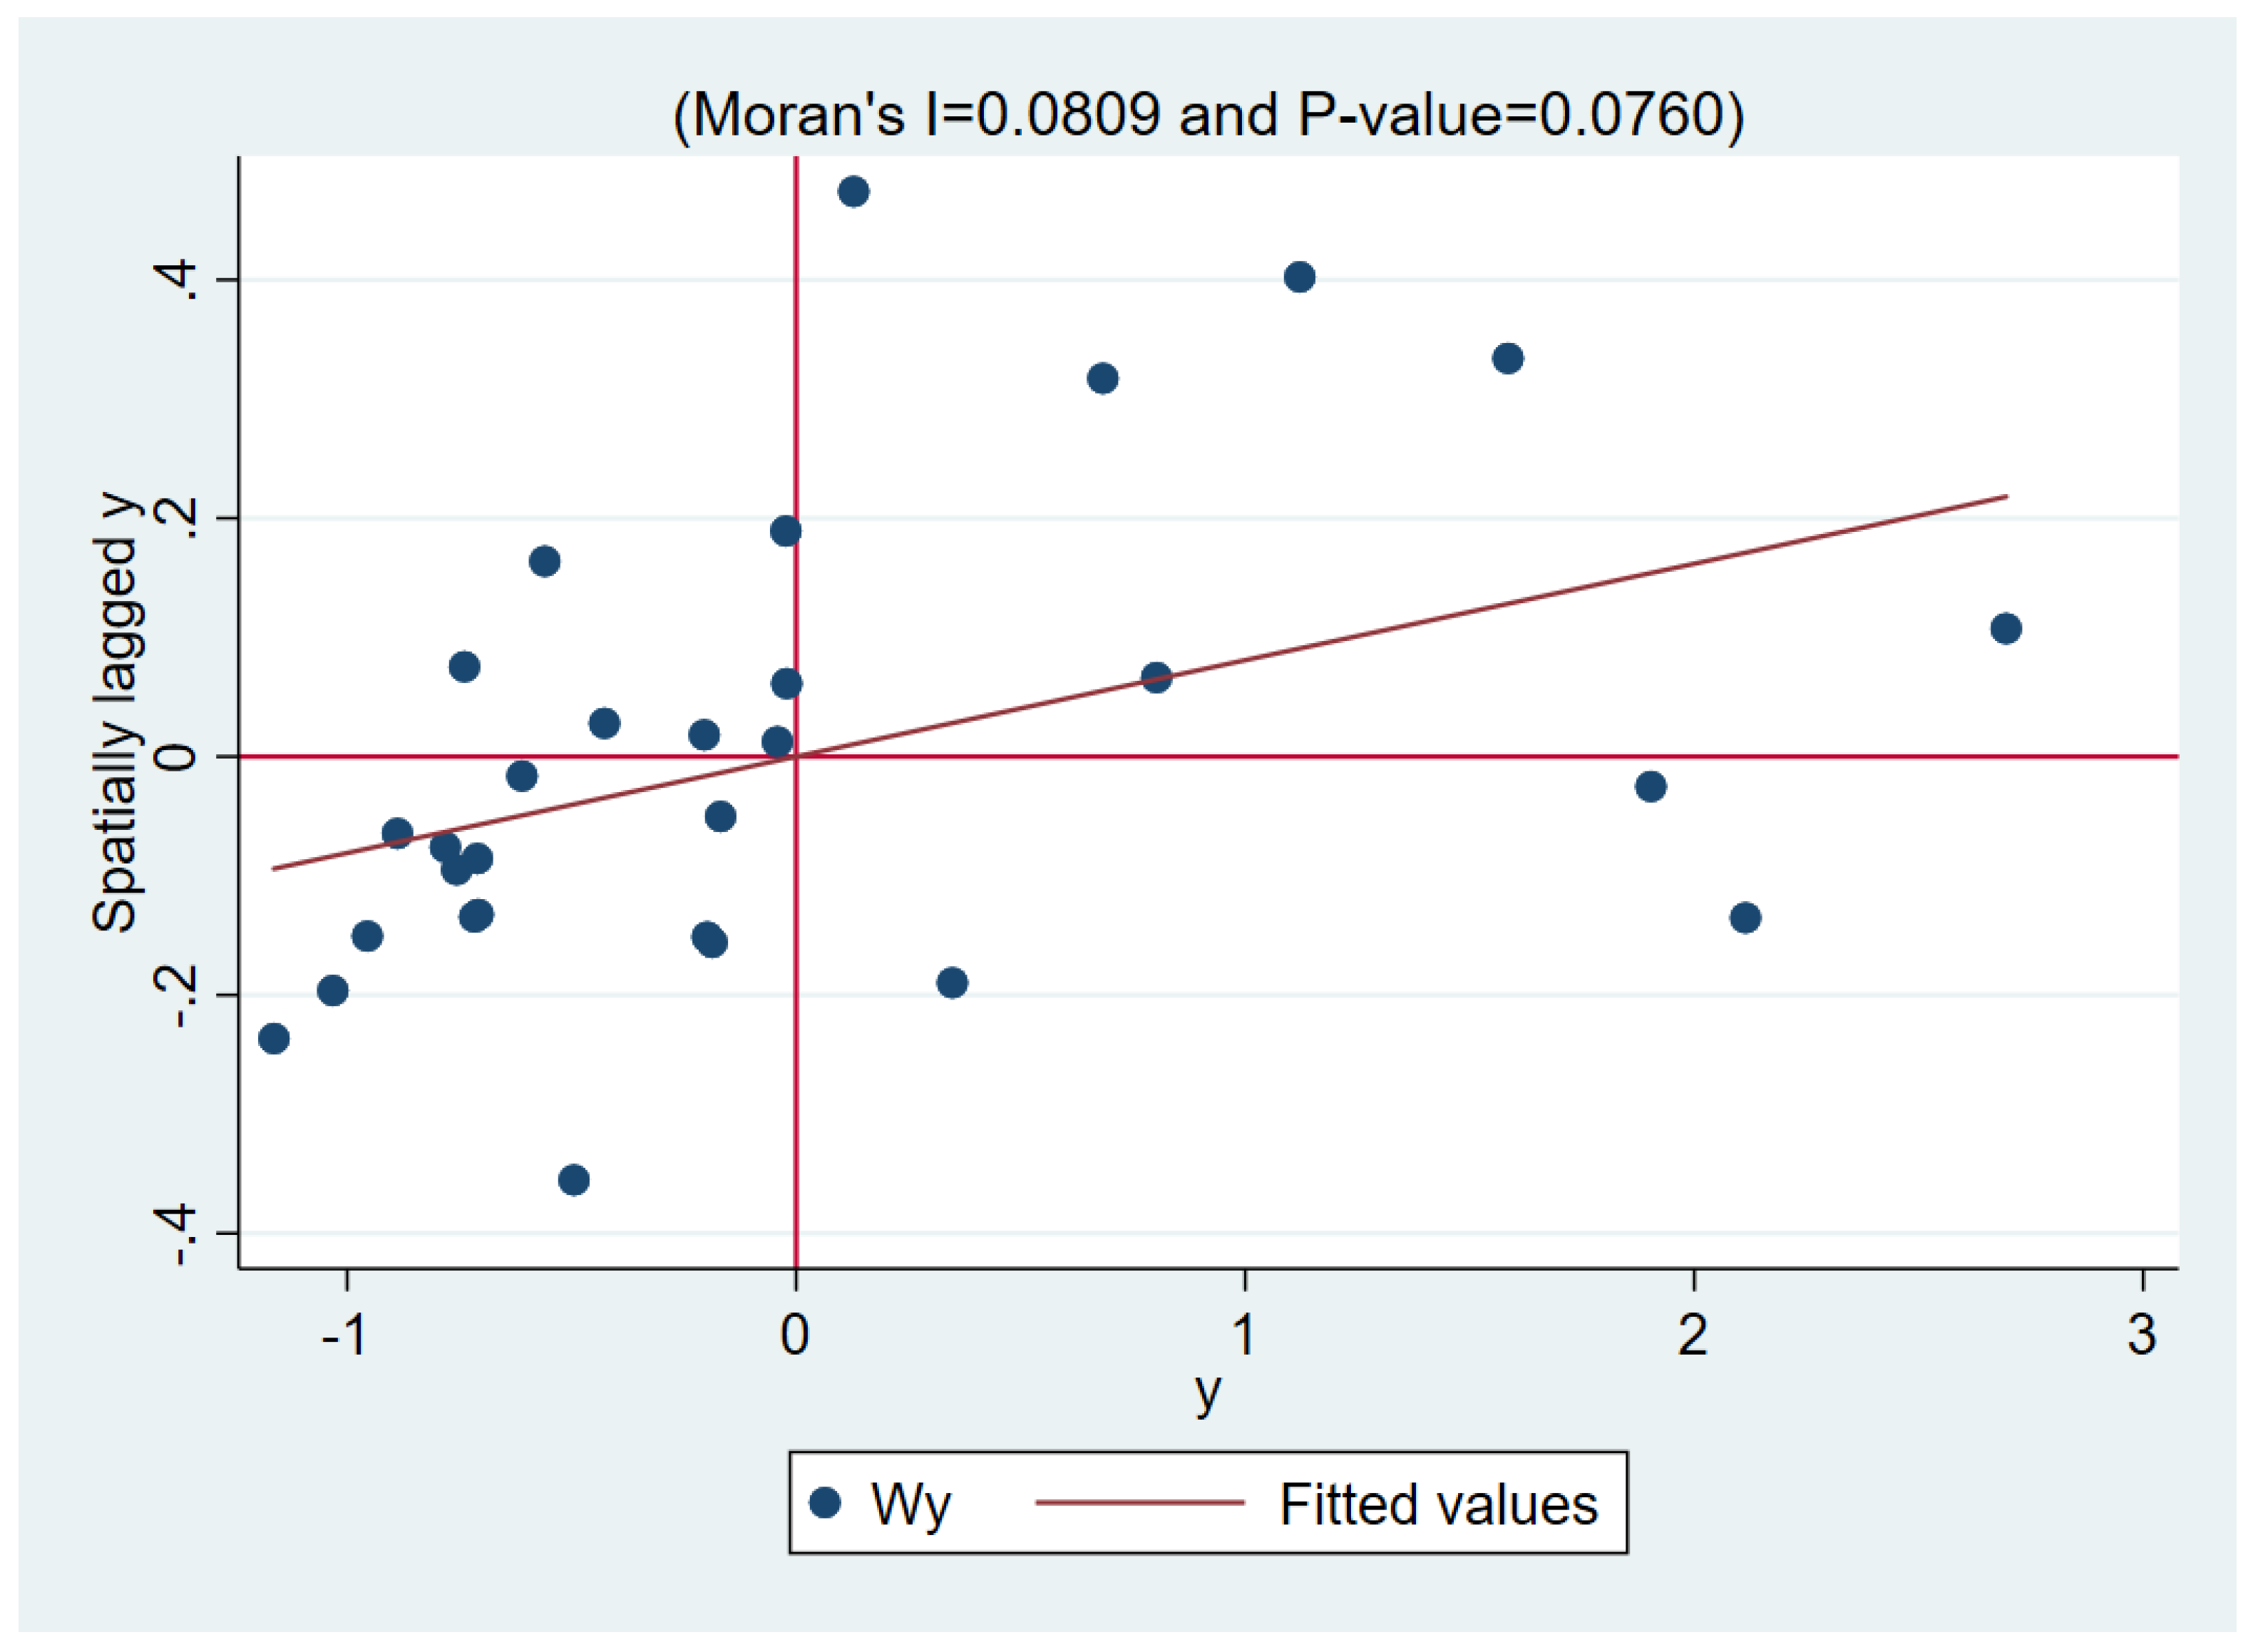
Table 3. Moran’s I index of regional S&T innovation ability from 2008 to 2017.
YearMoran’s IZpYearMoran’s IZp
20080.0893.4510.00120130.0763.1050.002
20090.0893.4480.00120140.0813.2540.001
20100.0753.0730.00220150.0632.7740.046
20110.0702.9240.00320160.0652.8040.005
20120.0873.4250.00121070.0532.4990.012
Table 4. Results of LM test.
TestStatisticdfp-Value
Spatial error:
Moran’s I68.69110.000
Lagrange multiplier4.19510.041
Robust Lagrange multiplier4.38410.036
Spatial lag:
Lagrange multiplier0.00410.018
Robust Lagrange multiplier0.19210.661
Table 5. Results of LR test.
HypothesisLikelihood-Ratio Testp-Value
SAR nested in SDM33.840.000
SEM nested in SDM32.770.000
Table 6. Regression results.
VariableSDM
(S&T Innovation Ability)
SLM
(S&T Innovation Ability)
SEM
(S&T Innovation Ability)
pol0.0690.1770.164
pgdp0.478 ***0.348 ***0.311 ***
market0.1290.2060.132
open0.107 ***0.132 *0.151 ***
hc−0.024−0.019−0.046
rdi0.281 ***0.216 ***0.234 ***
urb0.636 **0.512 **0.529 **
is0.481 *0.761 *0.908 *
rho0.887 ***0.568 ***
lambda 0.726 **
Note: *, ** and *** mean that the corresponding variables are significant at the level of 10%, 5% and 1%, respectively.
Table 7. Regression results of SDM based on the subregions.
VariablesEastern Region
(S&T Innovation Ability)
Central Region
(S&T Innovation Ability)
Western Region
(S&T Innovation Ability)
pol1.023 **0.8260.629
rho0.543 **0.486 **0.224
Control variablesControlledControlledControlled
Note: ** means that the corresponding variables are significant at the level of 5%.
Table 8. Direct and indirect effects of SDM.
VariableDirect Effect
(S&T Innovation Ability)
Indirect Effect (S&T Innovation Ability)Total Effect (S&T Innovation Ability)
Eastern regionpol1.046 **1.421 **2.467
Central regionpol0.4510.6531.104
Western regionpol0.6520.7111.363
Note: ** means that the corresponding variables are significant at the level of 5%.
Disclaimer/Publisher’s Note: The statements, opinions and data contained in all publications are solely those of the individual author(s) and contributor(s) and not of MDPI and/or the editor(s). MDPI and/or the editor(s) disclaim responsibility for any injury to people or property resulting from any ideas, methods, instructions or products referred to in the content.

