Article

Research on the Damage Diagnosis Model Algorithm of Cable-Stayed Bridges Based on Data Mining

1
State Key Laboratory of Mechanical Behavior and System Safety of Traffic Engineering Structures, Shijiazhuang Tiedao University, Shijiazhuang 050043, China
2
Hebei Key Laboratory of Diagnosis, Reconstruction and Anti-Disaster of Civil Engineering, Zhangjiakou 075000, China
3
Innovation Center for Wind Engineering and Wind Energy Technology of Hebei Province, Shijiazhuang 050043, China
4
School of Civil Engineering, Shijiazhuang Tiedao University, Shijiazhuang 050043, China
5
Hebei Innovation Center of Transportation Infrastructure in Cold Region, Zhangjiakou 075000, China
6
School of Traffic and Transportation, Shijiazhuang Tiedao University, Shijiazhuang 050043, China
*
Author to whom correspondence should be addressed.
Sustainability 2023, 15(3), 2347; https://doi.org/10.3390/su15032347
Submission received: 22 December 2022 / Revised: 20 January 2023 / Accepted: 25 January 2023 / Published: 27 January 2023

Abstract

:
To obtain an effective data mining method for cable-stayed bridge damage diagnosis, the algorithm of the cable-stayed bridge damage diagnosis model based on data mining was studied, and a data mining method is proposed. This method is oriented to the damage diagnosis of cable-stayed bridges. After algorithm comparison, the support vector machine (SVM) and limit gradient-boosting (XGBoost) algorithms, with advantages in damage location and quantification, are combined and optimized to obtain the damage diagnosis model for cable-stayed bridges. First, a refined benchmark finite element model is established by Abaqus, and postprocessing data such as vibration frequency and modal curvature are used as a data mining dataset. Second, feature se-lection is conducted, and the damage-sensitive modal curvature change rate index is selected as the feature of data mining. Next, the SVM and XGBoost algorithms are optimized by grid and random search, and the optimized SVM and XGBoost algorithms are used to locate and quantify the damage. Finally, the damage diagnosis model for cable-stayed bridges is obtained. Taking a cable-stayed bridge as an example, the proposed method is applied and analyzed, and the results show the effectiveness of the proposed method.

1. Introduction

Cable-stayed bridges will inevitably be damaged due to the influence of environmental factors in their use process. It is of great significance to use health monitoring systems to diagnose the health status of cable-stayed bridges [1]. These systems will collect the dynamic response data of cable-stayed bridges in the monitoring process. How to make full use of and mine the structural information contained in these data and then diagnose the damage to cable-stayed bridges has become a research hotspot [2]. Data mining can comprehensively use the ideas of statistics, machine learning algorithms, pattern recognition and modelling technology, and has the characteristics of strong computing power, highly automated analysis and mining of the hidden relationships between data [3,4,5]. Therefore, to fully understand the structural state of cable-stayed bridges and identify possible damage so that the monitoring staff can formulate correct and effective maintenance strategies first time and reduce casualties and property losses, it is of great significance to carry out research on the algorithm of the damage diagnosis model for cable-stayed bridges based on data mining.
At present, among data mining algorithms, the support vector machine (SVM) algorithm has excellent ability to solve the problem of small samples, nonlinear dataset classification [6]. The XGBoost algorithm has the characteristics of high operation efficiency and high accuracy [7] and is favored by experts and scholars. For example, Zhao Yunpeng et al. [8] took the modal flexibility difference curvature as the damage identification index to achieve damage identification for specially shaped bridges. Zhang Jianqun et al. [9] proposed the fault diagnosis method, combining the optimized support vector data description (SVDD) and support vector machine (SVM) to realize fault diagnosis of rotating machinery. Pinghe et al. [10] obtained the damage location of continuous beam bridges through the SVM algorithm based on the advantage that modal curvature is sensitive to local damage and the normalized curvature difference change rate as an indicator. Liu Zejia et al. [11] used the dynamic and static responses of the structure to form SRV as the input vector and the SVM algorithm to carry out damage diagnosis. Wang Guilan et al. [12] used the XGBoost algorithm to predict fan main bearing failure. Li Ya et al. [13] achieved the evaluation of tool wear under multiple working conditions. Huang Xiaogou et al. [14] used the XGBoost algorithm to obtain damage identification for long-span bridge girders. Ling Dan et al. [15] proposed the fault detection and identification method for the furnace negative pressure system based on canonical variable analysis (CVA) and XGBoost, which used CVA to reduce the data redundancy and construct regular residuals, and used the constructed typical residual variables to construct the fault monitoring model based on XGBoost. The damage diagnosis of cable-stayed bridges can be divided into two steps: damage location and damage quantification. Fu Chunyu et al. [16] used two different SVM algorithms to locate and quantify damage and successfully applied them to the damage diagnosis of a continuous beam bridge.
The literature shows that the problems of damage location and quantification can be attributed to classification and regression problems, respectively, in machine learning. The XGBoost and SVM algorithms both have classification and regression models. The SVM algorithm is a supervised machine learning algorithm that can perform classification and regression analysis. It has great advantages in solving problems when the sample set is small [6]. The biggest advantage of the SVM algorithm in solving classification problems is to construct the decision boundary with the largest spacing in high-dimensional space to improve its ability to solve problems with small samples and nonlinear datasets. The XGBoost algorithm adopts a gradient lifting strategy for regression analysis. Each iteration fits the residual of the previous tree rather than the approximate value of the residual, so its accuracy is high. The disadvantage of the SVM algorithm is that the precision of regression analysis is lower than that of the XGBoost algorithm, and the disadvantage of the XGBoost algorithm is that the running time of classification analysis is longer than that of the SVM algorithm.
In view of the above characteristics of the SVM and XGBoost algorithms, if the two algorithms are combined, first using the classification analysis of the SVM algorithm to locate the damage to cable-stayed bridges and then using the XGBoost algorithm to quantify the damage, the advantages of the two algorithms can be brought into full play, and the efficiency of damage diagnosis can be improved. However, at present, the damage diagnosis of bridges mostly uses a class of machine learning algorithms. There is no method of damage diagnosis for cable-stayed bridges combining these two algorithms to give full play to their advantages and compensate for their shortcomings.
For this reason, this paper proposes a data mining damage diagnosis method based on the combination and optimization of SVM and XGBoost for the damage diagnosis of cable-stayed bridges. This method obtains the data mining dataset by processing the data of the finite element simulation model, selects grid and random search to optimize the two algorithms of SVM and XGBoost, mines the dataset with the optimized two algorithms, obtains the damage diagnosis model of the cable-stayed bridge, and applies and verifies the proposed method in combination with the cable-stayed bridge example and the actual cable-stayed bridge data.

2. Data Mining Algorithm for Damage Diagnosis of Cable-Stayed Bridges

Data mining includes machine learning algorithms, modelling technology, pattern recognition, and other ideas in many fields. Damage diagnosis of cable-stayed bridges is a pattern recognition problem [17]. Damage diagnosis of cable-stayed bridges based on data mining is a process of deducing the cause from the result. During damage diagnosis, a machine learning algorithm is used to learn the known damage dataset, automatically find and extract the rules between the input and output of the dataset, and build a damage diagnosis model according to the extracted rules, which can predict some unknown datasets.

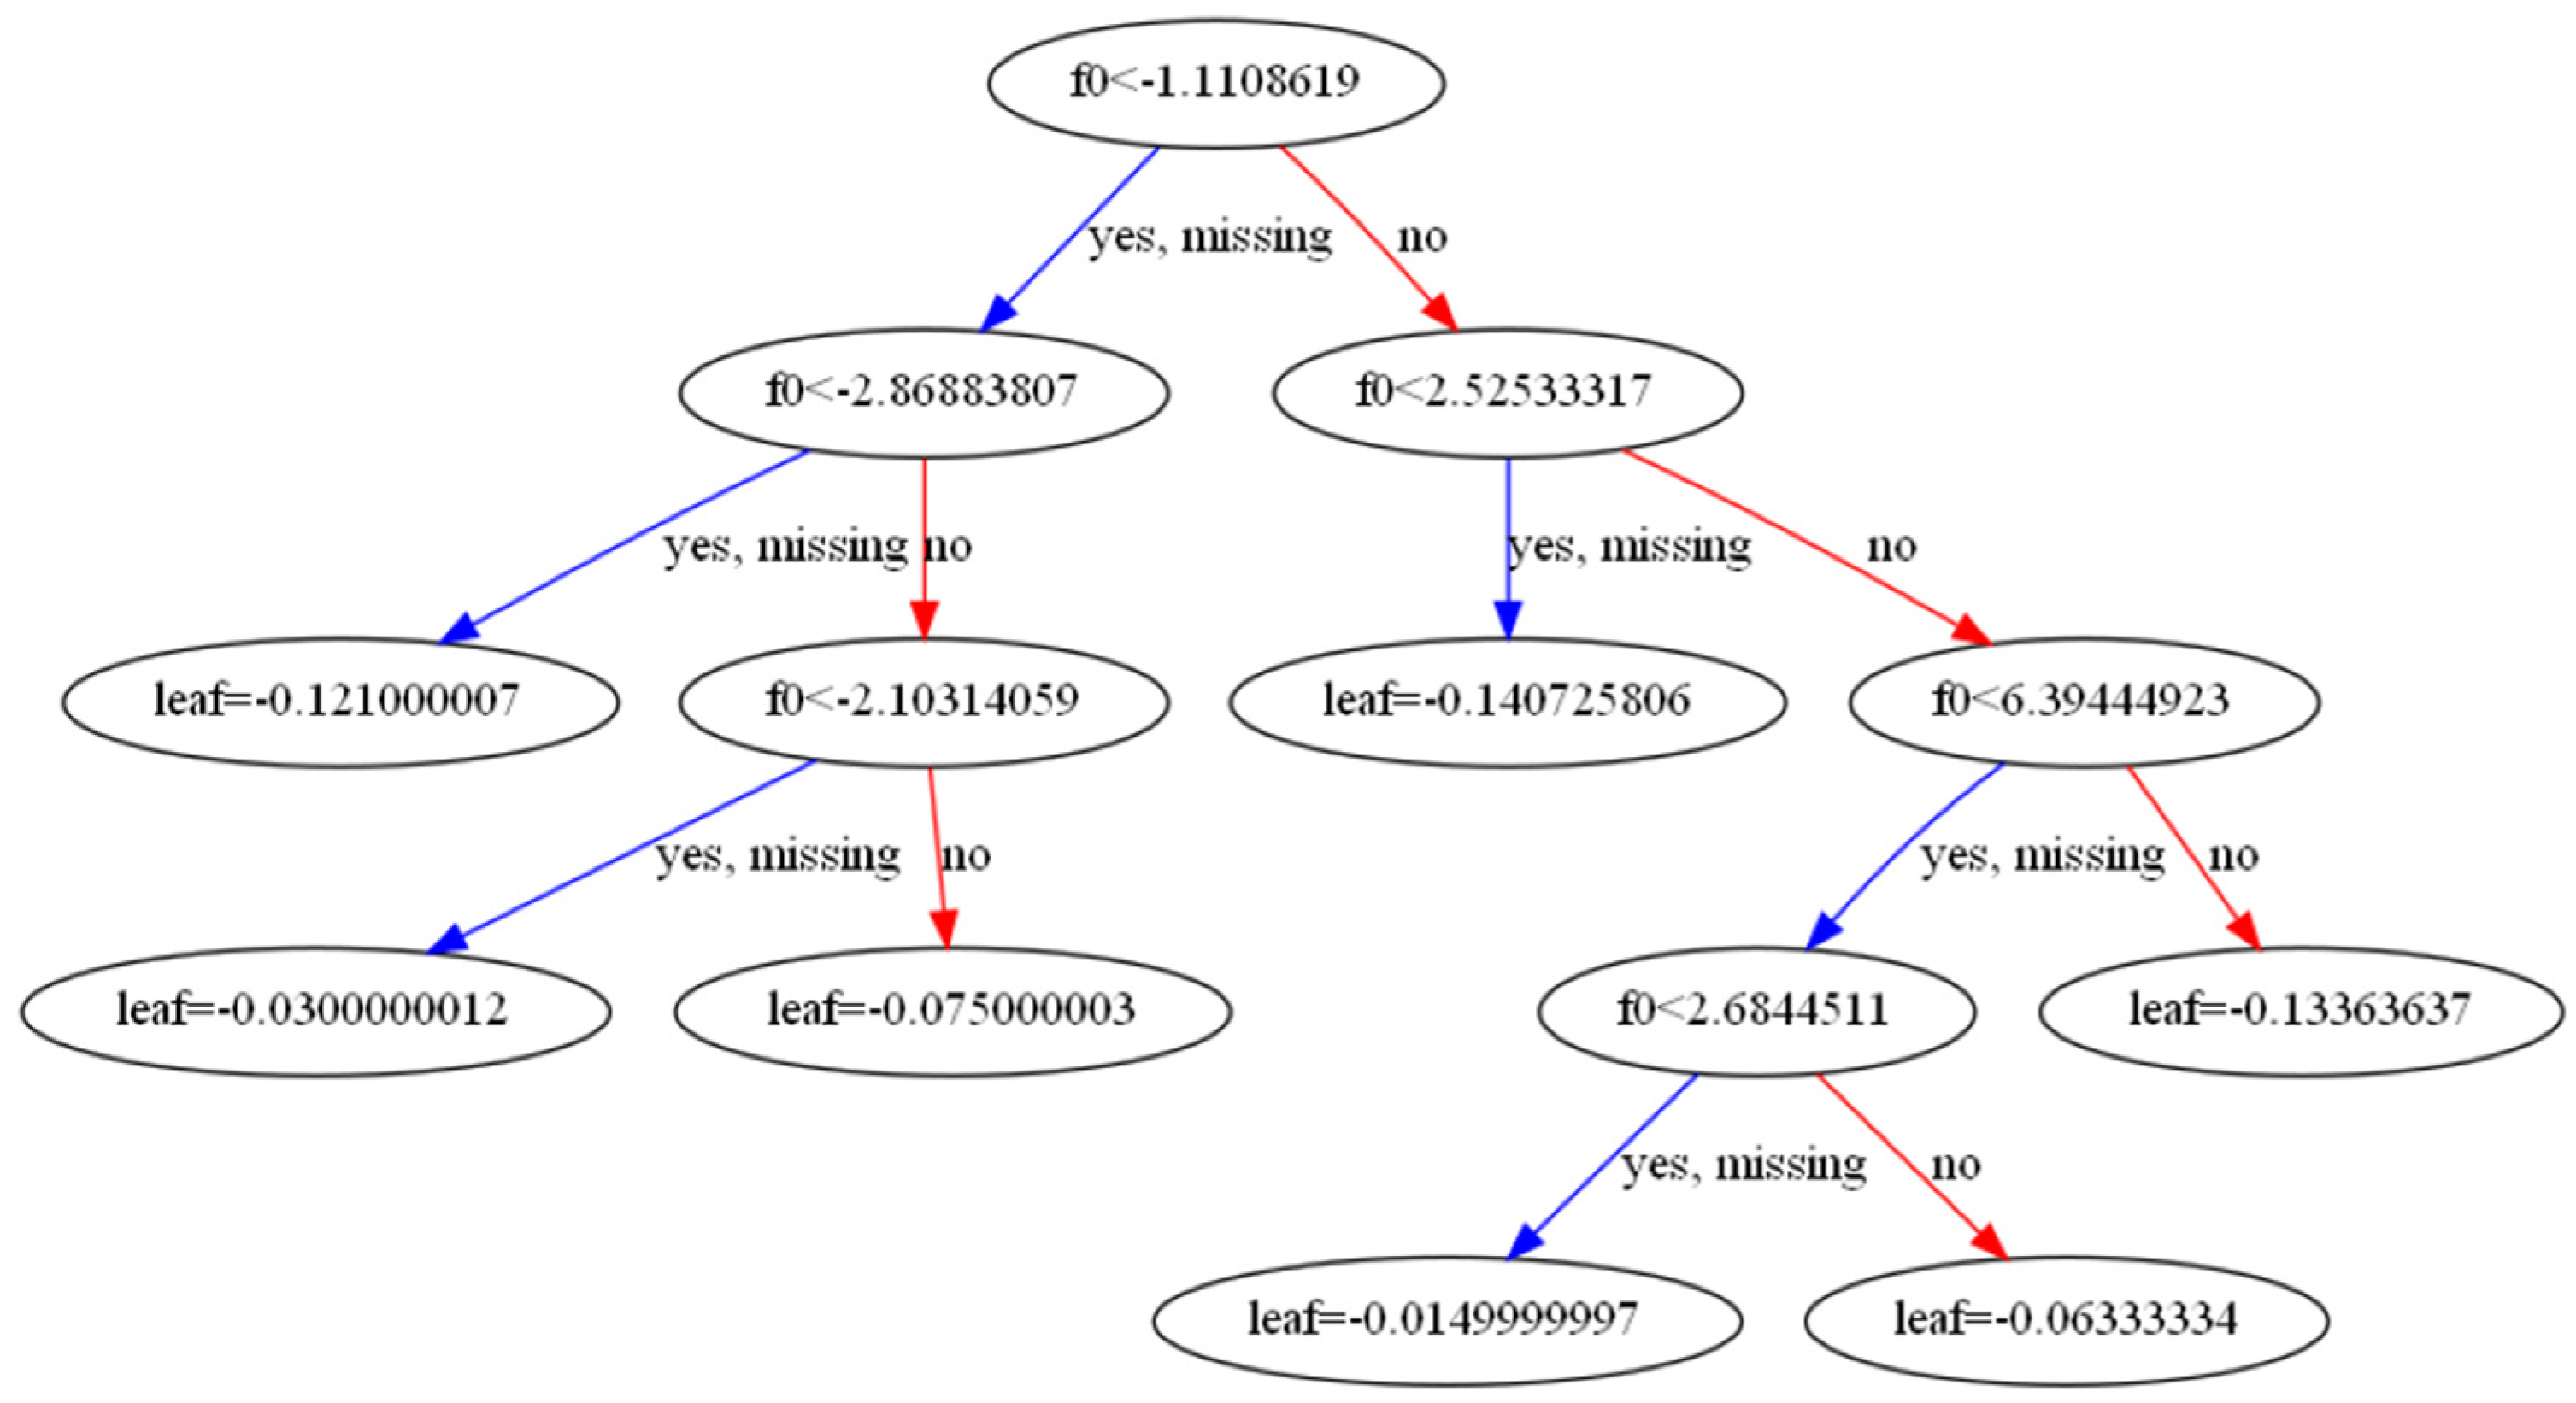
2.1. Damage Location Using the SVM Algorithm

When using the SVM algorithm to locate damage, suppose that the dataset of the cable-stayed bridge is X = ( x 1 , x 2 , x 3 , , x i | y i ) , (I = 1,2,30… m), where x i is the ith input vector, y i is the damage location identification quantity, and m represents the number of input samples. The SVM algorithm classifies the points in the samples by constructing a separation line, which is the separation hyperplane in high-dimensional space.
The closest point to the separator in the dataset is A, and the distance from A to the separator is d. SVM finds a separator hyperplane and maximizes d. The general vector formula for separating hyperplanes in high-dimensional space is w T A + b = 0 , and the distance from a point to the separating hyperplane is:
d = w T A + b w
where w represents the weight vector; w is the regularization norm of vector w; and b is the threshold value.
The high-dimensional space equation passing through point A is w T A + b = 1 , then d = 1 w . At the same time, the separating hyperplane must meet certain constraints:
  y i f x i = y i w T x i + b 1 , i = 1 , 2 , 3 .. m
where y (i) represents the category of the input sample.
Solving the SVM algorithm obtains the maximum value of 1 w under the constraint conditions. In the damage location of cable-stayed bridges, the dataset X is divided into two categories by separating the hyperplane: one is the damaged location, and the other is the undamaged location.

2.2. Damage Quantification Using the XGBoost Algorithm

When using the XGBoost algorithm to quantify damage, there are m training data {( x 1 , y 1 ), ( x 2 , y 2 )…( x m , y m )}, the XGBoost algorithm has k trees { f 1 , f 2 , , f k } F ∈ F, where x m is the m-th input vector, y m is the quantitative identification quantity of the m-th damage, f k is a function in function space F, and F is a set of all possible regression trees. The XGBoost algorithm trains a single regression tree to obtain the residual between the predicted value and the actual value and then continuously adds a regression tree for iterative fitting. The regression tree model generated by each iteration fits the predicted residual of the previous tree. This process is repeated to continuously reduce the residual of the previous model and build a damage quantitative model that is close to the complexity of the data. The learning process of the XGBoost algorithm for the damage diagnosis dataset is as follows:
y h 0 = 0
y h 1 = f 1 x h = y h 0 + f 1 x h
y h t = f 1 x h + f 2 x h + f 3 x h + + f t x h = y h t 1 + f t x h
where y h t is the predicted value of the th damage sample after iteration t, t is the number of iteration steps, x h is the h-th sample, and f t x h is the result value of the t-th weak learner. When the XGBoost algorithm is used to quantify the damage, the damage diagnosis dataset of cable-stayed bridges is fitted by Equation (3). The damage degree is the result of the superposition of each tree.

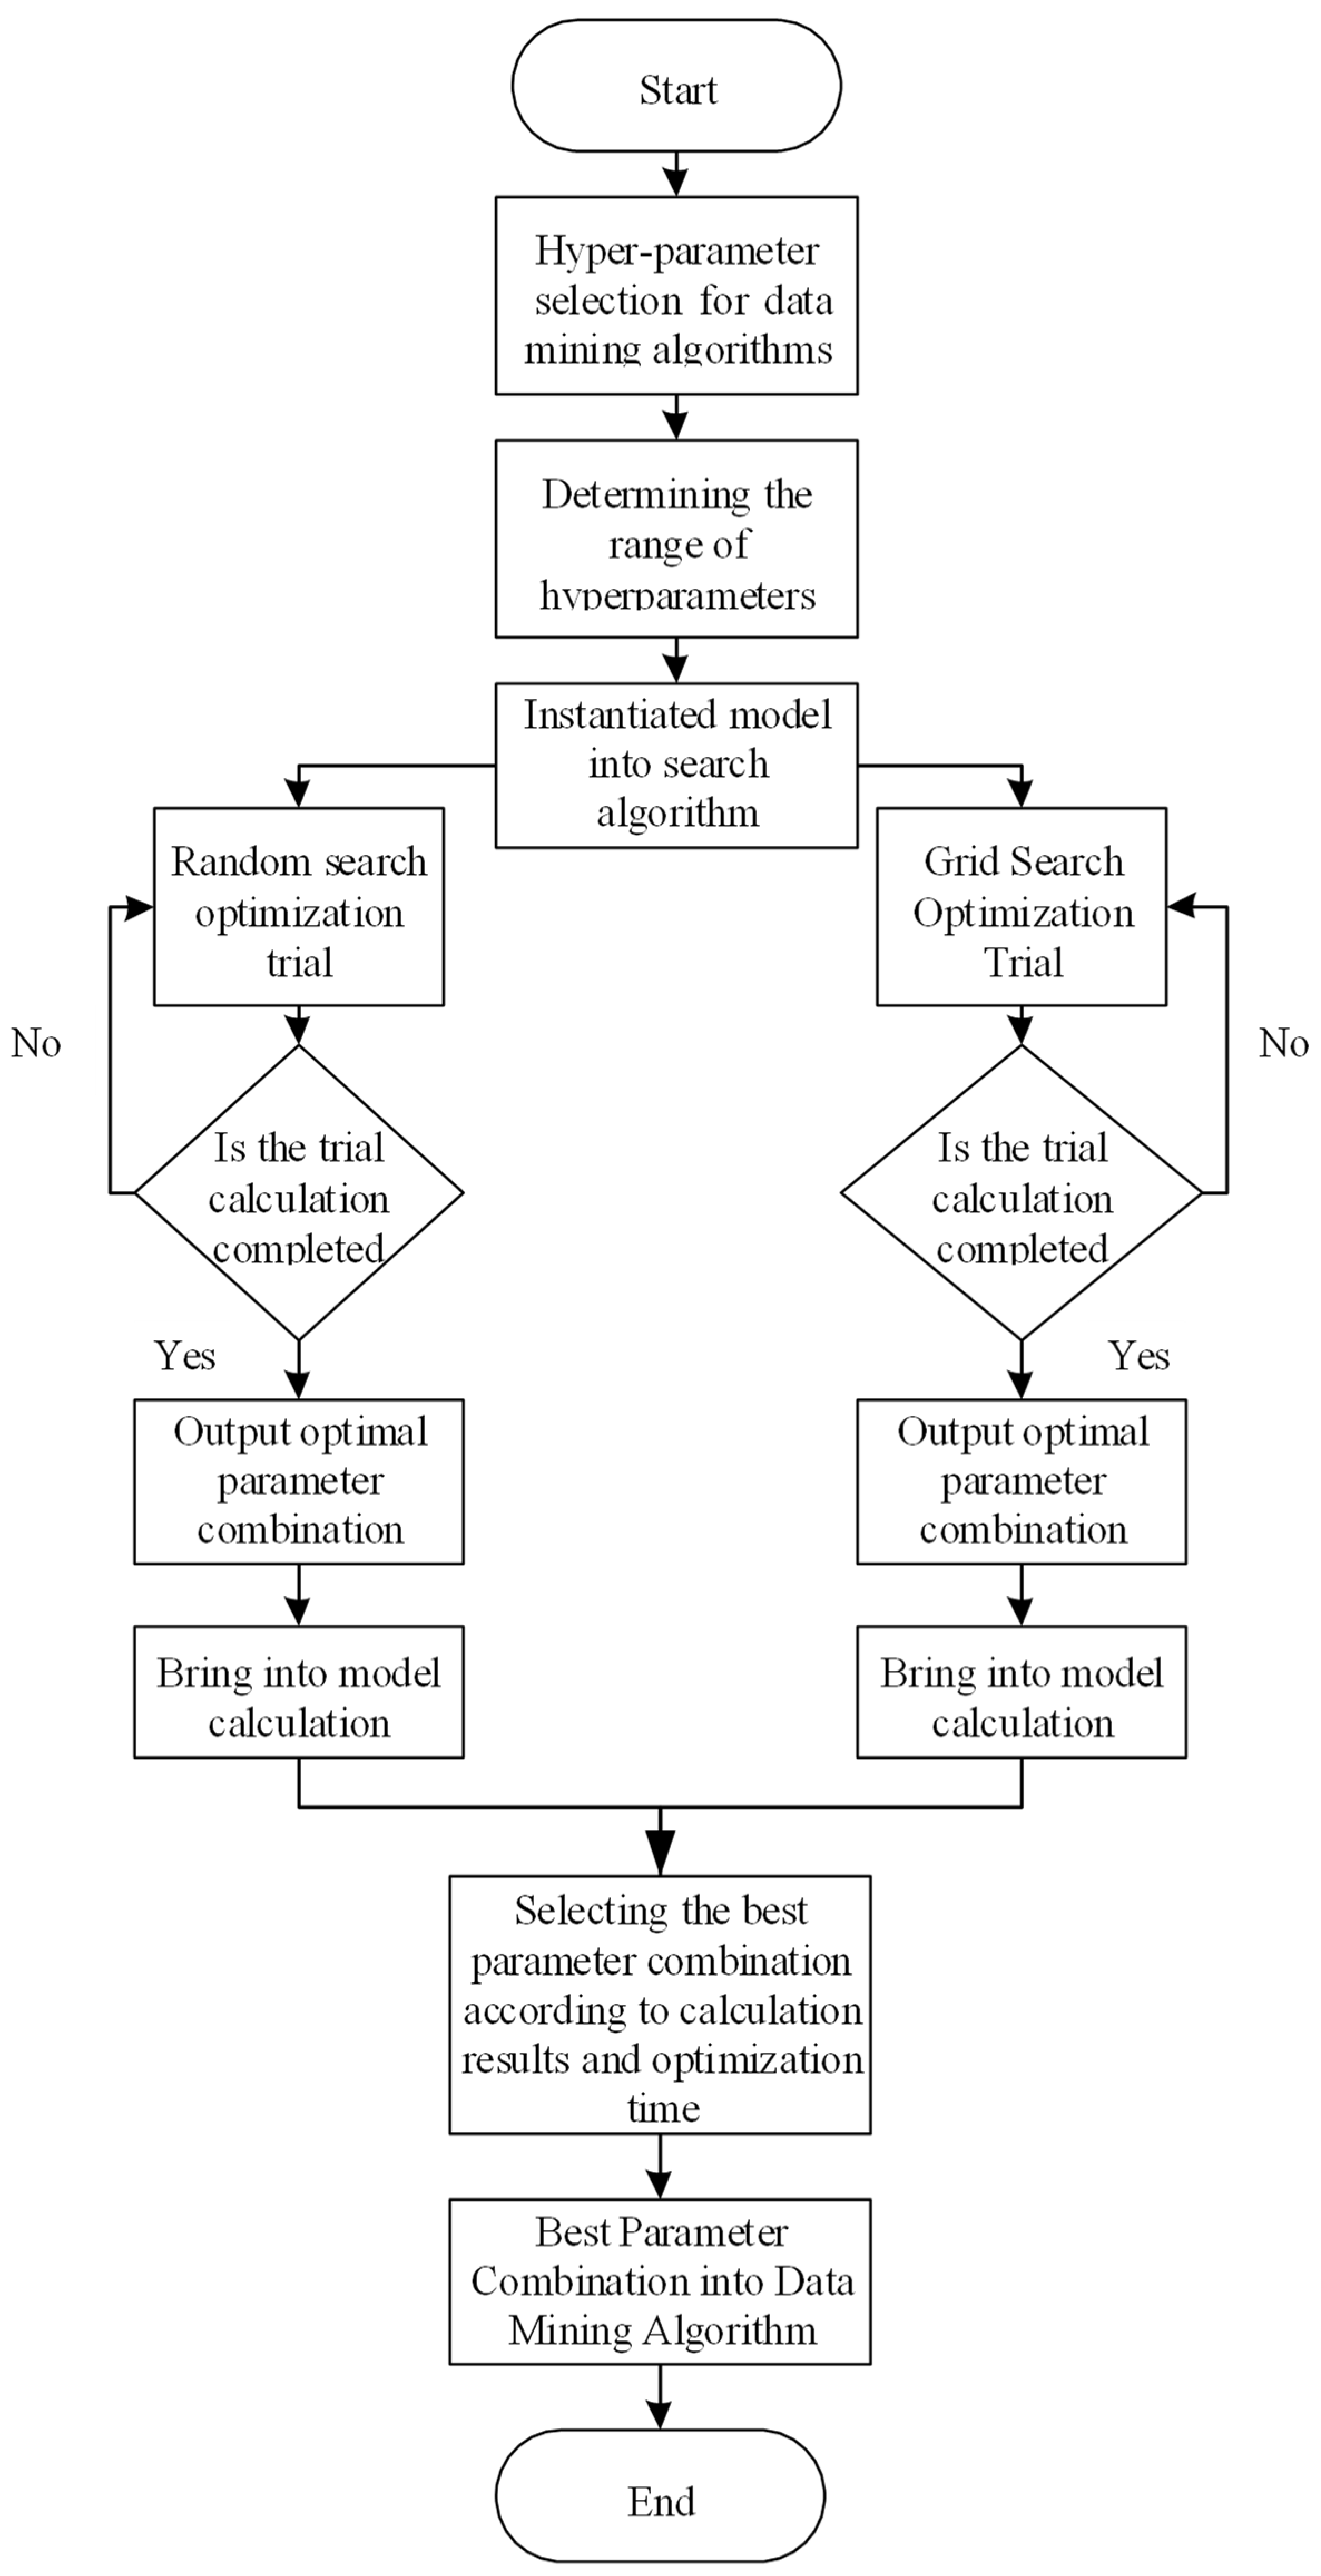
3. Performance Optimization of Data Mining Algorithms

3.1. The Optimization Method

The grid search method (GSM) [18] and randomized search method (RSM) [19] mainly use their automatic search capabilities to optimize the superparameter combination of the SVM and XGBoost algorithms. The optimization principles of the two search algorithms are as follows: GSM divides the search area into grids, combines the superparameters according to the grid division, traverses all the superparameter combinations, and outputs the optimal parameter combination selected by grid search after the completion of the traversal; RSM conducts equal-probability random sampling combination within the range of values. The number of samples is determined by the number of seeds (n_iter), and then the selected parameter combination is trial-calculated. After the trial calculation is completed, the optimal parameter combination selected by random search is outputted.

3.2. The Optimization Implementation

When using GMS and RSM to optimize the data mining algorithm, first, because the XGBoost and SVM algorithms have many superparameters, all optimizations will increase the computer memory challenges and greatly increase the optimization time. For the XGBoost algorithm, the following four main parameters are selected for optimization: the number of trees (n_estimators), the maximum depth of the tree (max_depth), the minimum leaf node sample weight (min_child_weight) and the step size (learning_rate). For the SVM algorithm, the following three main parameters are selected for optimization: penalty coefficient (C), kernel function parameter (gamma), and damage function (epsilon). Second, the value range of the selected superparameter is determined according to its own characteristics. Next, the instantiation model of the SVM and XGBoost algorithms is established, and the selected superparameter combination is applied to the instantiation model using the search algorithm for trial calculation. After the trial calculation, the best superparameter combination is selected according to the output results of the model and the optimization time. Finally, the selected superparameter combination is brought into the algorithm. The algorithm optimization process is shown in Figure 1.

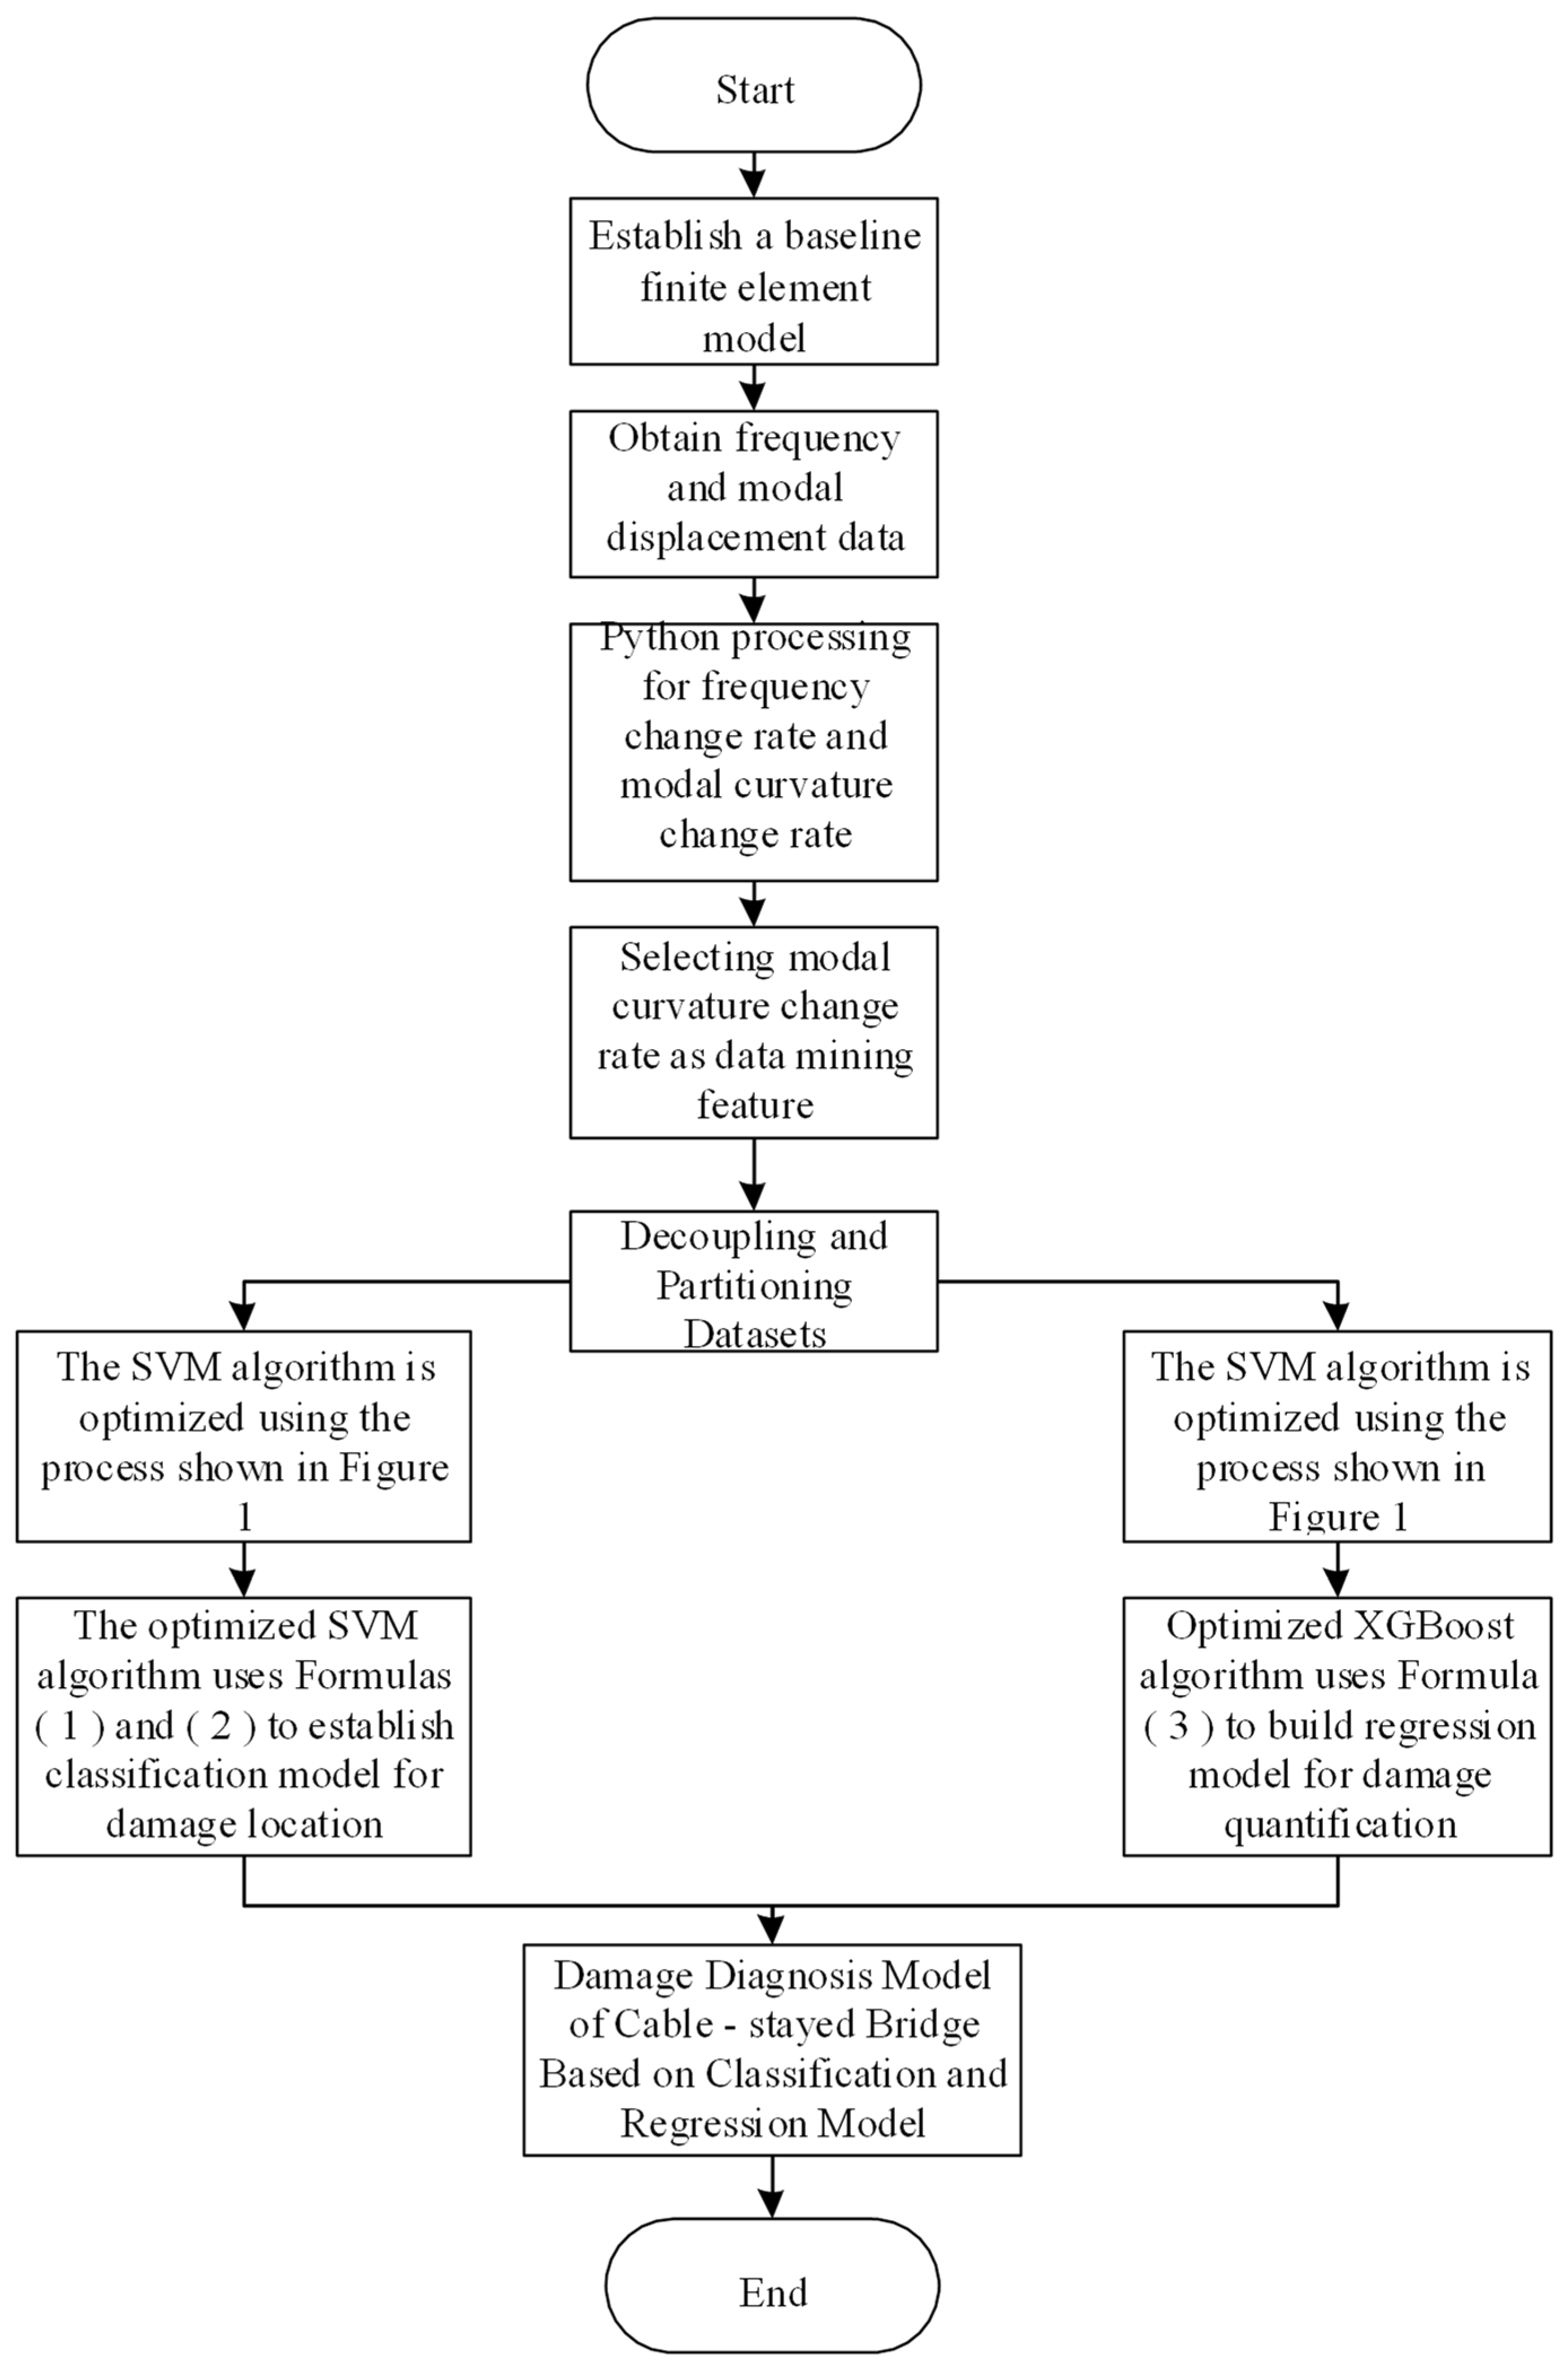
4. Attainment and Application of the Damage Diagnosis Model

4.1. Implementation Process for the Damage Diagnosis Model

The attainment process for the damage diagnosis model of cable-stayed bridges is as follows:
(1) Establish a basic finite element model of cable-stayed bridges for dynamic analysis, collect vibration response signals such as vibration frequency and modal displacement, and process the vibration signals to obtain frequency change rate and modal curvature change rate indicators;
(2) Because each index has a different sensitivity to damage, there are some indices that are not sensitive to local damage. The index of the modal curvature change rate that is sensitive to damage is selected as the feature of data mining and is made into a dataset and divided into a test set and training set;
(3) The change rate of the modal curvature and the health state of the bridge structure are taken as the input and output of the SVM algorithm, respectively. The flow in Figure 1 is used to improve the performance of the SVM algorithm. The optimized SVM algorithm determines the rule between input and output by solving the training set with Equations (1) and (2). According to this rule, a support vector machine classification (SVC) model is established, and the damage location is determined using this model.
(4) In damage quantification, the change rate of the modal curvature and the damage degree of the bridge structure are taken as the input and output of the XGBoost algorithm. The flow chart in Figure 1 is used to improve the performance of the XGBoost algorithm. The optimized XGBoost algorithm uses Equation (3) to fit the training set to determine the rule between input and output. According to this rule, an XGBRegressor model is established and used to determine the degree of damage.
(5) The damage diagnosis model of cable-stayed bridges is established by combining the models trained in steps 3–4.
The implementation process of the damage diagnosis model of cable-stayed bridges is shown in Figure 2, and the codes limited to space are as follows:
Attainment of the damage diagnosis model of cable-stayed bridges is as follows:
(1) Establish a basic finite element model of cable-stayed bridges for dynamic analysis, collect vibration response signals such as vibration frequency and modal displacement, and process the vibration signals to obtain frequency change rate and modal curvature change rate indicators;
(2) Because each index has different sensitivity to damage, there are some indices that are not sensitive to local damage. The index of the modal curvature change rate that is sensitive to damage is selected as the feature of data mining and made into a dataset and divided into a test set and training set;
(3) The change rate of the modal curvature and the health state of the bridge structure are taken as the input and output of the SVM algorithm, respectively. The flow chart in Figure 1 is used to improve the performance of the SVM algorithm. The optimized SVM algorithm determines the rule between input and output by solving the training set with Equations (1) and (2). According to this rule, a support vector machine classification (SVC) model is established, and the damage location is determined using this model.
(4) In damage quantification, the change rate of the modal curvature and the damage degree of the bridge structure are taken as the input and output of the XGBoost algorithm. The flow chart in Figure 1 is used to improve the performance of the XGBoost algorithm. The optimized XGBoost algorithm uses Equation (3) to fit the training set to determine the rule between input and output. According to this rule, an XGBRegressor model is established and used to determine the degree of damage.
(5) The damage diagnosis model of cable-stayed bridges is established by combining the models trained in steps 3–4.
The implementation process of the damage diagnosis model of cable-stayed bridges is shown in Figure 2.

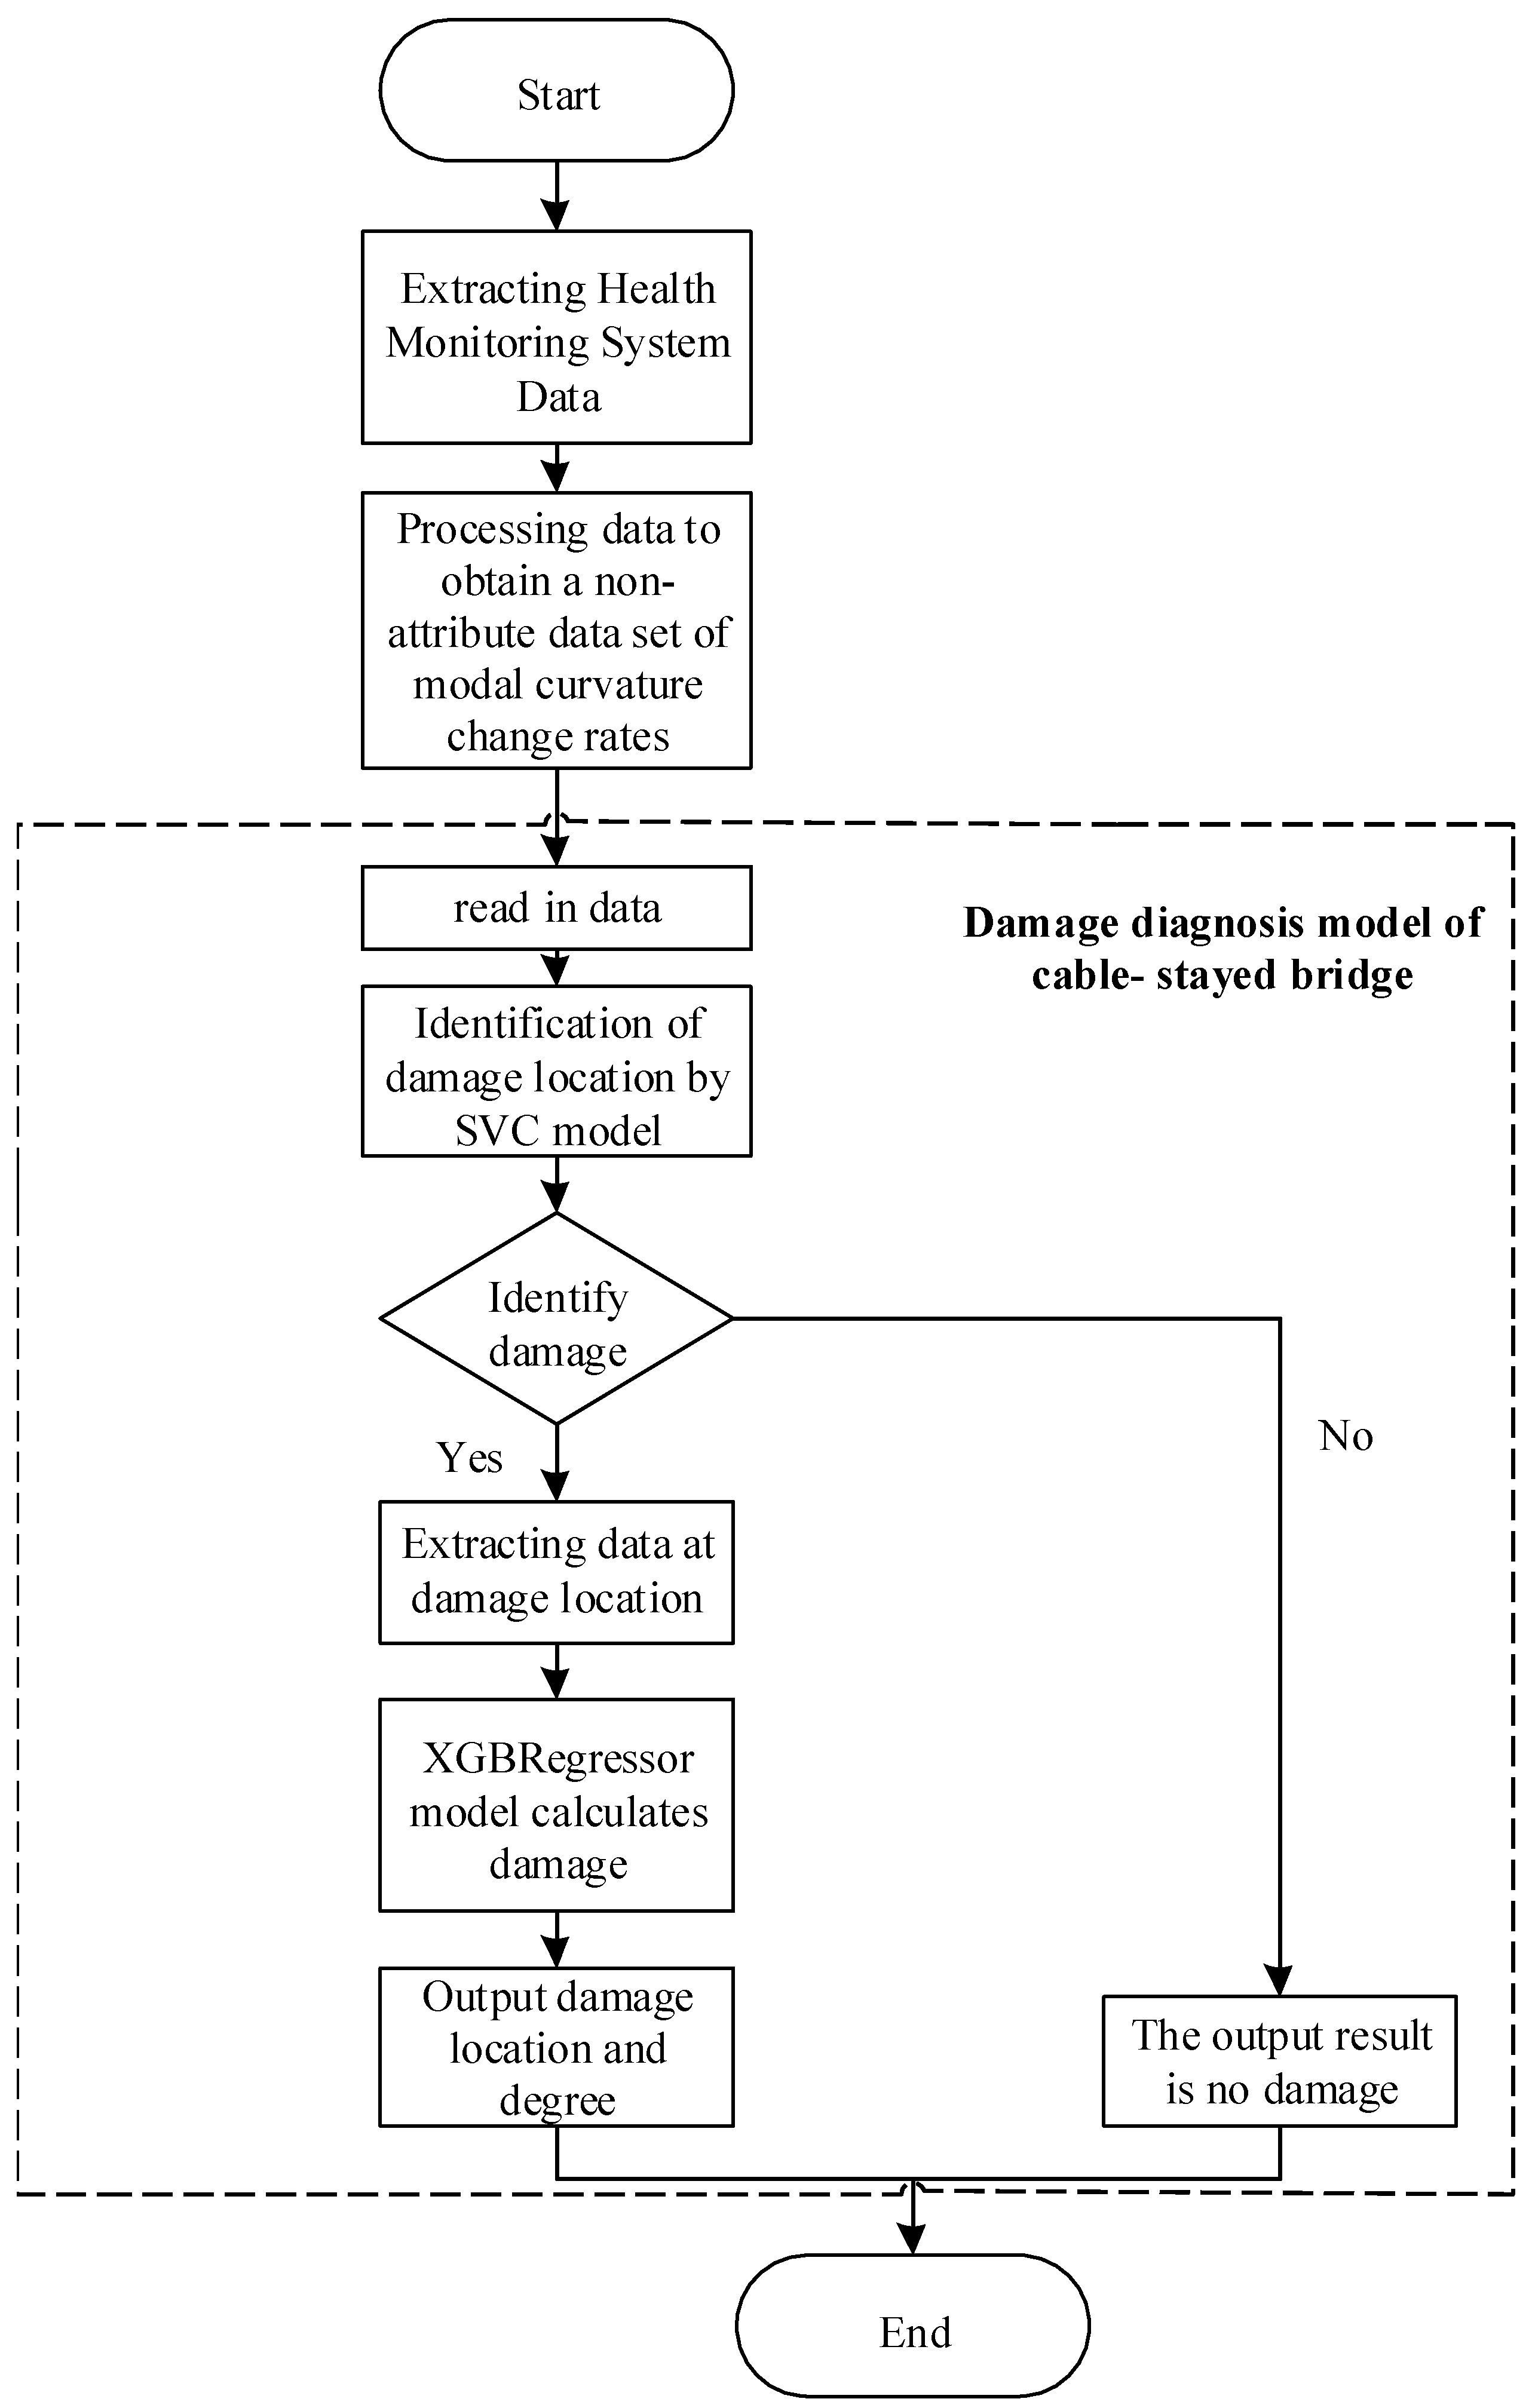
4.2. Use of Damage Diagnosis Models

The use process of the damage diagnosis model of cable-stayed bridges is as follows:
(1) The dynamic response data are extracted from the health monitoring system of cable-stayed bridges, and the original data are cleaned to eliminate useless signals in the data;
(2) The frequency domain statistical characteristics are extracted from the cleaned data, and the change rate of modal curvature at the anchor point of the stay cable and the main beam is calculated as the nonattribute data;
(3) The damage diagnosis model reads the data without attributes. First, the SVC model identifies the damage location to judge whether there is damage. If there is no damage, the direct output result is no damage. If there is damage at the location, the data at the damage location are further extracted, and the XGBRegressor model is used to calculate the damage degree.
(4) Output damage location and degree. The use process of the damage diagnosis model is shown in Figure 3.

5. Example and Analysis of a Cable-Stayed Bridge

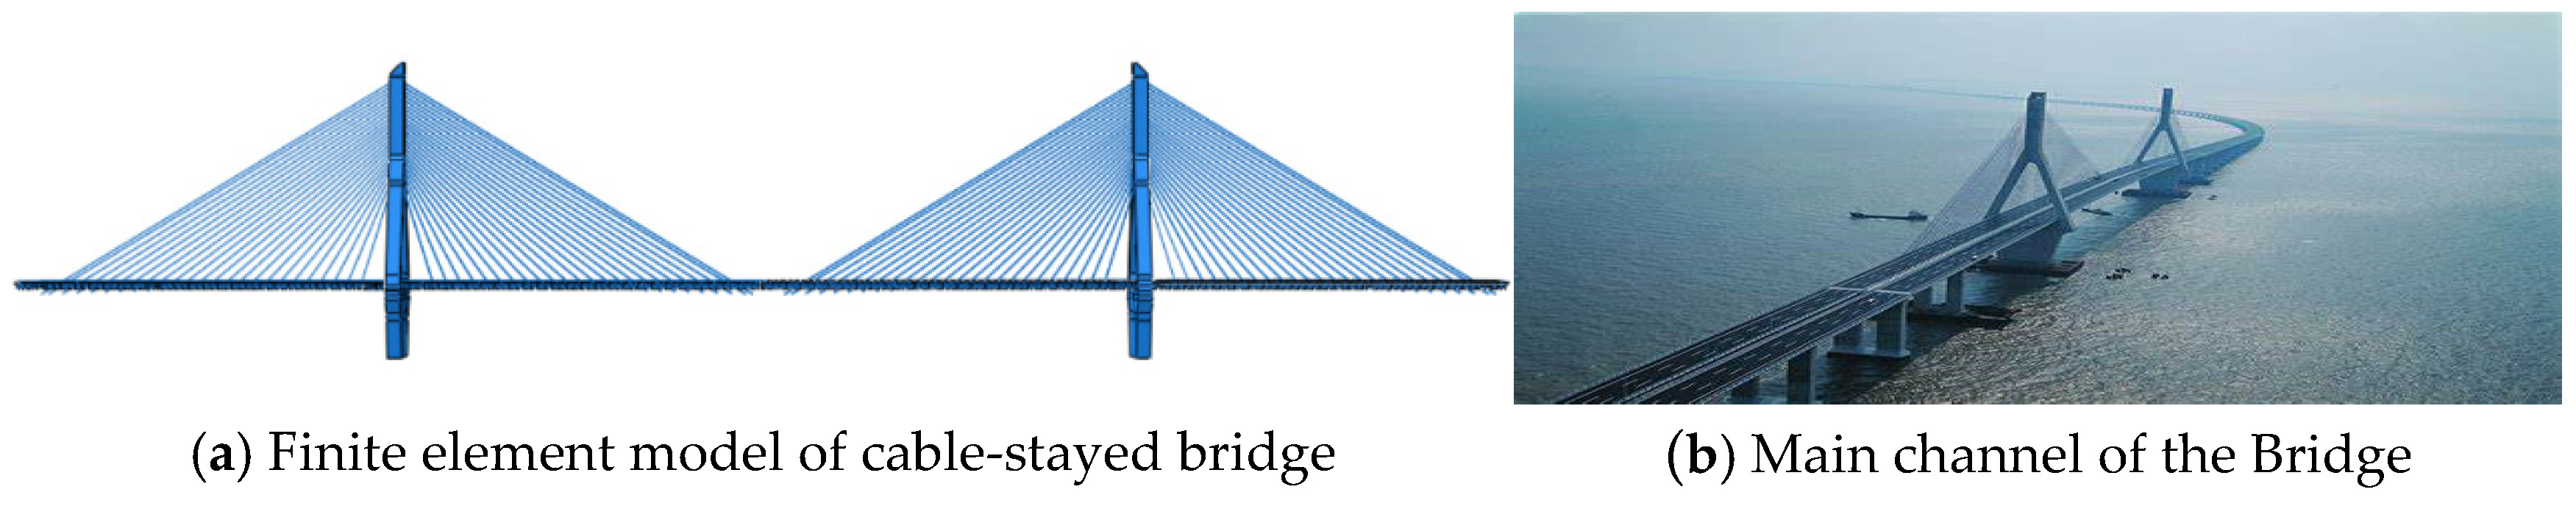
5.1. Overview of the Cable-Stayed Bridge Project

This bridge is a double-tower three-span steel–concrete-composite box girder cable-stayed bridge with a span of 205 + 420 + 205 = 830 m. The main girder is a single-box three-chamber large cantilever section, with a width of 33 m and a height of 4 m. The bridge deck concrete grade is C60, and the elastic modulus is 3.65 × 10⁴ MPa; the steel beam material is Q345qD, elastic modulus of 1.95 × 10⁵ MPa; 3 × φj 15.24 steel strands are used for prestressed tendons, elastic modulus of 1.95 × 10⁵ MPa. The main tower is an inverted Y-shaped tower. The height above the tower base of the cable tower is 150 m. The main tower concrete is C50 concrete with an elastic modulus of 3.45 × 10⁴ MPa. There are 96 pairs of stay cables in the whole bridge, the standard cable spacing on the main beam is 8 m, the standard cable spacing on the cable tower is 2 m, and the stay cable steel wire is φ7 galvanized steel wire with an elastic modulus of 1.95 × 10⁵ MPa.

5.2. Datum Finite Element Model of a Cable-Stayed Bridge

Elaborate modelling was carried out using Abaqus software, and the main beam, reinforcement, and stay cable were established by importing the Abaqus sketch. The stay cable is simulated by the B31 element, the prestressed reinforcement is simulated by the T3D2 element, the cable tower is simulated by the C3D10 element, the main beam is simulated by the C3D8R element, the concrete section property of the main beam and cable tower is solid homogeneous, the section property of the stay cable and prestressed reinforcement is truss, the prestressed reinforcement adopts built-in interaction in the model, and the cooling method [20] is used to apply prestress. The stress concentration and the subdivision grid at the pier. Modal dynamic analysis was adopted as the analysis step. The benchmark finite element model was established via the model correction method [21]. The finite element model and actual photos are shown in Figure 4.

5.3. Damage Condition Setting of Cable-Stayed Bridge

The damage was simulated by reducing the elastic modulus of the stay cables. The number of side span stay cables is A24-A1 from left to right, and the number of midspan stay cables is B1-B24. Because the damage is visible to the naked eye when there is a large degree of damage, the damage degree was designed to be 10%, 20%, 30%, 35%, and 40%, and the number of damages was 1–2. See Table 1 for the design of the damage conditions.
When conducting dynamic analysis according to the working conditions in Table 1, the first two order modal displacements and the first five order frequencies of the anchor points of the stay cable and the main beam were extracted through the Abaqus postprocessing interface and data file, respectively, and imported into Excel. The frequency change rate and modal curvature change rate were obtained by the Pychar simulation platform to process the data, which are taken as datasets.

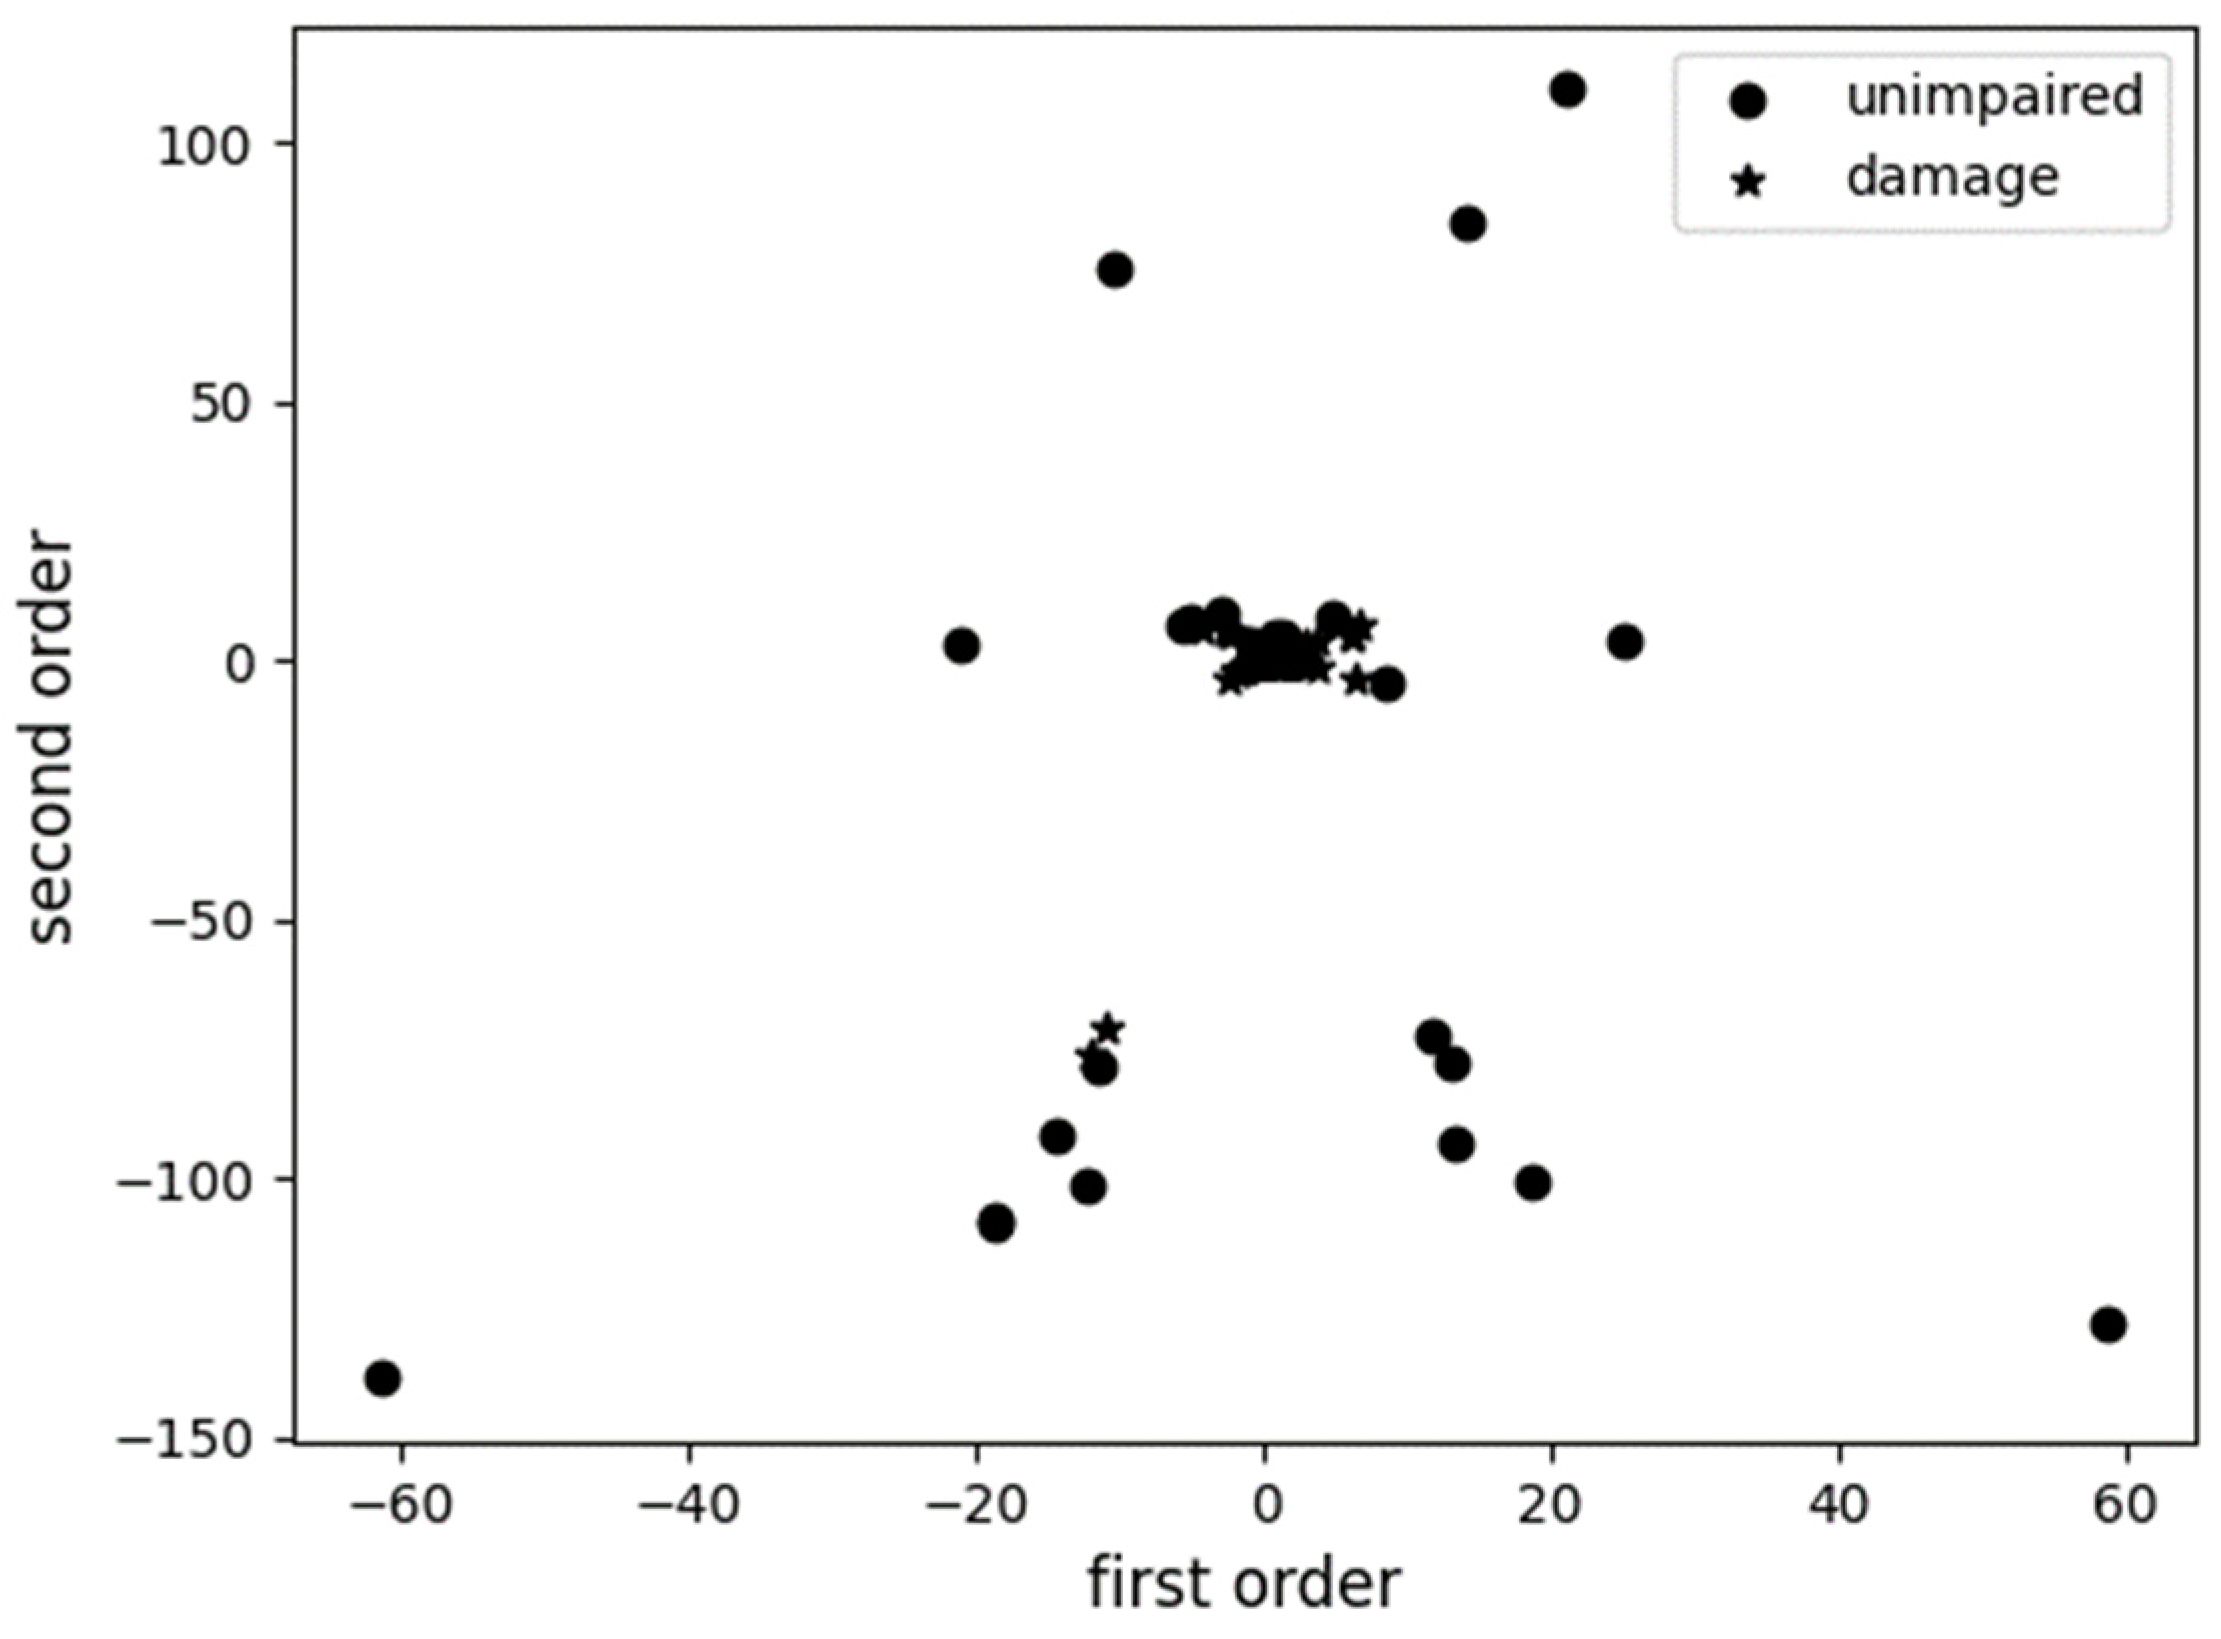
5.4. Damage Diagnosis of Cable-Stayed Bridges Based on Data Mining

The modelling in this paper is implemented in the Python language. The initial parameters of SVM modelling were C=1, gamma=scale, kernel=rbf, and epsilon=0.1. The initial parameter values of XGBoost modelling were n_estimators=100, max_depth=5, min_child_weight=1, and learning_rate=0.1.
When the frequency change rate is used as the damage index, the 1–5th order frequency change rate of the single-damage condition is used as the input sample. The number of samples is 10 groups, the number of output samples is the number of actual damage areas, the number of training sets is 7 groups, and the number of test sets is 3 groups. The identification results are shown in Table 2.
According to the research in Table 2 and the characteristics of the frequency change rate itself, when using the frequency change rate index for damage diagnosis, only the damage location can be identified under the single-damage working condition, but the damage degree cannot be determined, and the damage location and degree cannot be determined under the multiple-damage working condition.
When using the index of the change rate of modal curvature for damage diagnosis, the data are divided by the data division function (train_test_split), and the division ratio of the training set and test set is 4:1. The input vector of the SVM algorithm is shown in Figure 5, where two colors represent different health states, red for the damaged state and purple for the uninjured state. The single tree of the XGBoost algorithm uses Equation (3) to fit parameters in the damage diagnosis process, as shown in Figure 6. The SVM and XGBoost algorithms are used to learn training samples and establish corresponding models. The detection results of the model performance are as follows: the accuracy of damage location is compared through the test set, training set and cross-validation score, and the results are shown in Figure 7. The mean-square error (MSE) and cross-validation results are used for damage quantification, and the results are shown in Figure 8. The results of damage location cross-validation are shown in Figure 9, and the results of damage quantitative cross-validation are shown in Figure 10.
Figure 7 shows that the scores of the SVM algorithm in the test set and cross-validation set of damage locations were 0.8 and 0.822 respectively, and the scores of the XGBoost algorithm in the test set and cross-validation set of damage locations were 0.78 and 0.809 respectively. Therefore, the SVM algorithm has better damage location effects than the XGBoost algorithm.
Figure 8 shows that the cross-validation scores of the SVM algorithm the second, fourth, fifth and eighth time were all higher than those of the XGBoost algorithm, and the 10% cross-validation score of the SVM algorithm was more average, and the stability was better than the XGBoost algorithm.
According to the research in Table 2 and the characteristics of the frequency change rate itself, when using the frequency change rate index for damage diagnosis, only the damage location can be identified under the single-damage working condition, but the damage degree cannot be determined, and the damage location and degree cannot be determined under the multiple-damage working condition.
When using the index of the change rate of modal curvature for damage diagnosis, the data are divided by the data division function (train_test_split), and the division ratio of the training set and test set is 4:1. The input vector of the SVM algorithm is shown in Figure 5, where two colors represent different health states, red for the damaged state and purple for the uninjured state. The single tree of the XGBoost algorithm uses Equation (3) to fit parameters in the damage diagnosis process, as shown in Figure 6. The SVM and XGBoost algorithms are used to learn training samples and establish corresponding models. The detection results of the model performance are as follows: the accuracy of damage location is compared through the test set, training set and cross-validation score. The mean-square error (MSE) and cross-validation results are used for damage quantification, and the damage localization and quantitative identification results are shown in Figure 7. The results of damage location and cross-validation are shown in Figure 8, and the results of damage quantitative cross-validation are shown in Figure 9.
Figure 9 shows that the mean-square error of the XGBoost algorithm in 10% cross-validations was significantly lower than that of the SVM algorithm except for the second cross-validation.
Therefore, the SVM algorithm has advantages in damage location, and the XGBoost algorithm has more advantages in damage quantification.

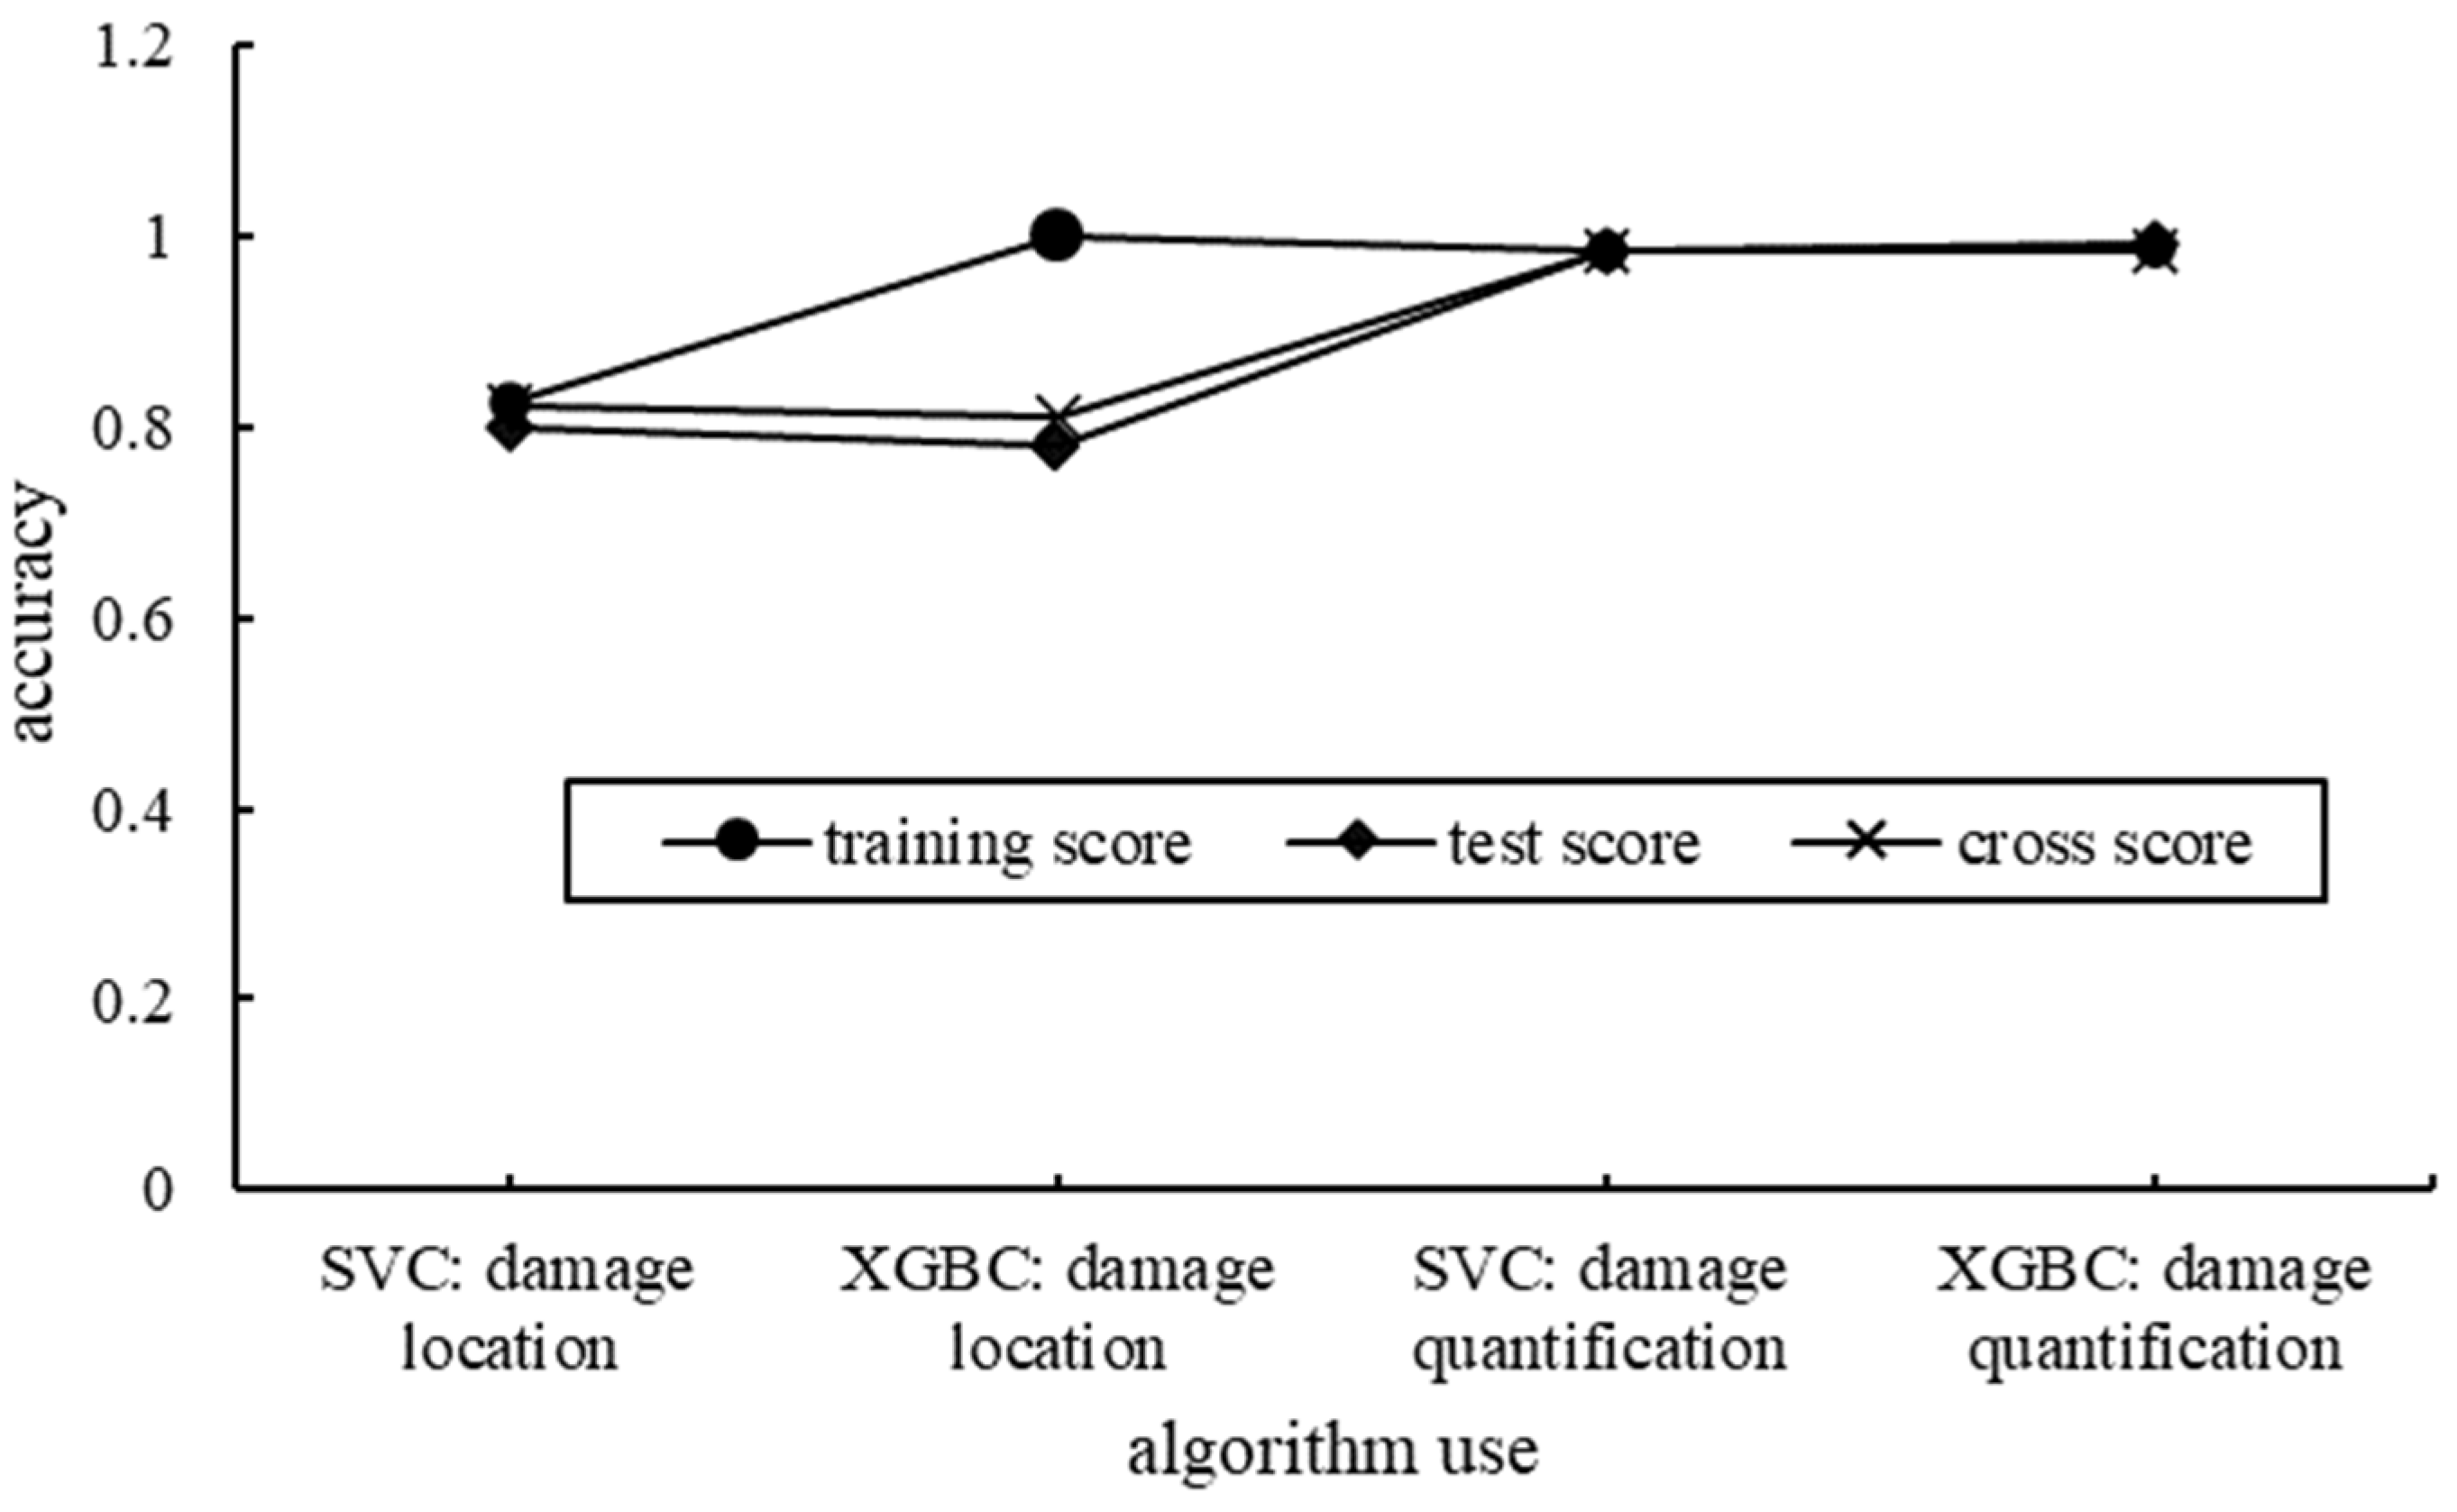
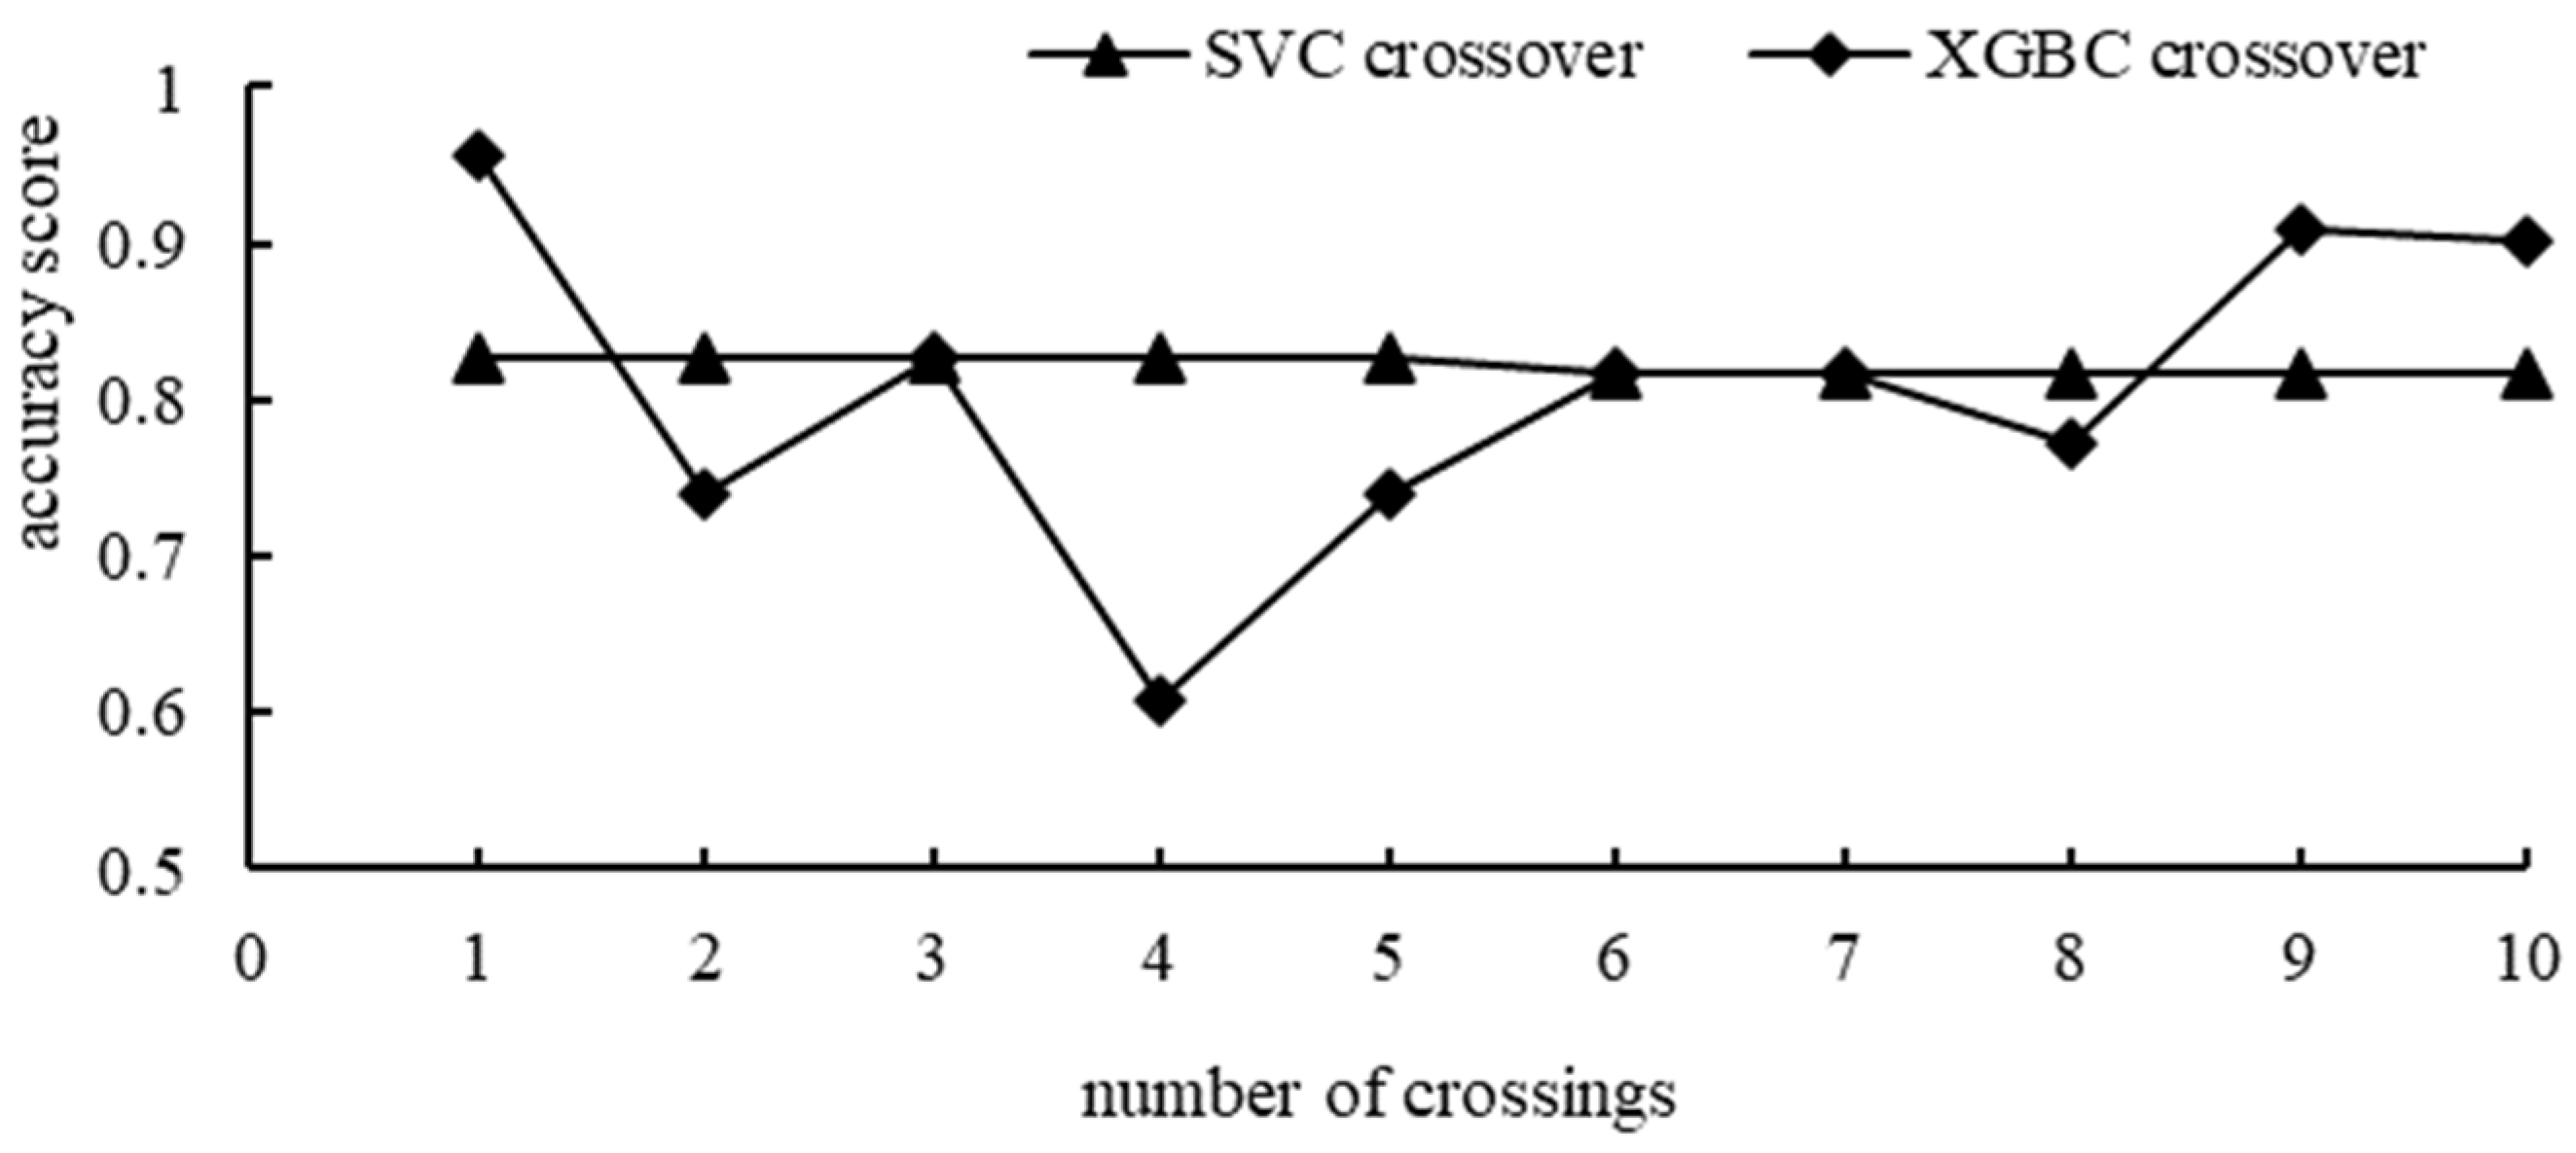
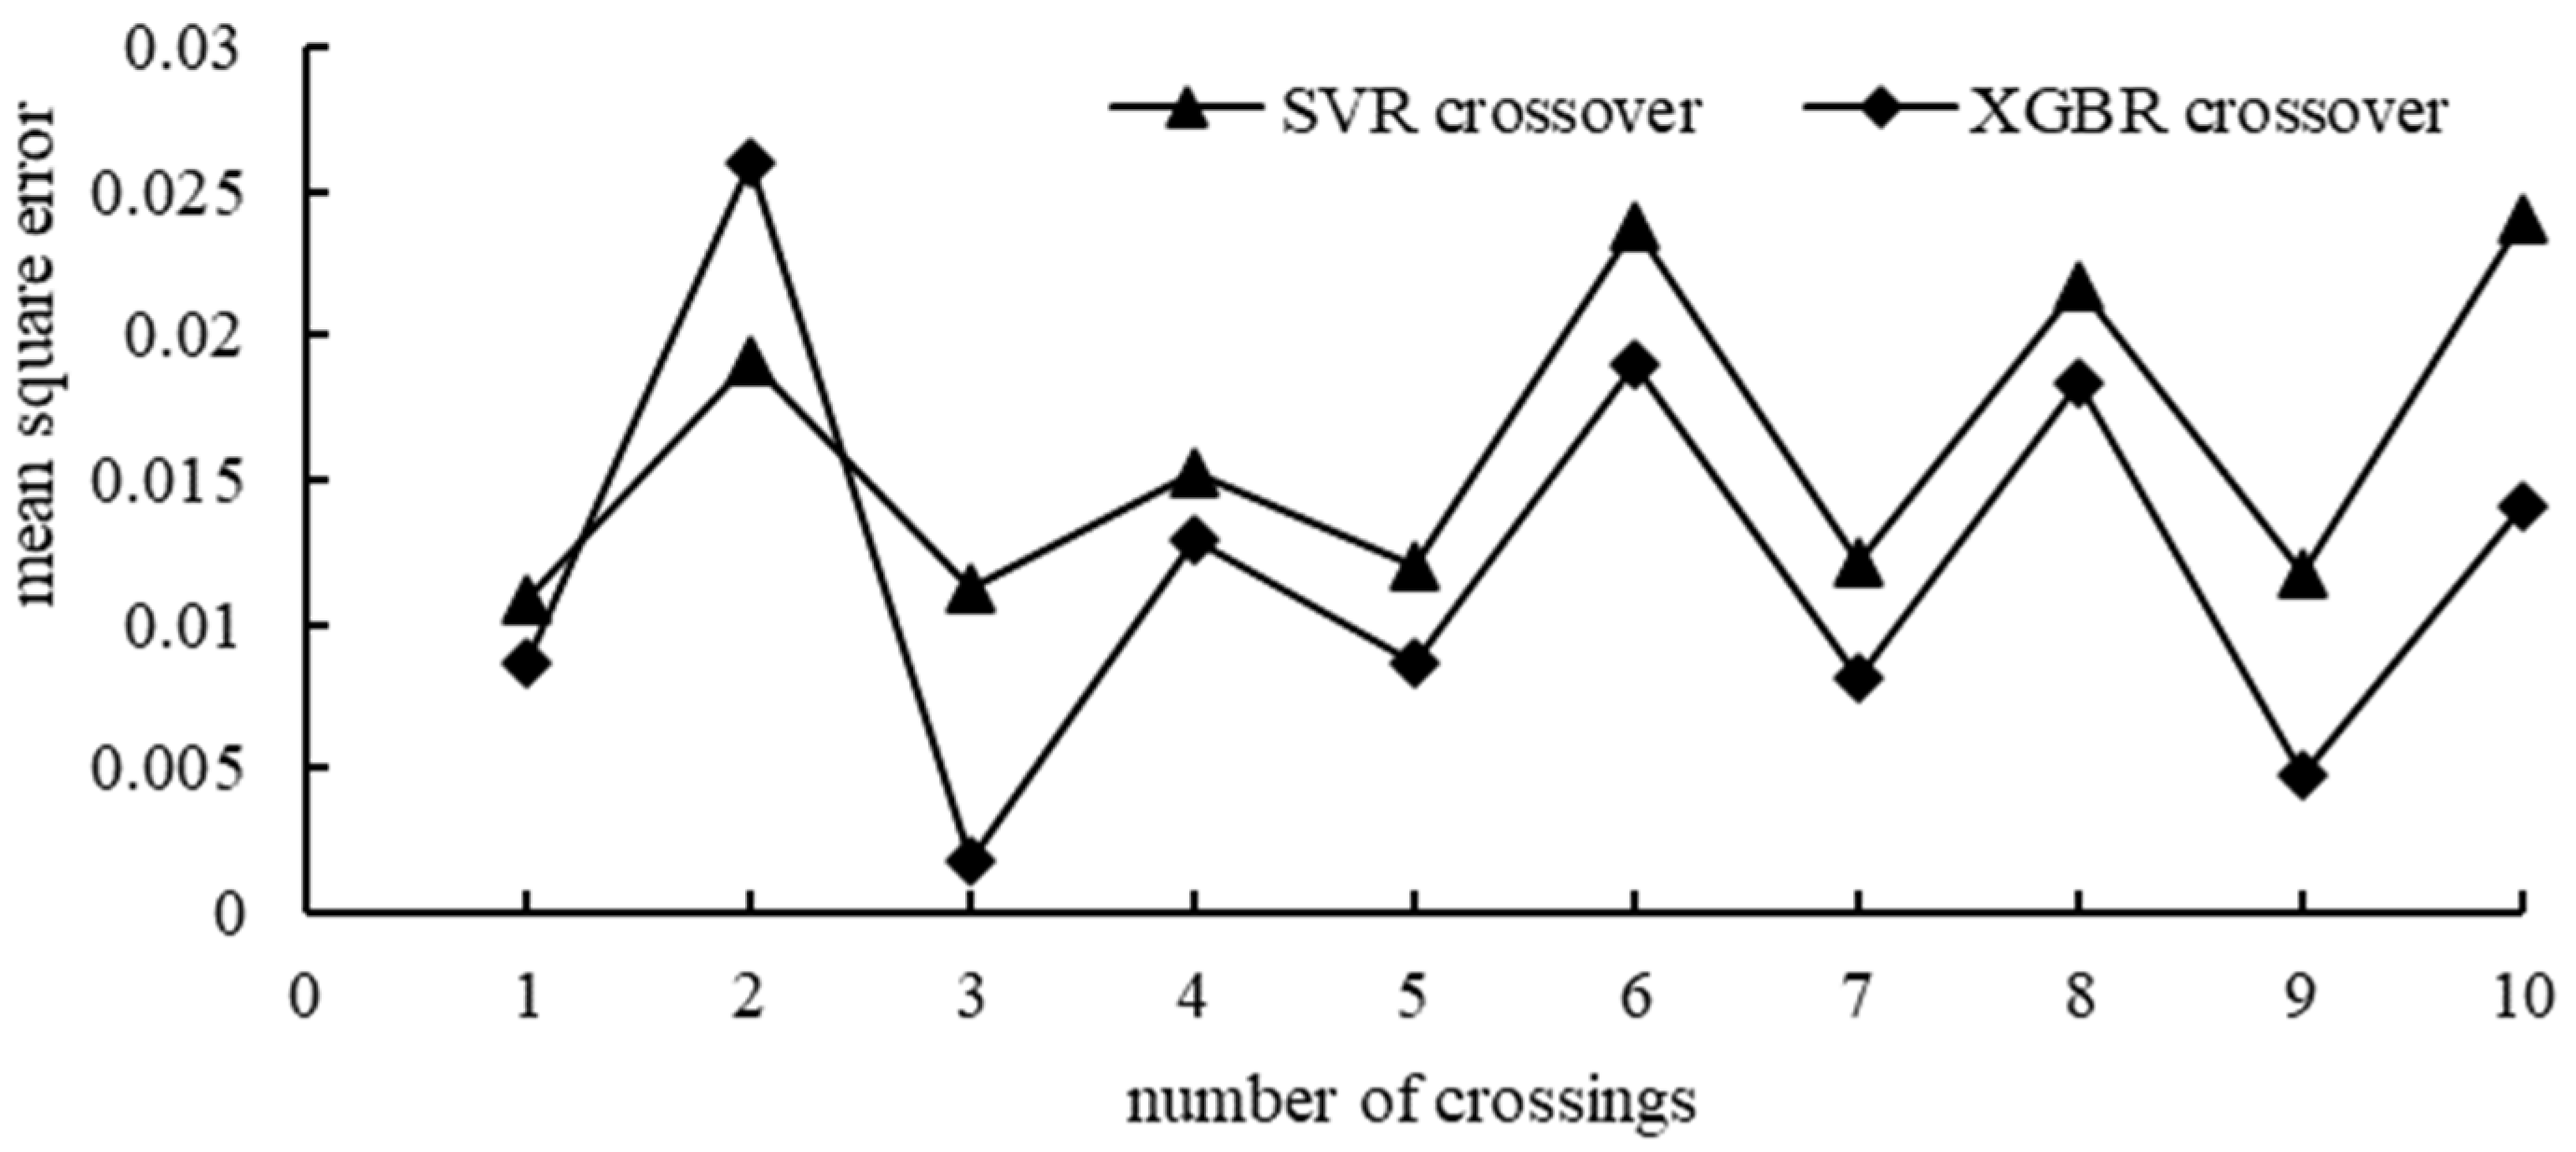
5.5. Performance Optimization of the Damage Diagnosis Model for Cable-Stayed Bridges

When using the steps in Section 2.2 for optimization, the value range of model superparameters is as follows: the value range of SVC model parameters is gamma=np.linspace (0.00001,0.3,30), c=np.linspace (0.0001,30,30). The values of the gamma and c parameters of the SVR model are the same as those of the SVC model, epsilon=np.linspace (0.00001,1,30); the XGBClassifier model parameter value range is n_estimators=np.arange(50,401,30), max_depth=np.arange(2,10,1), min_chile_Weight=np.linspace (1,9,30) and learning_rate=np.linspace(0.05,0.3). The XGBRegenerator model parameter value range is n_estimators=np.arange(50,401,10), max_depth=np.arange(1,15), min_chile_weigh=np.linspace(1,9,50), learning_rate=np.linspace(0.05,0.3,50). Among these, np.linspace and np.arange are built-in functions of the data mining library. Their parameters are np.arange (start, stop, step) and np linspace(start, stop, num). The superparameter combination is optimized through GSM and RSM (the number of RS seeds is 15). The optimized parameter combination is shown in Table 3, the optimization result of the SVM model is shown in Table 4, and the optimization result of the XGBoost model random search is shown in Table 5.
Table 4 shows that the damage location score of SVM after the GSM optimization was 0.86, and the mean-square error of the damage degree quantification was 0.008. The damage location score after the RSM optimization was 0.858, and the mean-square error of the damage degree quantification was 0.011.
Table 5 shows that the damage location score after the XGBoost optimization is 0.822, and the mean-square error of the damage degree quantification is 0.006.
Through comparative analysis of the performance before and after optimization in Table 4 and Table 5, it can be seen that both grid search and random search can optimize the damage diagnosis model, and the combination of the optimized SVC and XGBRegressor algorithms to establish a damage diagnosis model for cable-stayed bridge damage diagnosis has more advantages than a single algorithm. According to the analysis of optimization time, grid search needs to grid the search area in advance. When the parameters increase, the grid search optimization time will increase expo-nentially, and RS will take less time than GS.

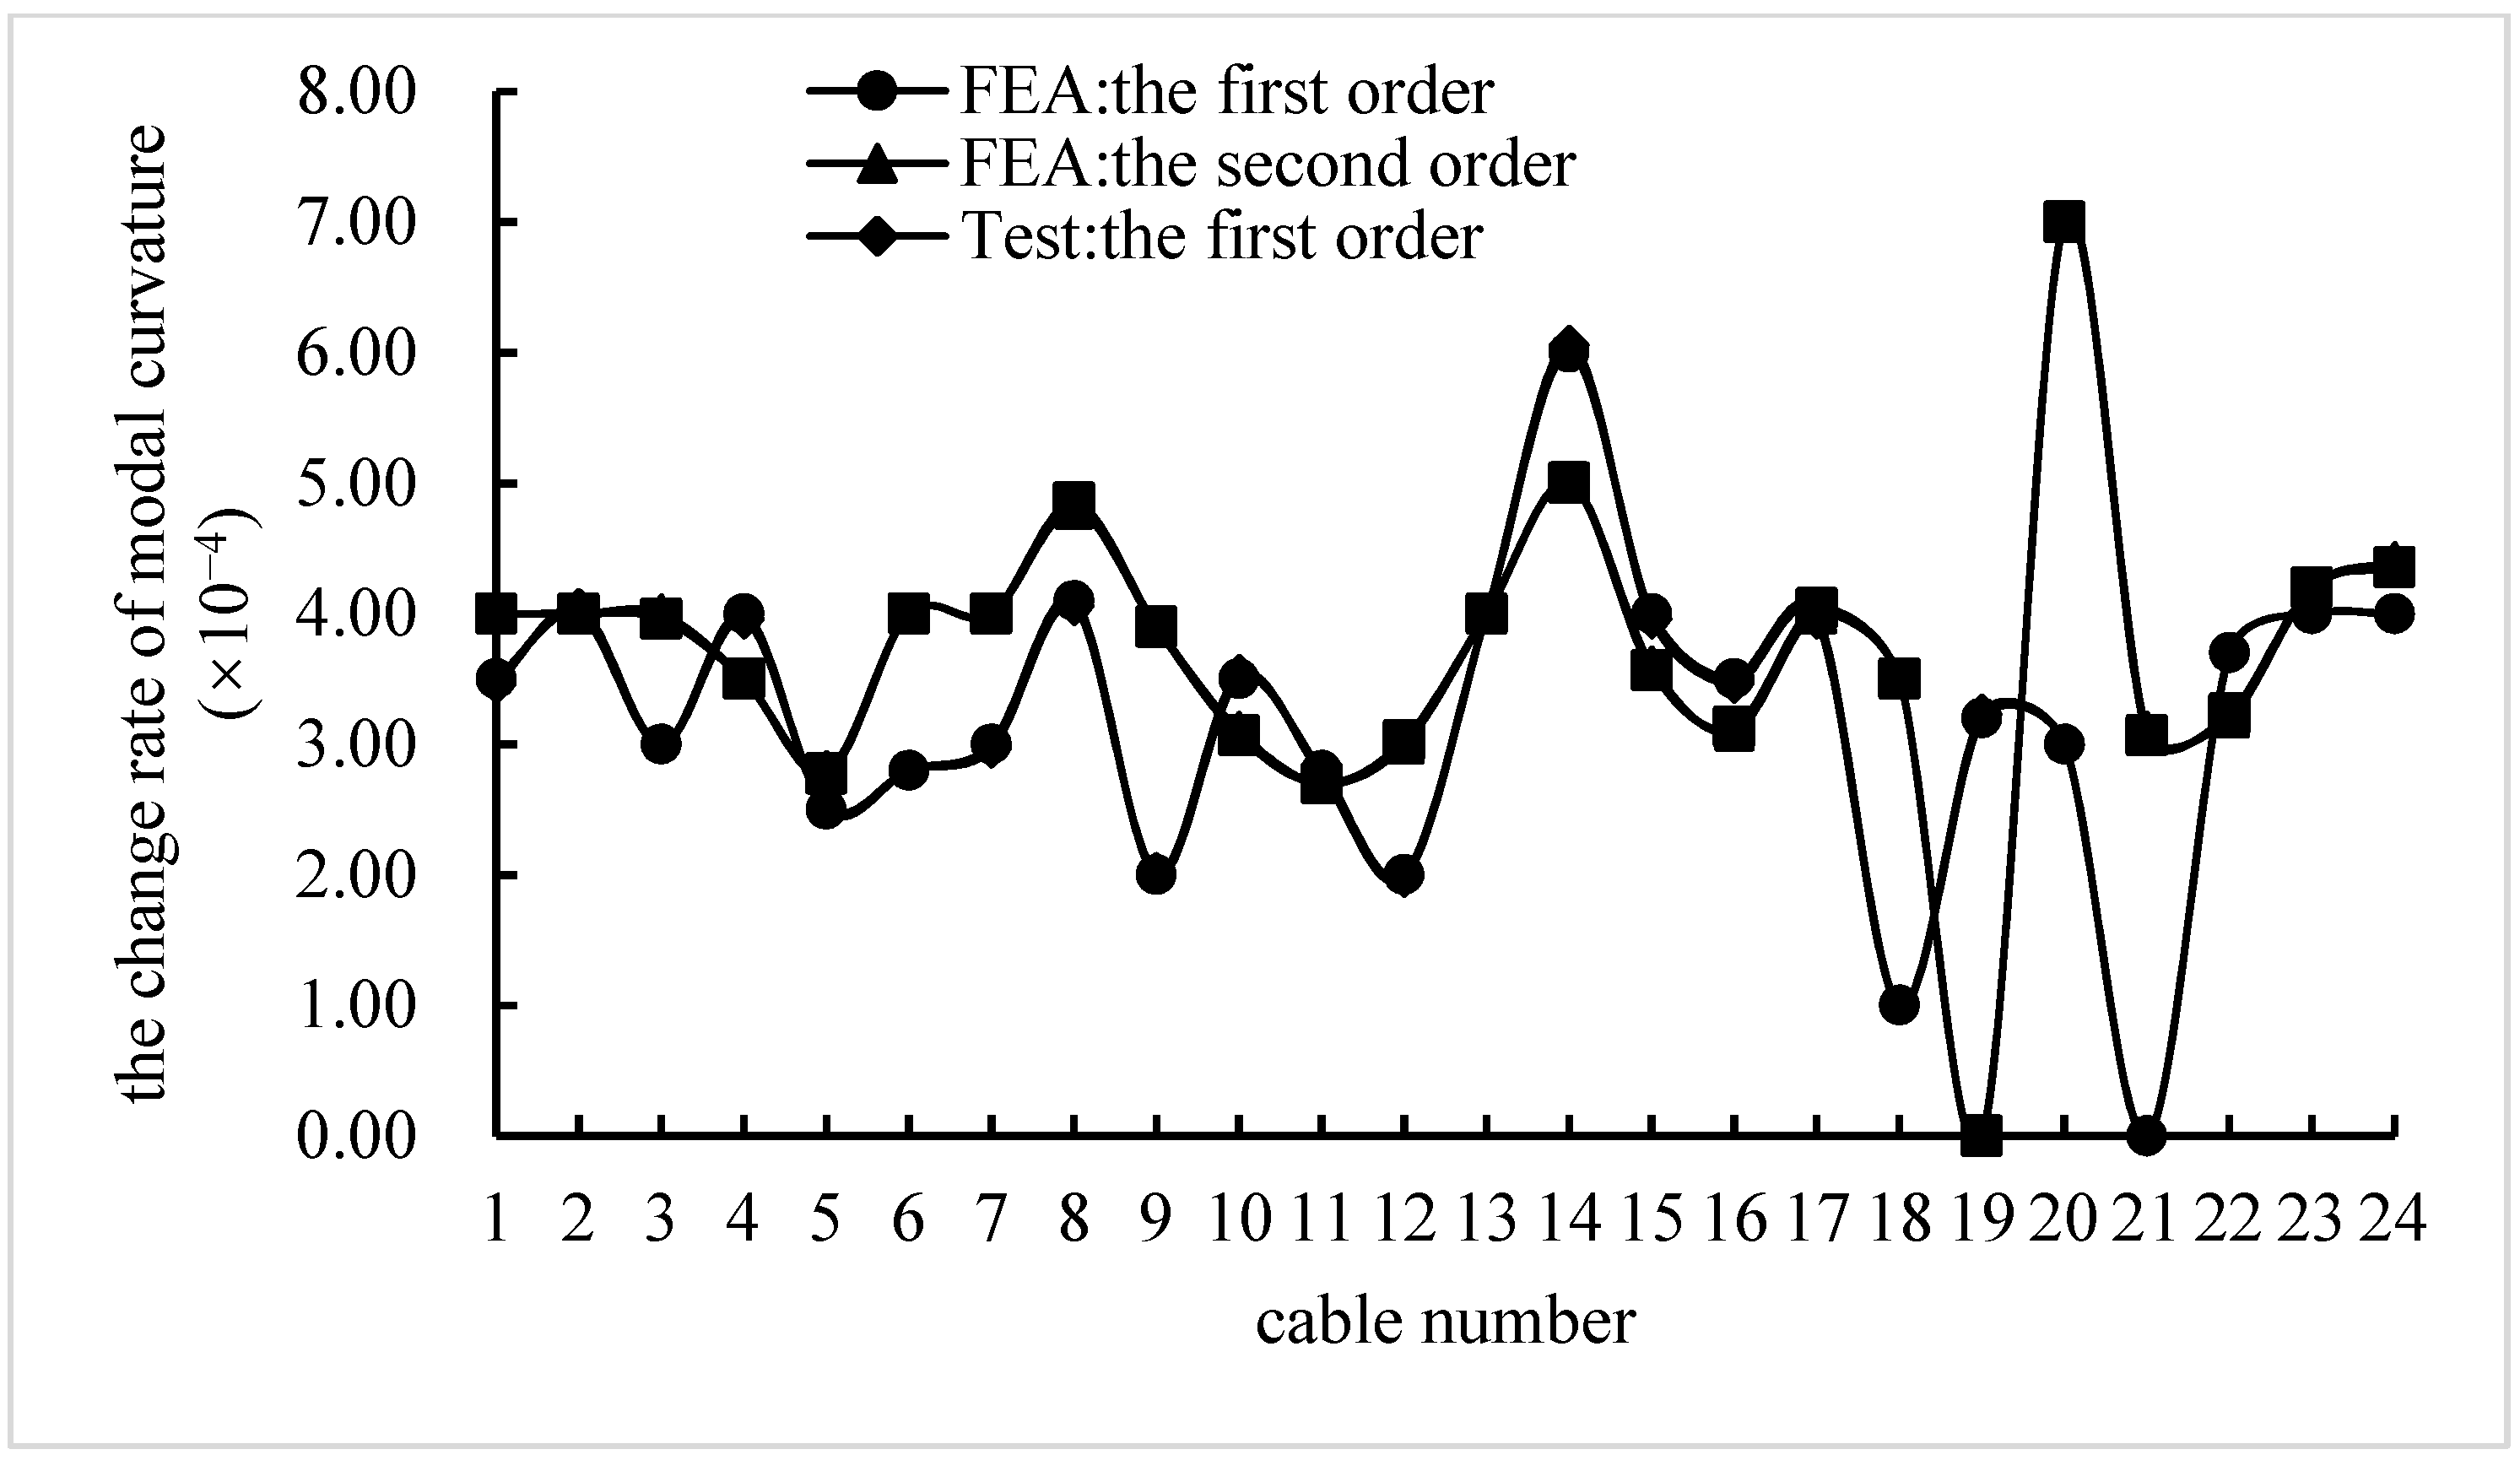
5.6. Application of the Model in a Practical Cable-Stayed Bridge

The damage diagnosis model for cable-stayed bridges established in this paper was used to diagnose the damage of the side span cables of the Bridge under the nondestructive state according to the process in Section 4.2. The change rate of modal curvature is shown in Figure 10.
Figure 10 shows that the first-order and second-order curvature change rates calculated based on the measured data of the cable-stayed bridge have a certain difference from the values calculated based on the finite element model. The reason may be that the measurement of the real bridge data has errors. However, considering that the maximum error is only 1%, this error can be ignored.
The change rate data of modal curvature was inputted into the damage diagnosis model, and the state results showed that the bridge was undamaged.
It can be concluded that the damage identification results obtained based on this method are basically consistent with the actual damage to the bridge, which shows that this method has high accuracy in damage identification.

6. Conclusions

(1) This paper proposes a data mining damage diagnosis method that combines and optimizes the two algorithms of SVM and XGBoost and completes the establishment of a damage diagnosis model of cable-stayed bridges. From the identification results of the model, the model can better diagnose the damage of cable-stayed bridges.
(2) Analysis of the damage diagnosis results of the model shows that the selection of machine learning algorithms is very important when establishing the damage diagnosis model for cable-stayed bridges.
(3) The analysis of the results of model optimization shows that the selection of optimization methods is very important, and the determination of the optimization scheme should be comprehensively considered from the two aspects of optimization time and results.

Author Contributions

Methodology, J.L.; Software, H.C.; Validation, Q.L., H.W. and J.B. All authors have read and agreed to the published version of the manuscript.

Funding

This research was funded by the National Natural Science Foundation of China (No. 51778381) and Hebei Provincial Natural Science Foundation (No. E2018210044). This research is supported by the High-End Talent Project of Hebei Province (No. Jiban [2019] No. 63), Key R&D Program of Hebei Province (No. 19275405D), China.

Institutional Review Board Statement

Not applicable.

Informed Consent Statement

Not applicable.

Data Availability Statement

The authors confirm that the data supporting the findings of this study are available within the article.

Conflicts of Interest

The authors declare no conflict of interest.

References

  1. Yan, Z.-G.; Yue, Q.; Shi, Z. Design of Structural Health Monitoring System for Hutong Changjiang River Bridge. Bridge Constr. 2017, 47, 7–12. [Google Scholar]
  2. Editorial Department of China Journal of Highway and Transport. Review on China’s Bridge Engineering Research: 2021. China J. Highw. Transp. 2021, 34, 1–97. [Google Scholar]
  3. Ke, J.; Dong, H.; Tan, C.; Liang, Y. PBWA: A Provenance-Based What-If Analysis Approach for Data Mining Processes. Chin. J. Electron. 2017, 26, 986–992. [Google Scholar] [CrossRef]
  4. Guo, Q.; Nan, P.; Wan, J. Signal classification method based on data mining for multi-mode radar. J. Syst. Eng. Electron. 2016, 27, 1010–1017. [Google Scholar] [CrossRef]
  5. Gordan, M.; Razak, H.A.; Ismail, Z.; Ghaedi, K. Recent Developments in Damage Identification of Structures Using Data Mining. Lat. Am. J. Solids Struct. 2017, 14, 2373–2401. [Google Scholar] [CrossRef]
  6. Sun, Y.; Yang, N.; Zhang, Z. Structural Damage Identification Study Based on Kernel Component Analysis and Support Vector Machine. J. Basic Sci. Eng. 2018, 26, 888–900. [Google Scholar]
  7. Sun, C.; Lü, Q.; Zhu, S.; Zheng, W.; Cao, Y.; Wang, J. Ultra-short-term Power Load Forecasting Based on Two-layer XGBoost Algorithm Considering the Influence of Multiple Features. High Volt. Eng. 2021, 47, 2885–2898. [Google Scholar]
  8. Zhao, Y.-P.; Yu, T.-L.; Jiao, Y.-B.; Gong, Y.-F.; Song, G. Damage identification method and factor evaluation for irregular-shaped bridge. J. Jilin Univ. (Eng. Technol. Ed.) 2016, 46, 1858–1866. [Google Scholar]
  9. Zhang, J.; Zhang, Q.; Qin, X.; Sun, Y. A two-stage fault diagnosis methodology for rotating machinery combining optimized support vector data description and optimized support vector machine. Measurement 2022, 200, 111651. [Google Scholar] [CrossRef]
  10. An, P.; Wu, X. Multi position damage identification of beam-bridges based on support vector machine. J. Railw. Sci. Eng. 2019, 16, 1231–1236. [Google Scholar]
  11. Liu, Z.; Jin, M.; Zhou, L.; Tu, C.; Tang, L.; Jiang, Z.; Liu, Y. Bridge Damage Identification Method Based on Structural Response Vectors and Support Vector Machine Algorithms. J. Univ. Jinan (Sci. Technol.) 2020, 34, 106–112. [Google Scholar]
  12. Guo, X.; Gong, R.; Bao, H. Modeling of wind speed uncertainty based on evidence theory. Electr. Power Autom. Equip. 2019, 39, 73–77. [Google Scholar]
  13. Li, Y.; Huang, Y.X.; Zhao, L.J.; Liu, C.L. Multi-condition Wear Evaluation of Tool Based on T-SNE and XGBoost. J. Mech. Eng. 2020, 56, 132–140. [Google Scholar]
  14. Huang, X. Research on Damage Identification of Long-Span Bridges Based on Optimal Sensor Placement and Integrated Learning. Doctoral Thesis, Wuhan University of Technology, Wuhan, China, 2020. [Google Scholar]
  15. Ling, D.; Li, C.; Wang, Y.; Zhang, P. Fault Detection and Identification of Furnace Negative Pressure System with CVA and GA-XGBoost. Energies 2022, 15, 6355. [Google Scholar] [CrossRef]
  16. Fu, C.; Shan, D.; Li, Q. The Static Damage Identification Method Based on the Support Vector Machine. China Railw. Sci. 2010, 31, 47–53. [Google Scholar]
  17. Wan, H.-P.; Ren, W.-X.; Yan, W.-J. Analytical global sensitivity analysis for uncertainty in structural dynamic properties of bridges. J. Vib. Eng. 2016, 29, 429–435. [Google Scholar]
  18. Xiao, R.; Wei, Z.; Zhai, X. Hourly Energy Consumption Forecasting for Office Buildings Based on Support Vector Machine. J. Shanghai Jiao Tong Univ. 2021, 55, 331–336. [Google Scholar]
  19. Ma, L.; Yu, S.; Zhao, S. Superheated Steam Temperature Prediction Models Based on XGBoost Optimized with Random Search Algorithm. J. North China Electr. Power Univ. 2021, 48, 99–105. [Google Scholar]
  20. Zhang, H.-S.; Wang, Y.-Y. Cooling Method Numerical Analysis of Suspender Cable Tension and Cable Saddle Pushing. J. Railw. Eng. Soc. 2017, 34, 39–44. [Google Scholar]
  21. Wang, H.; Liu, J.; Wang, X.; Zhang, Z. A New Method and Implementation of Building Baseline FE Model of Cable-Stayed Bridge. J. Vib. Meas. Diagn. 2014, 34, 458–462. [Google Scholar]
Figure 1. Flow chart of model optimization.
Sustainability 15 02347 g001
Figure 2. The Attainment Process of the Damage Diagnosis Model for Cable-stayed Bridges.
Sustainability 15 02347 g002
Figure 3. Application process of the damage diagnosis model for cable-stayed bridges.
Sustainability 15 02347 g003
Figure 4. Finite element model (a) and main channel of the the Bridge (b).
Sustainability 15 02347 g004
Figure 5. Input vector.
Sustainability 15 02347 g005
Figure 6. Fitting parameters of the XGBoost algorithm.
Sustainability 15 02347 g006
Figure 7. Damage localization and quantitative identification results.
Sustainability 15 02347 g007
Figure 8. Tenfold cross-validation of damage locations.
Sustainability 15 02347 g008
Figure 9. The results of damage quantitative tenfold cross-validation.
Sustainability 15 02347 g009
Figure 10. Modal curvature change rate of side span cables under nondestructive conditions of the Bridge.
Sustainability 15 02347 g010
Table 1. Damage condition.
Damage noDamage LocationDegree of Damage
1A910%, 20%, 30%, 35%, 40%
2A810%, 20%, 30%, 35%, 40%
3A9, A810%, 20%, 30%, 35%, 40%
4A9, A310%, 20%, 30%, 35%, 40%
5A9, A710%, 20%, 30%, 35%, 40%
Table 2. Frequency index identification results.
Test Set NoExpected OutputActual Output
111
222
311
Table 3. Optimization of parameter combinations.
Algorithm CombinationParameter Combination
SVR-RSMC=2.07, epsilon=0.034, gamma=0.22
SVR-GSMC=1.03, epsilon=0.034, gamma=0.083
SVC-GSMC=7.241455172413793, gamma=0.07242137931034483
SVC-RSMC=6.2069758620689655, gamma=0.08276586206896551
XGBR-RSMn_estimators=100, max_depth=3, min_child_weight=4, learning_rate=0.07
XGBC-RSMn_estimators=50, max_depth=3, min_child_weight=8.72, learning_rate=0.22
Table 4. SVM model optimization results.
Algorithm svc svr
optimization methodgsm rsmgsm rsm
optimization time21.43 0.36265 0.13
performance not optimized0.822 0.8220.015 0.015
performance after optimization0.860 0.8580.008 0.011
Table 5. XGBoost model optimization results.
AlgorithmXGBClassifierXGBRegressor
optimization time9.148.70
performance not optimized0.8090.01
performance after optimization0.8220.006
Disclaimer/Publisher’s Note: The statements, opinions and data contained in all publications are solely those of the individual author(s) and contributor(s) and not of MDPI and/or the editor(s). MDPI and/or the editor(s) disclaim responsibility for any injury to people or property resulting from any ideas, methods, instructions or products referred to in the content.

