
Application of Circular Economy in Oil and Gas Produced Water Treatment


Abstract
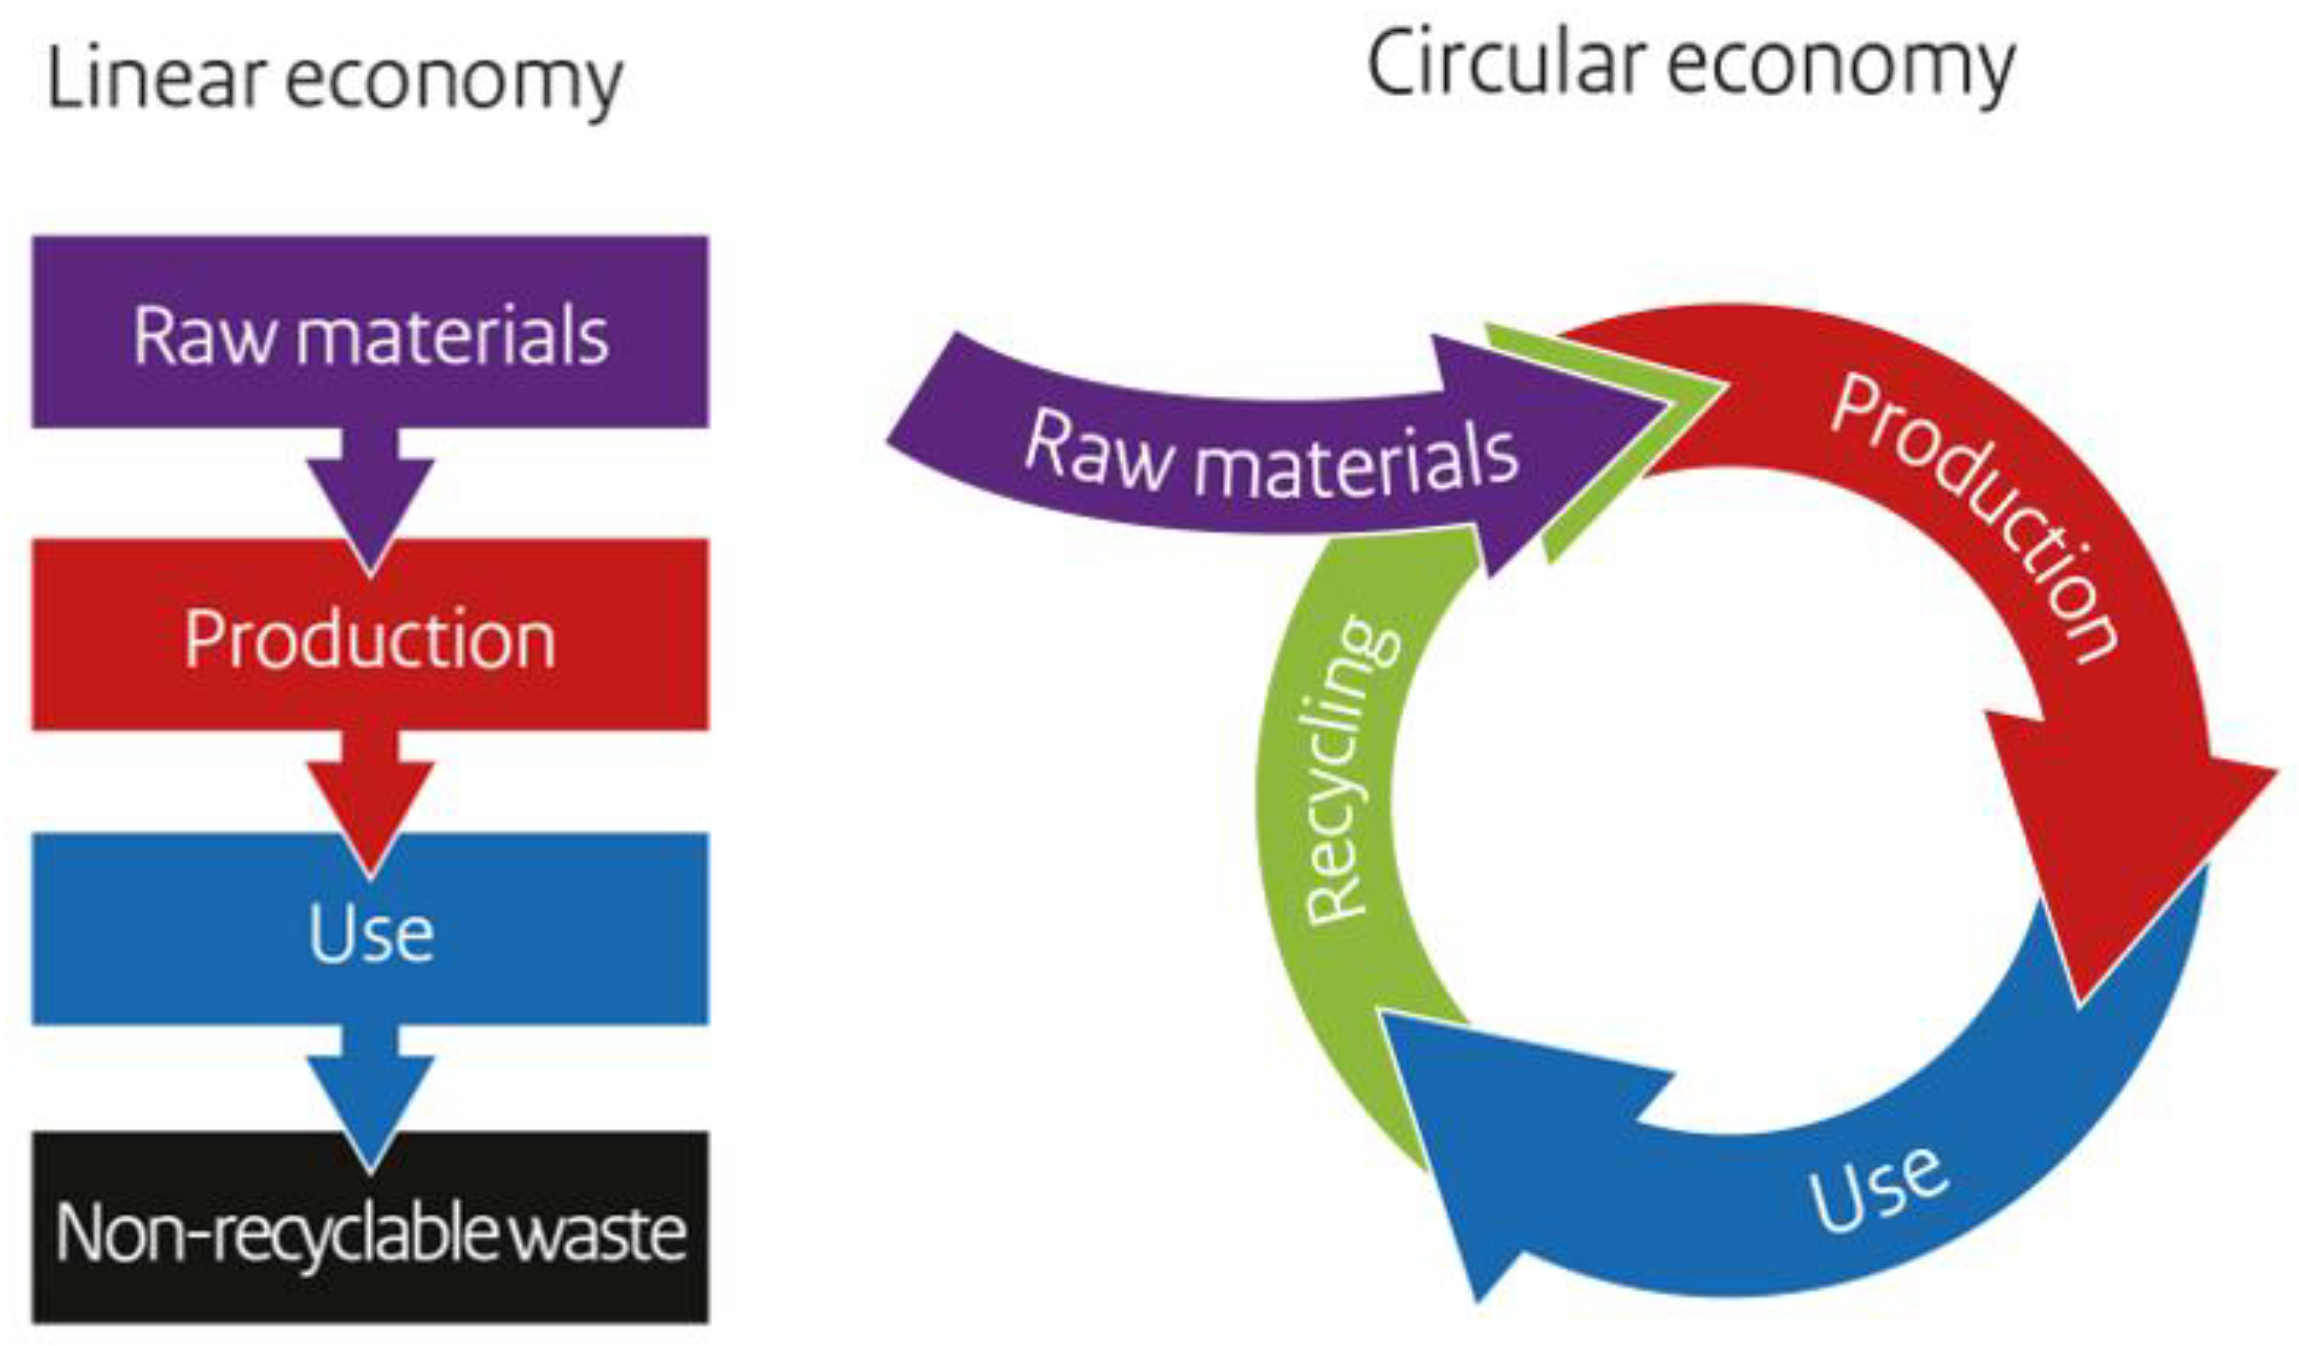
1. Introduction
1.1. Produced Water Composition and Treatment
1.2. Promoting Constructed Wetlands for Produced Water Treatment
1.3. Study Objectives
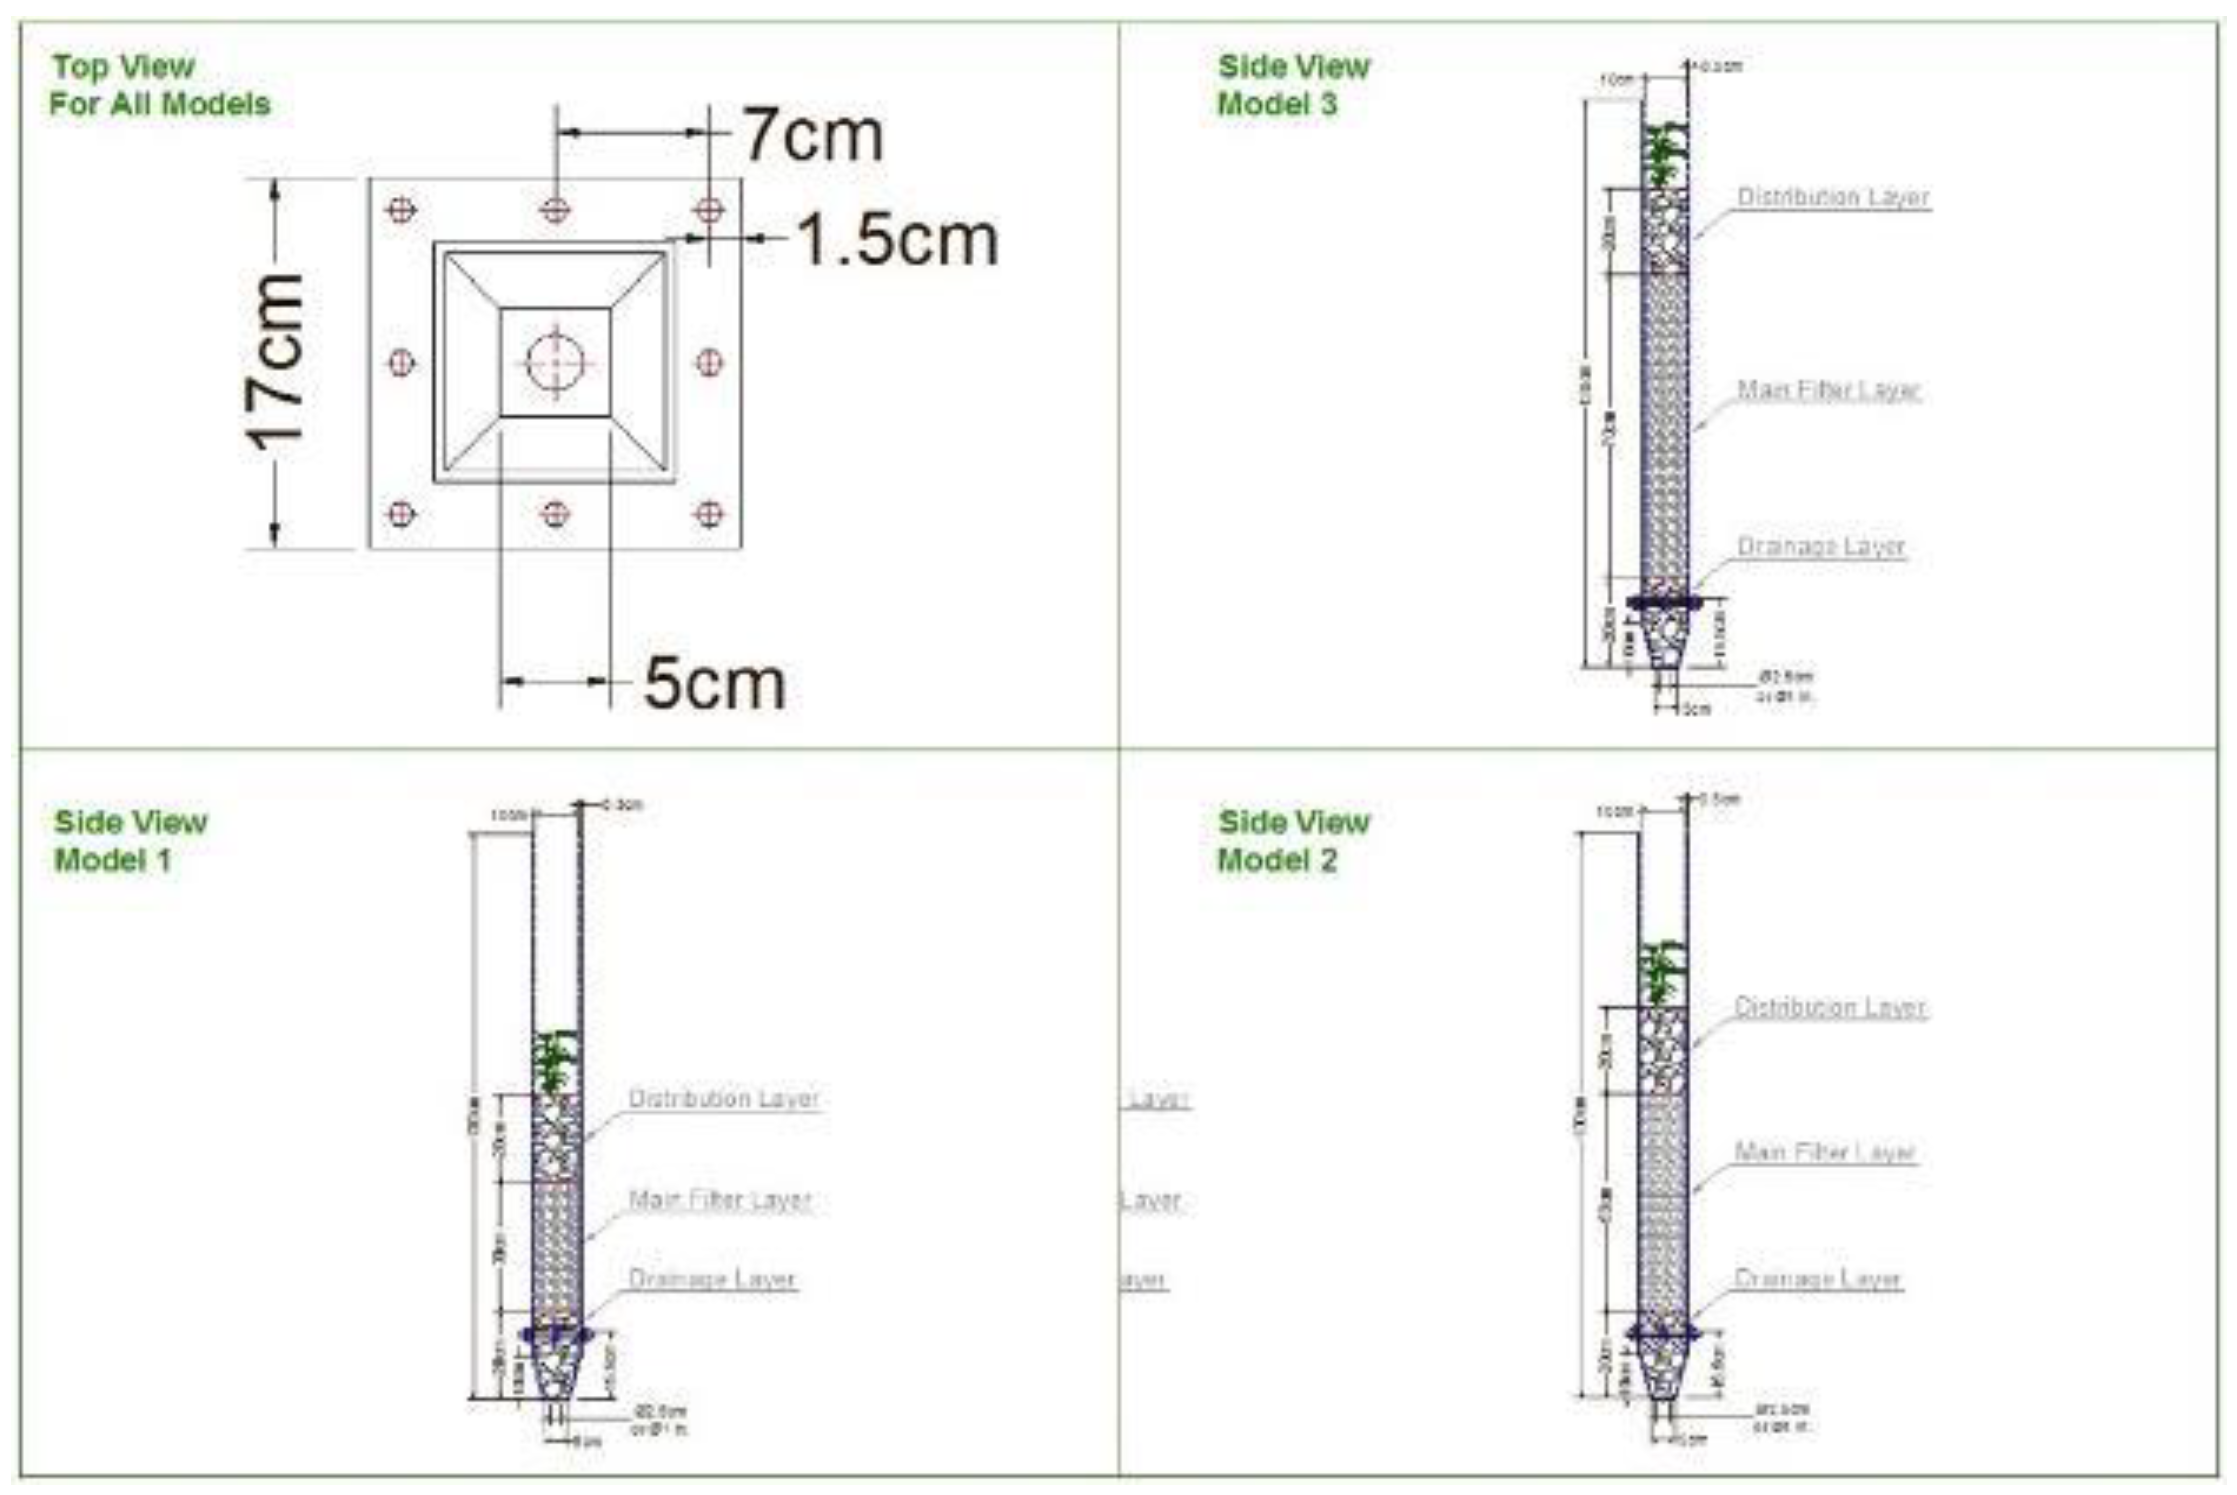
- Preliminary testing and determining the optimum configuration for the lab scale CWs;
- Design and installation of a pre-treatment septic tank to decrease the percentage of oil and grease in the effluent;
- Design and fabrication of eight individual VF and HF CWs units to test four different filter media materials;
- Chemical analysis of the produced water effluent collected from the Kuwait oil fields;
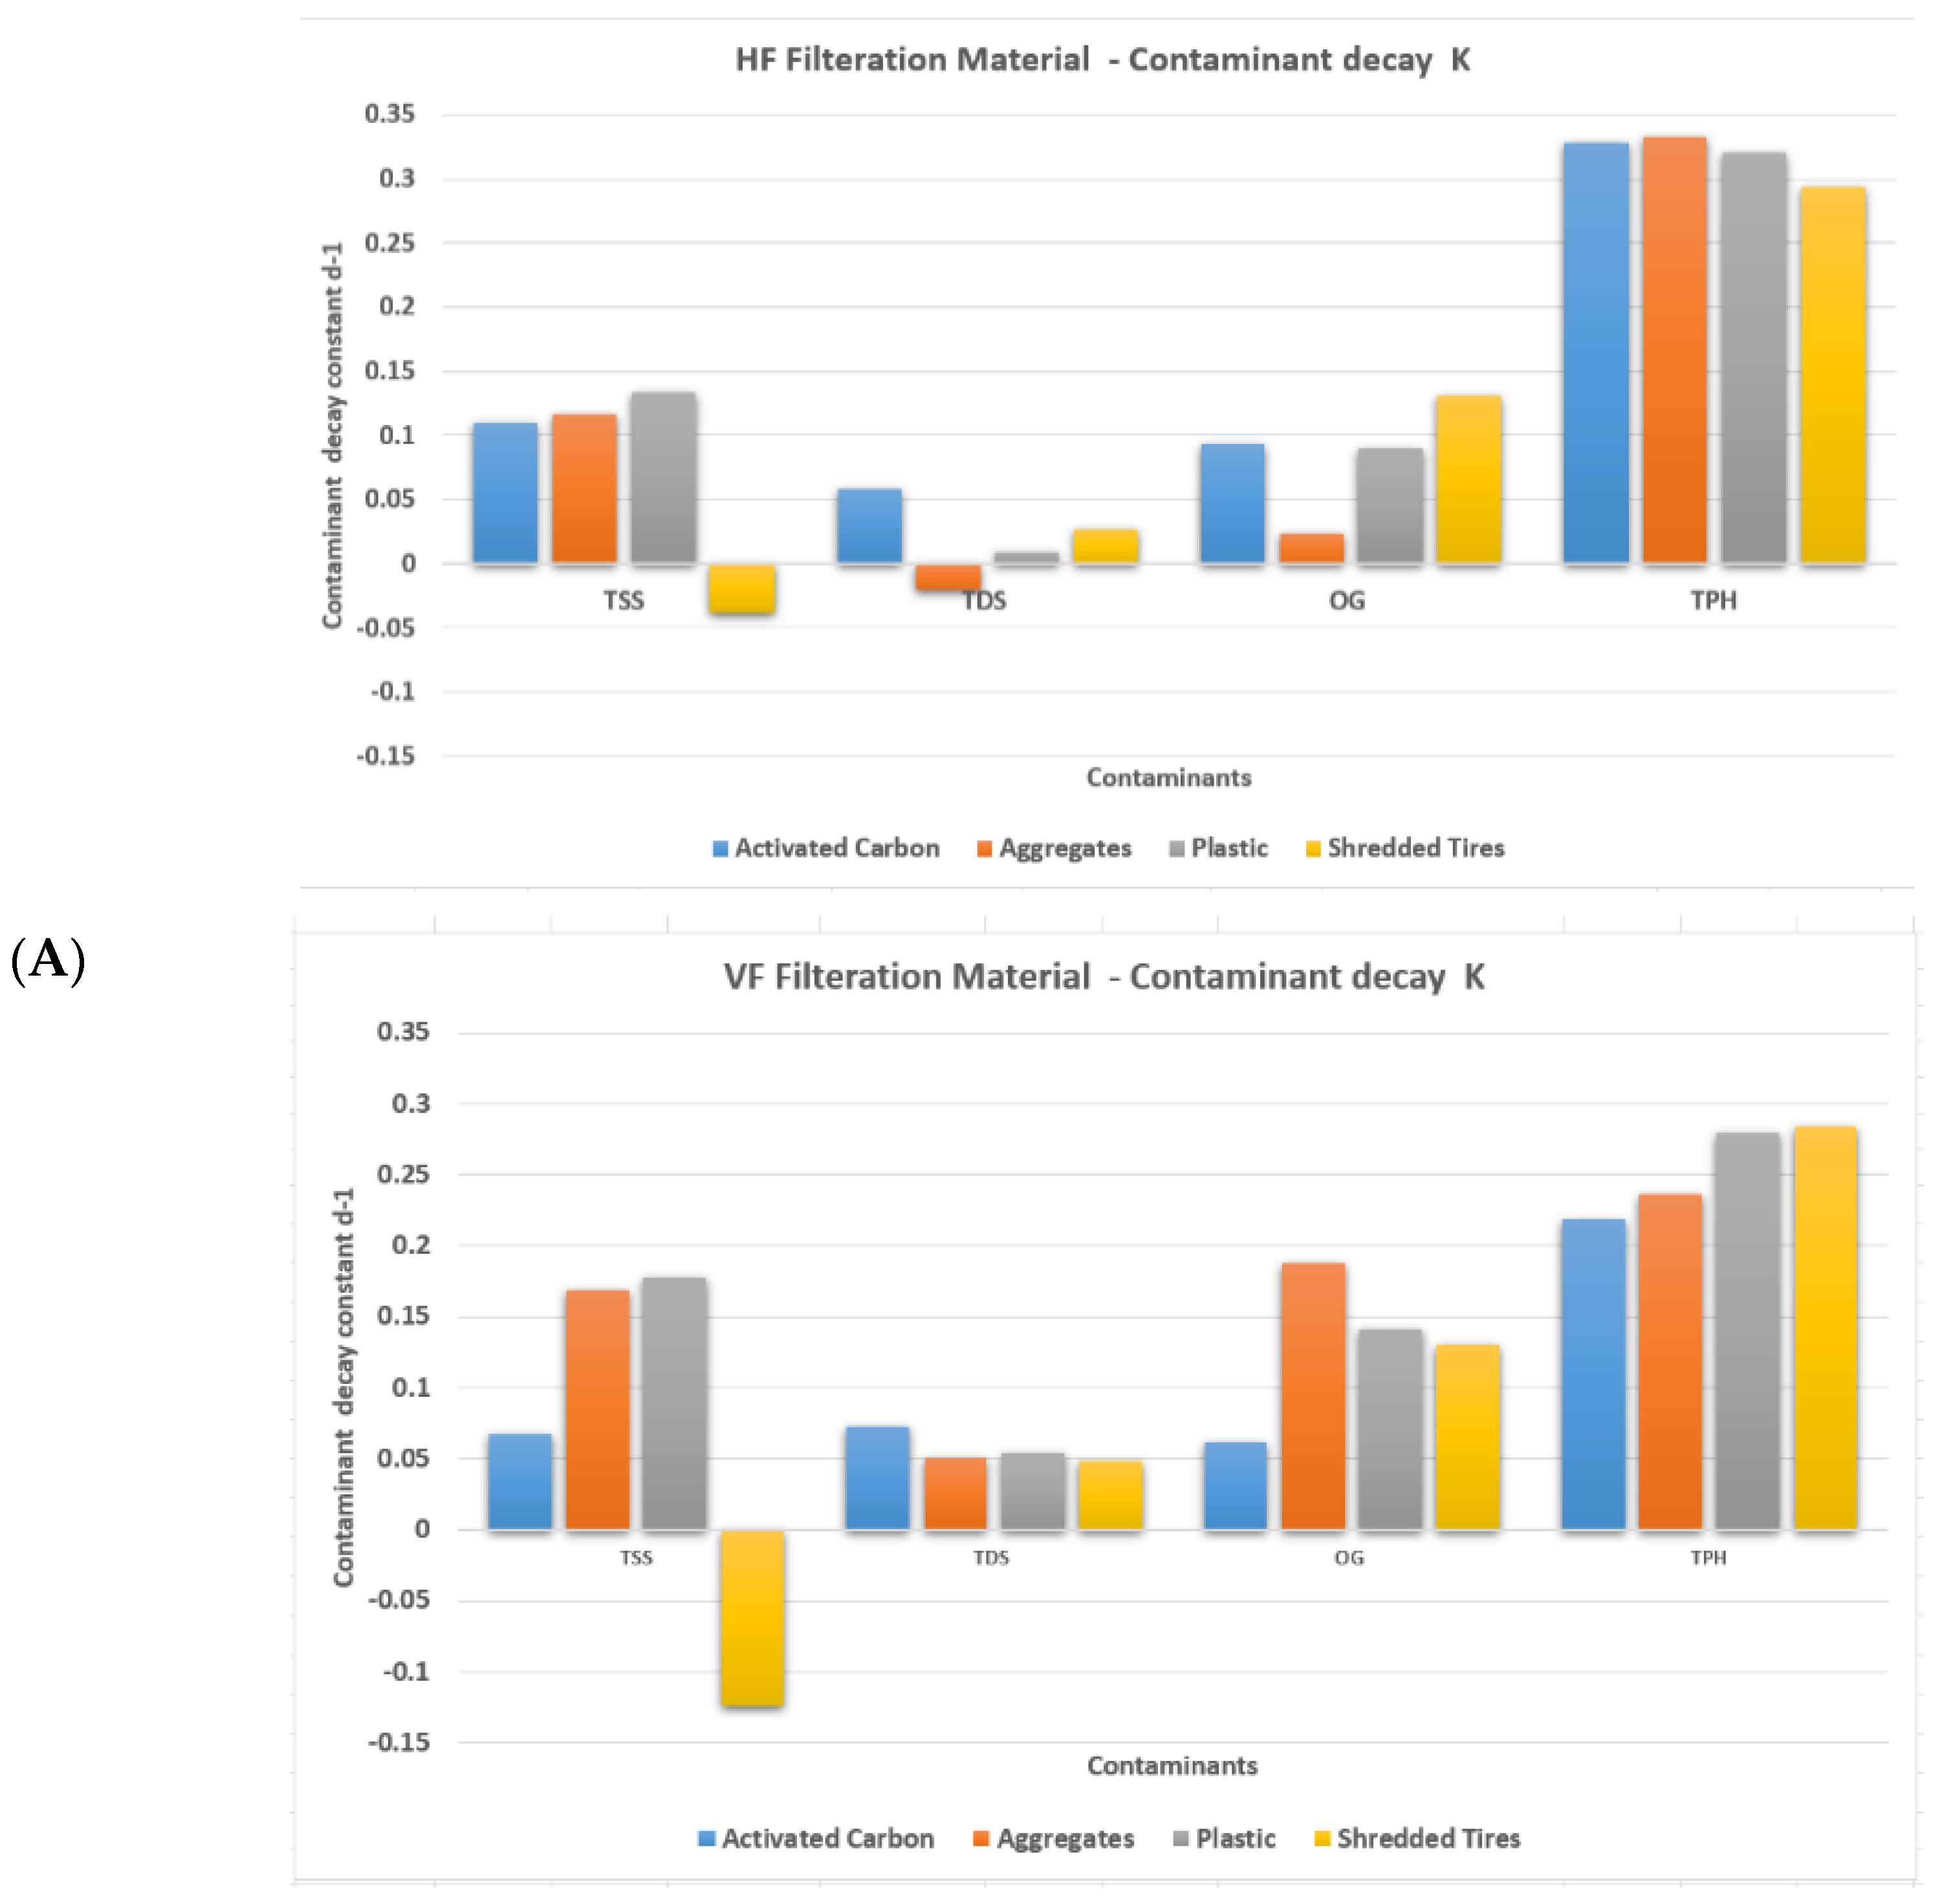
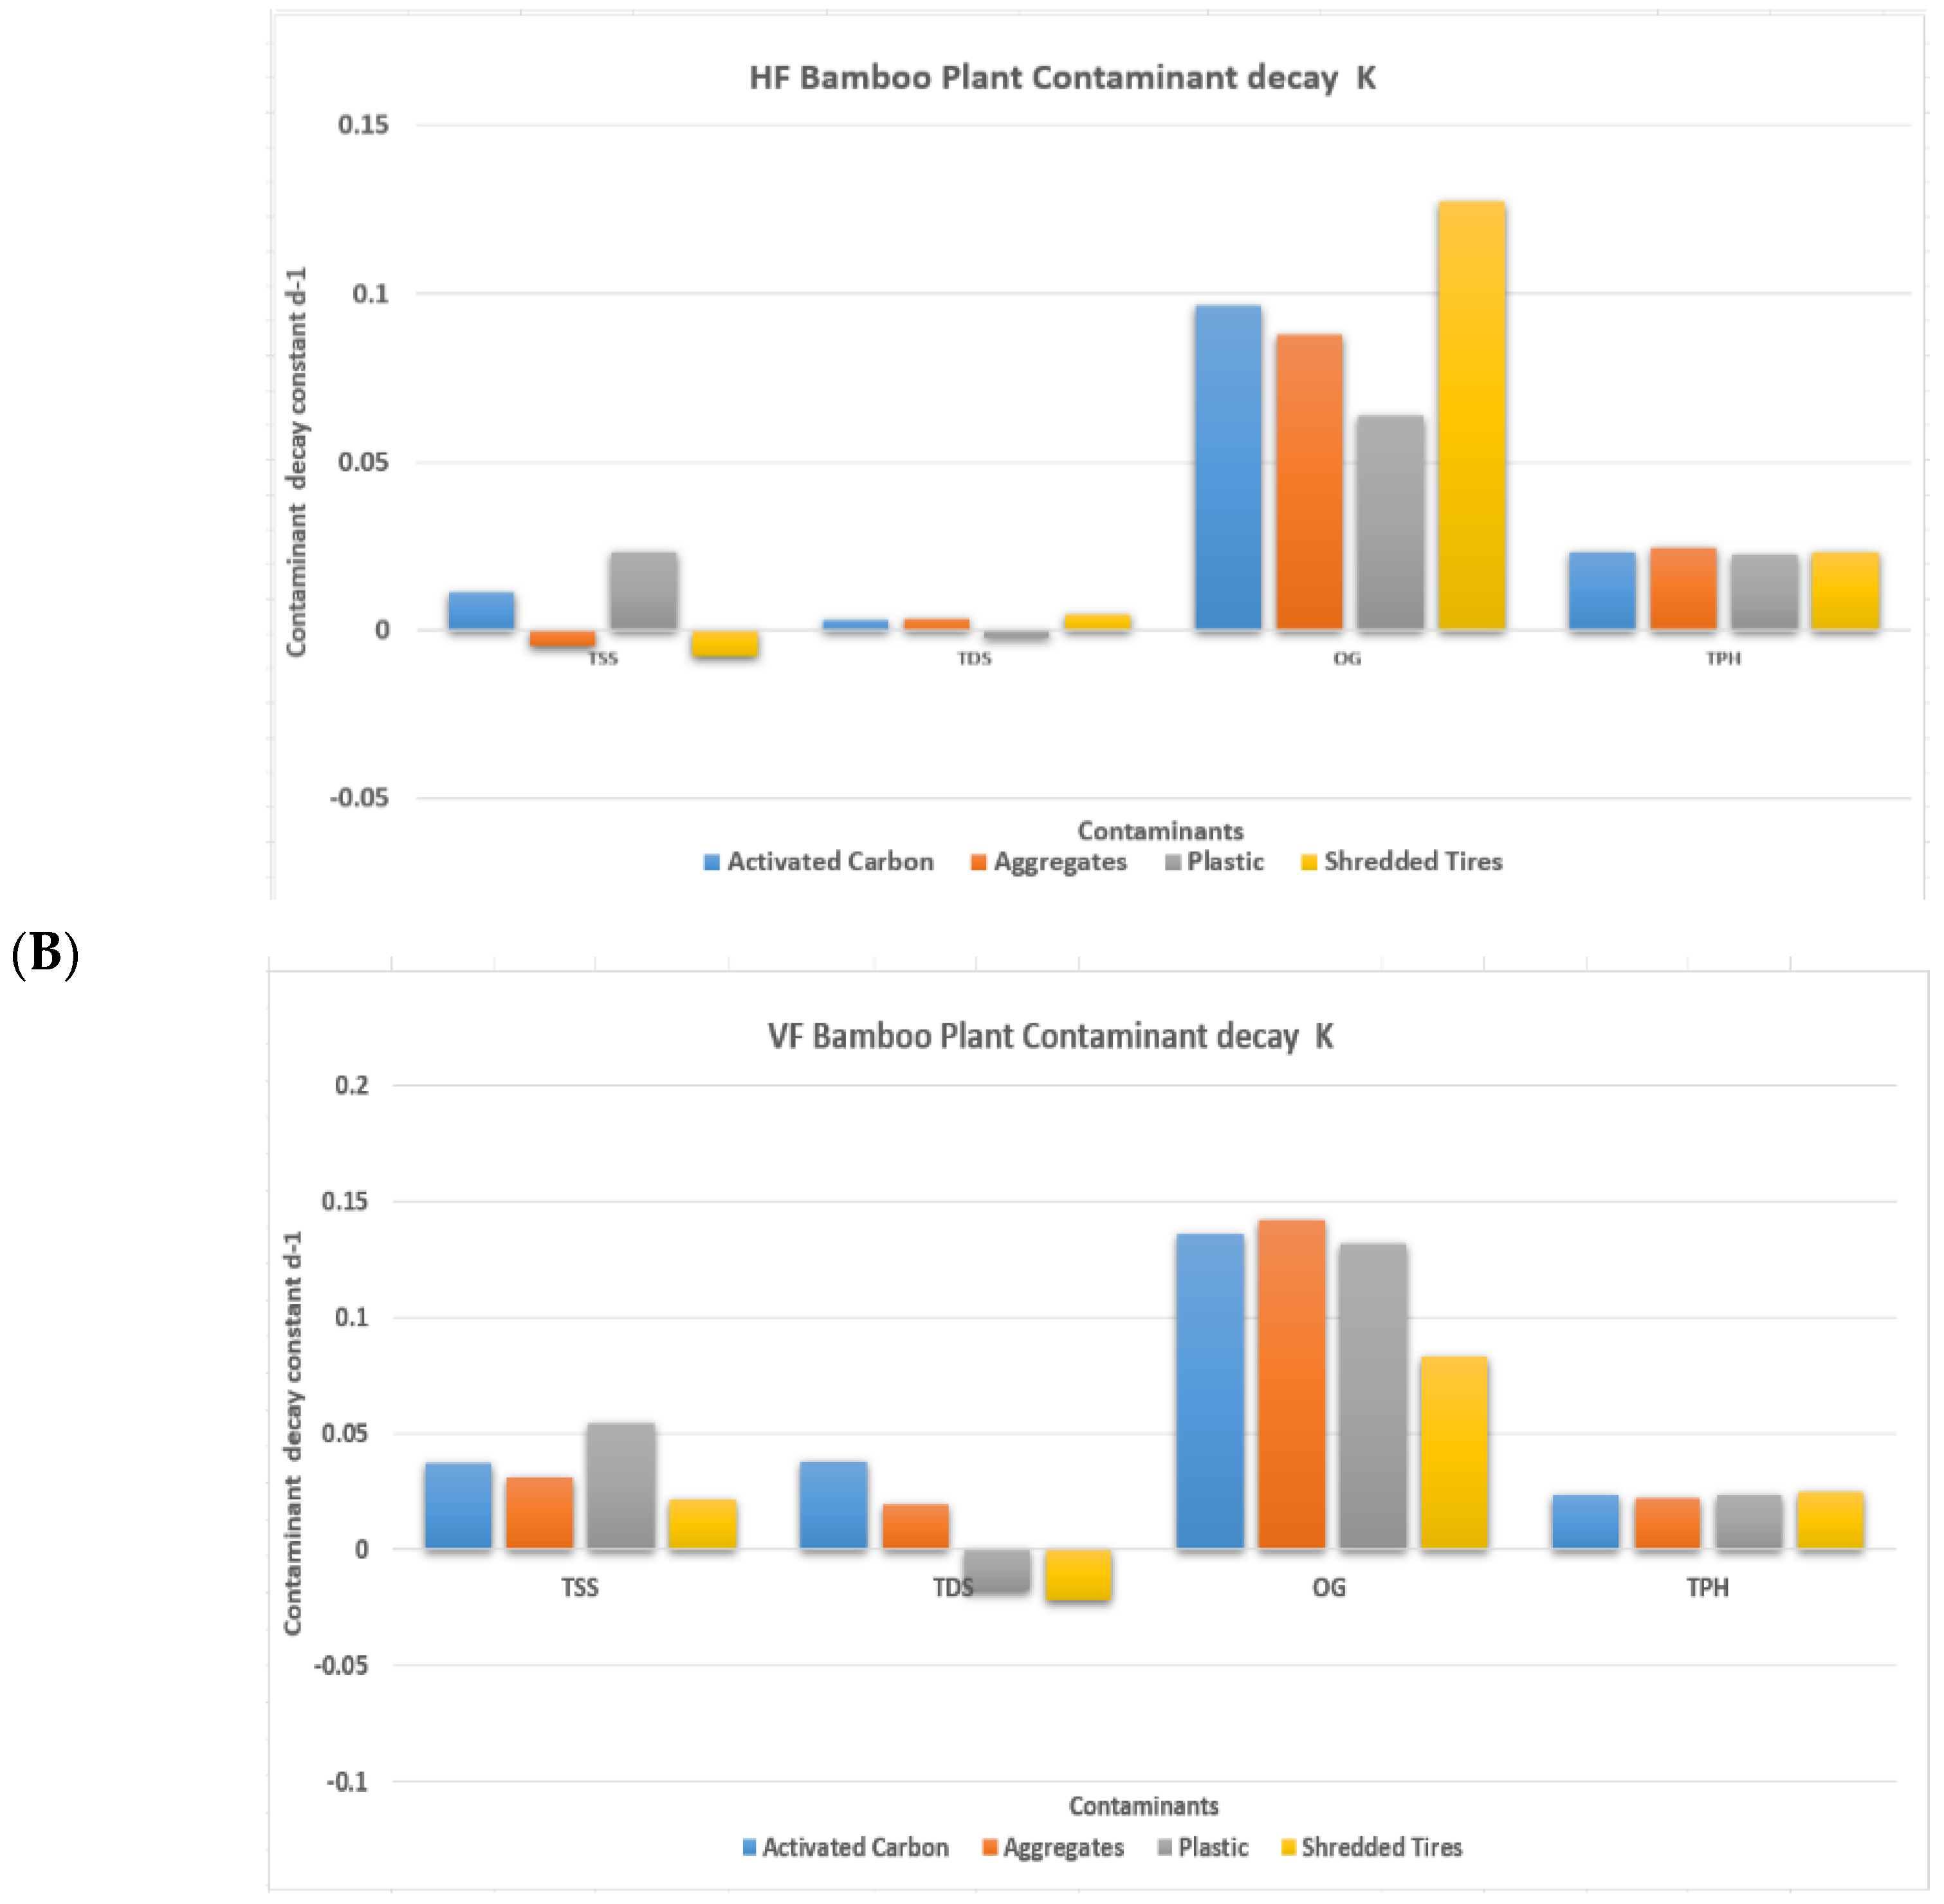
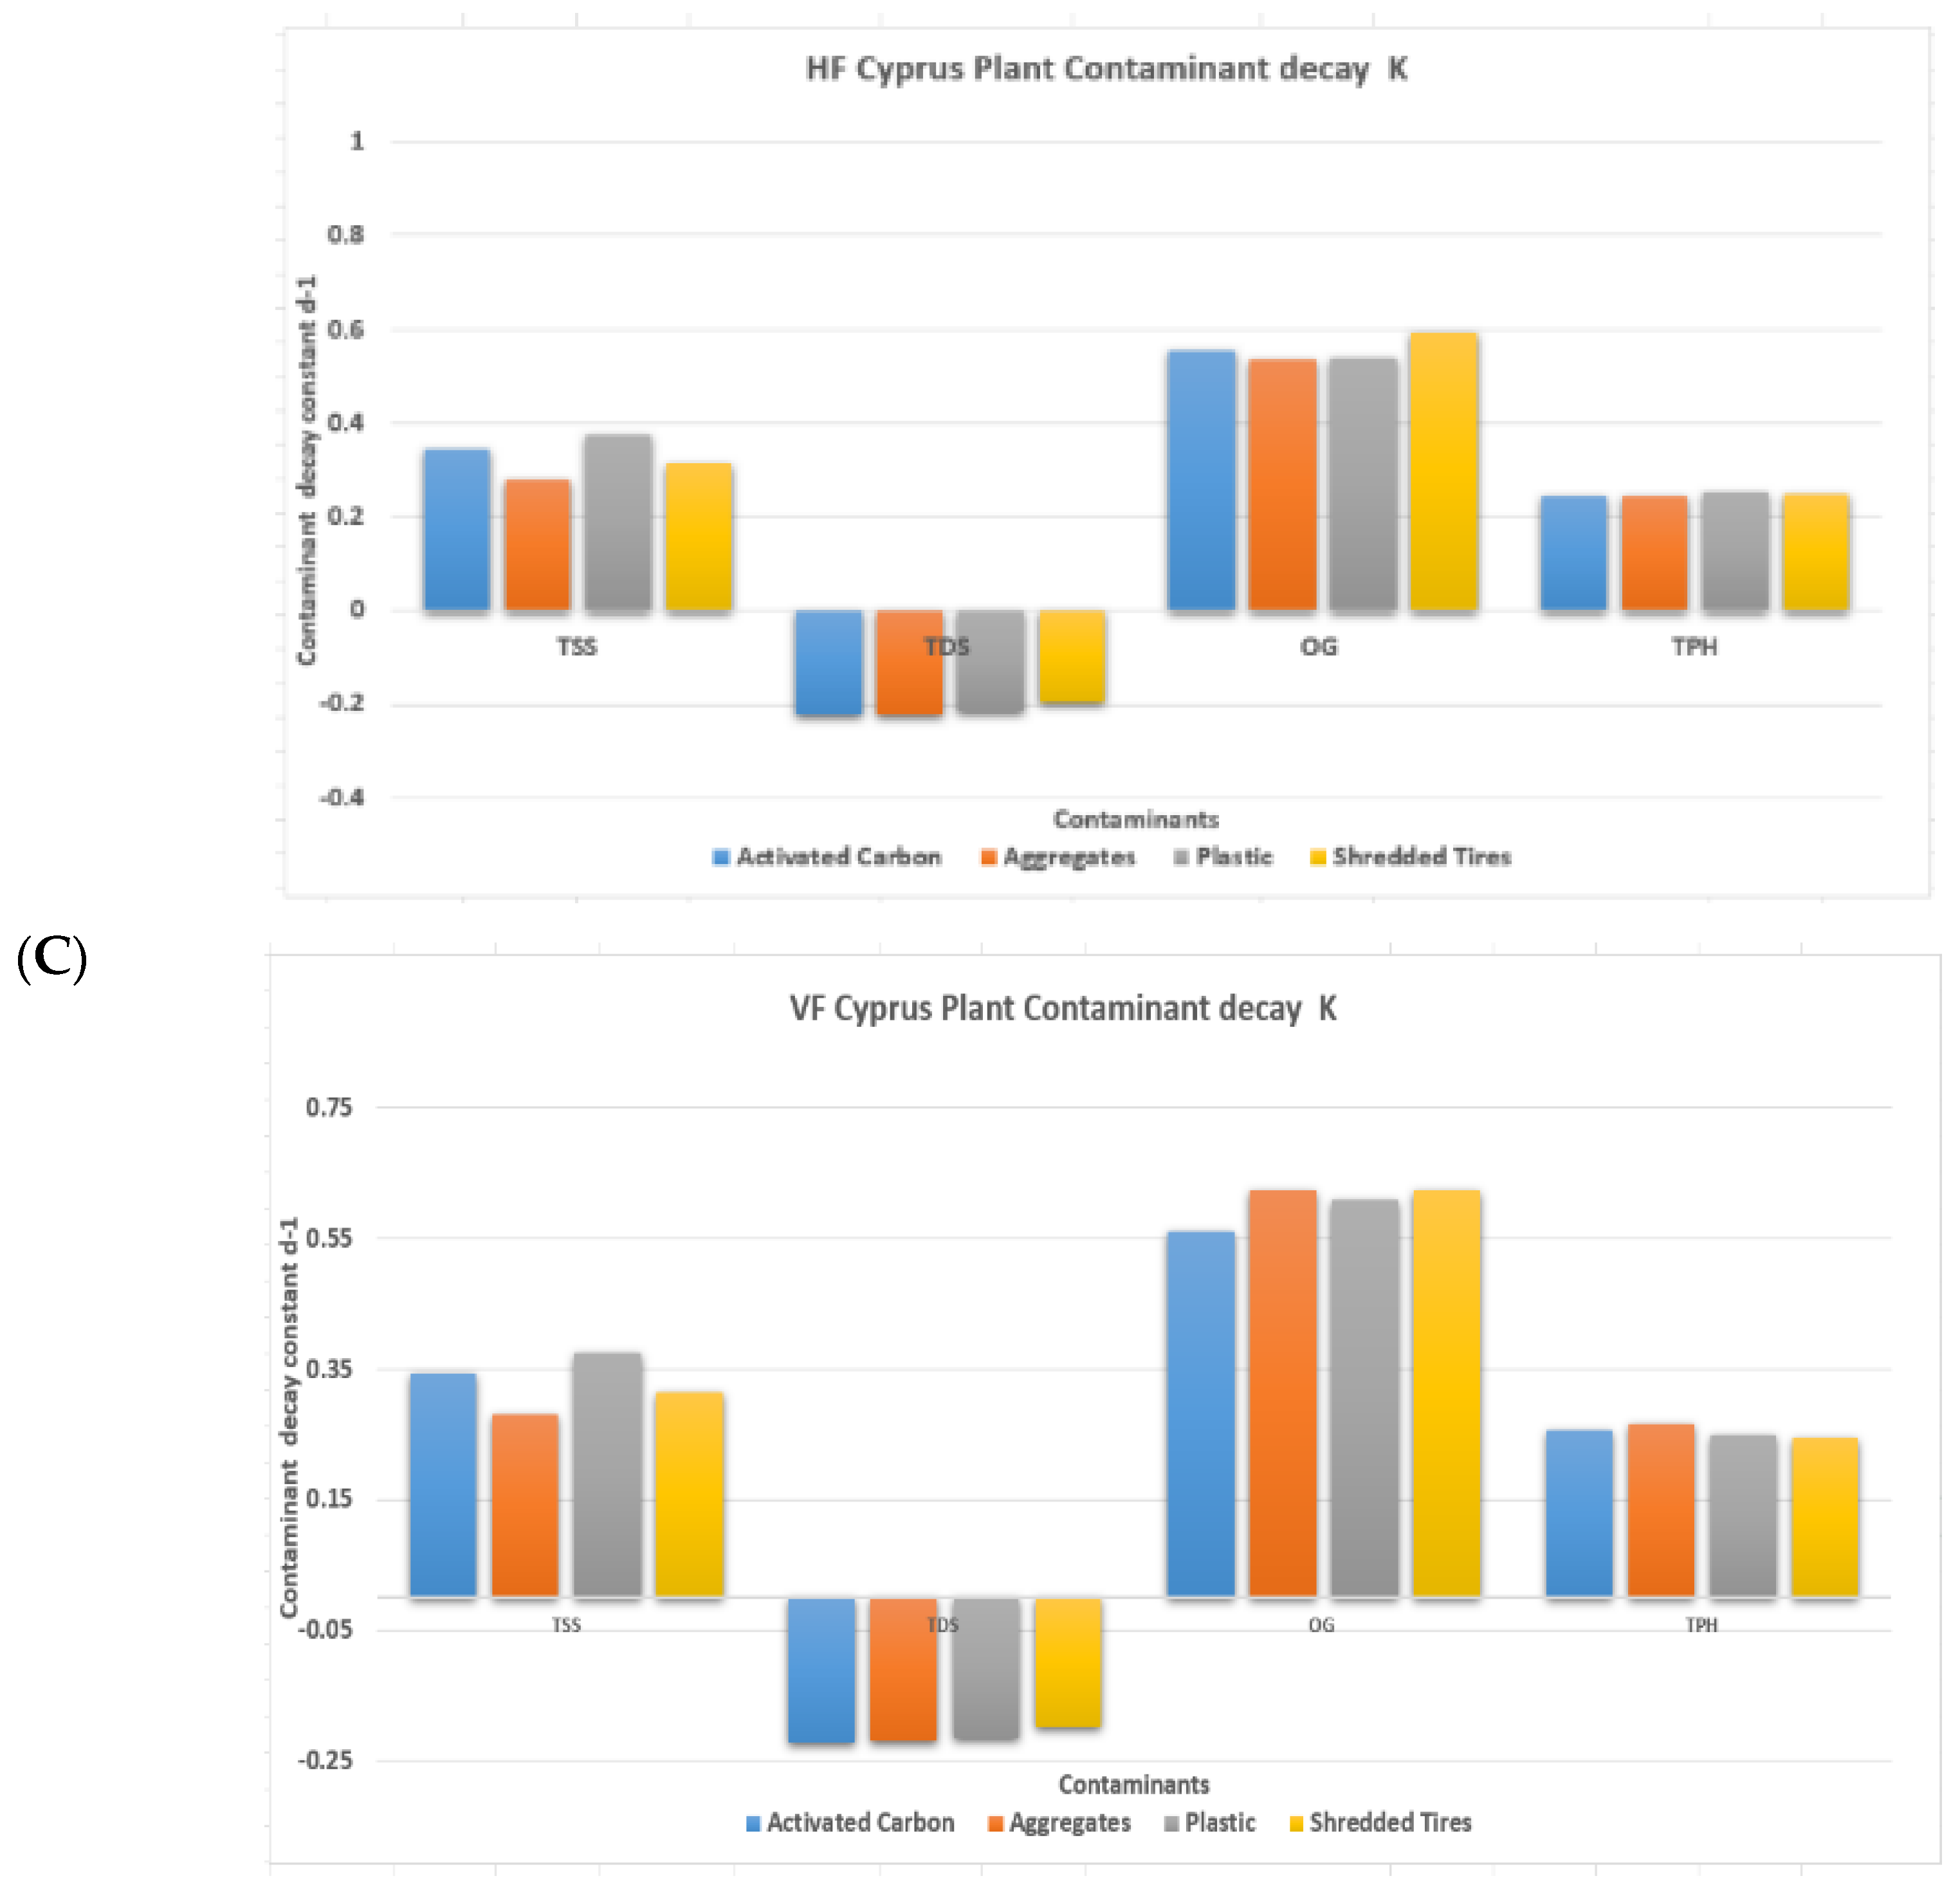
- Operation and monitoring of the CWs using main filter media from aggregates, activated carbon, plastic, and shredded tires. The lab-scale wetlands were operated unplanted first, then Bamboo plants were added to the systems, and finally, Bamboo was replaced with Cyperus plants to test the efficiency of the different materials with and without plants;
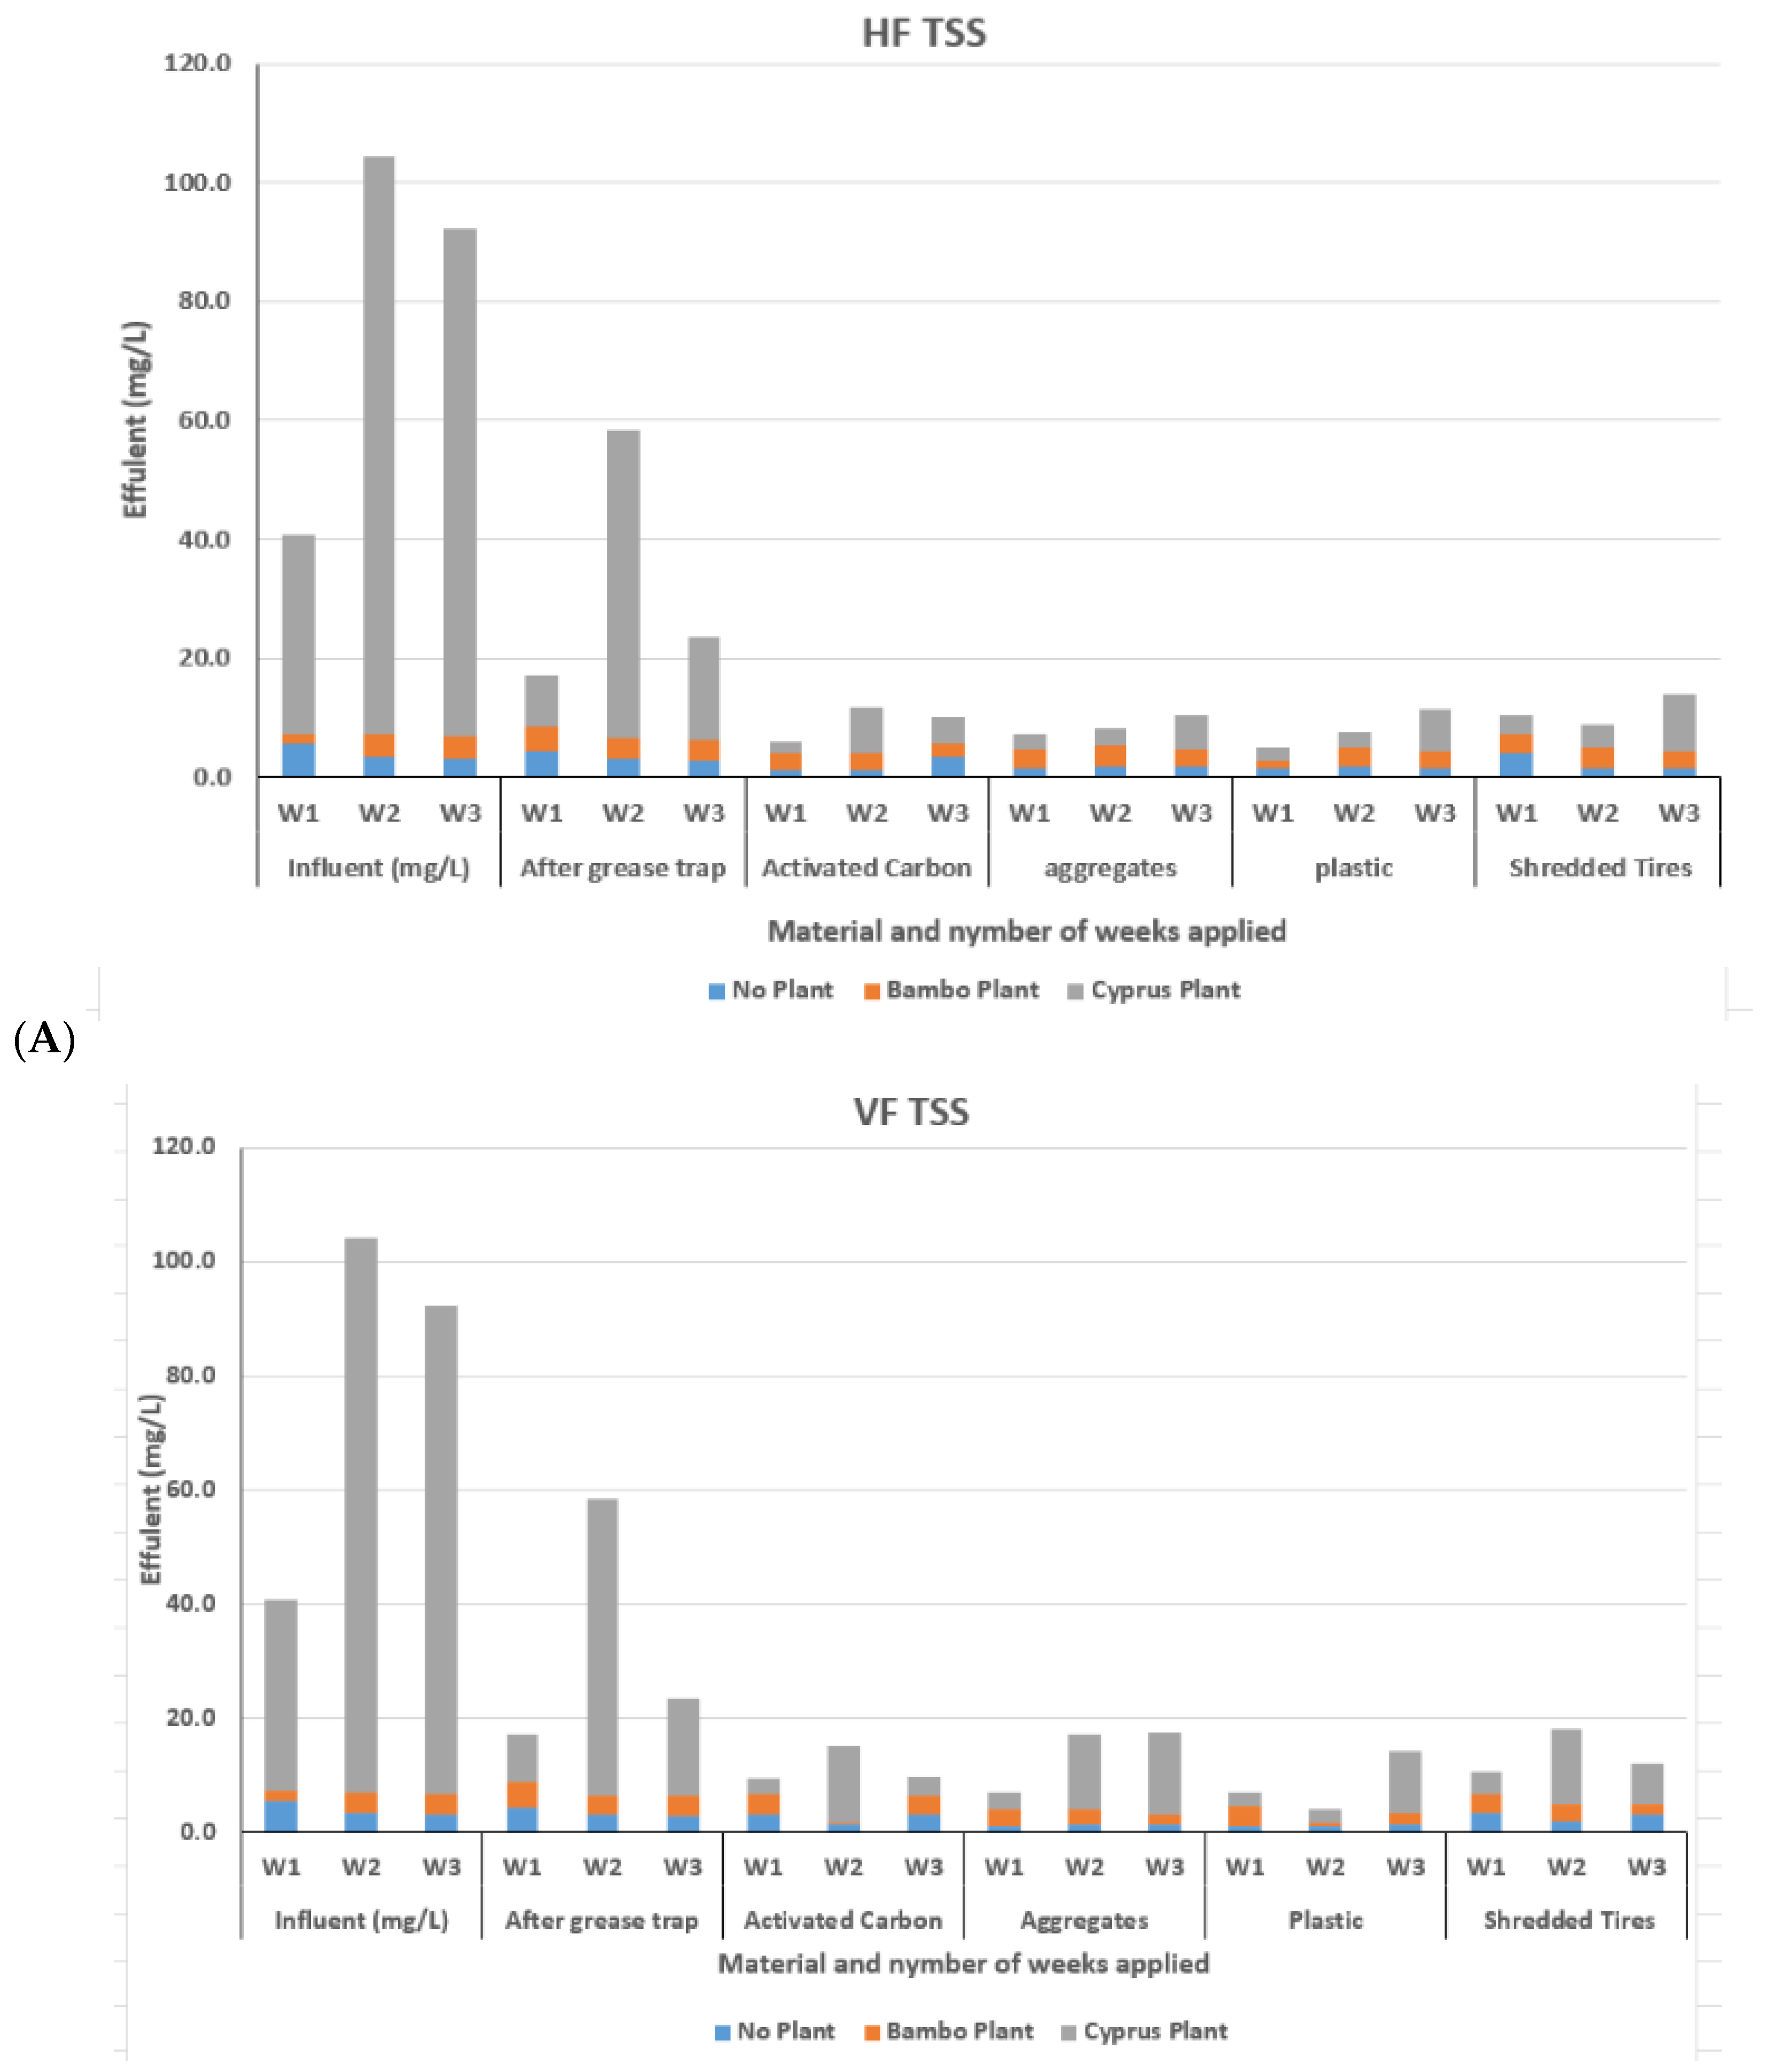
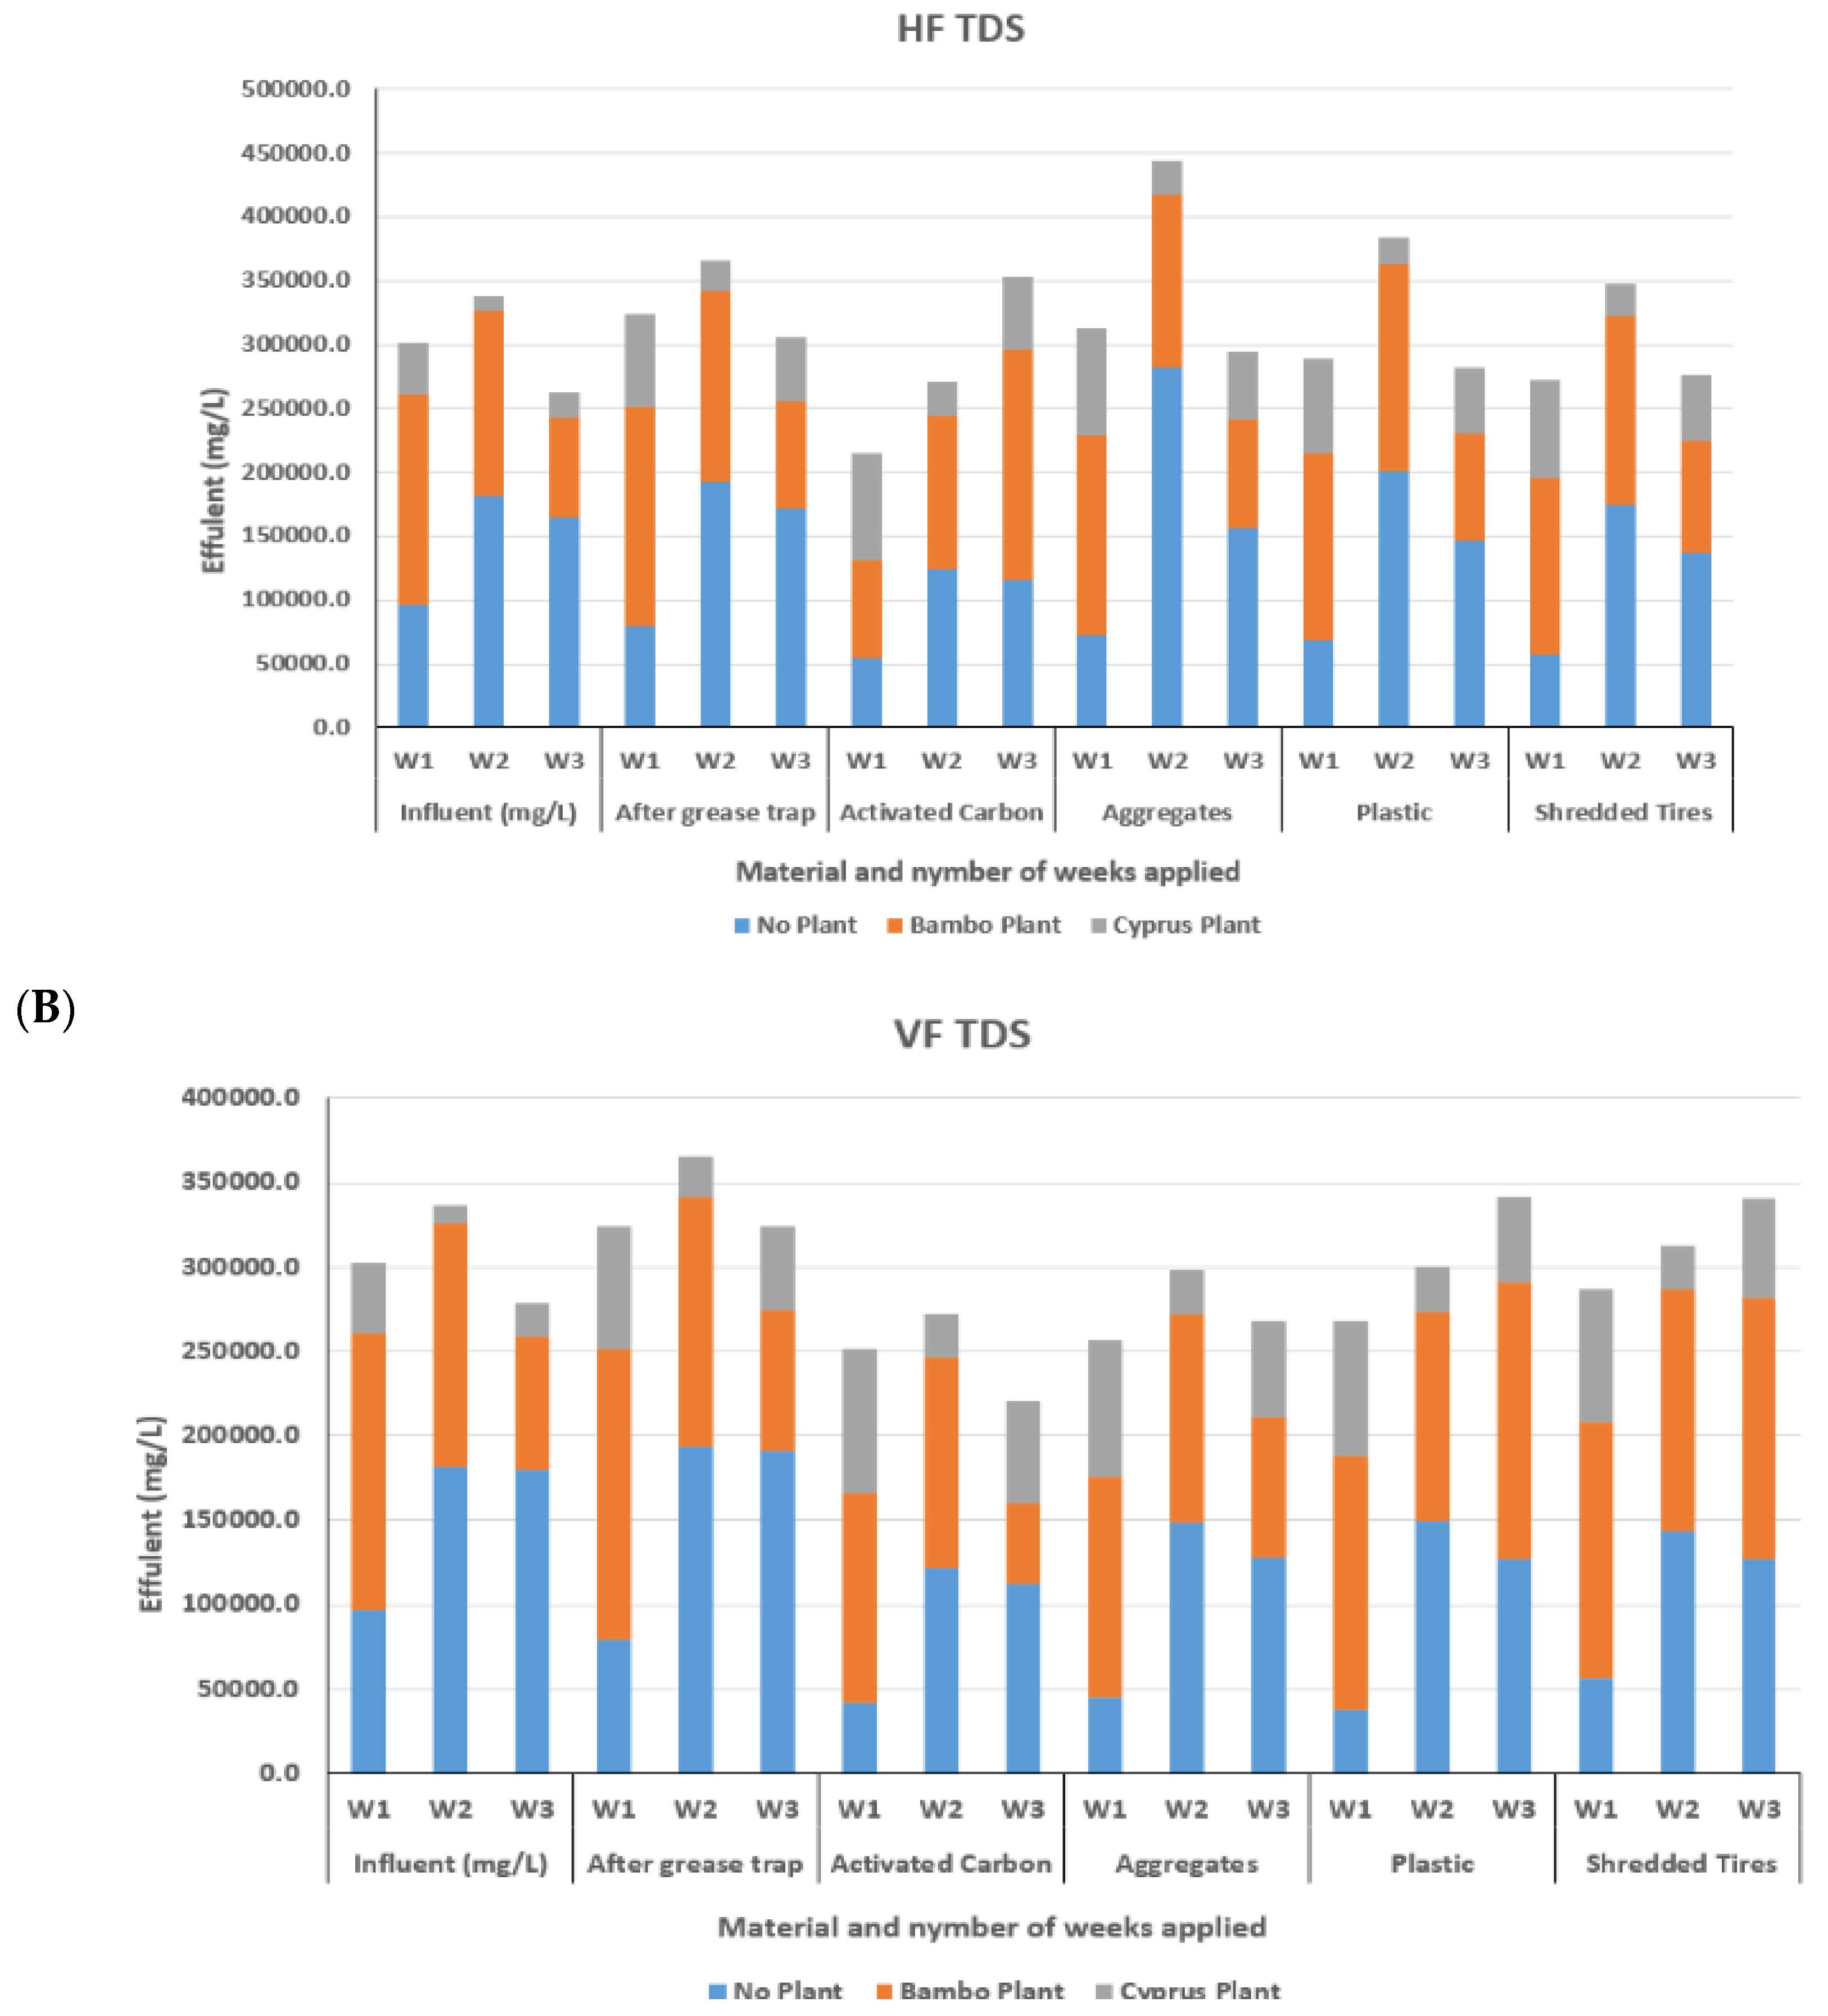
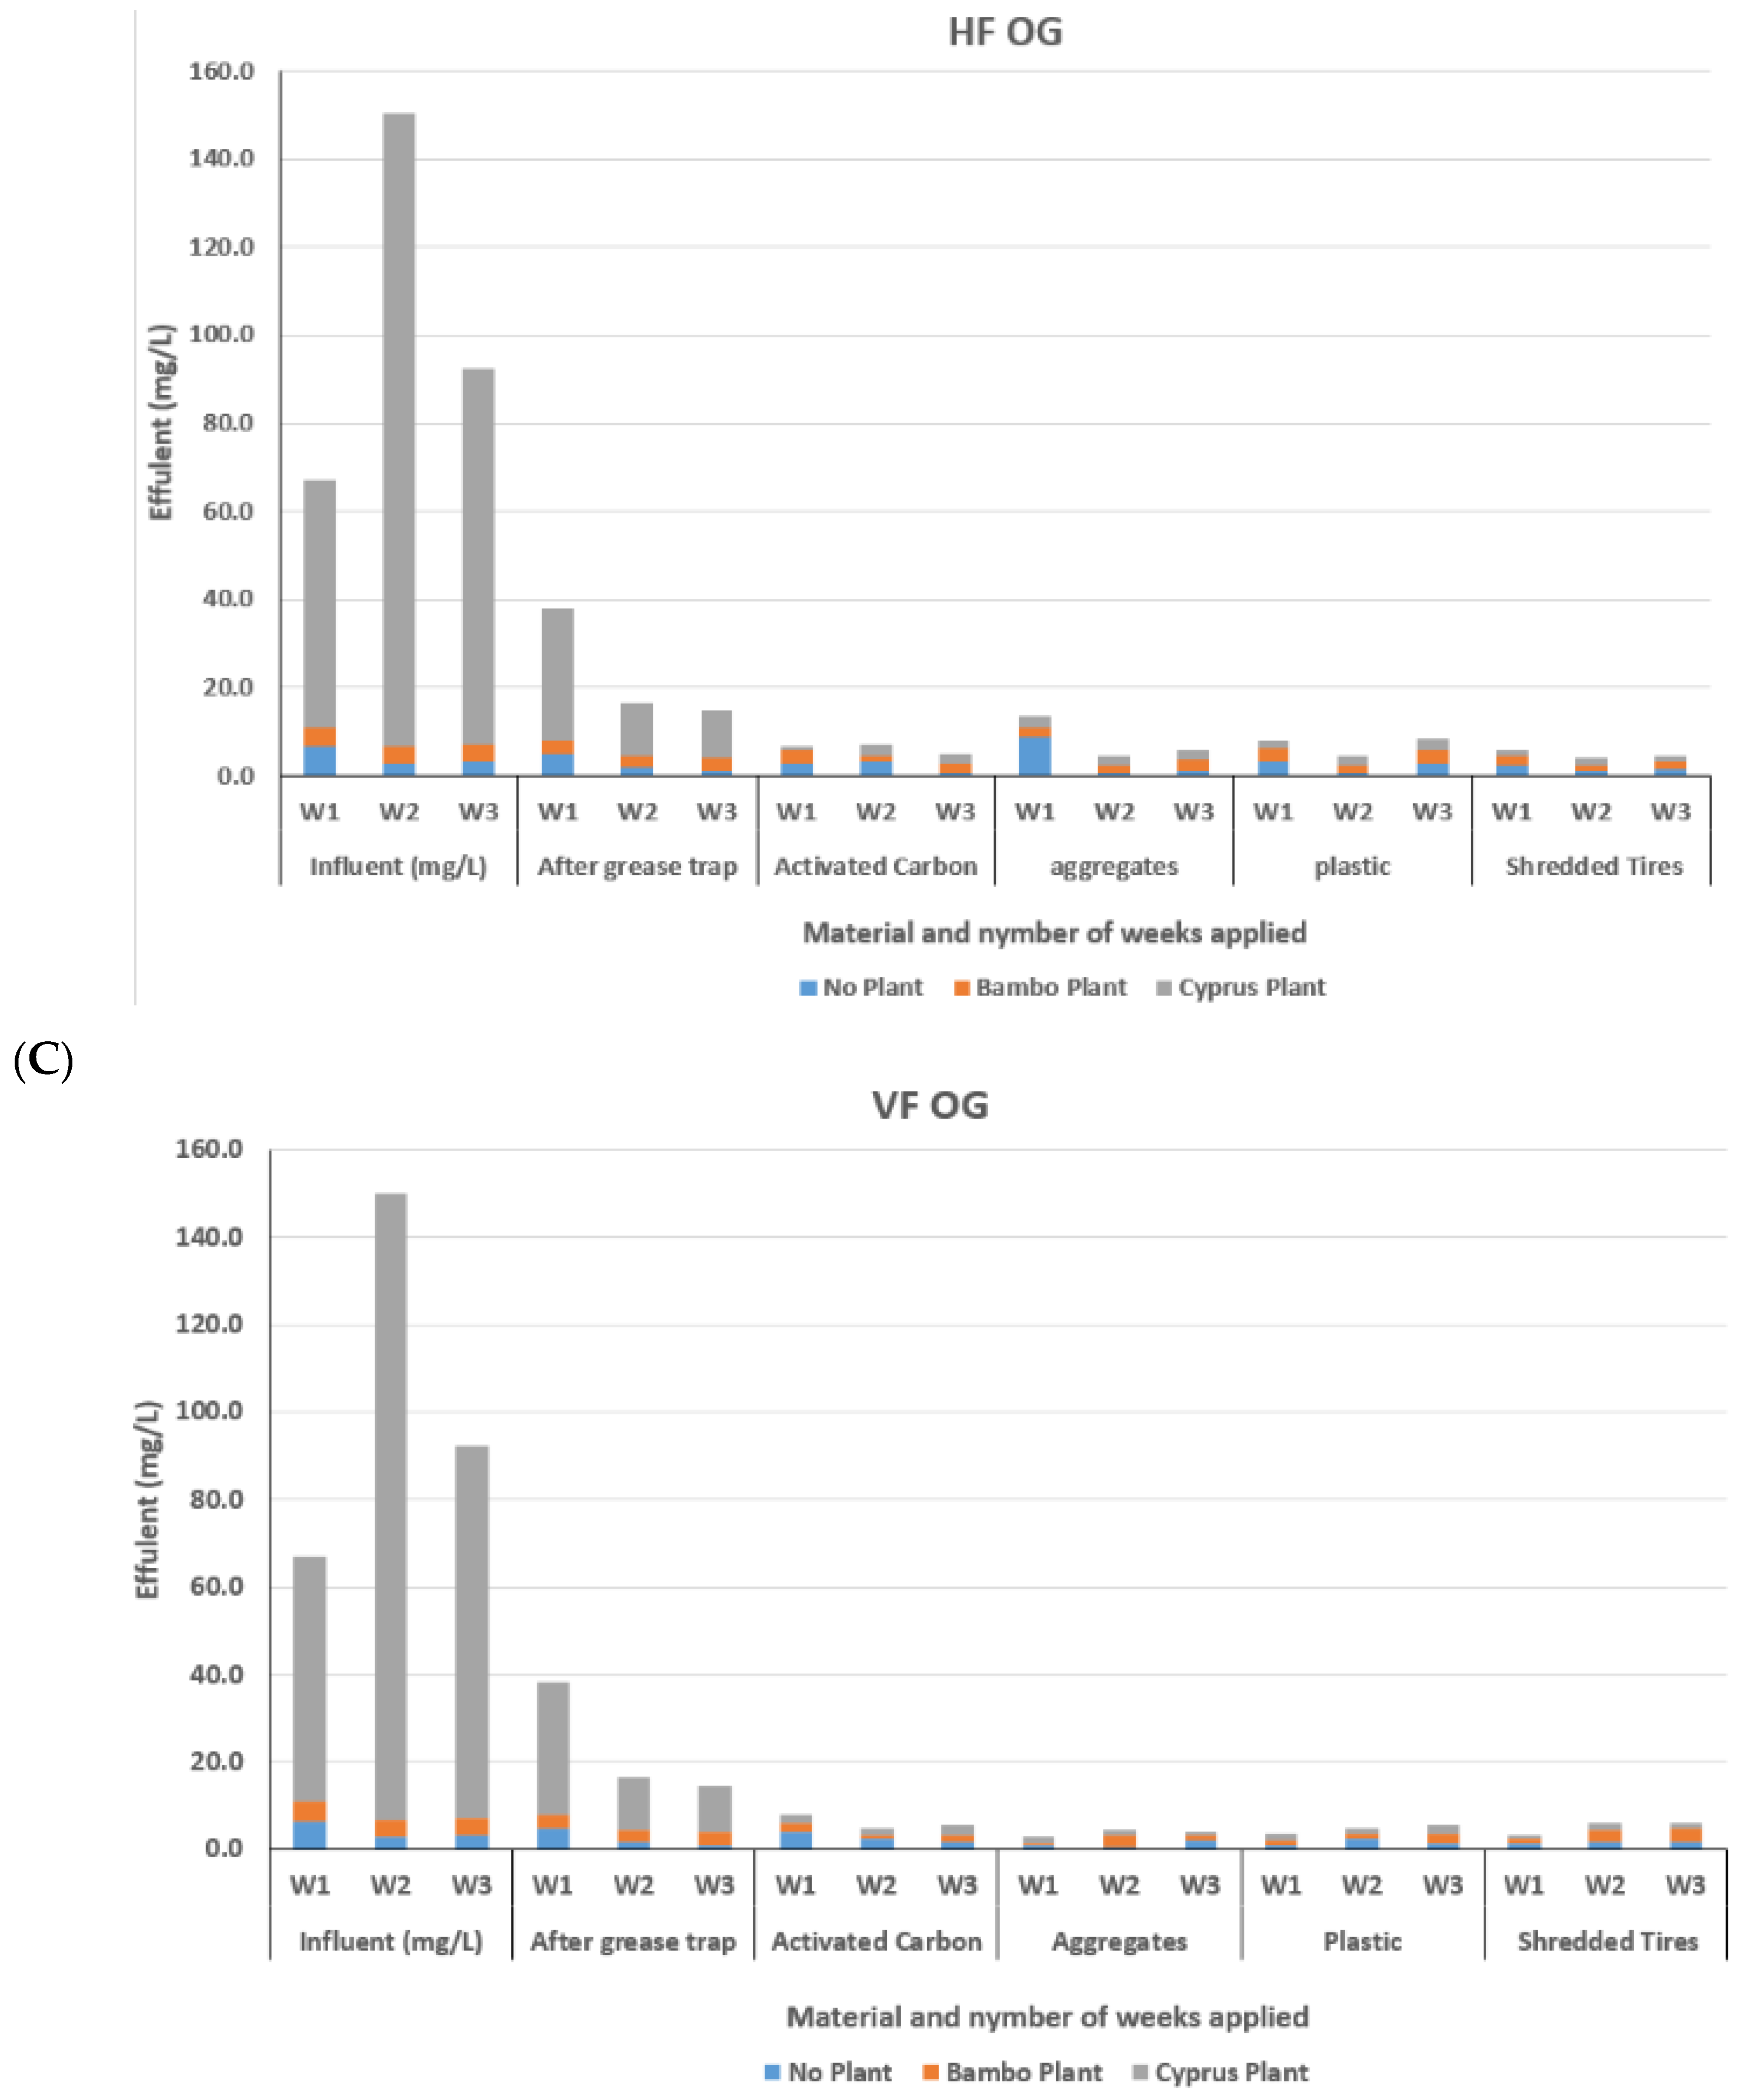
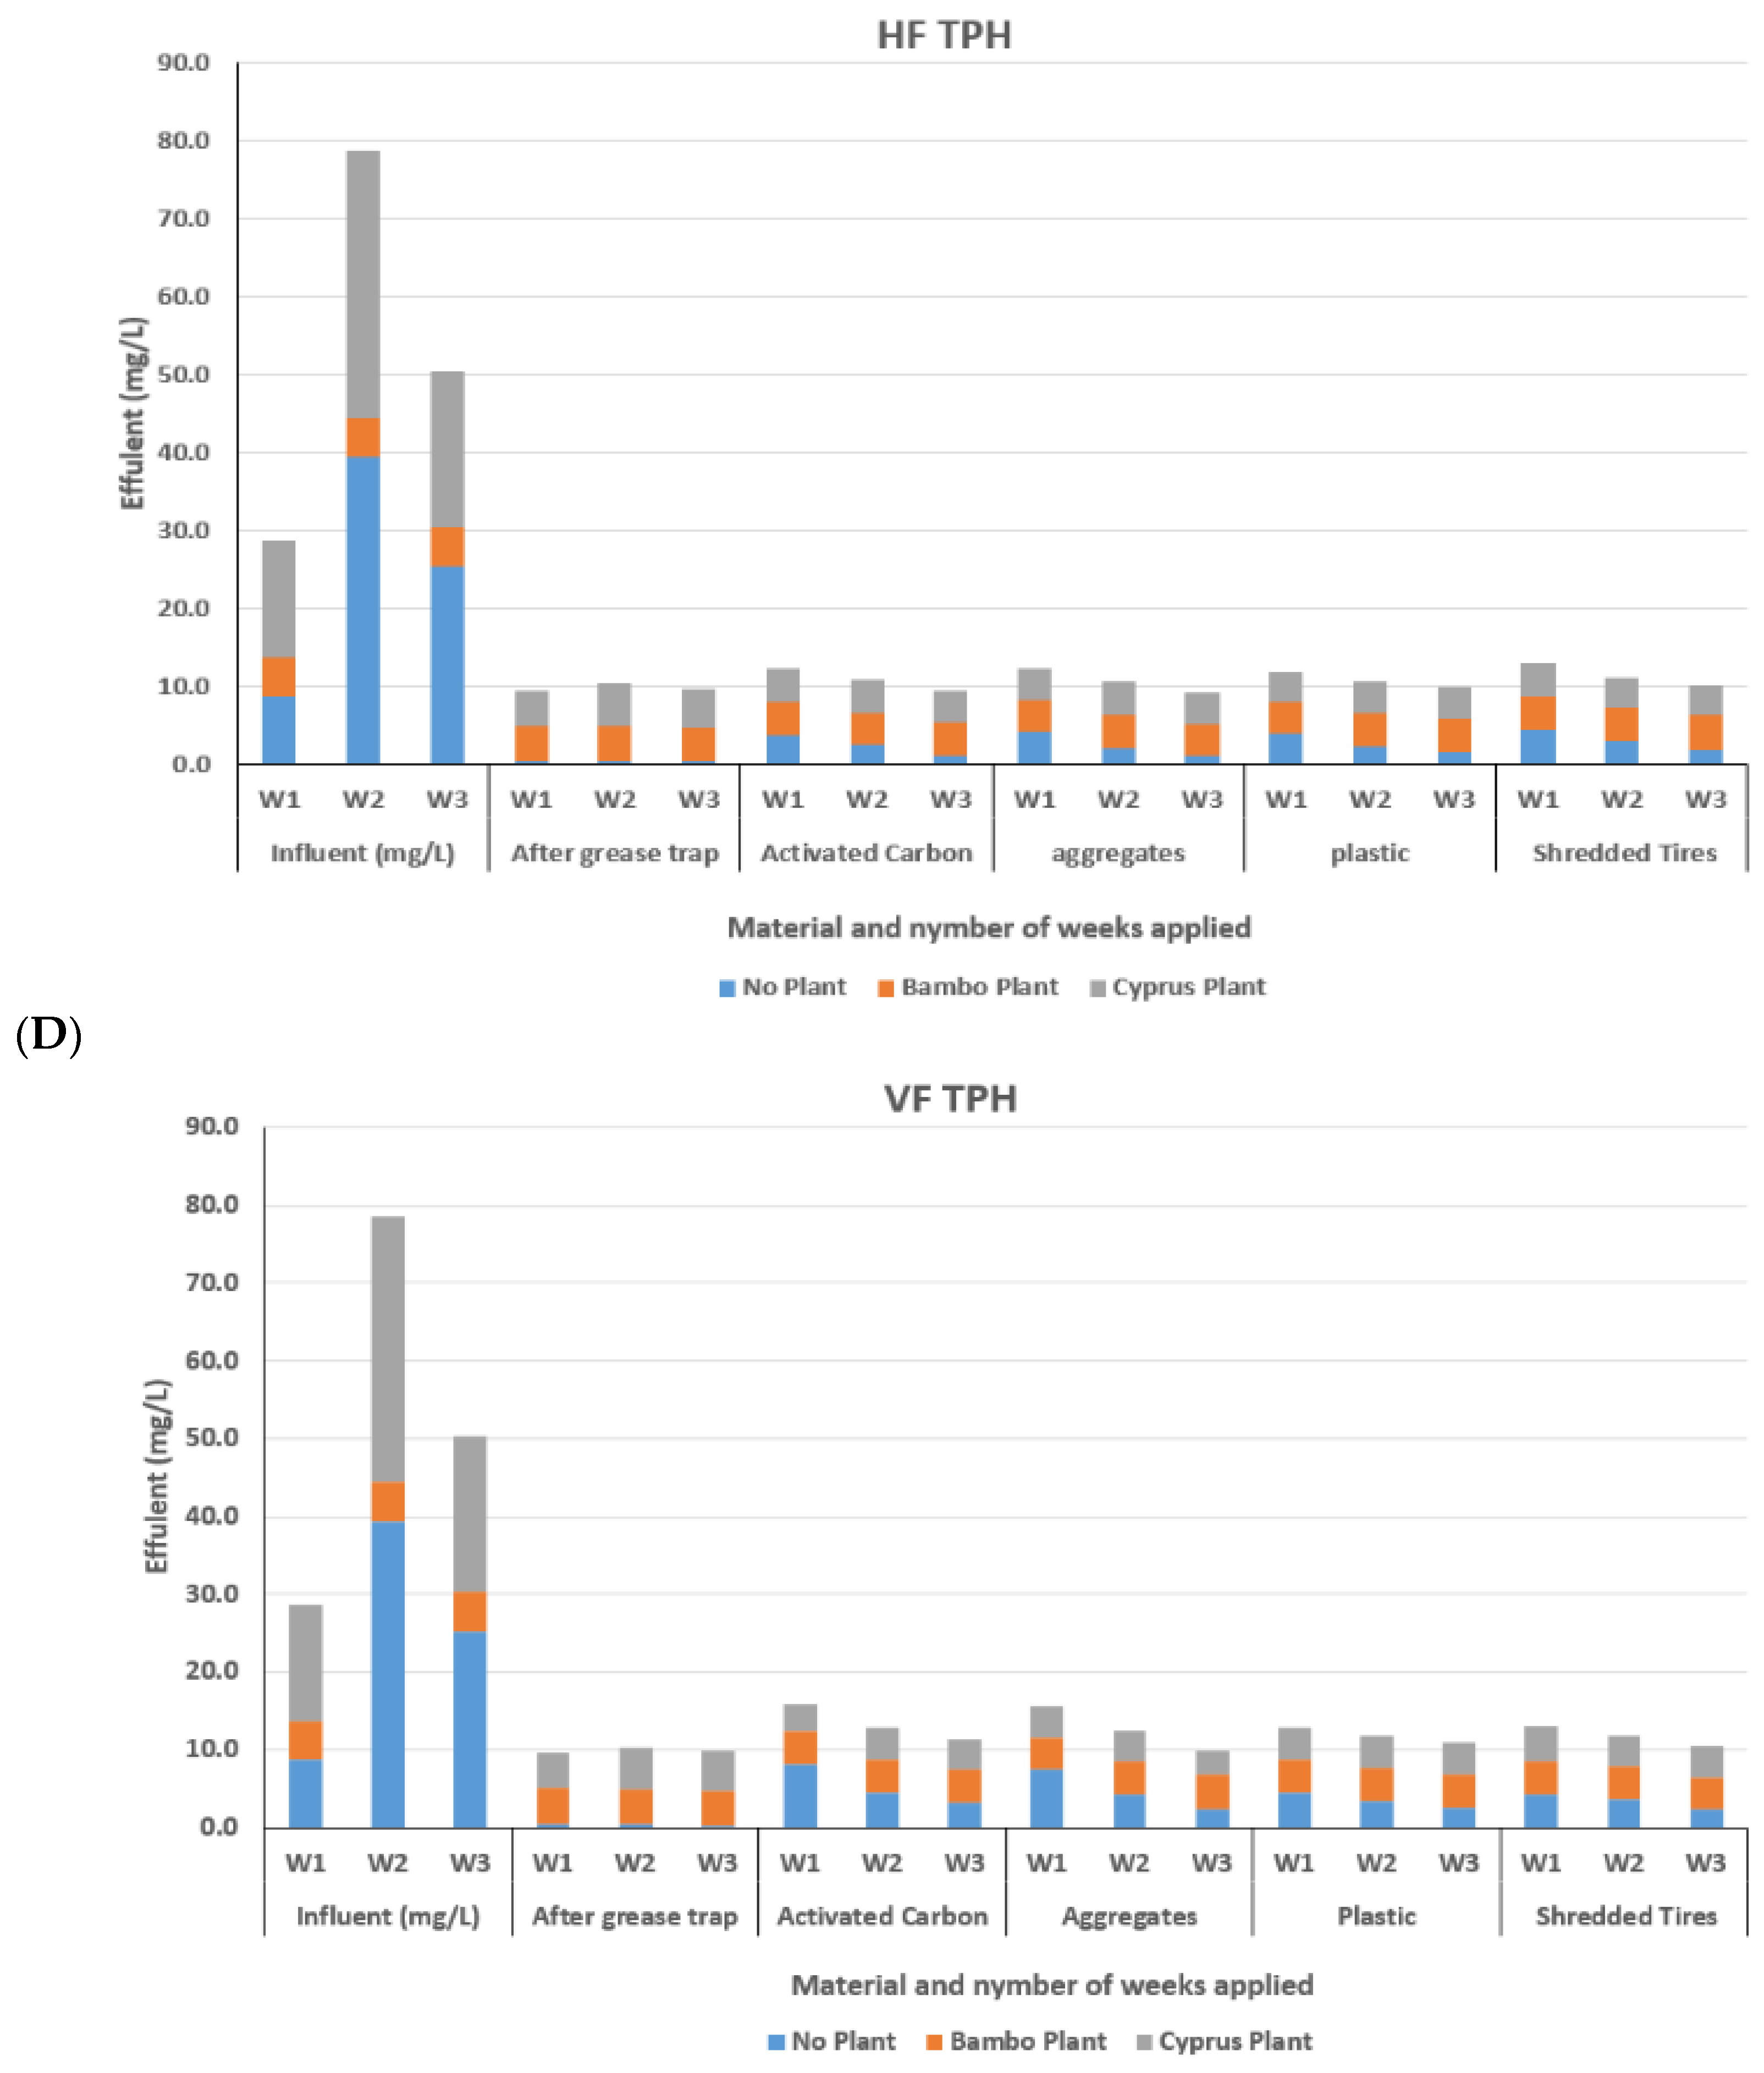
- Examine the effectiveness of CWs for the treatment of petroleum-contaminated wastewater concerning Total Petroleum Hydrocarbons (TPH), Oil and Grease (OG), Total Suspended Solids (TSS), and Total Dissolved Solids (TDS).
2. Research Methodology
2.1. Design and Materials
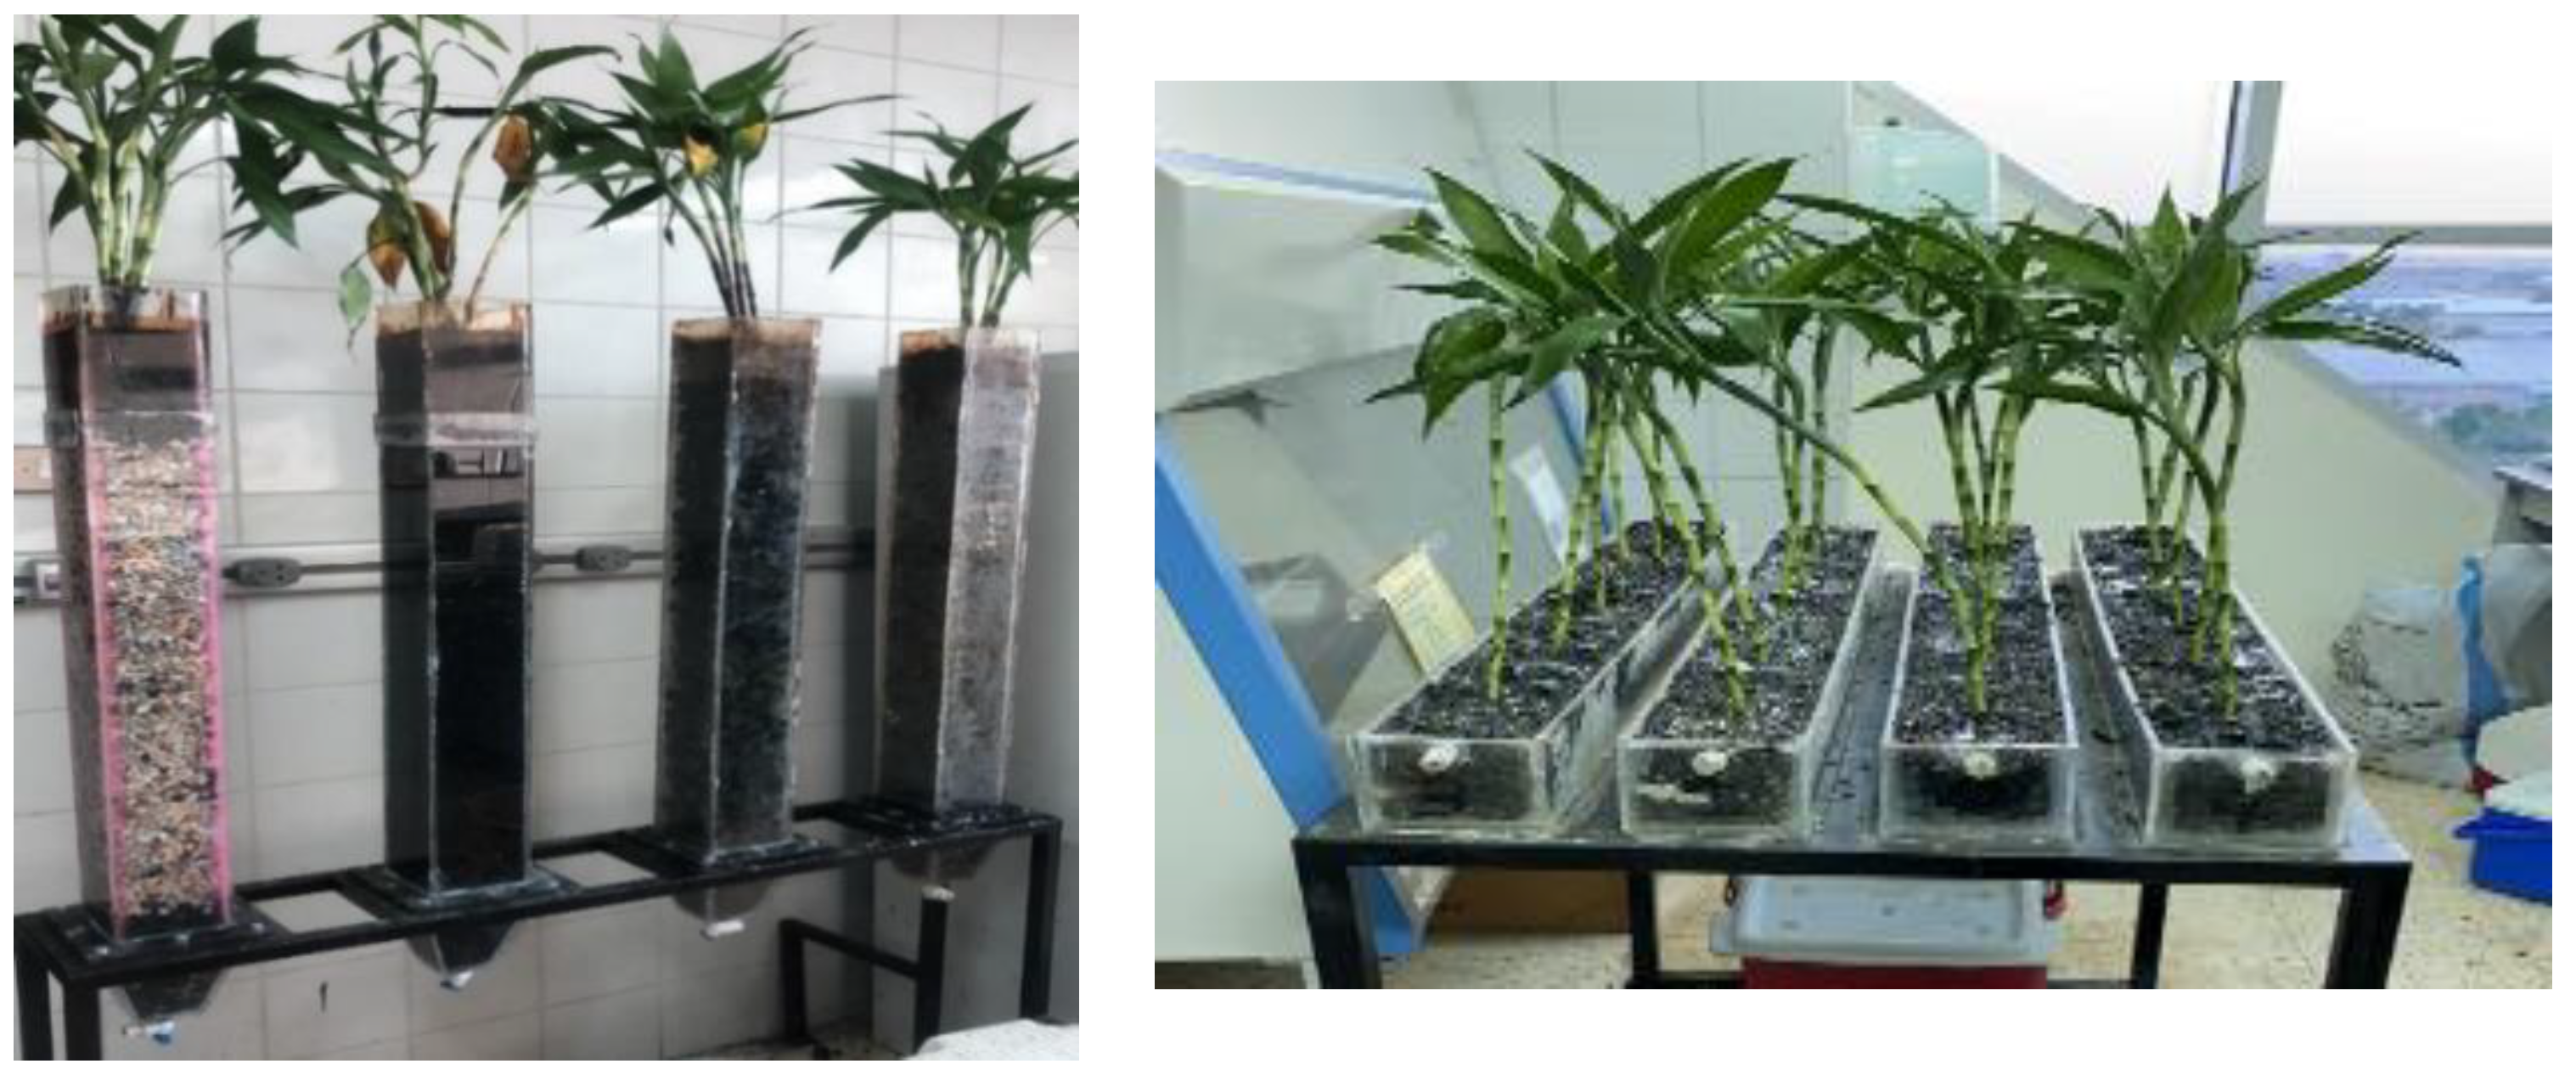
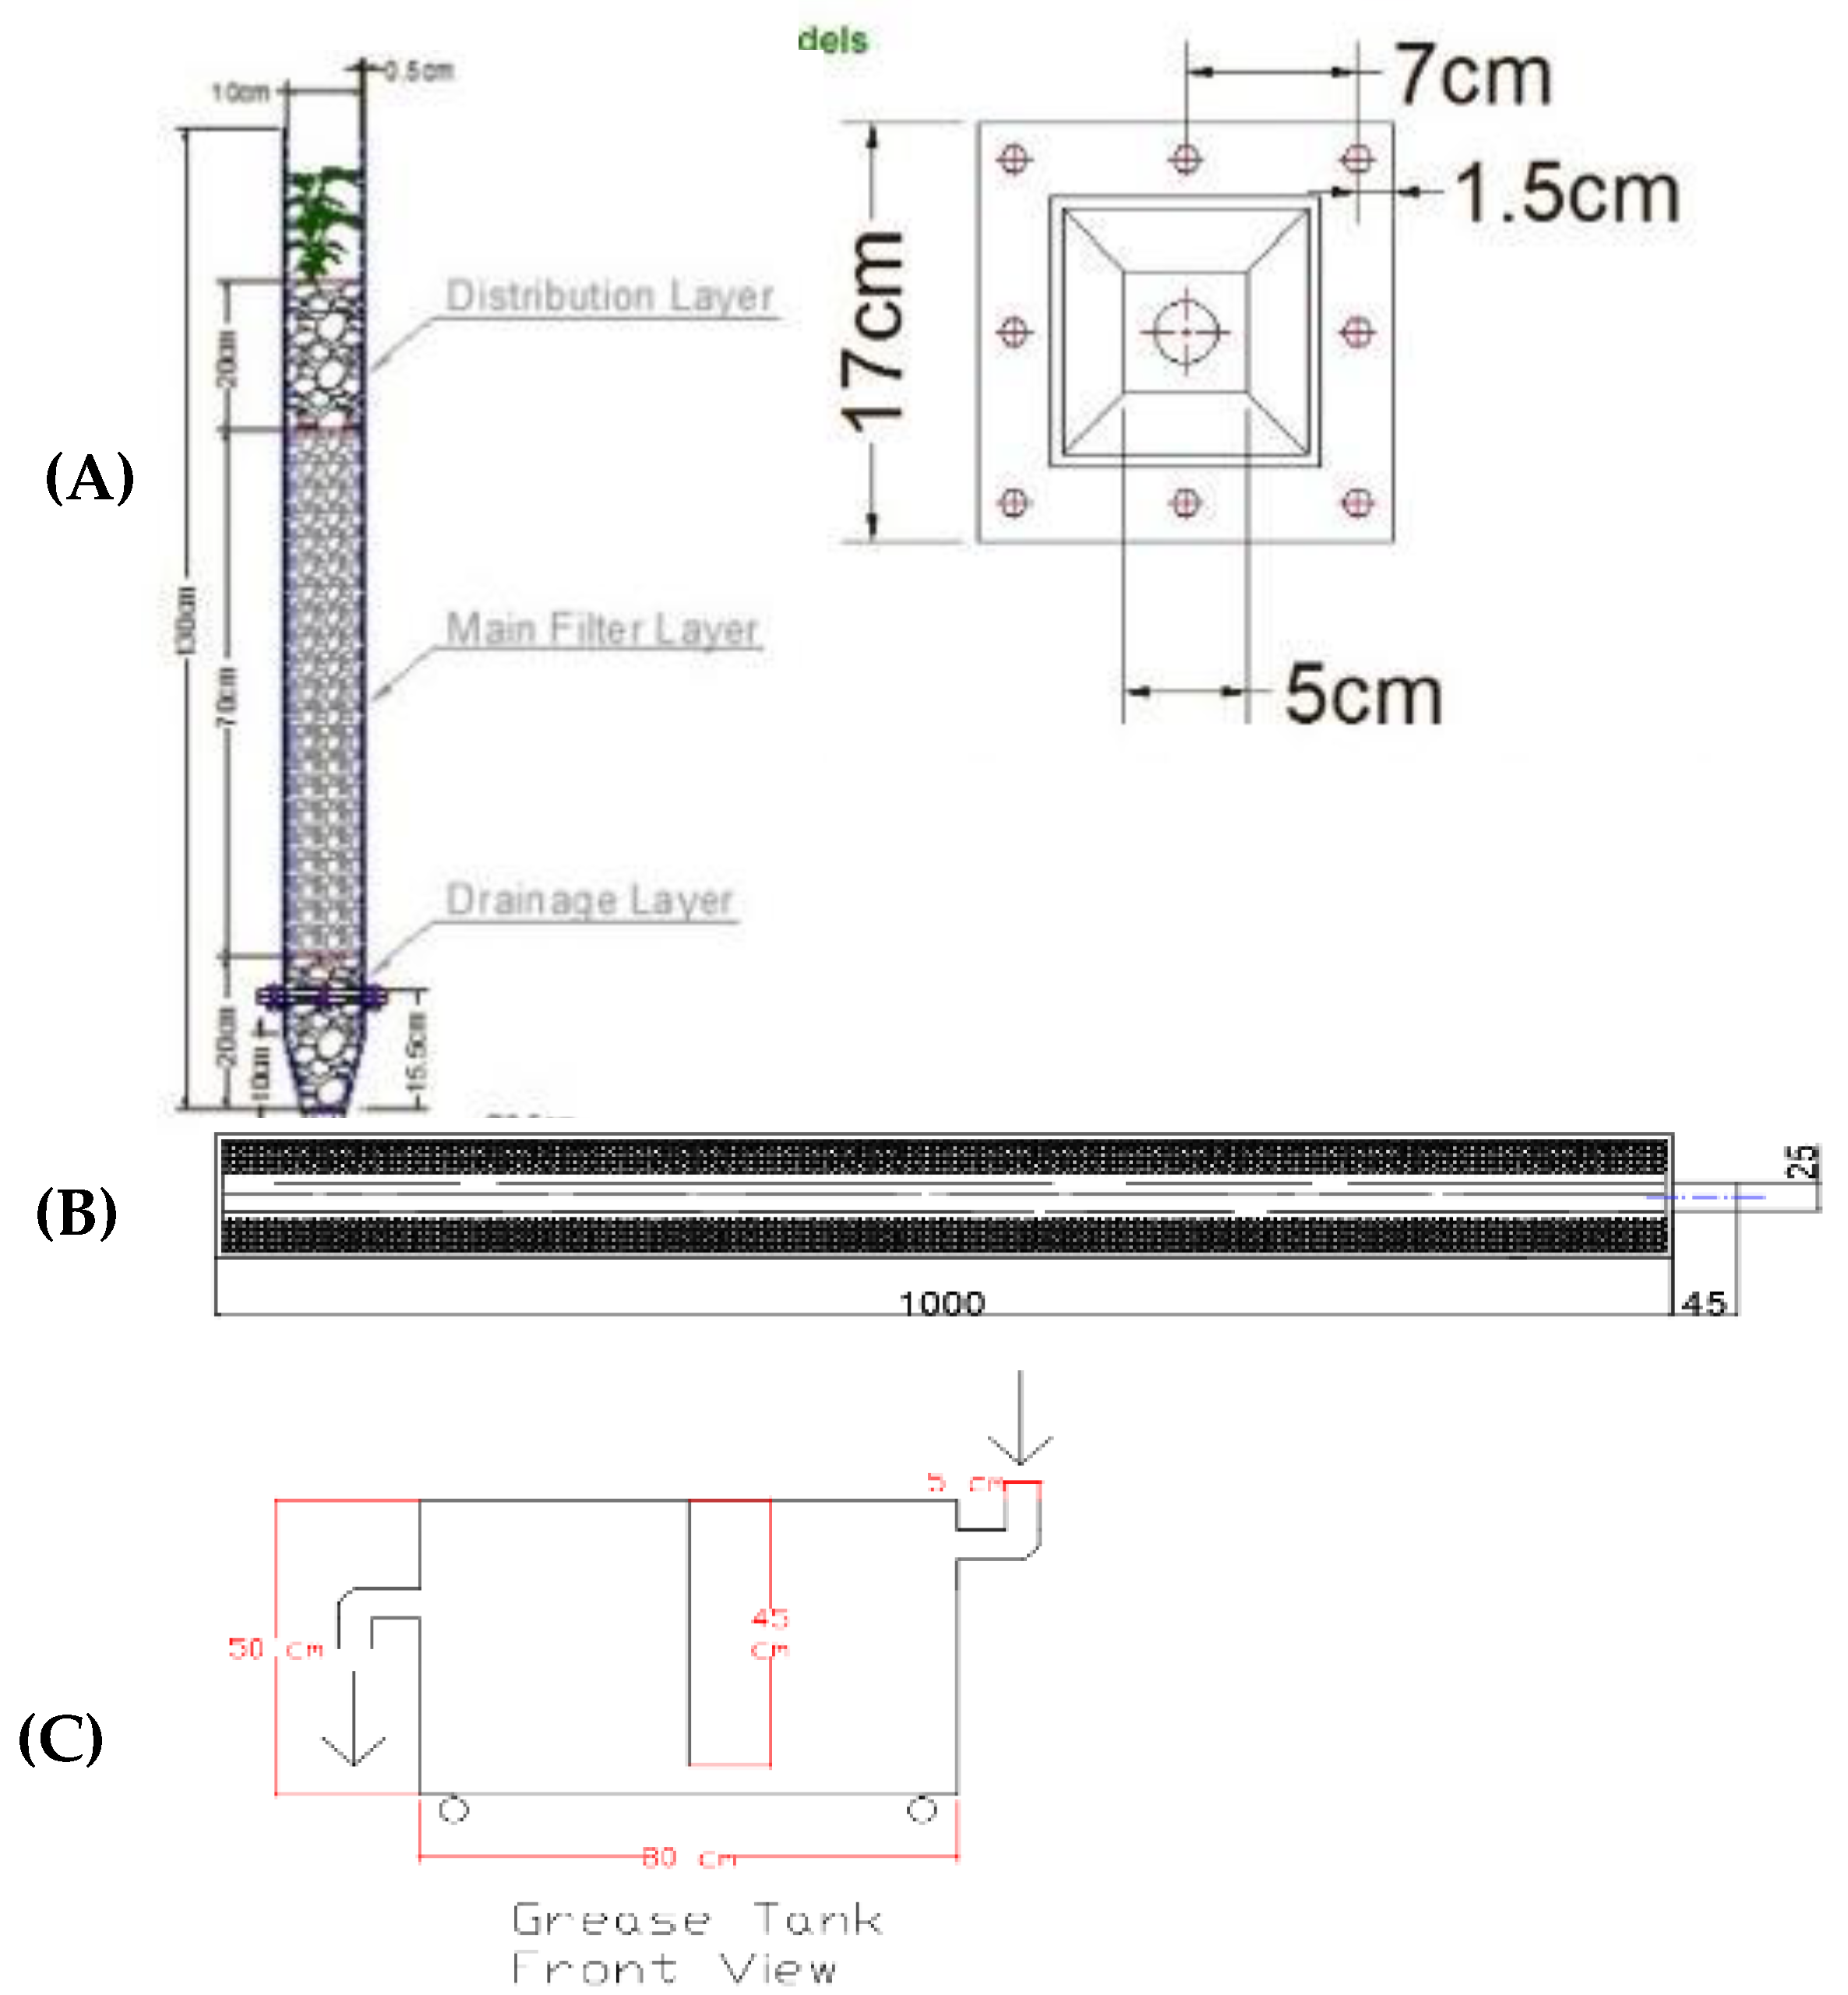
2.1.1. Lab-Scale Constructed Wetlands Prototype Design
2.1.2. Construction of the Grease Trap Tank
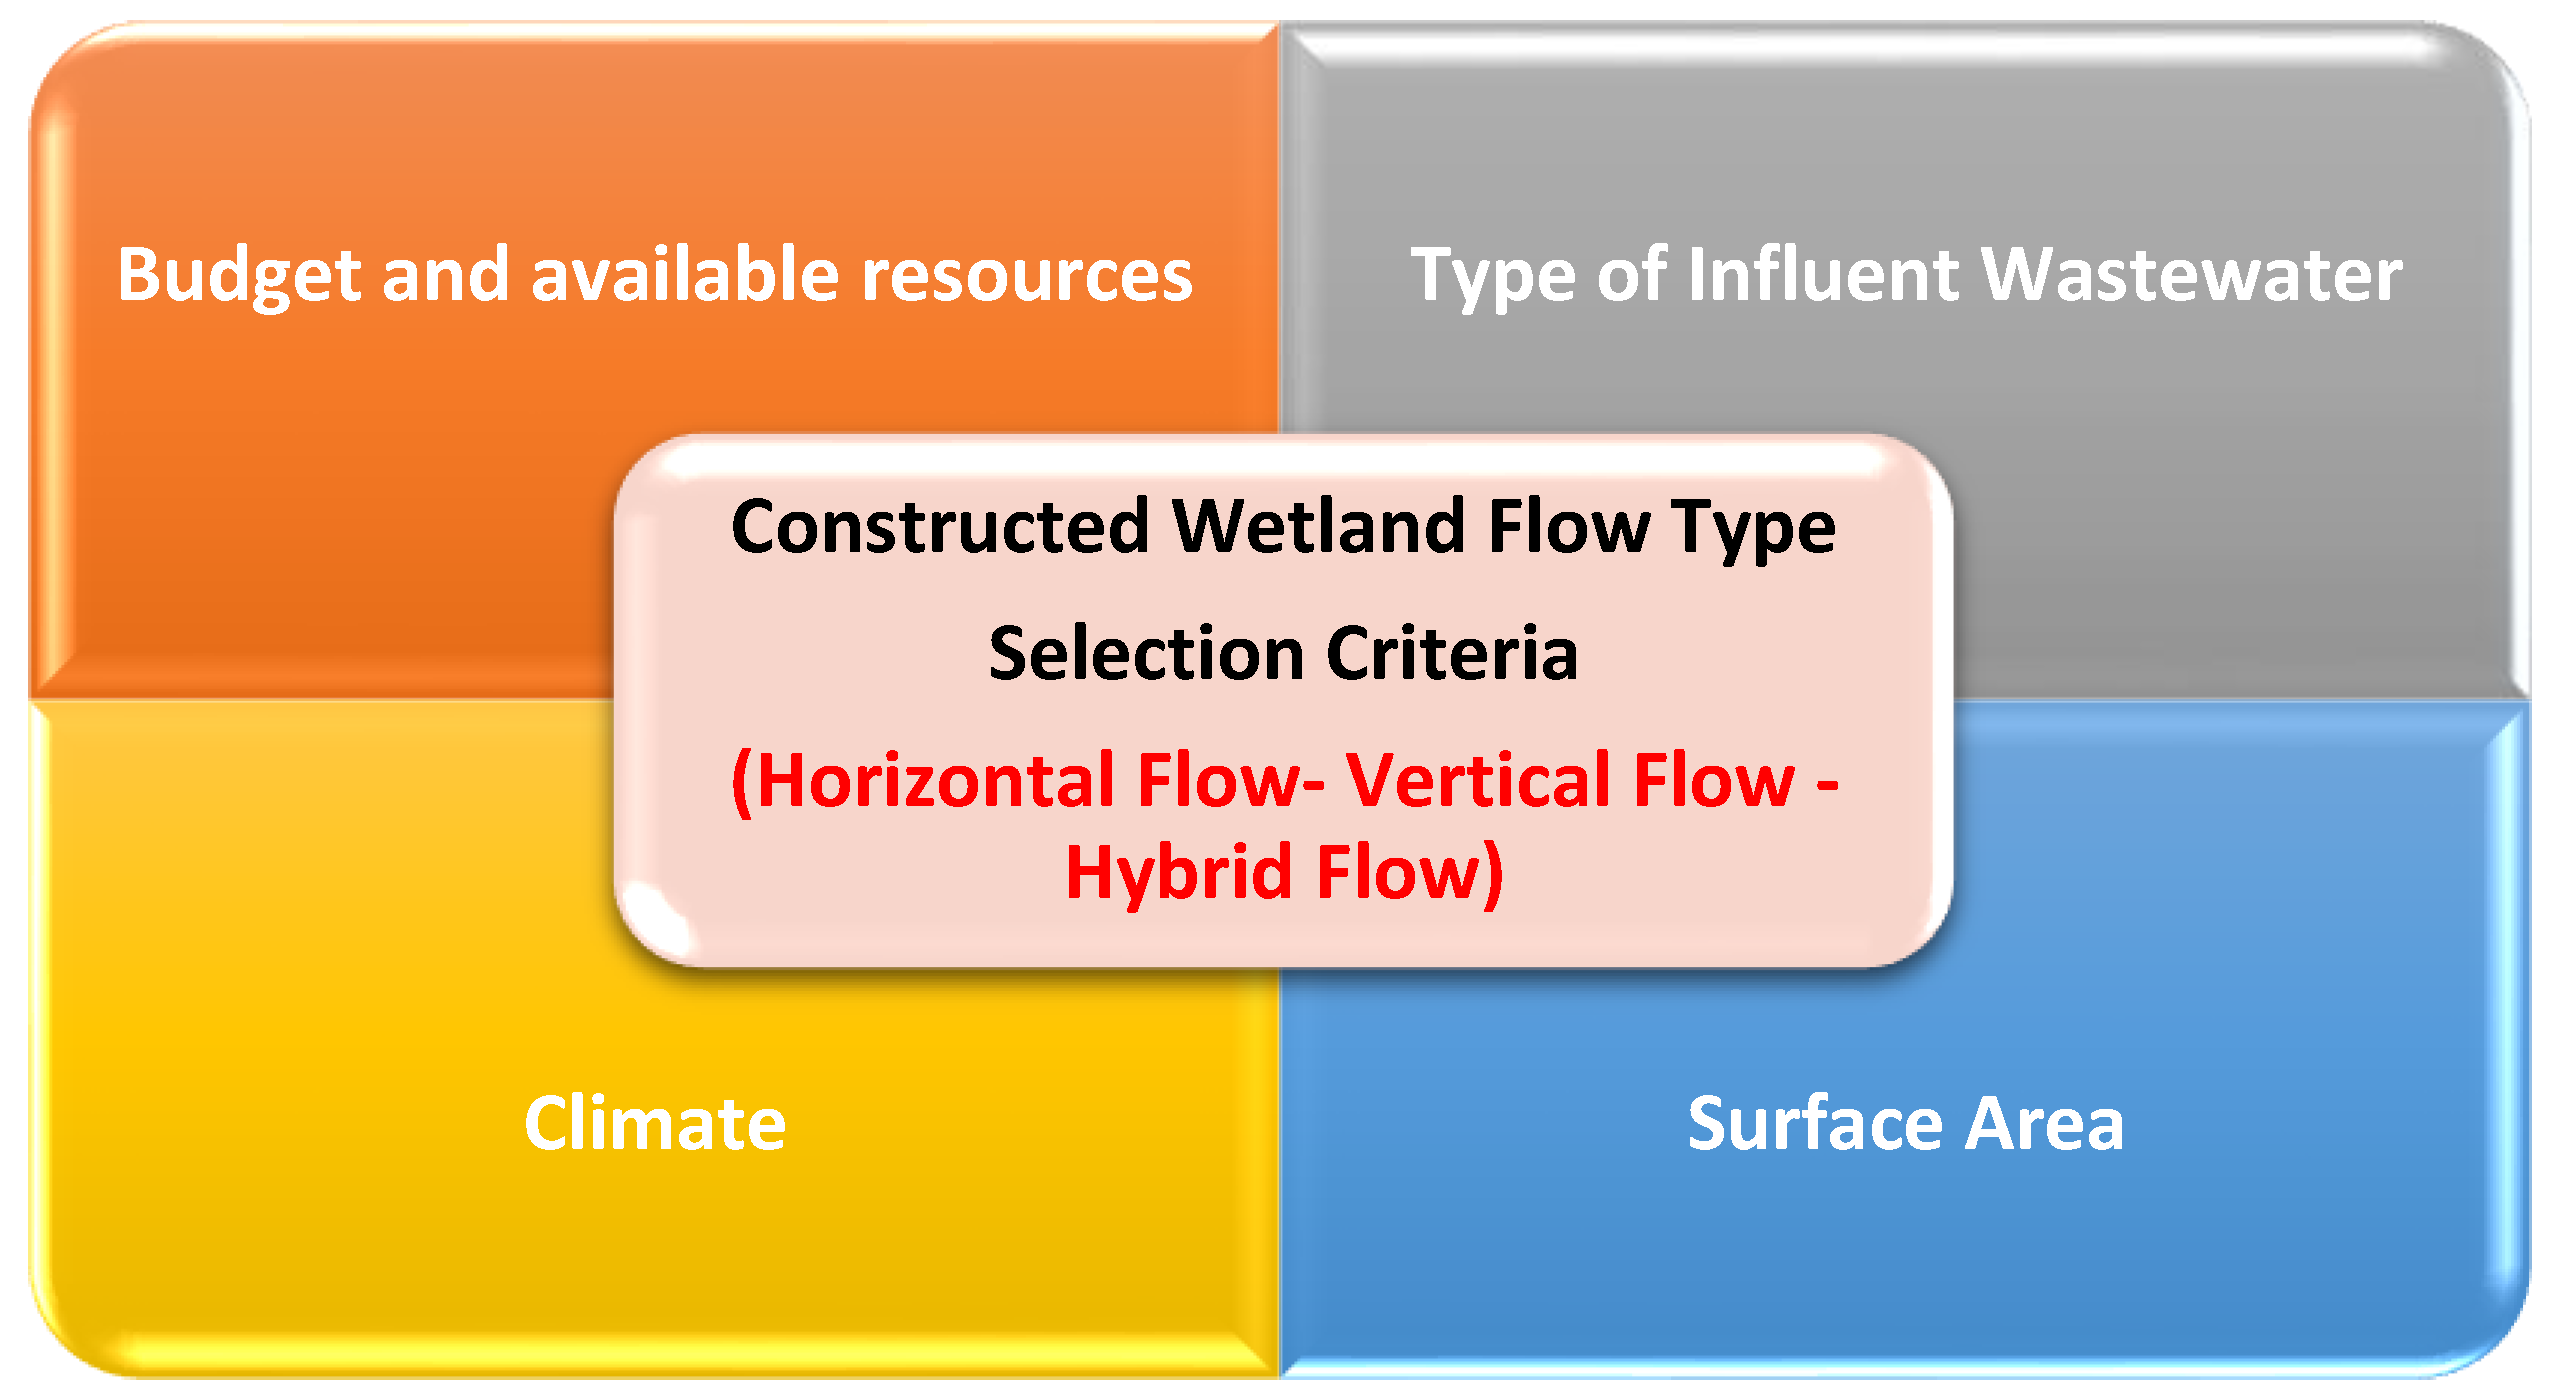
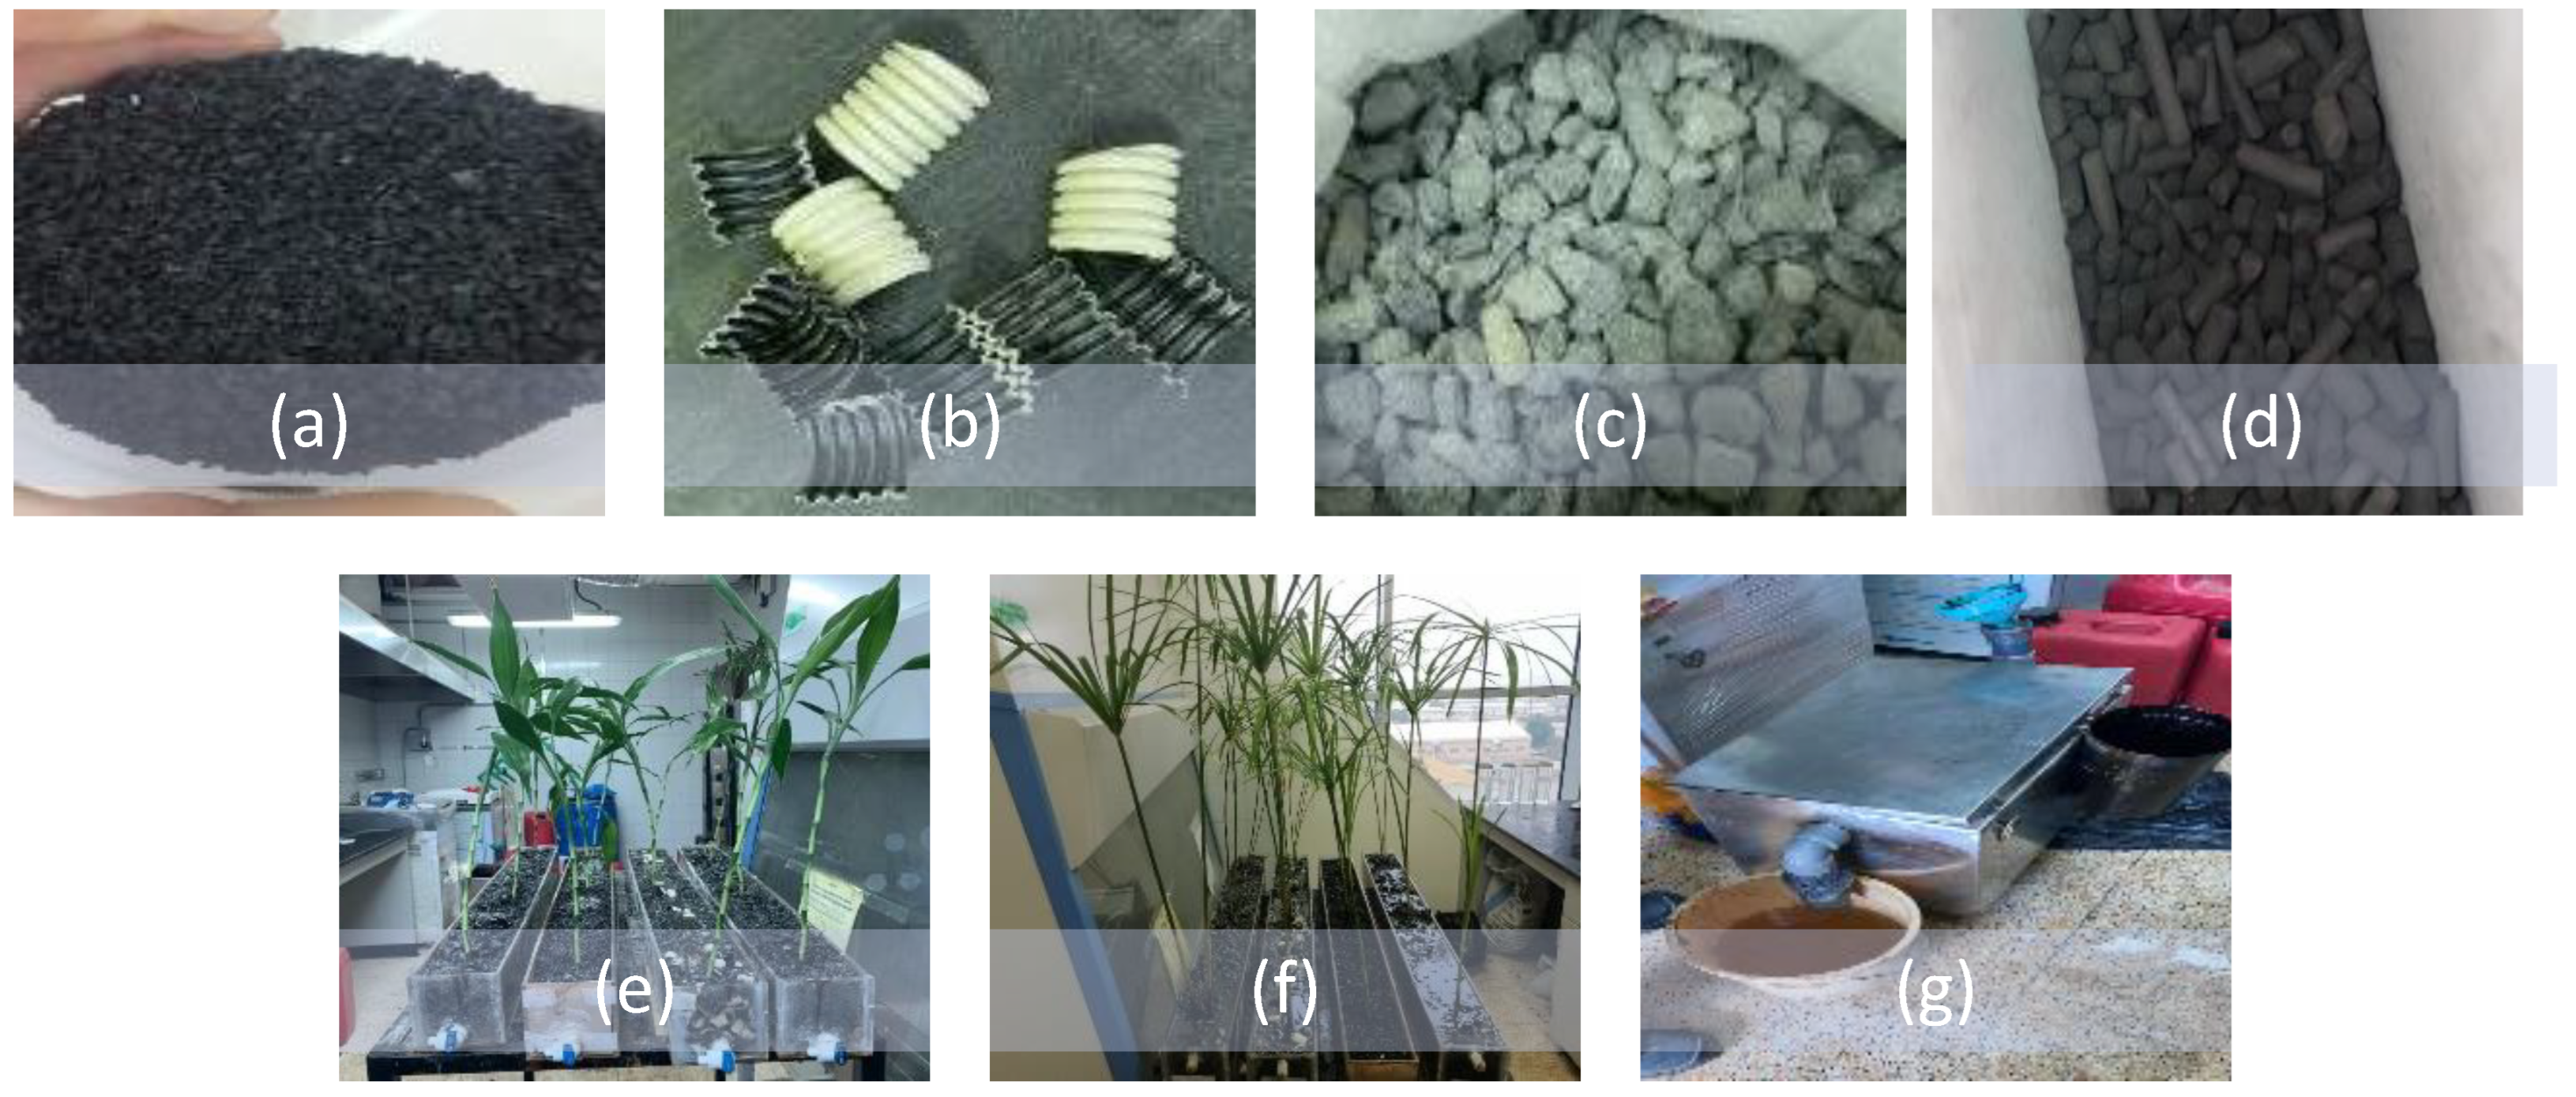
2.1.3. Constructed Wetlands Filter Media Materials and Plants
2.2. Collecting, Sampling, and Characterizing Produced Water
3. Results
3.1. Preliminary Study and Determination of CW Configuration
3.2. Produced Water First Sample Characterization
3.3. Major Study Results
4. Discussion and Analysis
5. Conclusions and Recommendations
5.1. Conclusions
5.2. Recommendations
Author Contributions
Funding
Institutional Review Board Statement
Informed Consent Statement
Data Availability Statement
Conflicts of Interest
Appendix A


References
- Ciasullo, M.V.; Castellani, P.; Rossato, C.; Troisi, O. Sustainable business model innovation. Sinergie Ital. J. Manag. 2019, 37, 213–237. [Google Scholar] [CrossRef]
- Velenturf, A.P.; Purnell, P. Principles for a sustainable circular economy. Sustain. Prod. Consum. 2021, 27, 1437–1457. [Google Scholar] [CrossRef]
- Reike, D.; Vermeulen, W.J.V.; Witjes, S. The circular economy: New or Refurbished as CE 3.0?—Exploring Controversies in the Conceptualization of the Circular Economy through a Focus on History and Resource Value Retention Options. Resour. Conserv. Recycl. 2018, 135, 246–264. [Google Scholar] [CrossRef]
- Kalmykova, Y.; Sadagopan, M.; Rosado, L. Circular economy—From review of theories and practices to development of implementation tools. Resour. Conserv. Recycl. 2018, 135, 190–201. [Google Scholar] [CrossRef]
- Ellen MacArthur Foundation (EMF). News. 2015. Available online: https://www.ellenmacarthurfoundation.org/news/circular-economy-would-increase-european-competitiveness-and-deliver-better-societal-outcomes-new-study-reveals (accessed on 20 December 2022).
- EMF. Towards a Circular Economy: Business Rationale for an Accelerated Transition; Ellen MacArthur Foundation: Cowes, UK, 2015; p. 20. Available online: https://emf.thirdlight.com/link/ip2fh05h21it-6nvypm/@/preview/1?o (accessed on 20 December 2022).
- Circular Economy for Sustainable Development in Serbia; United Nations Development Programme: New York, NY, USA, 2019; Available online: https://www.undp.org/serbia/news/circular-economy-sustainable-development-serbia (accessed on 14 October 2022).
- Water in Circular Economy and Resilience (WICER). Available online: https://www.worldbank.org/en/topic/water/publication/wicer (accessed on 17 October 2022).
- Mbavarira, T.; Grimm, C. A systemic view on circular economy in the water industry: Learnings from a belgian and dutch case. Sustainability 2021, 13, 3313. [Google Scholar] [CrossRef]
- Englande, A.J., Jr.; Krenkel, P.; Shamas, J. Wastewater Treatment &Water Reclamation. Ref. Modul. Earth Syst. Environ. Sci. 2015. [Google Scholar] [CrossRef]
- Lipponen, A.; Nikiforova, N. Wastewater: The Untapped Resource; UNESCO: Paris, France, 2017. [Google Scholar]
- EPA U.S. Office of Research and Development, Technology Transfer and Support Division; Paris, L. US EPA Guidelines for Water Reuse; US EPA: Washington, DC, USA, 2004. [Google Scholar]
- Yaqoob, I.; Parveen, A.A.; Umar, T.; Nasir, K.; Nasir, M. Role of Nanomaterials in the Treatment of waste water. Water 2020, 12, 495. [Google Scholar] [CrossRef]
- Ghimire, U.; Sarpong, G.; Gude, V.G. Transitioning wastewater treatment plants toward circular economy and energy sustainability. ACS Omega 2021, 6, 11794–11803. [Google Scholar] [CrossRef]
- Beyer, J.; Goksøyr, A.; Hjermann, D.Ø.; Klungsøyr, J. Environmental effects of offshore produced water discharges: A review focused on the Norwegian continental shelf. Mar. Environ. Res. 2020, 162, 105155. [Google Scholar] [CrossRef]
- Salem, F.; Thiemann, T. Produced Water from Oil and Gas Exploration—Problems, Solutions and Opportunities. J. Water Resour. Prot. 2022, 14, 142–185. [Google Scholar] [CrossRef]
- Zolghadr, E.; Firouzjaei, M.D.; Amouzandeh, G.; LeClair, P.; Elliott, M. The Role of Membrane-Based Technologies in Environmental Treatment and Reuse of Produced Water. Front. Environ. Sci. 2021, 9, 629767. [Google Scholar] [CrossRef]
- Clark, C.E.; Veil, J.A. Produced Water Volumes and Management Practices in the United States; (No. ANL/EVS/R-09-1); Argonne National Lab.(ANL): Argonne, IL, USA, 2009. [Google Scholar]
- Miranda, M.A.; Ghosh, A.; Mahmodi, G.; Xie, S.; Shaw, M.; Kim, S.; Krzmarzick, M.J.; Lampert, D.J.; Aichele, C.P. Treatment and Recovery of High-Value Elements from Produced Water. Water 2022, 14, 880. [Google Scholar] [CrossRef]
- Veil, J.A.; Puder, M.G.; Elcock, D.; Redweik, R.J.J. A White Paper Describing Produced Water from Production of Crude Oil, Natural Gas, and Coal Bed Methane; Prepared by: Argonne National Laboratory. Prepared for: U.S. Department of Energy National Energy Technology Laboratory Under Contract W-31-109-Eng-38; Argonne National Laboratory: Lemont, IL, USA; U.S. Department of Energy National Energy Technology Laboratory: Pittsburgh, PA, USA, 2004; p. 87. Available online: http://www.osti.gov/servlets/purl/821666/%0A (accessed on 20 November 2022).
- Olajire, A.A. Recent advances on the treatment technology of oil and gas produced water for sustainable energy industry-mechanistic aspects and process chemistry perspectives. Chem. Eng. J. Adv. 2020, 4, 100049. [Google Scholar] [CrossRef]
- Danforth, C.; Chiu, W.A.; Rusyn, I.; Schultz, K.; Bolden, A.; Kwiatkowski, C.; Craft, E. An integrative method for identification and prioritization of constituents of concern in produced water from onshore oil and gas extraction. Environ. Int. 2020, 134, 105280. [Google Scholar] [CrossRef] [PubMed]
- Shining New Light on the Toxicity of Chemicals in Produced Water. Available online: https://blogs.edf.org/energyexchange/2019/11/13/shining-new-light-on-the-toxicity-of-chemicals-in-produced-water/ (accessed on 18 October 2022).
- Fakhru’L-Razi, A.; Pendashteh, A.; Abdullah, L.C.; Biak, D.R.A.; Madaeni, S.S.; Abidin, Z.Z. Review of technologies for oil and gas produced water treatment. J. Hazard. Mater. 2009, 170, 530–551. [Google Scholar] [CrossRef]
- Alley, B.; Beebe, A.; Rodgers, J.; Castle, J.W. Chemical and physical characterization of produced waters from conventional and unconventional fossil fuel resources. Chemosphere 2011, 85, 74–82. [Google Scholar] [CrossRef]
- Neff, J.; Lee, K.; DeBlois, E.M. Produced Water: Overview of Composition, Fates, and Effects. In Produced Water; Springer: New York, NY, USA, 2011; pp. 3–54. [Google Scholar]
- Rajasulochana, P.; Preethy, V. Comparison on efficiency of various techniques in treatment of waste and sewage water—A comprehensive review. Resour. Technol. 2016, 2, 175–184. [Google Scholar] [CrossRef]
- Igunnu, E.T.; Chen, G.Z. Produced water treatment technologies. Int. J. Low-Carbon Technol. 2014, 9, 157–177. [Google Scholar] [CrossRef]
- de Medeiros, A.D.M.; Junior, C.J.G.D.S.; de Amorim, J.D.P.; Durval, I.J.B.; Costa, A.F.D.S.; Sarubbo, L.A. Oily Wastewater Treatment: Methods, Challenges, and Trends. Processes 2022, 10, 743. [Google Scholar] [CrossRef]
- Wei, X.; Zhang, S.; Han, Y.; Wolfe, F.A. Treatment of petrochemical wastewater and produced water from oil and gas. Water Environ. Res. 2019, 91, 1025–1033. [Google Scholar] [CrossRef] [PubMed]
- US Energy Information Administration. Kuwait: Country Analysis Brief; U.S. Energy Information Administration: Washington, DC, USA, 2016; pp. 1–20. Available online: http://www.eia.gov/beta/international/analysis_includes/countries_long/Nigeria/nigeria.pdf (accessed on 20 October 2022).
- Aljuboury, D.A.D.A.; Palaniandy, P.; Abdul Aziz, H.; Feroz, H.B. Treatment of petroleum wastewater by conventional and new technologies—A review. Glob. NEST Int. J. 2017, 19, 439–452. [Google Scholar] [CrossRef]
- Heneghan, E.; Collier, M.; Kelly-Quinn, M. An evaluation of the potential applications of nature-based solutions for water quality protection: Ireland as a case study. Boil. Environ. 2021, 121B, 147–162. [Google Scholar] [CrossRef]
- Vymazal, J. Wastewater Treatment and Control Through Wetlands. In Encyclopedia of Sustainability Science and Technology; Meyers, R.A., Ed.; Springer: New York, NY, USA. [CrossRef]
- Stefanakis, A.I.; Prigent, S.; Breuer, R. Integrated Produced Water Management in a Desert Oilfield Using Wetland Technology and Innovative Reuse Practices. In Constructed Wetlands for Industrial Wastewater Treatment; John Wiley & Sons, Ltd.: Hoboken, NJ, USA, 2018; pp. 23–42. [Google Scholar] [CrossRef]
- Vymazal, J.; Greenway, M.; Tonderski, K.; Brix, H.; Mander, Ü. Constructed Wetlands for Wastewater Treatment. In Wetlands and Natural Resource Management; Springer: Berlin/Heidelberg, Germany, 2006; pp. 69–96. [Google Scholar]
- Programme, J.O. Educational material. Dent. Radiogr. Photogr. 1966, 39, 39. [Google Scholar] [CrossRef]
- Vymazal, J. Constructed wetlands for wastewater treatment. Encycl. Ecol. 2018, 14–21. [Google Scholar] [CrossRef]
- Brix, H. Wastewater Treatment in Constructed Wetlands: System Design, Removal Processes, and Treatment Performance. In Constructed Wetlands for Water Quality Improvement; CRC Press: Boca Raton, FL, USA, 1993; pp. 9–22. [Google Scholar] [CrossRef]
- Vymazal, J. Constructed wetlands for wastewater treatment. Water 2010, 2, 530–549. [Google Scholar] [CrossRef]
- Rahman, E.; Bin Halmi, M.I.E.; Samad, M.Y.B.A.; Uddin, K.; Mahmud, K.; Shukor, M.Y.A.; Abdullah, S.R.S.; Shamsuzzaman, S.M. Design, Operation and Optimization of Constructed Wetland for Removal of Pollutant. Int. J. Environ. Res. Public Health 2020, 17, 8339. [Google Scholar] [CrossRef]
- Vymazal, J. Constructed Wetlands for Wastewater Treatment: Five Decades of Experience. Environ. Sci. Technol. 2011, 45, 61–69. [Google Scholar] [CrossRef]
- Vymazal, J. The Historical Development of Constructed Wetlands for Wastewater Treatment. Land 2022, 11, 174. [Google Scholar] [CrossRef]
- Stefanakis, A.I. The Role of Constructed Wetlands as Green Infrastructure for Sustainable Urban Water Management. Sustainability 2019, 11, 6981. [Google Scholar] [CrossRef]
- Stefanakis, A.I. Constructed wetlands for sustainable wastewater treatment in hot and arid climates: Opportunities, challenges and case studies in the Middle East. Water 2020, 12, 1665. [Google Scholar] [CrossRef]
- Vymazal, J.; Kröpfelová, L. Wastewater Treatment in Constructed Wetlands with Horizontal Sub-Surface Flo; Google Books; Available online: https://books.google.com.kw/books?hl=en&lr=&id=IfqerCqRvg8C&oi=fnd&pg=PR11&ots=rxwr4pLE2i&sig=FluxObknFLjBHggIztDDAAy2xc8&redir_esc=y#v=onepage&q&f=false (accessed on 18 October 2022).
- Vymazal, J.; Zhao, Y.; Mander, Ü. Recent research challenges in constructed wetlands for wastewater treatment: A review. Ecol. Eng. 2021, 169, 106318. [Google Scholar] [CrossRef]
- Villaseñor, J.; Capilla, P.; Rodrigo, M.; Cañizares, P.; Fernández, F. Operation of a horizontal subsurface flow constructed wetland—Microbial fuel cell treating wastewater under different organic loading rates. Water Res. 2013, 47, 6731–6738. [Google Scholar] [CrossRef] [PubMed]
- Gajewska, M.; Skrzypiec, K.; Jóźwiakowski, K.; Mucha, Z.; Wójcik, W.; Karczmarczyk, A.; Bugajski, P. Kinetics of pollutants removal in vertical and horizontal flow constructed wetlands in temperate climate. Sci. Total. Environ. 2020, 718, 137371. [Google Scholar] [CrossRef] [PubMed]
- Pastor, R.; Benqlilou, C.; Paz, D.; Cardenas, G.; Espuña, A.; Puigjaner, L. Design optimisation of constructed wetlands for wastewater treatment. Resour. Conserv. Recycl. 2003, 37, 193–204. [Google Scholar] [CrossRef]
- Hassan, I.; Chowdhury, S.R.; Prihartato, P.K.; Razzak, S.A. Wastewater treatment using constructed wetland: Current trends and future potential. Processes 2021, 9, 1917. [Google Scholar] [CrossRef]
- Kaushik, M.K.; Kumar, A. Beneficial Use of Shredded Tires of Different Sizes with Gravel as Drainage Layer of Landfill Leachate Collection Syastem. In Proceedings of the Indian Geotechnical Conference 2012, Delhi, Indian, 13–15 December 2012; Available online: https://www.researchgate.net/publication/305723985 (accessed on 20 December 2022).


| Sieve Size | Percent Retained | Percent Passing |
|---|---|---|
| 2.36 mm (No. 8) | 0.0 | 100.0 |
| 2.0 mm (No. 10) | 0.0 | 100.0 |
| 1.18 mm (No. 16) | 0.0 | 100.0 |
| 0.600 mm (No. 30) | 30.6 | 69.4 |
| 0.425 mm (No. 40) | 65.0 | 35.0 |
| 0.300 mm (No. 50) | 82.2 | 17.8 |
| 0.150 mm (No. 100) | 95.6 | 4.4 |
| Chemical Components | Amount/5 L of Wastewater |
|---|---|
| Sodium Acetate (CH3COONa) | 4.75 g |
| Monopotassium Phosphate (KH2 PO₄) | 0.125 g |
| Dipotassium Phosphate (K2HPO₄) | 0.125 g |
| Potassium Chloride (KCl) | 3.7 g |
| Sodium Chloride (NaCl) | 2.9 g |
| Ammonium Chloride (NH₄Cl) | 1.0905 g |
| Magnesium Sulfate (MgSO₄) | 0.5 g |
| Calcium Chloride Dihydrate (CaCl2·2H2O) | 0.5 g |
| Average Pollutant Removal Efficiency | |||
|---|---|---|---|
| Water Quality Parameters | 30 cm Filter | 50 cm Filter | 70 cm Filter |
| Ammonium Nitrogen (NH3-N) | 29.7% | 41.3% | 54.1% |
| Nitrite Nitrogen (NO2-N) | 3.6% | 4.6% | 11.3% |
| Total Nitrogen (TN) | 26.8% | 42.0% | 57.8% |
| Total Phosphate (TP) | 1.1% | 18.2% | 28.0% |
| Chemical Oxygen Demand (COD) | 38.9% | 63.0% | 73.7% |
| No. | Test Method and Parameters | Standards | KEPA Limit | Result | Unit |
|---|---|---|---|---|---|
| 1 | pH | APHA 4500 HB | 6.5–8.5 | 6.9 | - |
| 2 | BOD (5 days, 200 °C) | APHA 5210 B | 20 | 13.2 | mg/L |
| 3 | COD | APHA 5220 C | 100 | 45 | mg/L |
| 4 | Dissolved Oxygen (DO) | APHA 4500-O G | >2 | 3.2 | mg/L |
| 5 | Residual Chlorine | APHA 4500 CL B | 0.5–1.0 | 0.12 | mg/L |
| 6 | Floatables | APHA 2530 | Nil | Nil | mg/L |
| 7 | Oil and Grease | APHA 5520 B | 5 | 6.2 | mg/L |
| 8 | Total Suspended Solids (TSS) | APHA 2540 D | 15 | 450 | mg/L |
| 9 | Total Dissolved Solids (TDS) | APHA 2540 C | 1500 | 59,500 | mg/L |
| 10 | Phosphates as PO₄ | APHA 4500-P D | 30 | 1.59 | mg/L |
| 11 | Ammonia | APHA 4500 NH3 D | 15 | 9.5 | mg/L |
| 12 | Total Kjeldahl Nitrogen | APHA 4500 NORG B | 30 | 19.6 | mg/L |
| 13 | Total Nitrogen | APHA 4500 NORG B | 65 | 46.5 | mg/L |
| 14 | Total Recoverable Phenol | APHA 5530 C | 1 | 0.15 | mg/L |
| 15 | Fluoride | APHA 4500-F D | 25 | <0.05 | mg/L |
| 16 | Sulfide | APHA 4500-S2F | 0.1 | <0.05 | mg/L |
| 17 | Aluminum as Al | USEPA 6010B | 5 | <0.01 | mg/L |
| 18 | Arsenic as As | USEPA 6010B | 0.1 | <0.01 | mg/L |
| 19 | Barium as Ba | USEPA 6010B | 2 | 1.1 | mg/L |
| 20 | Boron as B | USEPA 6010B | 2 | <0.01 | mg/L |
| 21 | Cadmium as Cd | USEPA 6010B | 0.01 | <0.01 | mg/L |
| 22 | Chromium as Cr | USEPA 6010B | 0.15 | <0.01 | mg/L |
| 23 | Nickel as Ni | USEPA 6010B | 0.2 | <0.01 | mg/L |
| 24 | Mercury as Hg | USEPA 6010B | 0.001 | 0.001 | mg/L |
| 25 | Cobalt as Co | USEPA 6010B | 0.2 | <0.01 | mg/L |
| 26 | Iron as Fe | USEPA 6010B | 5 | 0.3 | mg/L |
| 27 | Antimony as Sb | USEPA 6010B | 1 | <0.01 | mg/L |
| 28 | Copper as Cu | USEPA 6010B | 0.2 | 0.05 | mg/L |
| 29 | Manganese as Mn | USEPA 6010B | 0.2 | 0.1 | mg/L |
| 30 | Zinc as Zn | USEPA 6010B | 2 | 0.2 | mg/L |
| 31 | Lead as Pb | USEPA 6010B | 0.5 | <0.01 | mg/L |
| 32 | Total Petroleum Hydrocarbon | ASTM 1664 A | 5 | 9.4 | mg/L |
| 33 | Faecal Coliform | APHA 92212017,23rd | 100 | 90 | CFU/100 mL |
| 34 | E.Coli | USEPA 1603:2014 | 50 | 30 | CFU/100 mL |
| 35 | Faecal Streptococci | ISO 7899-2:2000 | 50 | <1 | CFU/100 mL |
| 36 | Egg Parasite | APHAMICROSCOPIC | Nil | Nil | - |
| R2 | HCW | VCW | |||||||
|---|---|---|---|---|---|---|---|---|---|
| TSS | TDS | OG | TPH | TSS | TDS | OG | TPH | ||
| Activated Carbon Effluent | No Plant | 0.995 | 0.795 | 0.315 | 0.875 | 0.922 | 0.650 | 0.818 | 0.819 |
| Bamboo Plant | 0.595 | 0.999 | 0.956 | 0.579 | 0.512 | 0.696 | 0.999 | 0.509 | |
| Cyperus Plant | 0.901 | 0.792 | 0.934 | 0.655 | 0.901 | 0.792 | 0.943 | 0.635 | |
| Aggregates Effluent | No Plant | 0.720 | 0.147 | 0.588 | 0.886 | 0.809 | 0.397 | 0.953 | 0.866 |
| Bamboo Plant | 0.580 | 0.945 | 1.000 | 0.617 | 0.632 | 0.986 | 0.379 | 0.298 | |
| Cyperus Plant | 0.944 | 0.820 | 0.915 | 0.650 | 0.915 | 0.820 | 0.940 | 0.701 | |
| Plastic Effluent | No Plant | 0.663 | 0.019 | 0.977 | 0.871 | 0.147 | 0.358 | 0.897 | 0.875 |
| Bamboo Plant | 0.953 | 0.378 | 0.844 | 0.298 | 0.295 | 0.922 | 0.999 | 0.579 | |
| Cyperus Plant | 0.647 | 0.745 | 0.958 | 0.958 | 0.957 | 0.745 | 0.939 | 0.659 | |
| Shredded Tires Effluent | No Plant | 0.216 | 0.216 | 0.891 | 0.887 | 0.546 | 0.994 | 0.514 | 0.877 |
| Bamboo Plant | 0.216 | 0.216 | 0.891 | 0.886 | 0.994 | 0.546 | 0.514 | 0.878 | |
| Cyperus Plant | 0.935 | 0.680 | 0.918 | 0.686 | 0.918 | 0.680 | 0.935 | 0.686 | |
Disclaimer/Publisher’s Note: The statements, opinions and data contained in all publications are solely those of the individual author(s) and contributor(s) and not of MDPI and/or the editor(s). MDPI and/or the editor(s) disclaim responsibility for any injury to people or property resulting from any ideas, methods, instructions or products referred to in the content. |
© 2023 by the authors. Licensee MDPI, Basel, Switzerland. This article is an open access article distributed under the terms and conditions of the Creative Commons Attribution (CC BY) license (https://creativecommons.org/licenses/by/4.0/).
Share and Cite
Waly, M.M.; Mickovski, S.B.; Thomson, C. Application of Circular Economy in Oil and Gas Produced Water Treatment. Sustainability 2023, 15, 2132. https://doi.org/10.3390/su15032132
Waly MM, Mickovski SB, Thomson C. Application of Circular Economy in Oil and Gas Produced Water Treatment. Sustainability. 2023; 15(3):2132. https://doi.org/10.3390/su15032132
Chicago/Turabian StyleWaly, Marwa M., Slobodan B. Mickovski, and Craig Thomson. 2023. "Application of Circular Economy in Oil and Gas Produced Water Treatment" Sustainability 15, no. 3: 2132. https://doi.org/10.3390/su15032132
APA StyleWaly, M. M., Mickovski, S. B., & Thomson, C. (2023). Application of Circular Economy in Oil and Gas Produced Water Treatment. Sustainability, 15(3), 2132. https://doi.org/10.3390/su15032132