


Upcycled Animal Feed: Sustainable Solution to Orange Peels Waste


 ,
, 

Abstract
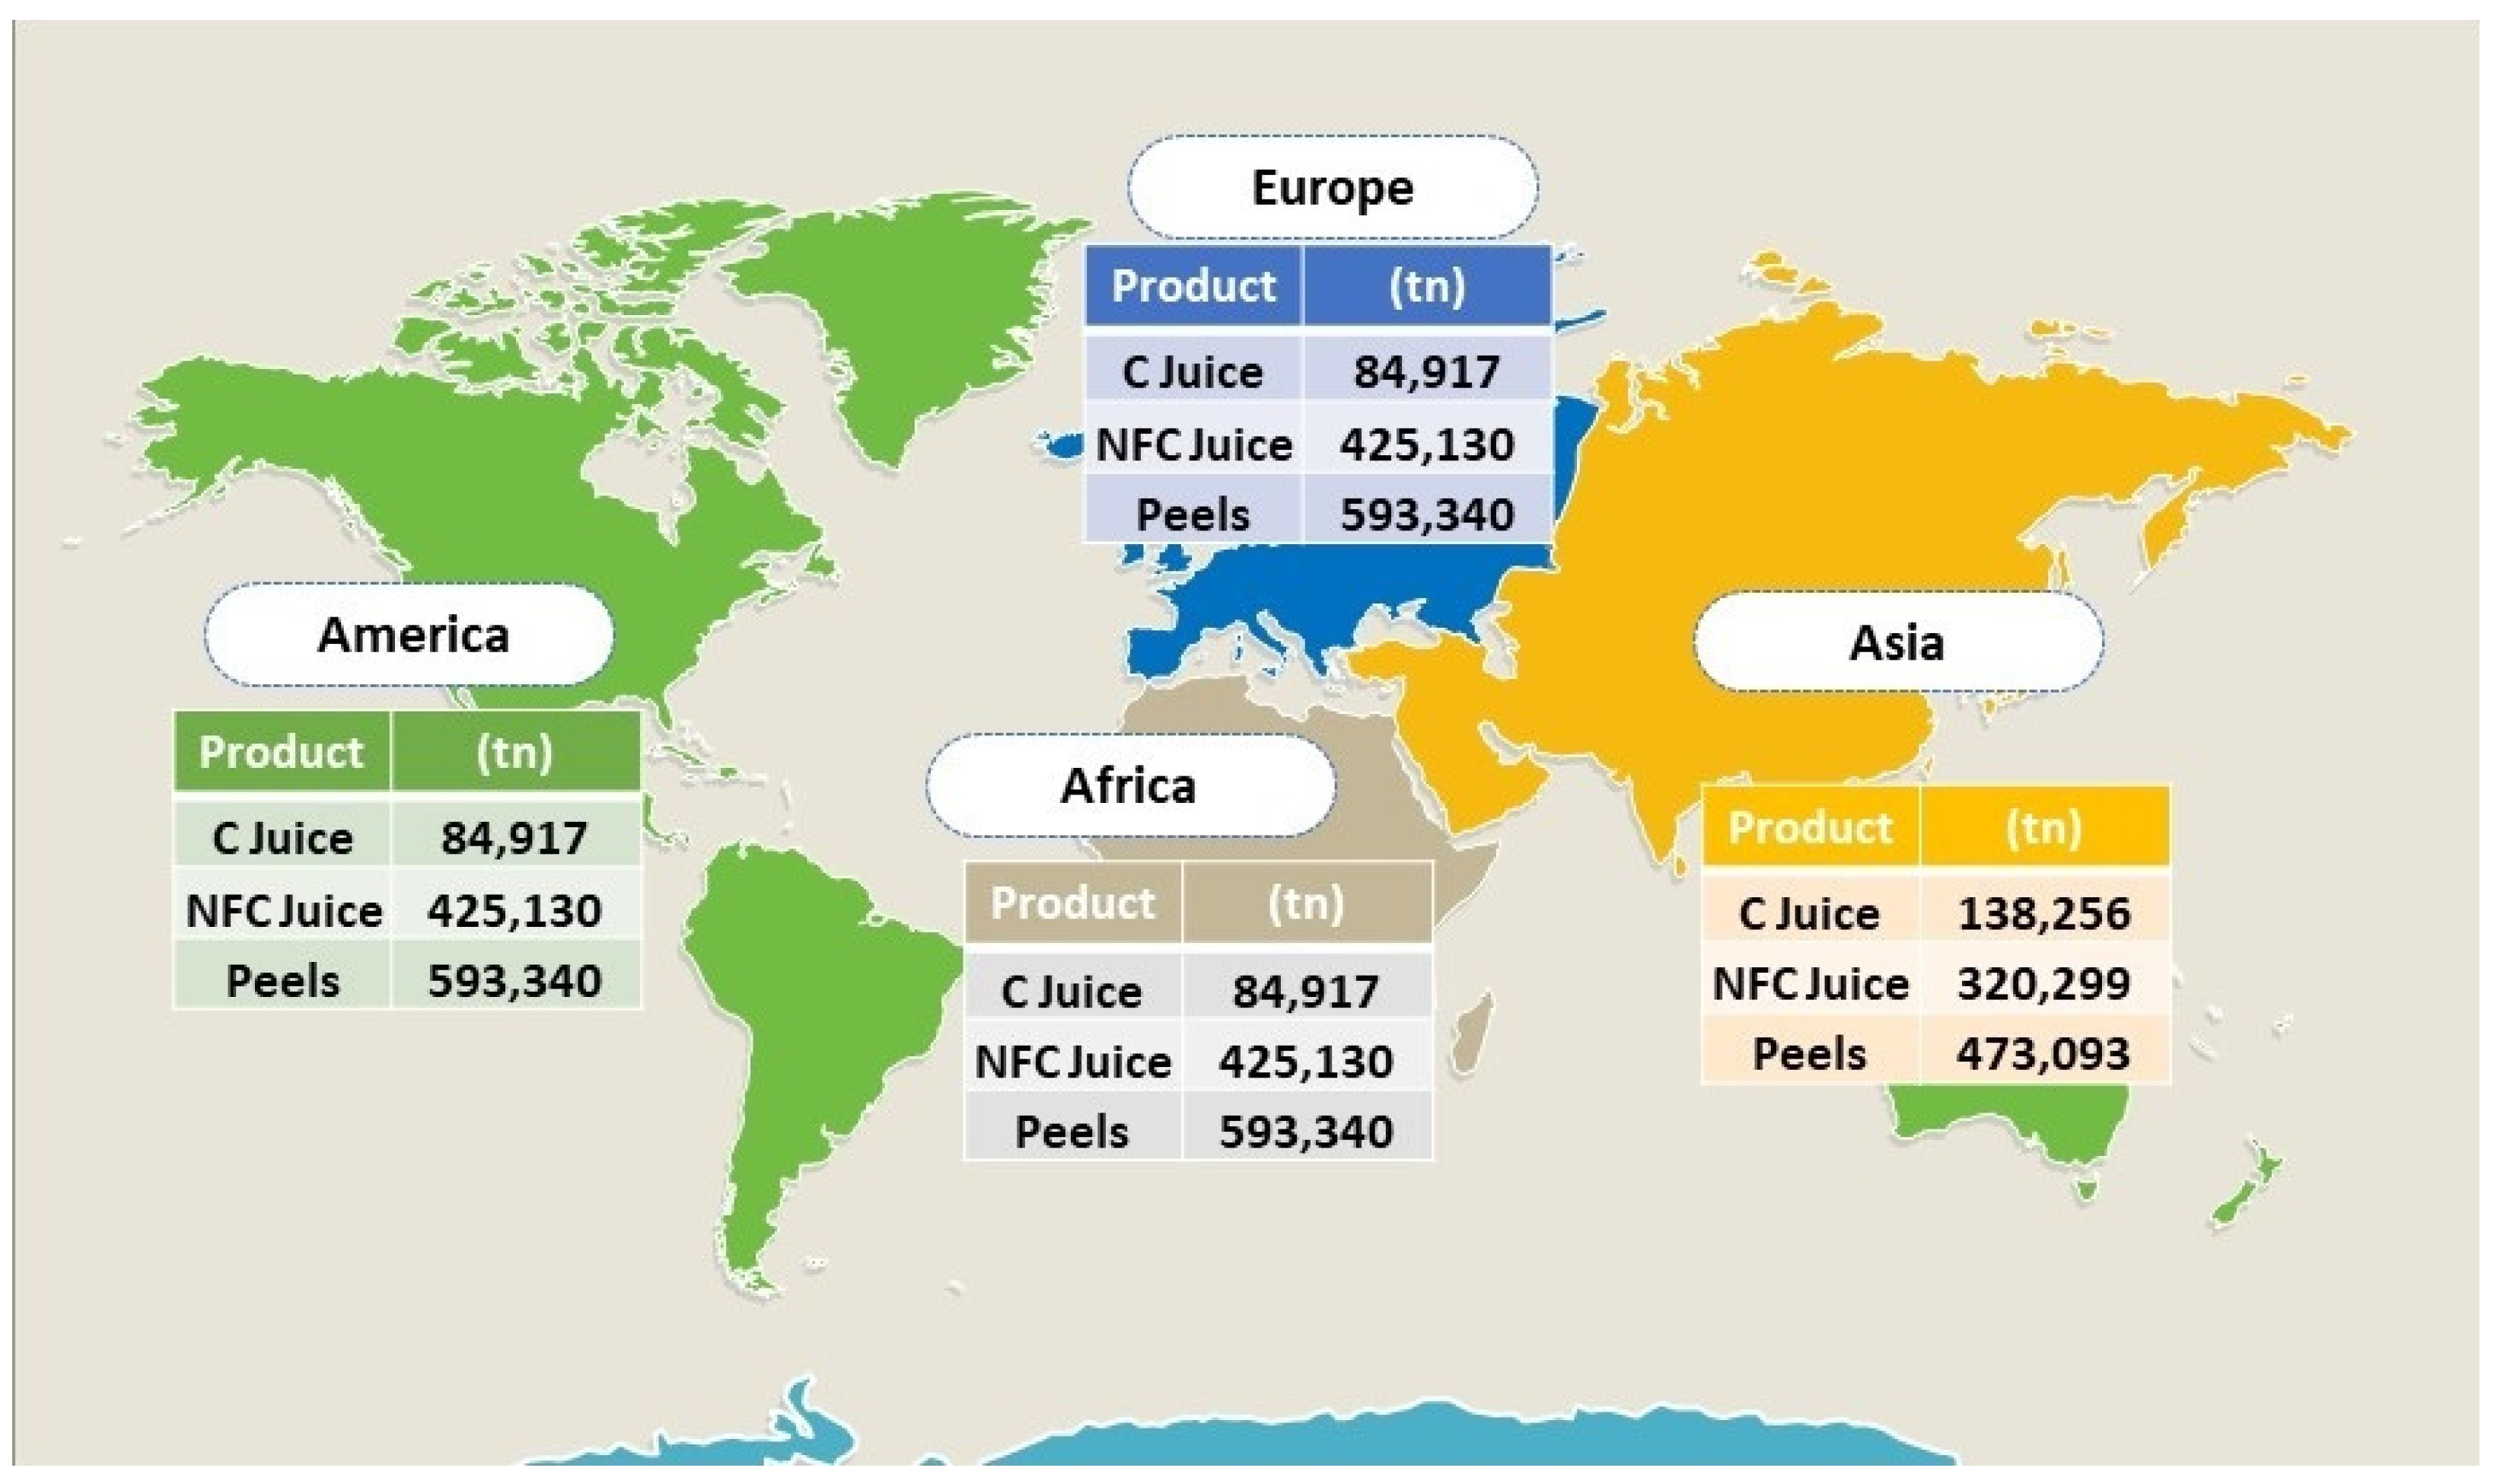
1. Introduction
2. Materials and Methods
2.1. Raw Material
2.2. Physico-Chemical Characterisation
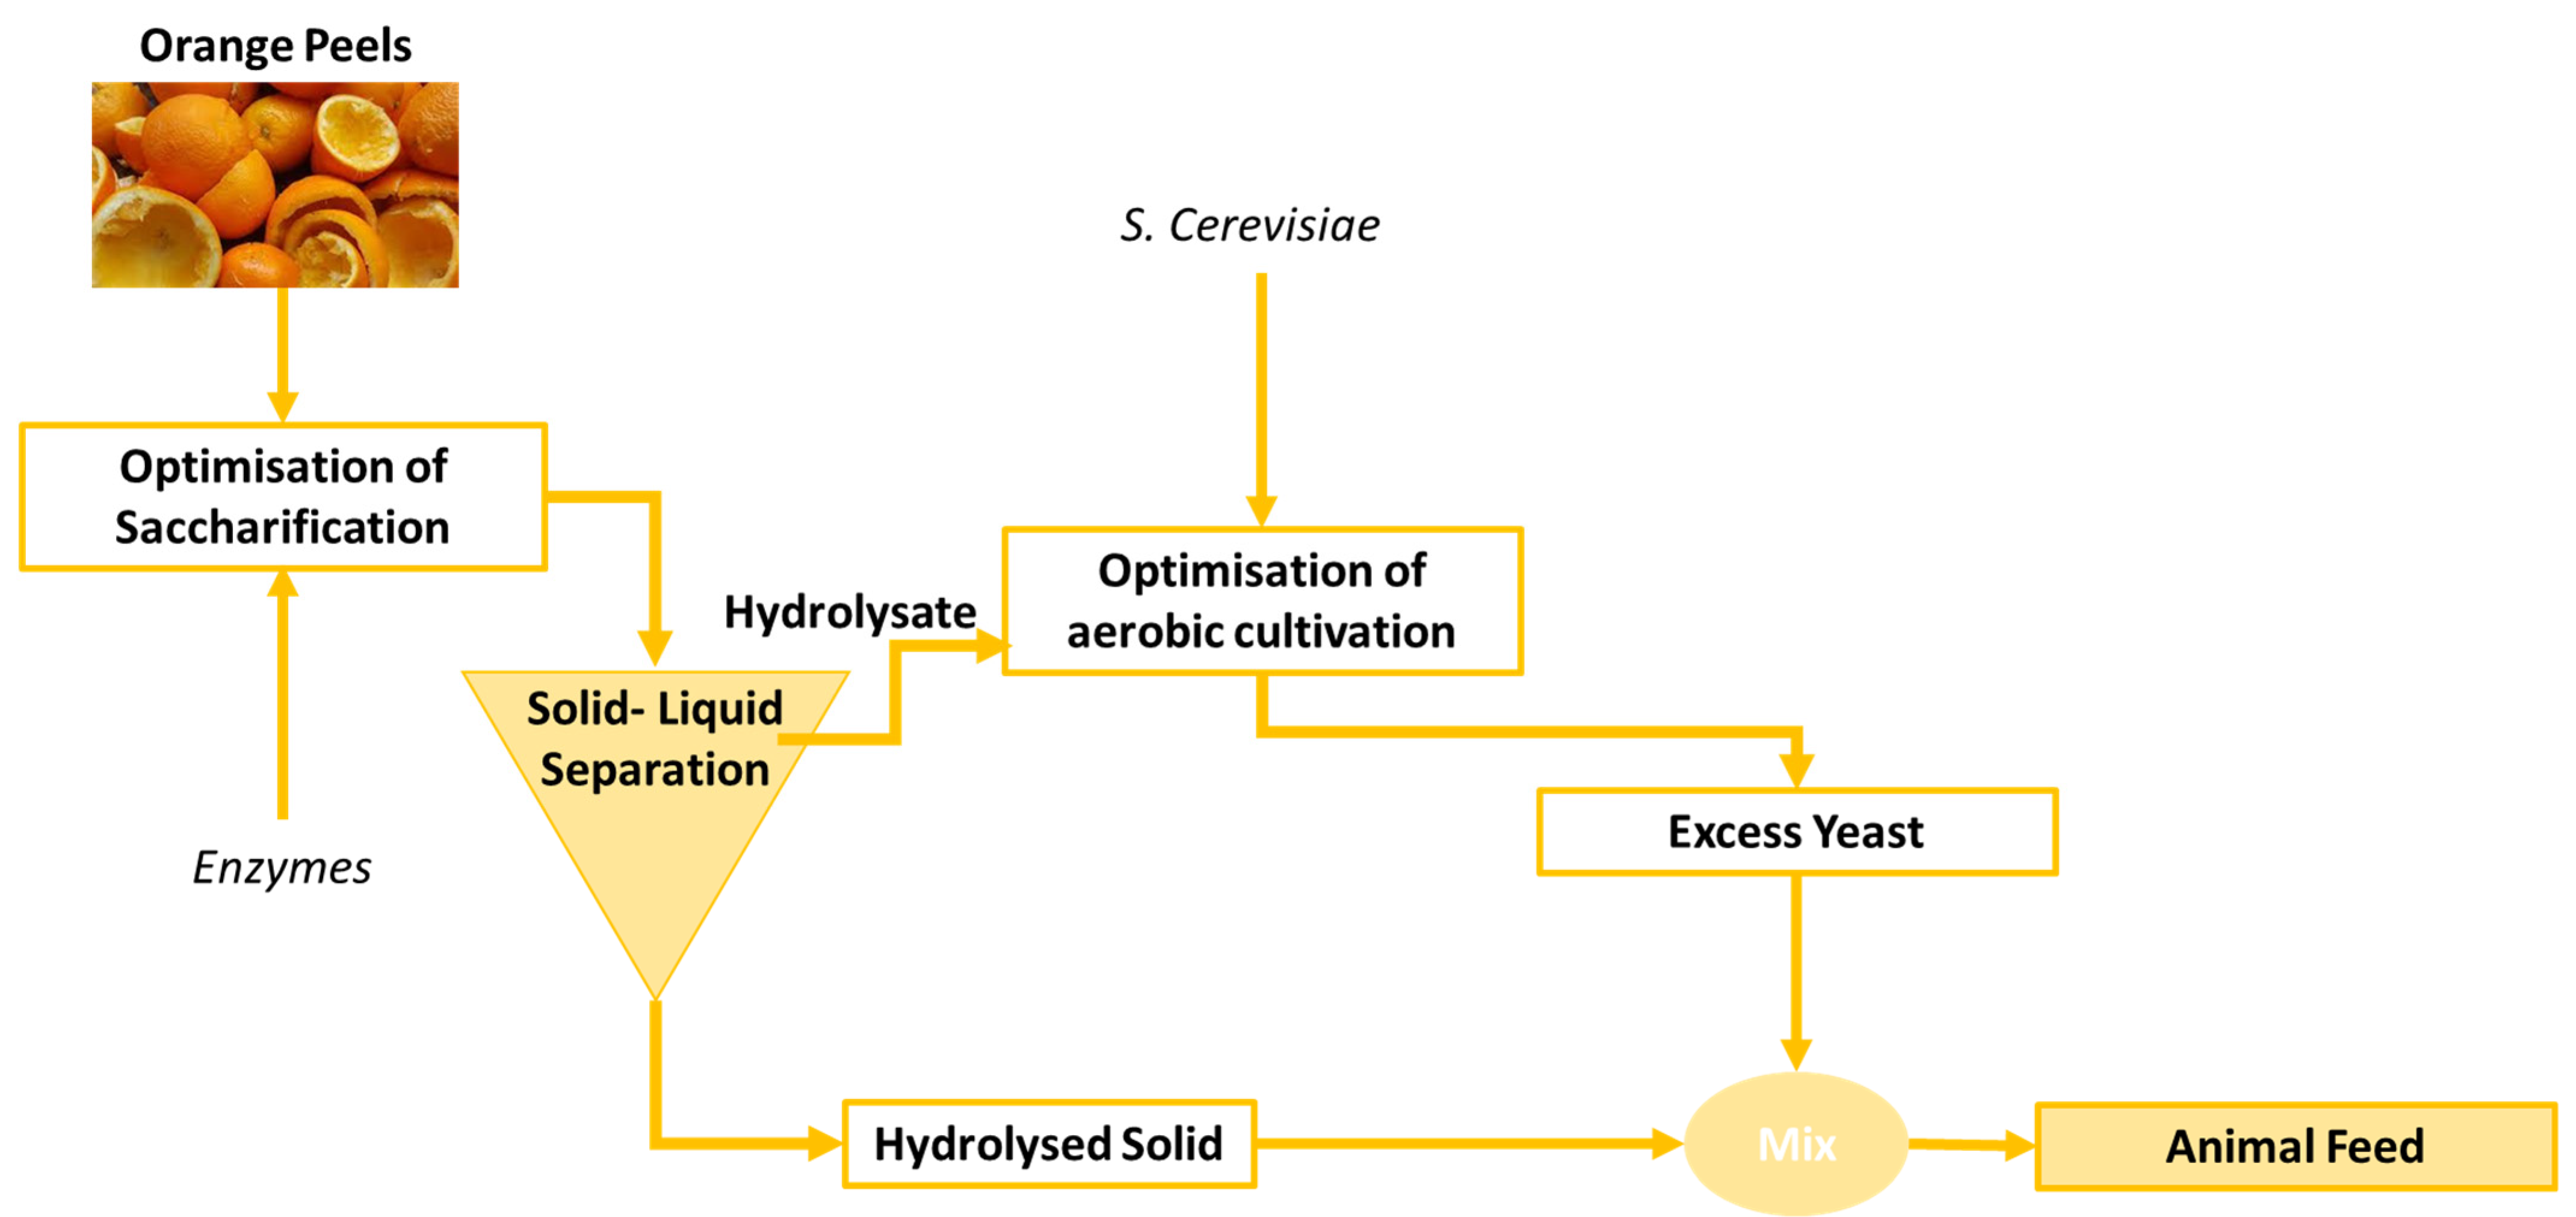
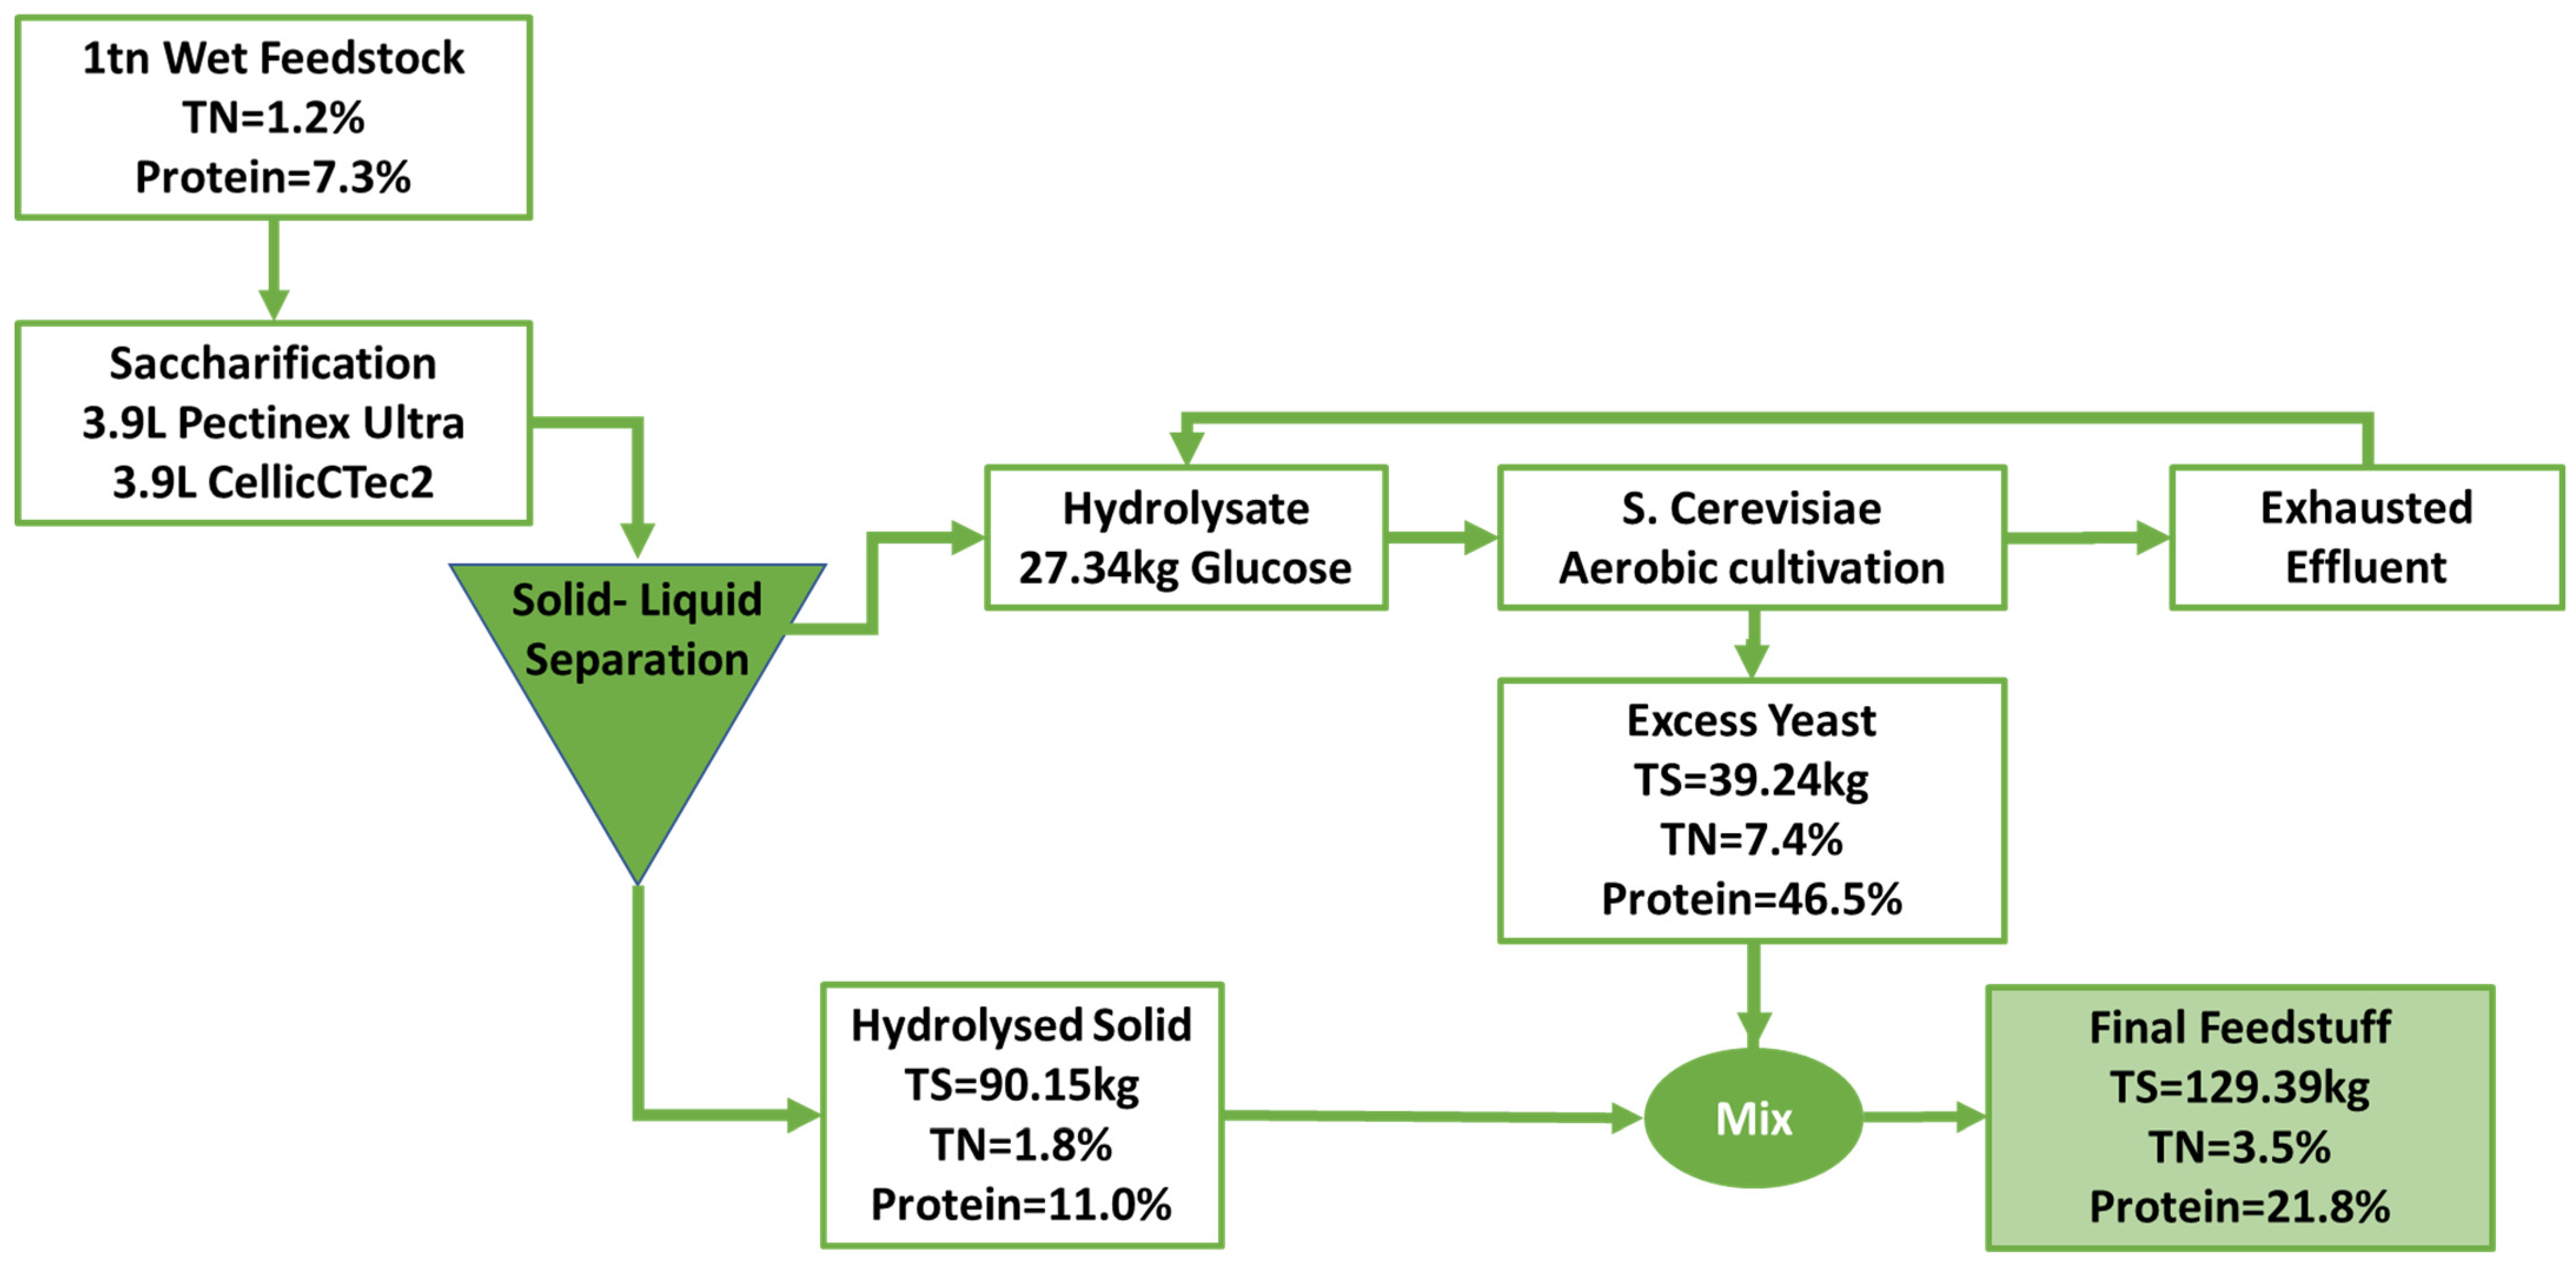
2.3. Experimental Process
2.3.1. Saccharification Process
2.3.2. Aerobic Fermentation
3. Results and Discussion
3.1. Orange Peels Composition
3.2. Orange Peels Saccharification
3.3. Optimisation of Aerobic Fermentation
3.4. Formulation of Animal Feedstuff
4. Concluding Remarks
- Raw material: The raw material producer is mainly the orange juice industry.
- Receiving, warehousing, maintaining inventory and transportation are all part of inbound logistics.
- Operations include all the processes necessary to convert orange peels into products—animal feedstuff.
- Activities such as the distribution of the finished products to a customer are included in outbound logistics.
- Strategies used in marketing and sales to increase visibility and target the right consumers include price, promotions, and advertising.
- The end-users, which are mainly animal feed companies, animal feed distributors, farmers and sheep products consumers.
Author Contributions
Funding
Institutional Review Board Statement
Informed Consent Statement
Data Availability Statement
Conflicts of Interest
References
- Md Nasir, N.A.N.; Kamaruddin, S.A.; Zakarya, I.A.; Aminul Islam, A.K.M. Sustainable Alternative Animal Feeds: Recent Advances and Future Perspective of Using Azolla as Animal Feed in Livestock, Poultry and Fish Nutrition. Sustain. Chem. Pharm. 2022, 25, 100581. [Google Scholar] [CrossRef]
- Ray, D.K.; Mueller, N.D.; West, P.C.; Foley, J.A. Yield Trends Are Insufficient to Double Global Crop Production by 2050. PLoS ONE 2013, 8, e66428. [Google Scholar] [CrossRef] [PubMed]
- Frona, D.; Janos, S.; Harangi-Rakos, M. The Challenge of Feeding the Poor. J. Sustain. 2019, 11, 5816. [Google Scholar] [CrossRef]
- Research and Markets. Russia Compound Feed Market—Growth, Trends and Forecasts (2020–2025). Available online: https://www.researchandmarkets.com/reports/5119287/russia-compound-feed-market-growth-trends-and (accessed on 11 November 2022).
- Mordor Intelligence. Ruminant Feed Market-Growth, Trends, COVID-19 Impact, and Forecasts (2022—2027). Hyderabad, Telangana, India. 2022. Available online: https://www.mordorintelligence.com/industry-reports/european-ruminant-feed-market (accessed on 16 November 2022).
- Erinle, T.J.; Adewole, D.I. Fruit Pomaces—Their Nutrient and Bioactive Components, Effects on Growth and Health of Poultry Species, and Possible Optimization Techniques. Anim. Nutr. 2022, 9, 357–377. [Google Scholar] [CrossRef]
- de Oliveira, C.O.; Roll, A.A.P.; Gonçalves, F.M.M.; Lopes, D.C.N.; Xavier, E.G. Olive Pomace for the Feeding of Commercial Poultry: Effects on Performance, Meat and Eggs Quality, Haematological Parameters, Microbiota and Immunity. Worlds. Poult. Sci. J. 2021, 77, 363–376. [Google Scholar] [CrossRef]
- Alhotan, R.A. Commercial Poultry Feed Formulation: Current Status, Challenges, and Future Expectations. Worlds. Poult. Sci. J. 2021, 72, 279–299. [Google Scholar] [CrossRef]
- Duoss-Jennings, H.A.; Schmidt, T.; Callaway, T.R.; Carroll, J.A.; Martin, J.M.; Shields-Menard, S.A.; Broadway, P.R.; Donaldson, J.R. Effect of Citrus Byproducts on Survival of O157:H7 and Non-O157 Escherichia Coli Serogroups within In Vitro Bovine Ruminal Microbial Fermentations. Hindawi Publ. Corp. 2013, 2013, 398320. [Google Scholar] [CrossRef]
- Alnaimy, A. Using of Citrus By-Products in Farm Animals Feeding. Open Access J. Sci. 2017, 1, 58–67. [Google Scholar] [CrossRef]
- Bakkali, F.; Averbeck, S.; Averbeck, D.; Idaomar, M. Biological Effects of Essential Oils—A Review. Food Chem. Toxicol. 2008, 46, 446–475. [Google Scholar] [CrossRef]
- Bampidis, V.A.; Robinson, P.H. Citrus By-Products as Ruminant Feeds: A Review. Anim. Feed. Sci. Technol. 2006, 128, 175–217. [Google Scholar] [CrossRef]
- Grasser, L.A.; Fadel, J.G.; Garnett, I.; Depeters, E.J. Quantity and Economic Importance of Nine Selected By-Products Used in California Dairy Rations. J. Dairy Sci. 1995, 78, 962–971. [Google Scholar] [CrossRef] [PubMed]
- Sluiter, J.; Sluiter, A. Summative Mass Closure: Laboratory Analytical Procedure (LAP) Review and Integration: Feedstocks; (Version 07-08-2011). 2010. Available online: https://www.nrel.gov/docs/gen/fy11/48087.pdf (accessed on 1 November 2022).
- Sluiter, A.; Hames, B.; Ruiz, R.; Scarlata, C.; Sluiter, J.; Templeton, D. Determination of Ash in Biomass. Natl. Renew. Energy Lab. 2005, 1, 1–8. [Google Scholar]
- Sluiter, A.; Hames, B.; Hyman, D.; Payne, C.; Ruiz, R.; Scarlata, C.; Sluiter, J.; Templeton, D.; Nrel, J.W. Determination of Total Solids in Biomass and Total Dissolved Solids in Liquid Process Samples. Natl. Renew. Energy Lab. 2008, 9, 3–5. [Google Scholar]
- Sluiter, A.; Ruiz, R.; Scarlata, C.; Sluiter, J.; Templeton, D. Determination of Extractives in Biomass. Natl. Renew. Energy Lab. 2005, 12, 1–16. [Google Scholar] [CrossRef]
- Association of Official Analytical Chemists (AOAC). Official Methods of Analysis of the Association of Official Analytical Chemists, 15th ed.; AOAC: Arlington, VA, USA, 1995. [CrossRef]
- Van Soest, P.J.; Robertson, J.B.; Lewis, B.A. Symposium: Carbohydrate Methodology, Metabolism, and Nutritional Implications in Dairy Cattle, Methods for Dietary Fiber, Neutral Detergent Fiber, and Nonstarch Polysaccharides in Relation to Animal Nutrition. J. Dairy Sci. 1991, 74, 3583–3597. [Google Scholar] [CrossRef]
- Forejtová, J.; Lád, F.; Třinaáctý, J.; Richter, M.; Gruber, L.; Doležal, P.; Homolka, P.; Pavelek, L. Comparison of Organic Matter Digestibility Determined by in Vivo and in Vitro Methods. Czech J. Anim. Sci. 2005, 50, 47–53. [Google Scholar] [CrossRef]
- Pell, A.N.; Schofield, P. Computerized Monitoring of Gas Production to Measure Forage Digestion in Vitro. J. Dairy Sci. 1993, 76, 1063–1073. [Google Scholar] [CrossRef]
- Adney, B.; Baker, J. Measurement of Cellulase Activities: Laboratory Analytical Procedure (LAP). 2008. Available online: https://www.nrel.gov/docs/gen/fy08/42628.pdf (accessed on 21 November 2022).
- Grohmann, K.; Baldwin, E.A. Hydrolysis of Orange Peel with Pectinase and Cellulase Enzymes. Biotechnol. Lett. 1992, 14, 1169–1174. [Google Scholar] [CrossRef]
- Alder, P.; Markova, E.V.; Granovsky, V. The Design of Experiments to Find Optimal Conditions a Programmed Introduction to the Design of Experiments; MIR Publishers: Moscow, Russia, 1975. [Google Scholar]
- Cochran, W.G.; Cox, G.M. Experimental Designs, 2nd ed.; Sons, J.W., Ed.; John WIley & Sons: New York, NY, USA, 1957. [Google Scholar]
- Salari, R.; Salari, R. Investigation of the Best Saccharomyces Cerevisiae Growth Condition. Electron. Physician 2016, 8, 3057–3061. [Google Scholar] [CrossRef]
- Rodrigues, C.I.S.; Wahl, A.; Gombert, A.K. Aerobic Growth Physiology of Saccharomyces Cerevisiae on Sucrose Is Strain-Dependent. FEMS Yeast Res. 2021, 21, foab021. [Google Scholar] [CrossRef]
- van Dijk, M.; Mierke, F.; Nygård, Y.; Olsson, L. Nutrient-Supplemented Propagation of Saccharomyces Cerevisiae Improves Its Lignocellulose Fermentation Ability. AMB Express 2020, 10, 157. [Google Scholar] [CrossRef] [PubMed]
- Hagman, A.; Piškur, J. A Study on the Fundamental Mechanism and the Evolutionary Driving Forces behind Aerobic Fermentation in Yeast. PLoS ONE 2015, 10, e0116942. [Google Scholar] [CrossRef] [PubMed]
- Marín, F.R.; Soler-Rivas, C.; Benavente-García, O.; Castillo, J.; Pérez-Alvarez, J.A. By-Products from Different Citrus Processes as a Source of Customized Functional Fibres. Food Chem. 2007, 100, 736–741. [Google Scholar] [CrossRef]
- Bicu, I.; Mustata, F. Cellulose Extraction from Orange Peel Using Sulfite Digestion Reagents. Bioresour. Technol. 2011, 102, 10013–10019. [Google Scholar] [CrossRef]
- Ververis, C.; Georghiou, K.; Danielidis, D.; Hatzinikolaou, D.G.; Santas, P.; Santas, R.; Corleti, V. Cellulose, Hemicelluloses, Lignin and Ash Content of Some Organic Materials and Their Suitability for Use as Paper Pulp Supplements. Bioresour. Technol. 2007, 98, 296–301. [Google Scholar] [CrossRef] [PubMed]
- Rivas, B.; Torrado, A.; Torre, P.; Converti, A.; Domínguez, J.M. Submerged Citric Acid Fermentation on Orange Peel Autohydrolysate. J. Agric. Food Chem. 2008, 56, 2380–2387. [Google Scholar] [CrossRef] [PubMed]
- Oloche, J.; Ayoade, J.A.; Oluremi, O.I.A. In Vitro Gas Production Parameters and Characteristics of Four Types of Sweet Orange (Citrus Sinensis) Peels Meal. IOSR J. Agric. Vet. Sci. 2013, 5, 5–8. [Google Scholar] [CrossRef]
- Vlyssides, A.G.; Arapoglou, D.G.; Israilides, C.J.; Barampouti, E.M.P.; Mai, S.T. Electrochemical Treatment of Methyl Parathion Based on the Implementation of a Factorial Design. J. Appl. Electrochem. 2004, 34, 1265–1269. [Google Scholar] [CrossRef]
- Vlyssides, A.; Barampouti, E.M.; Mai, S.; Veysidis, A. Application of Fenton’s Reagent on Wastewater from a Wood Processing Industry. Environ. Eng. Sci. 2008, 25, 327–332. [Google Scholar] [CrossRef]


| Parameter | Low Level (−) | High Level (+) | Center (0) |
|---|---|---|---|
| Pectinex (μL/g TS) | 25 | 75 | 50 |
| CellicCTec3 (μL/g TS) | 25 | 75 | 50 |
| Loading (%) | 2.5 | 7.5 | 5 |
| Experiments | Pectinex (μL/g TS) | CellicCTec3 (μL/g TS) | Loading (%) |
|---|---|---|---|
| S.1 | 25 | 25 | 2.5 |
| S.2 | 25 | 25 | 7.5 |
| S.3 | 25 | 75 | 7.5 |
| S.4 | 25 | 75 | 2.5 |
| S.5 | 75 | 75 | 2.5 |
| S.6 | 75 | 75 | 7.5 |
| S.7 | 75 | 75 | 7.5 |
| S.8 | 75 | 25 | 2.5 |
| S.9 | 50 | 50 | 5 |
| Nutrients | KH2PO4 | (NH4)2SO4 | MgSO4 |
|---|---|---|---|
| Concentration (g/L) | 5 | 2 | 0.4 |
| Parameter | Low Level (−) | High Level (+) |
|---|---|---|
| Nutrients addition | NO | YES |
| Yeast/Glucose (w/w) | 0.005 | 0.02 |
| pH control | NO | YES |
| No. | Nutrients Addition | Yeast/Glucose (w/w) | pH Control |
|---|---|---|---|
| F.1 | YES | 0.020 | YES |
| F.2 | YES | 0.020 | NO |
| F.3 | YES | 0.005 | YES |
| F.4 | YES | 0.005 | NO |
| F.5 | NO | 0.020 | YES |
| F.6 | NO | 0.020 | NO |
| F.7 | NO | 0.005 | YES |
| F.8 | NO | 0.005 | NO |
| Component | Average | ||
|---|---|---|---|
| TS (%) | 15.5 | ± | 0.8 |
| Moisture (%) | 84.5 | ± | 0.8 |
| Ether extract (% d.b.) | 4.1 | ± | 2.4 |
| Water Soluble Solids (% d.b.) | 25.9 | ± | 7.6 |
| VS (% d.b.) | 95.7 | ± | 0.5 |
| Ash (% d.b.) | 4.3 | ± | 0.5 |
| Cellulose (% d.b.) | 17.2 | ± | 2.7 |
| Hemicellulose (% d.b.) | 37.2 | ± | 3.3 |
| Acid Soluble Lignin (% d.b.) | 1.7 | ± | 0.1 |
| Acid Insoluble Residue (% d.b.) | 15.7 | ± | 6.1 |
| TN (% d.b.) | 1.2 | ± | 0.2 |
| Crude Protein (% d.b.) | 7.2 | ± | 1.0 |
| Neutral Detergent Fibre (NDF) (% d.b.) | 42.8 | ± | 11.2 |
| Acid Detergent Fibre (ADF) (% d.b.) | 30.0 | ± | 5.3 |
| Lignin Acid Detergent (ADL) (% d.b.) | 7.1 | ± | 3.8 |
| In Vitro Organic Matter Digestibility (IVOMD) (% d.b.) | 72.7 | ± | 1.0 |
| Experiments | Pectinex (μL/g TS) | CellicCTec3 (μL/g TS) | Loading (%) | Glucose (g/L) | TRS (g/L) | TOC (g/L) | ||||||
|---|---|---|---|---|---|---|---|---|---|---|---|---|
| S.1 | 25 | 25 | 2.5 | 3.6 | ± | 0.3 | 6.5 | ± | 0.1 | 8.3 | ± | 0.2 |
| S.2 | 25 | 25 | 7.5 | 13.2 | ± | 0.1 | 20.7 | ± | 1.8 | 25.9 | ± | 0.3 |
| S.3 | 25 | 75 | 7.5 | 4.7 | ± | 0.4 | 6.8 | ± | 1.0 | 9.0 | ± | 0.1 |
| S.4 | 25 | 75 | 2.5 | 12.9 | ± | 0.5 | 20.2 | ± | 0.9 | 27.9 | ± | 0.9 |
| S.5 | 75 | 75 | 2.5 | 3.6 | ± | 0.0 | 4.1 | ± | 0.7 | 9.5 | ± | 0.2 |
| S.6 | 75 | 75 | 7.5 | 13.1 | ± | 0.1 | 21.4 | ± | 0.2 | 28.8 | ± | 0.5 |
| S.7 | 75 | 75 | 7.5 | 5.0 | ± | 0.1 | 7.2 | ± | 0.6 | 10.0 | ± | 0.5 |
| S.8 | 75 | 25 | 2.5 | 13.6 | ± | 0.2 | 28.1 | ± | 1.7 | 28.4 | ± | 1.3 |
| S.9 | 50 | 50 | 5 | 9.3 | ± | 0.0 | 15.0 | ± | 1.4 | 18.6 | ± | 0.3 |
| Experiments | Pectinex (μL/g TS) | CellicCTec3 (μL/g TS) | Loading (%) | TN (%) | WS (%) | Cellulose (%) | Hemicellulose (%) | AIR (%) | ASL (%) | ||||||||||||
|---|---|---|---|---|---|---|---|---|---|---|---|---|---|---|---|---|---|---|---|---|---|
| S.1 | 25 | 25 | 2.5 | 1.6 | ± | 0.1 | 14.1 | ± | 0.6 | 8.9 | ± | 0.2 | 26.2 | ± | 3.3 | 23.6 | ± | 1.2 | 2.1 | ± | 0.0 |
| S.2 | 25 | 25 | 7.5 | 1.4 | ± | 0.2 | 29.3 | ± | 0.3 | 6.4 | ± | 0.4 | 20.5 | ± | 0.8 | 20.7 | ± | 1.4 | 2.0 | ± | 0.0 |
| S.3 | 25 | 75 | 7.5 | 1.9 | ± | 0.1 | 11.6 | ± | 1.1 | 8.9 | ± | 0.3 | 28.3 | ± | 0.2 | 23.3 | ± | 0.1 | 2.3 | ± | 0.2 |
| S.4 | 25 | 75 | 2.5 | 1.4 | ± | 0.0 | 28.1 | ± | 5.7 | 5.8 | ± | 0.3 | 23.2 | ± | 4.1 | 19.6 | ± | 0.2 | 1.6 | ± | 0.2 |
| S.5 | 75 | 75 | 2.5 | 1.7 | ± | 0.0 | 17.5 | ± | 1.1 | 6.5 | ± | 0.8 | 24.0 | ± | 1.1 | 25.7 | ± | 0.5 | 1.9 | ± | 0.1 |
| S.6 | 75 | 75 | 7.5 | 1.6 | ± | 0.5 | 30.6 | ± | 2.9 | 5.6 | ± | 0.2 | 25.1 | ± | 2.5 | 20.7 | ± | 0.8 | 1.6 | ± | 0.1 |
| S.7 | 75 | 75 | 7.5 | 1.4 | ± | 0.0 | 12.1 | ± | 1.5 | 6.6 | ± | 0.3 | 31.1 | ± | 3.1 | 22.5 | ± | 0.3 | 2.2 | ± | 0.1 |
| S.8 | 75 | 25 | 2.5 | 1.8 | ± | 0.0 | 30.4 | ± | 1.8 | 5.2 | ± | 0.4 | 22.9 | ± | 0.3 | 19.1 | ± | 0.5 | 1.7 | ± | 0.1 |
| S.9 | 50 | 50 | 5 | 1.5 | ± | 0.0 | 18.8 | ± | 2.4 | 6.7 | ± | 0.3 | 28.7 | ± | 1.6 | 21.4 | ± | 2.5 | 1.9 | ± | 0.1 |
| Experiments | Pectinex (μL/g TS) | CellicCTec3 (μL/g TS) | Loading (%) | TS Degradation (%) | Cellulose Degradation (%) | Hemicellulose Degradation (%) | Sugars Yield Ys (g Glucose/100 g TS) | ||||||||
|---|---|---|---|---|---|---|---|---|---|---|---|---|---|---|---|
| S.1 | 25 | 25 | 2.5 | 57.1 | ± | 0.0 | 75.1 | ± | 0.6 | 71.0 | ± | 3.6 | 12.4 | ± | 1.0 |
| S.2 | 25 | 25 | 7.5 | 42.0 | ± | 2.9 | 75.8 | ± | 0.3 | 69.4 | ± | 0.3 | 14.6 | ± | 0.2 |
| S.3 | 25 | 75 | 2.5 | 59.4 | ± | 1.0 | 76.5 | ± | 1.3 | 70.4 | ± | 0.9 | 16.6 | ± | 1.7 |
| S.4 | 25 | 75 | 7.5 | 47.1 | ± | 0.9 | 80.7 | ± | 0.5 | 68.4 | ± | 5.1 | 14.3 | ± | 0.6 |
| S.5 | 75 | 25 | 2.5 | 59.4 | ± | 0.7 | 82.9 | ± | 2.3 | 74.8 | ± | 1.6 | 12.2 | ± | 0.1 |
| S.6 | 75 | 25 | 7.5 | 50.4 | ± | 0.6 | 81.9 | ± | 0.7 | 68.0 | ± | 3.6 | 14.4 | ± | 0.1 |
| S.7 | 75 | 75 | 2.5 | 66.3 | ± | 1.1 | 79.7 | ± | 0.6 | 62.3 | ± | 3.2 | 17.7 | ± | 0.4 |
| S.8 | 75 | 75 | 7.5 | 52.9 | ± | 0.8 | 88.7 | ± | 0.5 | 80.1 | ± | 0.4 | 15.1 | ± | 0.2 |
| S.9 | 50 | 50 | 5 | 55.1 | ± | 1.2 | 81.6 | ± | 1.4 | 66.7 | ± | 1.6 | 16.3 | ± | 0.4 |
| No. | Nutrients Addition | Yeast/Glucose (w/w) | pH Control | Glucose (g/L) | Ethanol (g/L) | Yaer (g/g) | ||||||
|---|---|---|---|---|---|---|---|---|---|---|---|---|
| F.1 | YES | 0.020 | YES | 0.3 | ± | 0.0 | 0.3 | ± | 0.0 | 0.8 | ± | 0.1 |
| F.2 | YES | 0.020 | NO | 0.0 | ± | 0.0 | 0.1 | ± | 0.0 | 0.9 | ± | 0.2 |
| F.3 | YES | 0.005 | YES | 0.0 | ± | 0.0 | 0.0 | ± | 0.0 | 0.6 | ± | 0.1 |
| F.4 | YES | 0.005 | NO | 0.0 | ± | 0.0 | 0.0 | ± | 0.0 | 0.8 | ± | 0.0 |
| F.5 | NO | 0.020 | YES | 0.0 | ± | 0.0 | 0.1 | ± | 0.0 | 0.4 | ± | 0.2 |
| F.6 | NO | 0.020 | NO | 0.0 | ± | 0.0 | 0.1 | ± | 0.0 | 0.2 | ± | 0.0 |
| F.7 | NO | 0.005 | YES | 0.0 | ± | 0.0 | 0.0 | ± | 0.0 | 0.8 | ± | 0.4 |
| F.8 | NO | 0.005 | NO | 0.0 | ± | 0.0 | 0.1 | ± | 0.0 | 0.7 | ± | 0.2 |
| Parameter | Feedstuff Prepared under the Optimum Experimental Conditions |
|---|---|
| TS (%) | 94.78 ± 1.22 |
| Moisture (%) | 5.22 ± 1.22 |
| Ash (d.b. %) | 5.03 ± 0.88 |
| VS (d.b. %) | 94.97 ± 0.88 |
| Oil (d.b. %) | 2.25 ± 0.43 |
| TN (d.b. %) | 3.48 ± 0.17 |
| Crude Protein (d.b. %) | 21.77 ± 0.17 |
| Cellulose (d.b. %) | 6.80 ± 0.68 |
| Hemicellulose (d.b. %) | 17.94 ± 1.16 |
| Acid Insoluble Residue (d.b. %) | 18.92 ± 0.56 |
| Ether Extract (d.b. %) | 2.96 ± 0.41 |
| Neutral Detergent Fibre (NDF) (d.b. %) | 28.54 ± 2.31 |
| Acid Detergent Fibre (ADF) (d.b. %) | 17.81 ± 1.98 |
| Lignin Acid Detergent (ADL) (d.b. %) | 6.43 ± 0.17 |
| In Vitro Organic Matter Digestibility (IVOMD) (d.b. %) | 89.5 ± 1.11 |
Disclaimer/Publisher’s Note: The statements, opinions and data contained in all publications are solely those of the individual author(s) and contributor(s) and not of MDPI and/or the editor(s). MDPI and/or the editor(s) disclaim responsibility for any injury to people or property resulting from any ideas, methods, instructions or products referred to in the content. |
© 2023 by the authors. Licensee MDPI, Basel, Switzerland. This article is an open access article distributed under the terms and conditions of the Creative Commons Attribution (CC BY) license (https://creativecommons.org/licenses/by/4.0/).
Share and Cite
Andrianou, C.; Passadis, K.; Malamis, D.; Moustakas, K.; Mai, S.; Barampouti, E.M. Upcycled Animal Feed: Sustainable Solution to Orange Peels Waste. Sustainability 2023, 15, 2033. https://doi.org/10.3390/su15032033
Andrianou C, Passadis K, Malamis D, Moustakas K, Mai S, Barampouti EM. Upcycled Animal Feed: Sustainable Solution to Orange Peels Waste. Sustainability. 2023; 15(3):2033. https://doi.org/10.3390/su15032033
Chicago/Turabian StyleAndrianou, Christina, Konstantinos Passadis, Dimitris Malamis, Konstantinos Moustakas, Sofia Mai, and Elli Maria Barampouti. 2023. "Upcycled Animal Feed: Sustainable Solution to Orange Peels Waste" Sustainability 15, no. 3: 2033. https://doi.org/10.3390/su15032033
APA StyleAndrianou, C., Passadis, K., Malamis, D., Moustakas, K., Mai, S., & Barampouti, E. M. (2023). Upcycled Animal Feed: Sustainable Solution to Orange Peels Waste. Sustainability, 15(3), 2033. https://doi.org/10.3390/su15032033