Abstract
Participatory energy planning at the local level engages citizens, builds legitimacy and trust, and increases successful implementation of renewable energies. In the context of heat planning, technology choices highly vary depending on the local context and social conditions and including social input therefore benefits the planning process. This research adds to the current literature, which lacks concrete examples and verified approaches that clarify what the guiding principles of participatory energy planning are and how the opportunities and challenges can be dealt with. This paper elaborates on these opportunities and challenges and proposes a process design, using multiple tools (a survey, an Information-choice Questionnaire, and workshops) to collect the social input that is necessary to make technology choices in a participatory manner. The process design is applied and tested in a case study of a Dutch neighbourhood and lessons learned are drafted as a basis for further research.
1. Introduction
There is general consensus among scholars and policy-makers that participation of citizens in renewable energy planning is highly relevant, not least to enhance successful implementation and build legitimacy for the proposed solution []. Other effects, such as robustness of results, stakeholder learning, formation of new social networks, and the strengthening of relationships between various stakeholder groups are also regularly mentioned []. However, methods for citizen participation, including the development of adequate tools, are limitedly studied in the context of energy. Participation and community engagement only play a marginal role in energy governance research []. Participation is also focused on stakeholders, experts, and policymakers rather than citizens []. Additionally, in the field of energy modelling, stakeholder representation is hardly included in existing studies and modelling tools [].
McGookin et al. [] created an overview of existing participation methods, thereby summarising methods that are used for facilitating stakeholder input in quantitative analyses, including multicriteria decision analysis and system dynamics modelling. Although these techniques appeared to be useful in individual cases, several shortcomings with the existing studies can be identified. Firstly, most of the research on public participation in renewable energy has mainly focused on single-case evaluation [,] and insights in the applicability to a variety of cases and contexts are missing. Secondly, the focus of participation in renewable energy planning lies on creating acceptance after decisions have been made rather than on the assessment of options []. A scenario approach is more often used for developing a shared vision or for explorative scenario generation, than for consensus building []. Thirdly, most participatory modelling studies are based on single interactions for stakeholder input and the majority of the cases studied exhibit limited evaluation of and feedback on results, as identified by McGookin []. They state that the stakeholder process should be iterative, where participants evaluate the results as well as take part in shaping solutions. Huttunen et al. [] also found that citizens are rarely engaged throughout the research process. Including reflexivity, referring to the principle of stakeholders providing feedback that is taken into account in the further process, would be essential to realise a form of participation that reaches the full benefits of co-creation of knowledge [,]. Currently, citizens feel locked-out of decision-making [], and cooperative mechanisms that empower local people to engage in policy and decision-making are much needed.
An additional point of attention is that the focus should not shift to the social aspect alone but should lie on the integration of complex, technical information and associated decision-making with the social process of decision-making. Owens and Driffil [] have also pointed to the need for socio-technical interdisciplinarity in the context of energy, enabling more productive dialogue and enhancing learning between disciplines. Cajot et al. [] stressed the need for a combination of interconnected solutions, which reinforce each other to tackle the issues of urban and energy planning in a comprehensive and dynamic way. Contributions in this field should focus on these cutting-edge disciplines. Successful implementation of renewable energies is not a matter of techno-economic optimisation, but “a process in which the ‘social’ and the ‘technical’ are inextricably intertwined, and technologies co-evolve with programmes of governing”, as described by Corsini et al. []. Most existing research on the topic, however, uses stakeholder engagement theory []. The weakness of this approach is that participation may become a communications and legitimacy strategy rather than an empowering process for citizens’ initiative [,].
Some studies have proposed participatory approaches that respond to the need for interdisciplinarity and for processes rather than single interventions. The Cities4ZERO project [], for instance, developed a participatory planning approach consisting of different steps that involve stakeholders in multiple ways, and is one of few examples where a full process design is outlined. The Smart Energy Cities project [] uses a stepwise method where social neighbourhood categorisation simultaneously takes place with techno-economic scenario building. Heaslip and Fahy went a step further with a transdisciplinary design, with a larger focus on co-creative contributions of the community []. What could still be strengthened in these approaches is a clearer translation of social data to technology choices within the participation process.
This paper builds on the work of [,], where the techno-economic modelling and social data gathering were presented as separate methods, and contributes to the body of knowledge by bringing those together in an integrated, participatory planning process design that deals with the addressed issues of reflexivity in community engagement, collective decision-making, and the translation of social data to technology choices by a mixed method approach. A process design consists of multiple methods that are necessary to facilitate a reflexive, empowering social process, in line with what the literature suggests. The approach is applied and tested in a case study in Groningen, The Netherlands. Insights from this case study deliver recommendations for how to move forward in participatory energy planning research and practice.
The paper is organised as follows: First, we go deeper into some issues in participatory approaches and lessons learned so far and assemble criteria for participatory approaches (Section 2.1). Then, we present our method, where we introduce the tools that we used in the process design and how they deal with the previously identified requirements and challenges (Section 2.2). In Section 3, we present our findings from the case study and discuss the lessons learned from applying this new method to each process step, as well as the process of translation of social data to technology choices. In Section 4, we draw conclusions based on what we learned in the case study and outline relevant recommendations for policy-makers and practitioners in the field of local energy planning.
2. Methodology
2.1. Criteria
With the deficiencies and challenges of studied participatory approaches in mind, a participatory process was designed that meets the following criteria:
- Facilitates multiple interactions between planners and citizens.
- Includes representative stakeholder groups.
- Stimulates group thinking and collective spirit.
- Provides information based on which informed decision-making can take place.
- Includes evaluation and feedback moments with citizens.
- Translates social data to scenario selection.
- Facilitates reaching a consensus on a preferred solution.
Despite the many advantages of participatory methods, including promoting legitimacy, building trust, reducing conflict, supporting mutual understanding, and building social capital, critics have also raised concerns. One of those concerns includes certain forms of participation being ineffective and time-consuming [,]. Related to the participants themselves, critics argue that citizens lack expertise and knowledge and are rather motivated by their personal interest, instead of acting on behalf of the public good []. These aspects can be considered not necessarily weaknesses, but rather conditions to a successful approach that should be adequately dealt with. In the following sections, we further elaborate on some of those main conditions and criteria.
2.1.1. Inclusiveness and Representativeness of Stakeholder Groups
Although it is necessary to involve a diverse group of participants [], participants in renewable energy projects differ in relation to, i.e., age, sex, and education, where some groups are much better represented than others []. Often, only a small group is involved in the participation process, or there is a lack of representation from particular stakeholder groups []. Those who are already active or interested in sustainability issues or otherwise dominant groups are more easily engaged, which forms the risk of only engaging those groups []. Recruiting a representative participant group in the participation process is needed to gain legitimacy of the results []. Existing participatory planning instruments very limitedly take this into account. Charettes (design-based workshops) (e.g., []), multicriteria workshops (e.g., [,]), and similar methods that aim to bring together social process with scenario building, hardly address this issue and rather focus on the interaction between experts and groups of organised local stakeholders. In the literature, an increasing number of studies can be found that have identified ex post which groups participated in renewable energy projects [,,,,]. The narrow characteristics of participants indicates the need to pay more attention to involving groups that are less likely to participate. Implementation and acceptability can only be achieved when all stakeholders participate in all phases of the project [], as well as groups of less active citizens []. One reason for specific groups of citizens to not participate is a mismatch between the needs and desires of each group and the form of participation. Information meetings, for instance, can create barriers to participation due to the time, duration, way of communicating, and expected knowledge level. To better connect with the needs and desires of each group, it is important to map the diversity of the community at the start of a project and to develop participation forms that match the target group(s). To be able to involve a diverse group of citizens, and make it possible for everyone to participate on an equal basis, a solution would be to have multiple ways of communicating with citizens []. Brainstorming, for instance, requires a different skillset than discussing technical information. In the light of power inequalities, Huttunen et al. also mention that different methods are needed to both reach out to different groups of citizens and to enable their active contribution []. One of the ways to create an equal basis in dialogue is to let participants talk about personal experience, which stimulates ownership and understanding of the issue [].
2.1.2. Educating the Public
Policy and planning usually involve complex challenges. If citizens are to play a role in these decision-making processes and make decisions that can deliver reliable input to policy-makers, understanding of the matter is a prerequisite to such a process. People should thus be educated on the policy problem, possible views and solutions, and impacts of choices. It is important that a range of options can be explored, thereby avoiding that people are pushed in targeted directions, as is often the case in public engagement techniques []. Participatory planning processes should facilitate educating the participants, so that they are able to make informed choices. Huttunen et al. [] mention several examples of studies that show that participants were better able to make informed decisions after receiving information. Komendantova et al. [], for instance, showed in a case study using multi-criteria decision analysis that understanding of the relation between the modelling results and the expressed preferences for the criteria made participants change their criteria rankings. Similarly, Mah et al. [] showed that learning enabled participants to make trade-offs between more complex energy decisions.
2.1.3. Dealing with Complexity of Information
One of the main challenges in participatory energy planning approaches is dealing with complex information. Most of the technical information is not only new to participants, but there are also various uncertainties, bandwidths, and assumptions in the data. When bringing quantitative methods in to the process, “time to explain and justify these assumptions to participants will consume a significant portion of a workshop” []. Overloading participants with large amounts of information and facts can make it difficult to engage a diverse group of participants together []. People tend to be most affected by tailored information, as was demonstrated by Abrahamse et al. [], while group decision-making is involved with a more general and abstract type of information. It is therefore a challenge to make a good consideration of which information is provided to whom, in what form, and in which phase of the project. What adds to the complexity issue is that information provision alone is not sufficient to change attitudes and behaviours, as physical, social, cultural, and institutional contexts shape and constrain people’s choices and options []. The way people perceive and process the information may be very well affected by those contexts. Information provision is also passive, whereas acceptance is anchored in interactive, deliberative communication with the public [,]. At the same time, information provision is also a necessary condition for starting dialogue [].
2.1.4. Group Thinking and Group Interactions
When discussing energy with various stakeholder groups, ideas are shared which have mutual influence on participants. Although this can have major benefits, such as building new stakeholder networks and collective learning, there are also downfalls that need to be considered and adequately dealt with in workshop design, such as cognitive biases and heuristics, ‘group thinking’ effects, or dominance of one or a few individuals, stakeholder fatigue, hidden assumptions, the risk of simplifications, challenges in uncertainty analysis, ambiguities in model interpretations, etc. [].
There are enough indications reported in the literature against the critique that people are just acting from self-interest and would not be able to think and act from a collective point of view. If the group process is facilitated in a way that creates an opportunity to discuss different views and motivations, deliberative dialogue can start to take place. The concept of deliberative dialogue refers to the idea that dialogue aims to bring together different views and create mutual understanding and ownership, thereby shifting the focus from the individual to the collective when it comes to taking action, and start seeing themselves as actors []. Talking helps people see the connection between self-interest and that of the group, leading to cooperative behaviour [].
2.2. Process Design
Figure 1 provides an overview of the process design, which consists of 5 steps: (1) exploration, (2) community scouting, (3) scenario development, (4) dialogue, and (5) decision-making. During the process, multiple tools are used, based on the work in [], in which a techno-economic model is presented that takes stakeholder differences into account, and [], in which a methodology is presented to create a social profile of a neighbourhood. The integration between social and techno-economic aspects of energy planning is central to the approach. Therefore, the process design includes a social line where social data were gathered using three different tools, and a technical line, where a techno-economic model was used to generate the required data on energy measures. The key aspect of the design is the integration line, where social data are translated to the modelling process: the social profile shapes boundary conditions for the (financial and practical) feasibility of measures, the technical preferences provide a first selection of possible scenarios, and the workshops allow a further refinement of the preferred scenario(s). In this way, social characteristics are shaping the technical solution and are funnelling the preferred solution further during the process. The model is applied in each of the 5 identified steps, from model runs with generic data in step 1 to one or a few detailed scenarios in step 5. Each phase was evaluated with the researchers and local stakeholders in an evaluation session around three evaluation themes: technical solutions, community participation, and information sharing. In the process of collective, transdisciplinary learning, these evaluation sessions, which form the scientific line, were essential. The tools are described in more detail in the following sections.
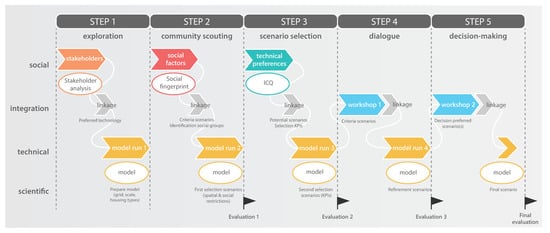
Figure 1.
Process design overview.
2.2.1. Stakeholder Analysis
Prior to contacting stakeholders in the neighbourhood, a stakeholder analysis can provide data to help one determine who should be involved in the process and reveal any concerns in the relationships among people that should be considered as the process moves forward. The relevant stakeholders were initially identified based on desk research and interviews with key stakeholders, and further expanded during the following phases (survey research and workshops) where more information came to light.
2.2.2. Social Fingerprint
To be able to design solutions that fit the neighbourhood, a good understanding of the social characteristics is necessary. Bouw et al. [] have developed a survey to map relevant social factors and construct a social profile that helps identify the weak and strong points of a neighbourhood. These insights can be translated to a practical approach, as shown in a case study based on this method [], and help identify some important boundary conditions for technology choices. The survey consisted of 40 questions, which measured 25 factors covering community factors, individual factors related to sustainability, demographic factors, socio-historic factors, and participation factors. More information on the theoretical framework can be found in [].
The survey was distributed on paper by door-to-door visits. Each house was visited at least once in the period of May–June 2022. Each respondent was asked to fill in the survey in hardcopy and agreed to a pick-up time. If respondents were not able to fill in the survey before one of the pick-up times or were not at home during one of those times, the respondents were offered to take the survey online. Much effort was put into creating a sufficiently large and representative group of respondents because this group was also invited to take part in the following questionnaire and workshops. The data were checked for coverage errors, sampling errors, and nonresponse errors. The neighbourhood was divided into clusters to ensure an equal distribution of respondents over the different streets and housing types. The data were subsequently compared with statistical data of the neighbourhood, including age, education, and household composition. Measurement errors have been overcome as much as possible by extensive testing and previous experiences with the survey, as described in [].
The gathered responses were analysed using SPSS, version 27, and the social profile showing 23 factors was visualised using R studio. To perform the visualisation, the items of this so-called ‘social fingerprint’ profile were expressed with a value on a 10-point scale by assigning them a weighting. For both ordinal and nominal variables, the mean was taken and then scaled with a weighting factor to create a 10-point scale to make them comparable. The process of creating a social fingerprint is described in more detail in [].
2.2.3. ICQ
Information-choice Questionnaires (ICQs) were originally developed to provide respondents with the necessary information to reach informed opinions about complex topics []. ICQs have been applied in the field of energy in recent years on the topics of Carbon Capture and Storage (CCS) [,,] and renewable energy in Kenya []. Previous research on ICQs has shown that opinions change after information was provided, confirming the use of providing information prior to asking one’s opinion on a topic which they have little knowledge about. Concerning the transition from gas heating to sustainable alternatives, knowledge deficits play a role as well as many people are not aware of all the characteristics and consequences of heating alternatives, such as heat pumps and district heating.
The ICQ was also chosen as a method to incorporate additional non-financial aspects of technologies as the developed techno-economic model primarily focuses on costs and CO2 emissions. As Li et al. show, costs alone do not have a decisive effect on homeowners’ choices []. It helps create insight into the sensitivities that are relevant in homeowners’ decision-making. ICQs and other quantitative methods such as Public Value Evaluation (PVE) provide information on impacts of policy options, and therefore have a stronger link to policy development and decisions than economic evaluation methods [].
Therefore, an ICQ was developed to measure technology preferences focused on three heating alternatives (all-electric heat pumps, hybrid heat pumps, and district heating). The technologies were not defined beforehand but were selected based on the results of step 2 (the social profile), see further information in Section 3.2.2. In contrast to some of the previous research, the ICQ in this context was not applied as a conclusive list of solutions to deduct a final choice, but rather as a selection of varying types of solutions to make a further selection of acceptable choices, after which additional tools (scenario workshops) were used to provide deeper information and decision-making. Various aspects of the technologies were included, such as costs, CO2 emissions, physical implications, and nuisance. A list of statements included in the ICQ is provided in Appendix A. This information was compiled by energy experts from a selection of knowledge institutions and translated for lay people by the researchers. Respondents were asked to evaluate each aspect of the technology and indicate a preference for one technology. All respondents to the social fingerprint survey that left an e-mail address and indicated to be interested in follow-up research received an invitation to participate in the ICQ. The ICQ was communicated as a preparation for the following workshop.
2.2.4. Techno-Economic Model
Data on the various techno-economic scenarios were generated with a model that was able to show results split in stakeholder groups and system components. The methodology was chosen for its ability to show consequences of choices for individual homeowners as well as the wider system and support discussion on how costs are distributed over different system components between various technology alternatives, for instance higher capital costs versus higher operational costs due to a high energy bill or grid costs. The methodology is described in detail by Bouw et al. [].
The model was applied in each step of the process, while increasingly narrowing down possible scenarios using the collected social data. In the first step, the model was run with general data to get an idea of the feasibility of different technology options. In the second step, local data were gathered and used to make the model more specific to the neighbourhood. The housing types were mapped as well as potential heat sources. Social boundary conditions were considered by potentially including or excluding technology options based on the level of collectivism and investment costs. In the third step, technical preferences, as identified in the ICQ, were added to further exclude unpreferred scenarios and/or focusing more on preferred scenarios. In steps 4 and 5, a selection of scenarios that were thought to be most fitting to the neighbourhood were presented and discussed in workshops.
2.2.5. Workshops
After collecting information on social boundary conditions and on technical preferences of people, workshops were organised to present a selection of potential scenarios to the people. The main goal of the workshops was to go into more detail on the possibilities and implications of technology choices to gain an understanding of the motivations behind preferences and potentially reach a consensus on a preferred solution. The group process is essential not only to make clear which solution is preferred by the inhabitants and what sensitivities need to be considered, but also to build ground for a collective project. In the Dutch policy context, the neighbourhood-by-neighbourhood approach is central in heat planning and therefore it is necessary to facilitate joint decision-making.
All respondents to the social fingerprint survey that left an e-mail address and indicated to be interested in follow-up research received an invitation to participate in a workshop. Additionally, the workshop was announced through the neighbourhood’s social media. The workshops took place in two rounds, where in the first round the focus was on presenting and discussing potential scenarios and in the second round the focus was on reaching consensus and decision-making. Different working methods were used in both workshops. In the first workshop, researchers presented possible scenarios, after which participants could respond in a group discussion. The second workshop had a more creative character, where participants could brainstorm about potential solutions. Both workshops physically took place in the community centre of the neighbourhood and were moderated by the researchers.
3. Results and Discussion
3.1. Short Case Description
The developed process design was applied in a case study of the combined neighbourhoods ‘De Hunze’ and ‘Van Starkenborgh’ in the city of Groningen (The Netherlands). De Hunze mainly consists of terraced and semi-detached houses that were built around 1990, whereas houses in Van Starkenborgh are somewhat newer and date from the period of 2002–2004 (see Figure 2). The houses have a good insulation level, varying in energy labels (the Dutch energy label system assigns a label to each house according to the thermal energy performance, from label G (very poor performance) to label A+ (very good performance)). Labels A to C and are all connected to the natural gas network. The sociodemographic characteristics of the neighbourhoods are summarised in Table 1.
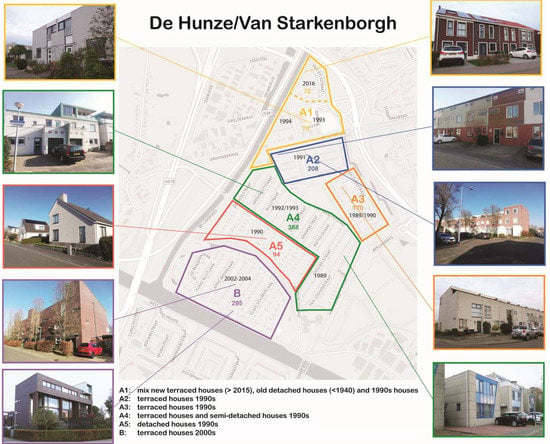
Figure 2.
Map of the neighbourhoods De Hunze and Van Starkenborgh divided into clusters of similar housing types. The photographs (author’s own collection) are illustrating the different housing types.
Distinctive for these neighbourhoods is the high income and education level, and the high share of private ownership. The neighbourhoods are located on the edge of the earthquake region of Groningen, where induced seismicity from gas extraction has caused (minor) damages to the houses. Many households have received or will receive governmental subsidies as compensation for the damages and/or value depreciation as well as a general subsidy for home improvements. This formed the motivation for a group of inhabitants, the ‘Energy Team’, to unite and support neighbours to use the money to invest in the sustainability of their own homes. In addition, the municipality has appointed this neighbourhood as an all-electric neighbourhood based on an initial policy study []. Therefore, the Energy Team finds it important to be well-informed about possibilities to become more sustainable to have a voice in the decision-making.

Table 1.
Statistical social data.
Table 1.
Statistical social data.
| Factor | Explanation | De Hunze | Van Starkenborgh | Source |
|---|---|---|---|---|
| Income | average personal income (×1000 euros) | 36.3 | 45.8 | [] |
| Education | %higher education * | 52.8% | 58.0% | [] |
| Homeownership | %owner occupied | 96.0% | 98.0% | [] |
| Ethnic background | %Dutch | 85.1% | 83.8% | [] |
| Household composition | average size | 2.3 | 2.9 | [] |
| Gas use | gas use in m3/year | 1320 | 1250 | [] |
| Electricity use | electricity use in kWh/year | 2760 | 3640 | [] |
* Higher education includes university and college education.
3.2. Case Study Results
The process design described in Section 2.2 was applied to the neighbourhoods De Hunze and Van Starkenborgh. The following sections will discuss the findings for each process step. First, the results are presented, after which the findings are discussed using the three evaluation themes (technical solutions, community participation, and information sharing). Finally, the ‘linkage’, the translation of the social data to the techno-economic scenario development, is explained.
3.2.1. Step 1: Exploration
Results: Only a limited number of stakeholders were involved at the start of the research as there is not a real project yet and the local energy initiative had only recently started. Therefore, we mapped the stakeholders currently involved and mapped their interests and power relations in a series of interviews. The main stakeholders are the Energy Team (the local energy initiative consisting of residents from the neighbourhood), the municipality, community association, and Grunneger Power, the city’s energy cooperative. The social survey (Section 2.2.2) did not reveal any other major local stakeholders, such as (semi) political organisations. We also asked which other stakeholders were likely or necessary to be involved in the future process. The stakeholders expect that technology specialists, communication consultants, grid operators, and the municipality would need to be involved in future steps.
Table 2 summarizes the results from the interviews. All identified stakeholders have interest in the project and also acknowledge that and have influence in the project to some extent. The municipality has the largest power over the project, as the measures are anchored in policies. In obligatory heat plans, municipalities have assigned technological solutions for each neighbourhood in the municipality as a preliminary and indicative choice.

Table 2.
Summary results of stakeholder analysis showing the interests and influence on/by the project to the organisation. Indicating the effects on a 5-point scale from --, indicating a very small effect, via 0, indicating a neutral effect, to ++, indicating a very large effect.
Linkage: For this neighbourhood, all-electric is included in those plans as the preferred choice, based on techno-economic analysis []. The municipality mentioned in the interview that a hybrid solution would also be acceptable. Efforts by the municipality mainly lie on realizing district heating in designated areas of the city, while in other areas the initiative lies with the residents. Active support from the municipality in the short term is limited due to time constraints and financial restrictions. The other local organisations, the Energy Team, community association, and Grunneger Power, do not have clear technology preferences but mainly want to support the neighbourhood in taking sustainable energy measures, in which sharing knowledge and experience is the main priority. Considering this context, all-electric needs to be evaluated and compared with other technological alternatives, that have vastly different consequences in terms of costs and practical implications, to determine to what extent this solution is acceptable for residents. Six discrete decarbonisation pathways based on diverse heating technologies have previously been identified by Bouw et al. [], and could be applied as guiding principles for this evaluation. The technology linkage, where a distinction can be made between preferred and possible scenarios or pathways, is graphically presented in Figure 3.
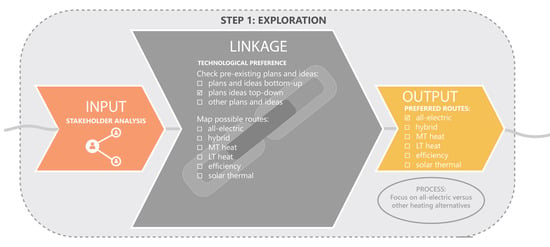
Figure 3.
Input–output diagram of process step 1, showing the translation of social data to technology choices (integration line).
3.2.2. Step 2: Community Scouting
Results: The survey yielded 310 respondents from a population of 1300 households, of which 260 responses were hard-copy and 50 were online. The sample was representative on a 95% confidence interval and margin of error of 5%. The demographic characteristics were compared with statistical data for the neighbourhood to check for representativeness (see Appendix A Table A2). The sample was largely representative, with some more respondents indicating to be higher educated than what the database reference shows. A total of 24 variables were mapped, based on which a social profile was constructed (see Appendix B). The social profile is visualised in Figure 4. The social profile provides insight into the weak and strong points of the neighbourhood (see Figure 5). We compared the results with five other neighbourhoods in which we collected data, to be able to better interpret the results.
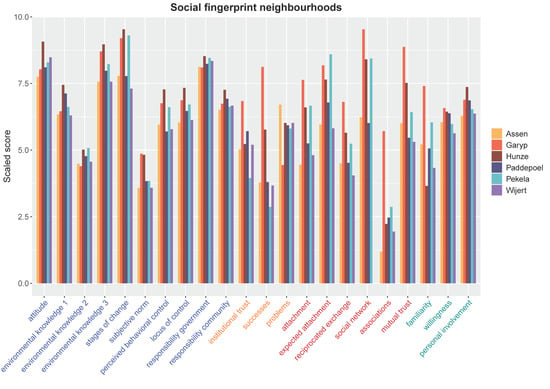
Figure 4.
Social fingerprint of De Hunze/Van Starkenborgh with 5 other neighbourhoods.
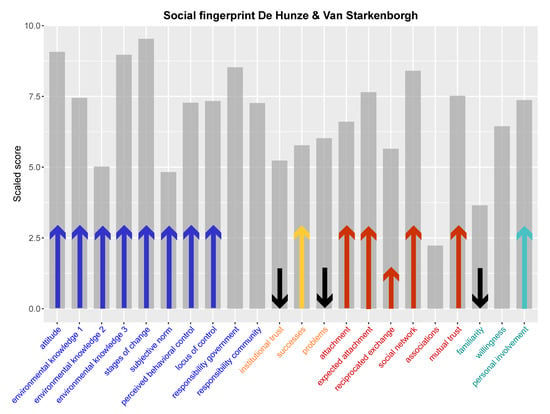
Figure 5.
Social fingerprint of De Hunze/Van Starkenborgh showing the weak (black arrows) and strong (coloured arrows) points of the neighbourhood.
We found high scores on all individual factors, including high levels of knowledge and control, also in comparison to other cases, as can be seen in Figure 4. Most of the community factors showed relatively high scores as well, indicating a good social cohesion, which is an important prerequisite for a collective project. One respondent described the neighbourhood as ‘a close and entrepreneurial neighbourhood’. We identified weaknesses in institutional trust, with a relatively large group having no trust in the municipality, and a high number of reported problems. The problems that were mentioned covered some issues that occur in many other neighbourhoods, such as speeding, dog poo, lack of greenkeeping, and waste. One specific issue was the repair of the nearby defective bridge, and in the specific way the municipality was handling this. The survey results showed moderate scores on memberships in associations and the number of celebrated successes as a community, which indicates a moderate level of organisational capabilities in the neighbourhood (see also []). Participation was also evaluated positively, with relatively high scores for willingness to participate and high scores for personal involvement. Familiarity with the local initiative (Energy Team) is still low, which is understandable considering that they only recently started out.
The neighbourhood is characterised by a high education and income level, which is translated to high levels of knowledge, behavioural control, and personal involvement (which are correlated). People both have the motivation as well as the knowledge and means to get informed about and finally adopt renewable energy measures. The survey results show that many people have already done so as well. At the same time, people are also interested to act together. The foundations of collective action, trust in neighbours, and social networks are not only present, but respondents are also suggesting acting together. One of the respondents, for instance, proposes that: “not every household should figure everything out by themselves, but do that together in a smart way”.
Evaluation: The evaluation session provided insight into three main topics, which can be summarised as follows:
- Technologies: High values for attitude towards sustainable energy, knowledge of the energy system, and personal involvement with the topic of sustainability are all positive indications that people are willing to adopt low-carbon technologies. People think the climate is important and feel motivated to contribute to a more sustainable energy system. Many people (89%) have already taken measures (stage of change) as well, mostly solar photovoltaic panels and efficient glazing.
- Information: For a group of people, it is important that the plans are concrete and information is provided on potential measures. A group of people has a lack of knowledge on the topic and there is a risk of them dropping out of the further process.
- Participation: Levels of intended participation are lagging somewhat behind on attitudes, with a significant share (29%) not willing to participate, although the overall score is relatively high. Answers to open questions gave more insight into the motivations of people concerning the willingness to participate. Conditions for participating include a limited financial investment, a limited time commitment, and the possibility of joining collective initiatives. The group of people that were willing to participate consists of a significantly higher share of families with children than single-person households and a higher share of people living in Van Starkenborgh than in De Hunze. At the same time, this group is considerably restricted by available time, one of the largest challenges in this community. As one respondent described it: “there is too little time and effort to really put our shoulders to the wheel”. Additionally, lower-income groups are less willing to participate, and therefore form another group that requires specific attention in the participation process.
Linkage: Although the survey did not reveal detailed technology preferences, some boundary conditions could be deducted. This translation process is shown in Figure 6. Firstly, the results provide insight in how fitting individual and collective solutions could be. Based on the open answers, we have identified a careful interest in collective solutions, which can be a collective system such as a district heating network or the collective purchase of equipment. This is supported by a relatively high social cohesion, which would enable a collective approach. However, the organisational power in the neighbourhood seems to be rather low, and many people indicated that they have little time. Finding enough volunteers to carry out more intense community energy projects, for instance setting up a district heating network, may therefore be a challenge. At the same time, an individual solution would be supported by high personal involvement, knowledge, and behavioural control. Secondly, mapping the measures that have already been implemented can help to further identify logical follow-up steps. The variable ‘stages of change’ showed that many people have already taken renewable energy measures, such as solar panels or improved insulation. Few people have replaced their gas-fired boiler, while the well-insulated houses in the neighbourhood would be suitable for replacement by heat pumps. Therefore, it would be logical to primarily focus on heating technologies. Combinations with insulation, solar panels, and other measures are not excluded, but the selected technology options are highly simplified for the purpose of community consultation in this phase of the process. Hence, the focus of further investigating technical preferences will be on three heating alternatives: all-electric heat pumps, hybrid heat pumps, and district heating. Additionally, we found that, although income is high in this neighbourhood, a number of people want to participate under the condition that no large investments are needed and/or subsidies are provided. Affordability will therefore be one of the conditions.
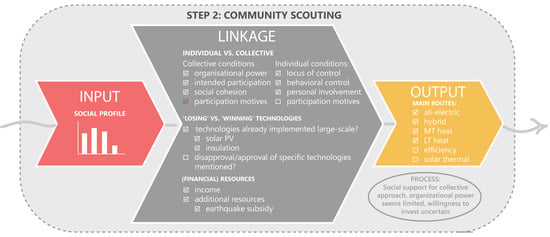
Figure 6.
Input–output diagram of process step 2, showing the translation of social data to technology choices (integration line).
3.2.3. Step 3: Scenario Development
Results: The ICQ yielded 53 respondents that completed at least the evaluation of the first technology. The remainder of the respondents was removed from the dataset. The sample consisted of more men (47.2%) than women (34.0%) (18.9% did not want to say or did not answer the question), whereas average age and education were comparable to the first survey. The age group of 20–40 years was underrepresented in the sample. Based on the results from the social fingerprint, we included three technological options in the ICQ: all-electric heat pump, hybrid heat pump, and district heating. The data were provided by the techno-economic model as described in Section 2.2.3. Each technology was first individually evaluated (see Figure 7, Figure 8 and Figure 9 ). For the all-electric heat pump, CO2 emission savings (the emission savings reported in the ICQ were based on the current electricity mix, and respondents were informed that the emissions would go further down in the future as a result of an increase in renewable production) and the possibility of cooling and energy savings were most often considered as advantages, whereas investment costs were perceived as the most negative aspect of the technology. Most aspects of the hybrid heat pump were scored positively with the fact that no low-temperature distribution system needs to be installed as the main advantage. Strong negatives did not occur for this technology (with only the outer unit and sound being scored negatively on average). The district heating system showed higher positive and negative scores, with the highest positive scores for the sustainable source (although many variations of a district heating network are possible, the variant presented in the ICQ used aqua thermal heat from the nearby canal), no switch to low-temperature heating and CO2-emission savings, and the highest negative scores for payback time, switching energy supplier, and construction nuisance of the network.
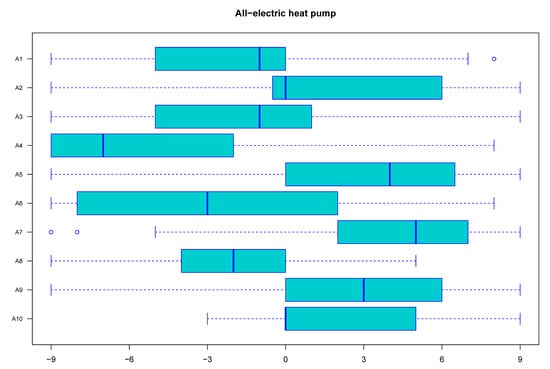
Figure 7.
Scores for the all-electric heat pump for each aspect of the technology, showing the median, 1st and 3rd quartiles, and 5th and 95th percentiles. A1 = outer unit, A2 = storage, A3 = low-temperature heating, A4 = investment costs, A5 = savings, A6 = payback time, A7 = CO2, A8 = noise, A9 = cooling, A10 = installation.
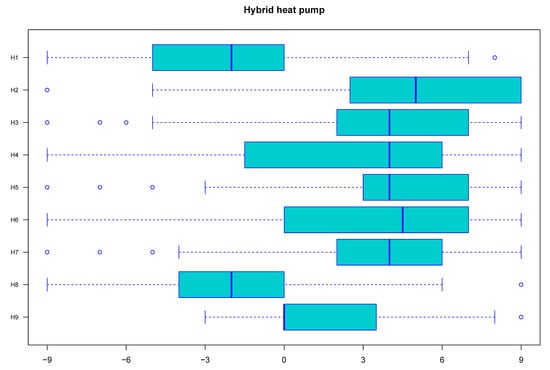
Figure 8.
Scores for the hybrid heat pump for each aspect of the technology, showing the median, 1st and 3rd quartiles, and 5th and 95th percentiles. H1 = outer unit, H2 = low-temperature heating, H3 = gas use, H4 = investment costs, H5 = savings, H6 = payback time, H7 = CO2, H8 = noise, H9 = installation.
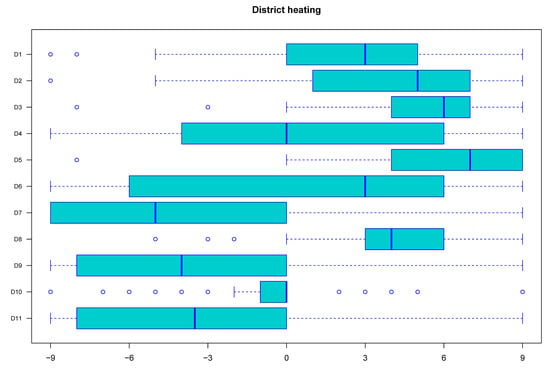
Figure 9.
Scores for district heating for each aspect of the technology, showing the median, 1st and 3rd quartiles, and 5th and 95th percentiles. D1 = home substation, D2 = low-temperature heating, D3 = source, D4 = connection costs, D5 = subsidies, D6 = tariff regulation, D7 = payback time, D8 = CO2, D9 = switching supplier, D10 = installation, D11 = construction network.
After scoring the technologies individually, respondents were asked to express a preference for either one of the technologies. Most people chose the hybrid heat pump (35.8%), and the least people chose the all-electric heat pump, although the average grade was similar to that of district heating after individually scoring the technologies (see Table 3). A significant share of the respondents (17.0%) did not have a preference. Various reasons for not having a preference were given, which can be divided in two main groups: a group that had a preference for another technology (hydrogen boiler, induction boiler, split airco, etc.) and a group that did not see any of those options working, where one respondent answered: “We would like to get rid of gas, so hybrid is not really a solution then. I think the cost of all-electric is just too high. We don’t have that much money. District heating leaves you with high monthly costs”. Financial motivations (investment costs, payback time, energy bill) were decisive motivations for most people, whereas non-financial motivations (CO2 emissions, use of natural gas, noise pollution) played a decisive role for respondents that preferred an all-electric heat pump or district heating. When asking which motivations were most important in expressing a preference, the most mentioned motivations were investment costs, payback time, use of natural gas, CO2 emissions, and adjustment to low-temperature heating.

Table 3.
Overall evaluation of ICQ per technology.
Concerning unacceptable options, most objections were against district heating. The main motivations are the energy bill, investment costs, and construction nuisance. For all-electric, this concerns investment costs, and for hybrid heat pumps the use of natural gas. However, the majority did not indicate any of the technologies to be unacceptable.
Evaluation: The evaluation session provided insight into three main topics, which can be summarised as follows:
- Technologies: The district heating option shows the most dividedness in preference among respondents. There are strong positives and strong negatives and both proponents and opponents to the technology. In a discussion, more insight into the motivations, and to what extent hurdles can be removed, can be created. Also noteworthy is the fact that the all-electric heat pump is the least favourite alternative, while at the same time this is the proposed solution in the municipal policy.
- Information: The presented information played a key role in identifying technology preferences. At the end of the ICQ, some questions were included to evaluate the information. All variables were presented on a 7-point scale, with 1 point representing the most negative and 7 representing the most positive score. The results showed above average scores for all variables (see Table 4). The amount of information was sufficient for making a decision, the clarity of the information was considered sufficient, the information was not entirely novel for the majority of the respondents, and the information was also considered complete.
 Table 4. Evaluation of information in the ICQ.
 - Participation: More men than women tended to take part in the technical survey. A point of attention is to sufficiently attract and involve women in the decision-making process. Another point of attention is the group of respondents that could not express a preference as none of the alternatives were considered feasible or desirable. Attention should be paid to how to involve this group and select measures and meet the conditions under which they can participate. The same applies to the younger age group (20–40 years), which is underrepresented in the sample.
Linkage: There was no clear reason to eliminate any option from the process, so all three options were further discussed in dialogue. Respondents indicated a need for more information on solar PV and insulation. The selected scenarios should therefore include the option for combining the technologies with solar PV and insulation. Since the most important motivations have a financial nature, the discussion should focus on the financial aspects when comparing the technology options (see Figure 10).
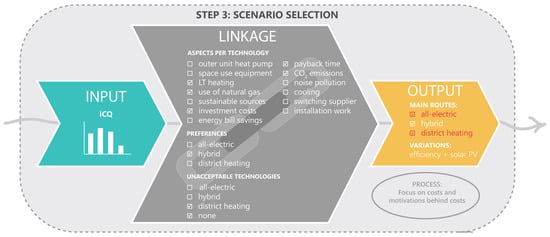
Figure 10.
Input–output diagram of process step 3, showing the translation of social data to technology choices (integration line).
3.2.4. Step 4: Dialogue
Results: The results of the ICQ showed that respondents were most sensitive to financial motivations. Therefore, the first workshop started with a more in-depth presentation of costs of the three technology alternatives (all-electric heat pump, hybrid heat pump, and district heating), using graphs and data produced by the techno-economic model (see Section 2.2.3). Specific attention was paid to the effects of energy price levels and the uncertainties and trends in price development. Previous analyses with the model demonstrated the effects of large variations in energy prices (see []). Variations in different housing types were also shown, as well as the cost structure of the three technologies, whether or not they were combined with insulation (energy label C to label B) and solar PV (12 panels). The presented graphs are shown in Appendix C.
Based on the outcomes of the ICQ, 5 themes were defined for further discussion: (1) controversy around district heating, (2) all-electric being the least chosen alternative, (3) the use of natural gas, (4) motives for not having a preference, and (5) perceived financial feasibility. These themes were discussed in the workshop by means of a group discussion with 30 participants, that also participated in the preceding questionnaires. The group discussion was introduced as an open discussion with the aim of collecting thoughts and viewpoints on the different technologies rather than already making decisions. Table 5 summarizes the points addressed during the group discussion. Some themes were introduced with an online (Mentimeter) questionnaire, to obtain a more quantitative overview of the participants’ viewpoints.

Table 5.
Summary of identified motivations and viewpoints mentioned during the group discussion.
The aim of this meeting was not to reach consensus yet, but to identify the main thoughts. This brings a variety of thoughts and viewpoints to light. Different, and sometimes incompatible, motivations will always be a result of such a discussion, and no consensus can be reached on that level. At the same time, the discussion explored whether opportunities were created to reach a consensus, and whether people may shift preference from one technology option to another when main hurdles could be addressed. For all-electric heat pumps, the interest among the vast majority shifts when the main hurdle, upfront investment costs, could be addressed by lowering the amount with subsidies, as shown in Figure 11. For district heating, some of the hurdles are much harder to address and to close the gap between motives, such as people wanting control versus people that want to be unburdened from implementing individual solutions. The attitude was also more divided among the participants, with a slight majority of the participants being predominantly negative towards district heating, as can be seen in Figure 12.

Figure 11.
Voting behaviour on the investment costs of the all-electric heat pump. For the second question, participants could indicate which investment they considered acceptable, which resulted in numbers between 2000 and 18,000 euros, with most participants indicating 5000 euros.
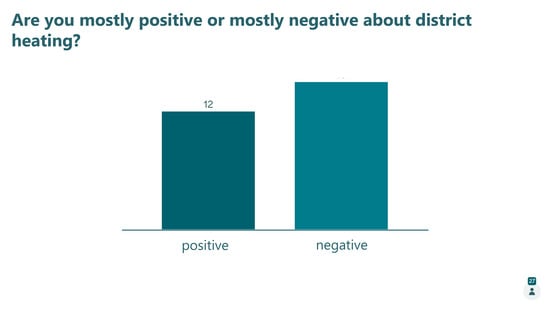
Figure 12.
Voting behaviour on attitude towards the district heating system.
The evaluation with participants showed that most participants thought the workshop was informative and interesting, though some found it confusing or not tangible enough. The participants supported the findings of the evening at least partly (20/20) and did not change their technology preference compared to the ICQ (16/19). None of the respondents had faith in a solution that everyone could agree to (see Figure 13).
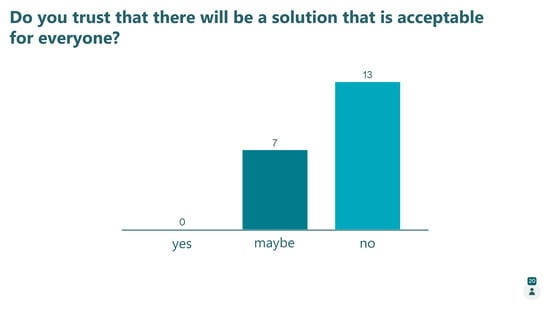
Figure 13.
Voting behaviour on reaching consensus.
Evaluation: The evaluation session provided insight into three main topics, which can be summarised as follows:
- Technologies: Considering the level of controversy around the district heating network, and limited possibilities to address hurdles, it would take significant effort to reach a group consensus. The attitudes towards the solution were divided, and many different viewpoints and concerns were mentioned that cannot easily be united. In addition, few people were confident that there will be a solution that everyone agrees to, indicating low trust in a collective solution. Therefore, to take the process forward, a logical focus would be on the remaining two alternatives: all-electric and hybrid heat pumps. These are both individual solutions that do not exclude one another. Several motivations, including the one that people desire individual advice, point in the direction of an individual solution.
- Information: Even though people were most sensitive to financial arguments, choices seemed in fact less rational and other motivations play a decisive role. The provided information did not always prove to be leading in the formation of an opinion, and other aspects that make one form an opinion were rather decisive. For instance, one of the participants mentioned that they were negative towards the district heating option because around them people that were connected to a district heating system were paying a lot, whereas in the presentation district heating had the lowest costs in 2025 out of all scenarios. The formation of educated opinions is clearly more complex and information provision alone is not sufficient. However, some of these perceptions can be influenced by providing further information and discussion. This underlines the importance of providing transparent, trustworthy information and to reflect upon the information. In addition, uncertainty about energy price development, availability of technologies, and laws and regulations make the decision-making process at this moment especially complicated. This particularly applies to district heating. Lastly, the group discussion also revealed the need for individual advice, showing that participants would like specific advice for their individual home. Although we presented data, on installation costs for instance, specifically for different types of houses, it is not an actual offer and the need for tailor-made information requires attention in the decision-making process.
- Participation: Whereas the discussion mainly brought individual views and boundary conditions to light, we observed that participation, in which the ownership shifts from the individual to the group, was not effectively taking place in this phase yet. It can be concluded that an open discussion and collection of different viewpoints is a relevant step in the process, and that the next step should focus on activation of participation. It is valuable, if not essential, to collect different views before decisions are being made to prevent the emergence of resistance. This can only take place in an open atmosphere, where participants feel free to express their views, even if they do not agree with one another, without the immediate pressure of decision-making. When people feel heard and understand each other’s motives, opposing views can be minimised [].
Linkage: Based on the provided argumentation, an individual (heat pump) solution seems to have the most potential, whereas consensus on a collective (district heating) system would be rather difficult. Apart from argumentation and suggestions for a collective solution, we also checked to what extent hurdles could be removed, which was challenging for district heating, whereas some financial hurdles related to heat pumps could potentially be lowered (see also Figure 14). Since there were no indications for a need to further refine the scenarios, we conclude that the next step should focus on how to move forward rather than providing even more information.
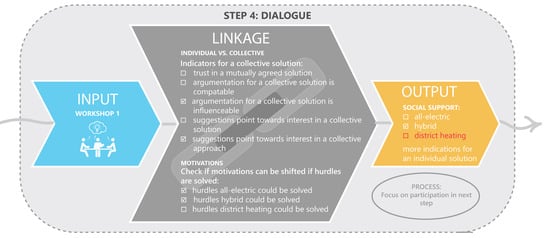
Figure 14.
Input–output diagram of process step 4, showing the translation of social data to technology choices (integration line).
3.2.5. Step 5: Decision-Making
Results: The aim of the second workshop was to make more concrete steps towards a solution. Based on the outcome of the first workshop, the individual path, focused on all-electric heat pumps and hybrid heat pumps, was further explored. The workshop had 18 participants. Most of the participants participated in the first workshop, but the workshop also attracted some new faces. Participants were split into three groups that each discussed three themes: getting clarity on costs, individual house advice, and potential for collective action. The themes were chosen based on the suggestions of participants after the first workshop. Each theme was discussed by three questions: (1) What is needed? (2) How to organise it? (3) Who should do it? The workshop had a brainstorming nature, where as many ideas as possible were collected. The ideas were all written down on a poster, after which the participants scored the ideas by coloured stickers, so that insights were gained in which ideas were supported by the group the most. The results of the discussion are summarised in Table 6.

Table 6.
Summary of results of workshop 2, centred around three themes.
Evaluation: The evaluation session provided insight into three main topics, which can be summarised as follows:
- Technologies: Although decision-making was the aim of this last process step, no further technology choices have been made. One of the participants indicated the atmosphere well by saying: “The questions suggest you’re already going to do it. I’m far from being there yet”. After step 4 (workshop 1), a decision was made between a collective or an individual solution. Participants also indicated that they needed more specific information to make final choices. Therefore, the focus was on identifying further information needs and action by the community.
- Information: Not all participants had participated in the ICQ and/or first workshop. The difference between the two groups was noticeable: participants who did not participate in previous steps mentioned information needs that were previously addressed, such as payback times, investment costs, and energy cost savings of energy technologies. Participants who had received information earlier were better able to define follow-up steps by refining the need for information and tailoring that information to what is needed for the implementation of the technologies rather than to the decision-making process of whether to take measures or not. This underlines the need to provide information on aspects of technologies that are most important to participants and repeat key information throughout the different process steps.
- Participation: The participants did not form a broad representation of the neighbourhood, as was also noticed by some of the participants. Young people (under 40) were mostly missing in the participant group, as well as women. Also noticeable from the conversations was that many people were already active in this topic, as participants frequently referred to previous experiences, including reaching out to installation companies, consultants, or the municipality to gain information or technology offers. Hence, although initially a broad and representative group was reached and involved in the first survey, a quite specific group was left at the end of the process. It can be concluded that more specific action is required to involve all social groups. This could also be a follow-up step. Participants suggested, for instance, that they could use ambassadors to involve more neighbours in the project.
- Concerning the willingness of participants to be involved in the future process, participants were cautious, but mostly willing to contribute. Some participants found it difficult to commit to further engagement as they felt that more clarity on the political framework, specifically the availability of natural gas after 2030 and the capacity of the electricity grid, was needed, a barrier also identified in []. The community is rich in social capital, with many highly educated experts, e.g., in the field of technology. Some conditions for active involvement as mentioned by the participants were that their contribution should take little time, should be concrete, and that the political and regulatory boundary conditions should be sufficiently clear.
Linkage: The workshop revealed some specific aspects of the houses that are relevant in relation to the proposed technologies (see Figure 15). There are, for instance, many houses with flat roofs in the neighbourhood, where there may be (too) little space for a heat pump, according to participants. Part of the houses is equipped with warm air heating for heat distribution, which does not involve radiators. Those residents ran into issues implementing the low-temperature heating required for heat pumps because this is no standard system. This information could help refine the scenarios for this specific neighbourhood, allowing further customisation. This discussion also pointed out that participants wanted insight into electricity grid capacity and the need and potential for storage, an aspect that we paid limited attention to in the information provision, and which appeared to be a relevant KPI.
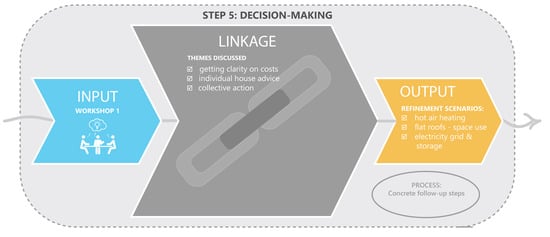
Figure 15.
Input–output diagram of process step 5, showing the translation of social data to technology choices (integration line).
3.3. Process Evaluation
The first experiences with the application of the process design on a real case revealed some additional links and interactions between the various tools. The second workshop, for instance, gave a lot of insight on stakeholders as well. The overall process was also more iterative than originally drawn. Most importantly, the outputs of each step were more directly linked to one another than through the technical line alone, also providing procedural input for the next step. The last step had less of a decision-making character and was more related to determining follow-up actions. Creating a ‘roadmap’ would be a better definition. The case study also gave insights into the stakeholders that could be involved in future steps and which elements were more important than others. Less important, for instance, was a model run after each step, while the model had the largest use in the preparation for step 3 (ICQ) and step 4 (workshop 1). With these insights, a more detailed process diagram could be drawn, as shown in Figure 16.
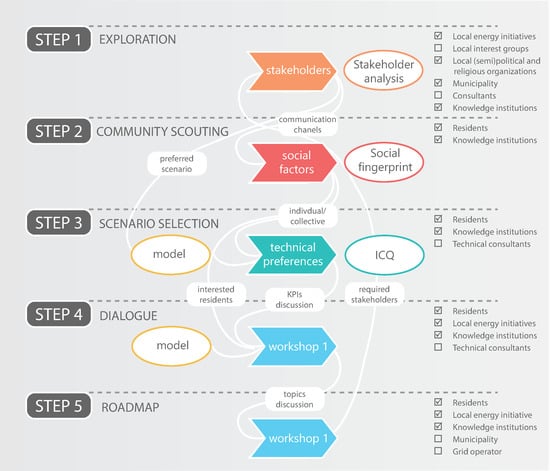
Figure 16.
Process diagram showing the interactions between elements and associated (potential) stakeholders.
4. Conclusions and Policy Recommendations
This paper has introduced a participatory, socio-technical approach to decision-making in the context of neighbourhood-scale heat planning. The main principle was to design a process, consisting of different complementary steps, that connects social data gained through multiple participation methods with techno-economic modelling. Both the social process and the techno-economic modelling are interlinked and provide feedback to one another, thereby forming an integrated planning instrument. Further criteria to such an approach were set based on existing literature, focused on some of the issues of participatory decision-making, including energy education, complexity of information, representativeness of stakeholders, and group interactions.
The case study in which the method was tested successfully demonstrated that joint application of different tools enables many viewpoints, motivations, and conditions to be made explicit and translated to technology preferences. A combination of tools has proven to be relevant since the decision-making is evolving rather implicitly, and the different steps of the process involving the use of specific tools are needed to deliver the required robustness for decision-making. Utilizing only one tool does not deliver the required robustness for decision-making and both qualitative and quantitative methods are necessary to both provide detailed insight into motivations and representativeness of the findings that are needed to support any form of decision-making.
In line with Mccoy, who said that “common ground should not be confused with absolute consensus” [], we found that reaching a consensus may not be the primary goal of such a process. Nevertheless, the creation of common starting points based on which the community members can take further action, individually or collectively, is a fruitful and realistic outcome. This outcome is supported by other studies, e.g., the authors of [], who found that preferences varied widely and instead of one ‘acceptable’ option, a range of preferences could be derived. In this case, there were more indications that an individual solution (all-electric heat pump or hybrid heat pump) was preferred, whereas the support for a collective solution (district heating) was ambiguous.
The data provided by the techno-economic model played a crucial role in the process. Presentation and discussion of techno-economic information was needed to bring participants to a shared level of knowledge, enabling them to engage in meaningful conversation. Facilitating an open discussion based on transparent, accessible expert knowledge, where everyone could feel free to share their point of view, helped create mutual understanding and avoid conflict. Even in case of an individual path, the techno-economic data provided during the process (ICQ, workshops) are essential to bring participants to an equal level of knowledge and provide a starting point for obtaining further information by themselves. The process of group participation, and in particular creating ownership, could in the following processes be further strengthened by the tone or emphasis set by the discussion leader focused on collectiveness, for instance by emphasizing the neighbourhood as an actor, or by having people respond to one another.
A challenge of involving citizens in heat planning is that the group decision-making process is intertwined with the personal decision-making process. While it is important to fully involve citizens from the beginning and not when all the decisions are made [], it is challenging for them to think at an abstract level while many things are still uncertain. In decision-making related to policy and planning, the policy options are sketched in big lines and information about them is rather general. Although we presented data for specific housing types and adjusted the scenarios to the technology preferences expressed earlier, the need for tailored information remained. Providing information at this level of detail is not desirable nor feasible in the energy planning phase. As Callahan [] indicates, people tend to be motivated from a personal rather than a public perspective. In the case study, this was reflected by the fact that people expressed their need for individual home advice. At the same time, this brings important boundary conditions and preferences to light.
To assist in the planning process, the policy context and aim of the process cannot be stressed enough, both to point participants toward the common goals but also because participants indicated repeatedly that they need clarity on the governmental policy and legislation to be able to make decisions. The opinions participants express will be framed by the brief that people are given, as also shown by Thomas et al. [].
Our method contributes to increasing effectiveness, by critically looking at weaknesses in approaches and aiming at effectively delivering the input needed for decision-making, not least by directly linking the social process with techno-economic development. Conclusions have also become more traceable and transparent, based on measured data and a combination of qualitative and quantitative methods, compared to the ad hoc individual conversations (e.g., kitchen table conversations) or one-directional communication (e.g., information meetings) often applied by practitioners. The method of social fingerprinting in particular provides a rational way of capturing social dynamics that are necessary to create effective processes. In the Dutch practice of heat planning, which is also evaluated nationally, municipalities struggle with time-consuming customisation due to heterogeneity in end-users and buildings, while maintaining sufficient progress in the process [,]. Many different methods have been experimented with, also within one project, without their effectiveness being tested. Participation will always be time-consuming, but there is potential to increase time effectiveness by applying (variations to) the tools proposed in this paper and adequately linking social data to technology choices.
Based on the first experiences with the new method, the following recommendations can be given to further develop the method in practice:
- Increasing participation: In our case study, we identified certain social groups that tend to be underrepresented in the participation process. Hence, it remains an issue to reach majority of people. In the social profile, we saw an underrepresentation of lower educated residents. In the ICQ, we saw an underrepresentation of women and young people, and in the workshops the younger age groups were merely missing. A recommendation for application in practice is to not only identify groups who miss out, but also perform interventions in specific social networks to increase the participation grade. Examples of the challenges and opportunities of specific groups can be found in [].
- Multiple stakeholders: The focus of the case study has been on residents, although a broader network of stakeholders was included in the form of a stakeholder analysis. Depending on the specific context of a project, the process could also involve more stakeholders, such as municipalities, grid operators, advisory bodies, etc. Including multiple stakeholders may ease the path towards anchoring participatory decision-making in policy-making and implementation [].
- Considering the customer journey: Although the focus is and should be on collective decision-making in relation to planning, the individual decision-making process, often indicated as the ‘customer journey’, could be more incorporated in the planning process. One example would be to include a more thorough analysis and calculation of specific houses in a parallel process, which could also be discussion content for an additional workshop.
- Expand the financial aspect: Financial motivations appeared to be the most important motivations for majority of the participants in the case study. This is in line with more general findings, where specifically return on investment appears to be one of the most influential factors for participation in community energy projects []. Therefore, it is recommended that more attention is paid to financing options, such as green loans and building-related finance (in building-related finance, the loan is not linked to the owner of the house, but to the house itself; in case of moving, the loan is transferred to the next owner) that could both take away the hurdle of upfront investment costs that need to be paid back and meet the need for carefree solutions. Additional KPIs such as home value increase may be considered in this context as well to fully inform end-users of financial benefits of renewable investments.
- Gaining experience in different contexts: One limitation of the study is that this is a single case study, which was also a positive and quite homogeneous neighbourhood with mainly highly educated owner-occupiers. The experiment should be repeated in other contexts to identify and solve potential issues, for instance involving a representative group through all the steps of the process.
Author Contributions
Conceptualization, K.B. and A.F.; Methodology, K.B.; Formal analysis, K.B.; Writing—original draft, K.B.; Writing—review & editing, C.J.W., C.T. and A.F.; Visualization, K.B.; Supervision, C.J.W., C.T. and A.F. All authors have read and agreed to the published version of the manuscript.
Funding
This research received no external funding.
Institutional Review Board Statement
The study was conducted according to the guidelines of the Declaration of Helsinki. With regard to the Institutional Review Board Statement, the study was conducted according to the ethical guidelines of Hanze University of Applied Sciences.
Informed Consent Statement
Informed consent was obtained from all subjects involved in the study.
Data Availability Statement
The data presented in this study are available on request from the corresponding author. The data are not publicly available due to privacy restrictions.
Conflicts of Interest
The authors declare no conflict of interest.
Appendix A. ICQ Measures

Table A1.
Information on various technology aspects included in the ICQ (summary). The highlighted rows indicate the three technologies included in the ICQ as discussed in Section 3.2.3.
Table A1.
Information on various technology aspects included in the ICQ (summary). The highlighted rows indicate the three technologies included in the ICQ as discussed in Section 3.2.3.
| All-Electric Heat Pump | |
| An outdoor unit is placed on your facade or plot. | A1 |
| A storage vessel is placed where your central heating boiler is located now. | A2 |
| To make your home suitable for an all-electric heat pump, low-temperature radiators or underfloor heating will be installed. | A3 |
| The investment for an all-electric heat pump is around 14,000 euros, including installation, low-temperature system, and subsidy (total). | A4 |
| Installing a heat pump leads to lower energy bills, on average you can save 75 euros per month for a similar home to yours (price level May 2022). | A5 |
| You can recoup the average price of a heat pump in about 15 years. This is roughly equal to the heat pump’s lifespan of 15 years. | A6 |
| An all-electric heat pump emits about 40% less CO2 than the central heating boiler. | A7 |
| Outside the house, the heat pump produces a soft humming noise of about 40 dB. This sounds as loud as a library, a quiet living room, or classroom. | A8 |
| With a heat pump combined with underfloor heating, you can also cool your home to a limited extent in summer (the room takes a long(er) time to cool down and the temperature is not as low as with a standard air conditioner). | A9 |
| Heat pump installation takes about two days, with most people experiencing little inconvenience. | A10 |
| Hybrid heat pump | |
| An outdoor unit is installed on your facade or plot. | H1 |
| With a hybrid heat pump, there is no need for low-temperature heating because the boiler can provide high-temperature heat when needed. You can keep your current radiators. | H2 |
| With a hybrid heat pump, your gas consumption goes down by about 50%. So, you still use gas, but (much) less. | H3 |
| The investment for a hybrid heat pump is around 5000 euros, including installation and subsidy (total). | H4 |
| Installing a heat pump leads to lower energy bills, on average you can save 45 euros per month (price level May 2022). | H5 |
| You can recoup the average price of a heat pump in about 10 years. This is less than the heat pump’s lifespan of 15 years. For the remaining period, your investment will make money. | H6 |
| With a hybrid heat pump, around 20% less CO2 is emitted. | H7 |
| Outside the house, the heat pump produces a soft humming noise of 40 dB. This sounds as loud as a library, a quiet living room, or classroom. | H8 |
| The installation takes about two days; most people experience little inconvenience. | H9 |
| District heating | |
| A home substation is installed in your meter box. You no longer have a boiler. | D1 |
| In case of a heat network, there is no need for low-temperature heating with suitable radiators or underfloor heating. You can keep your current radiators. | D2 |
| A heat network can make use of a local sustainable heat source, such as heat from the Van Starkenborgh canal. | D3 |
| In case of a heat network, you pay a one-off connection fee. This is often around 2000–4000 euros. | D4 |
| Sometimes subsidies are available for this connection contribution. Then there are no costs for you to connect to the heat network. | D5 |
| The maximum tariffs for heat are regulated by law so there is control over the maximum price and the tariffs are transparent. The energy bill remains more or less the same under this legislation and is expected to remain stable in the future. | D6 |
| The one-off connection fee of a heat network is not or only very partially recovered through savings on energy bills. | D7 |
| Depending on the source, a heat network emits about 30% less CO2 than a central heating boiler. This percentage is based on heat from the van Starkenborgh canal. | D8 |
| You purchase heat from a local heat supplier. As a result, you cannot simply switch energy suppliers for your heat. For electricity, however, this is still possible. | D9 |
| Installation at home takes three days; most people experience little inconvenience. | D10 |
| To construct the network, the street has to be opened up. This temporarily restricts access to the street and the house. This may take several months. Sometimes (part of) the front garden also has to be broken up. | D11 |
Appendix B. Results of Survey on Social Factors

Table A2.
Survey results of sociodemographic variables, compared to statistical data on national and neighbourhood scales.
Table A2.
Survey results of sociodemographic variables, compared to statistical data on national and neighbourhood scales.
| Factor | Explanation | National Average | Neighbourhood Average | Survey Data De Hunze/Van Starkenborgh |
|---|---|---|---|---|
| Age | Mean (continuous scale)/standard deviation | 42.2 [] | 53.88/13.92 | |
| Gender | %female | 50.3 [] | 46.0 | |
| Income | %above average/median (3 categories) | 16.5 [] 1 | 55.3/3.00 | |
| Education | %higher education/median (5 categories) | 32.9 [] | 52.8/58.0% | 72.2/5.00 |
| Daily activities | %paid job | 56.6 [] 2 | 50.3 | |
| %retired | 17.6 [] | 24.5 | ||
| %entrepreneurs | 11.8 [] 3 | 11.0/19.0% | 9.2 | |
| Homeownership | %owner-occupied | 57.0 [] | 96.0/98.0% | 98.0 |
| Ethnic background | %Dutch | 75.8 [] | 85.1%/83.8% | 95.4 |
| Household composition | %hh_1p | 21.6% | 14.0% | |
| %hh_zk | 36.6% | 50.2% | ||
| %hh_mk | 41.1% | 35.8% |
1 Category 30,000–40,000 EUR is considered as ‘around average’, above 40,000 EUR as ‘above average’, and below 30,000 EUR as ‘below average’. 2 Employees as share of the total population aged 15–75 years (working and non-working). 3 Entrepreneurs as share of the total population aged 15–75 years (working and non-working).

Table A3.
Survey results of social factors.
Table A3.
Survey results of social factors.
| Key Concept | Item (n = 129) | Survey Data De Hunze/Van Starkenborgh | Scale | |
|---|---|---|---|---|
| Individual | Environmental concern 1 | Mean/SD | 4.51/0.82 | 5-point Likert |
| Environmental concern 2 | Mean/SD | 4.58/0.87 | 5-point Likert | |
| Environmental concern total | Mean/SD | 4.54/0.78 | 5-point Likert | |
| Environmental knowledge 1 | Mean/SD | 4.58/1.89 | - | |
| Environmental knowledge 2 | Mean/SD | 16.03/12.07 | - | |
| Environmental knowledge 3 | Mean/SD | 3.59/0.85 | 5-point Likert | |
| Subjective norm | Mean/SD | 2.41/0.71 | 5-point Likert | |
| Locus of control | Mean/SD | 3.67/0.95 | 5-point Likert | |
| Perceived behavioural control | Mean/SD | 3.68/0.82 | 5-point Likert | |
| Responsibility—energy companies | Mean/SD | 3.58/1.15 | 5-point Likert | |
| Responsibility—local institutions | Mean/SD | 3.26/1.18 | 5-point Likert | |
| Responsibility—community | Mean/SD | 3.62/1.06 | 5-point Likert | |
| Responsibility—own responsibility | Mean/SD | 4.12/0.97 | 5-point Likert | |
| Responsibility—national government | Mean/SD | 4.33/0.90 | 5-point Likert | |
| Responsibility—provincial government | Mean/SD | 4.16/0.94 | 5-point Likert | |
| Responsibility—municipal government | Mean/SD | 4.30/0.85 | 5-point Likert | |
| Stages of change | Mode | 4 (88.6%) | - | |
| Community | Neighbourhood attachment 1 | Mean/SD | 17.52/10.74 | |
| Neighbourhood attachment 2 | Mode | 5 | 5-point Likert | |
| Reciprocated exchange | Mean/SD | 2.83/0.78 | 5-point Likert | |
| Social network | Mode | 6 | 6 categories | |
| Mutual trust | %yes | 78.5 | 2 categories | |
| Memberships in associations | %member | 22.9 | 2 categories | |
| Socio-historic | Institutional trust | %yes | 60.0 | 2 categories |
| Successful activities | %yes | 58.7 | 2 categories | |
| Previous problems | %yes | 78.2 | - | |
| Participation | Familiarity with the project | Mode | 1 | 4 categories |
| Willingness to participate | Mode | 1 | 3 categories | |
| Personal involvement | Mean/SD | 3.68/0.82 | 5-point Likert |
Appendix C. Techno-Economic Data Discussed in Workshop 1
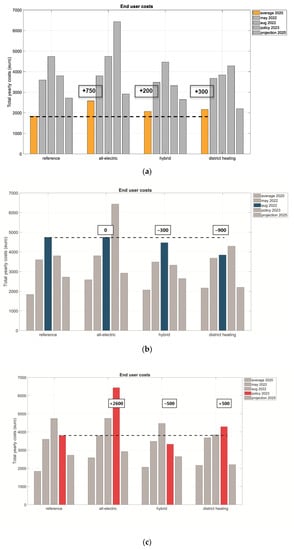
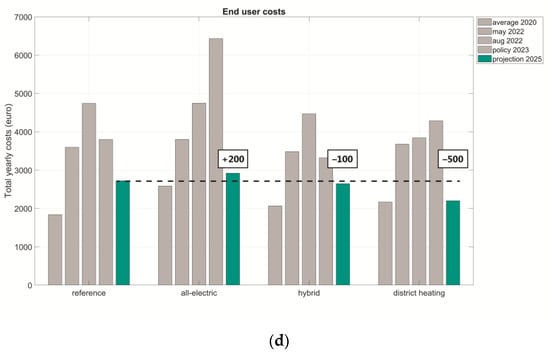
Figure A1.
Total yearly costs of technology options at different price levels: (a) average prices in 2020, (b) prices in august 2022, (c) proposed policy scenario with a ceiling at 2400 kWh electricity and 1200 m3 gas, and (d) price projection for 2025 based on [].
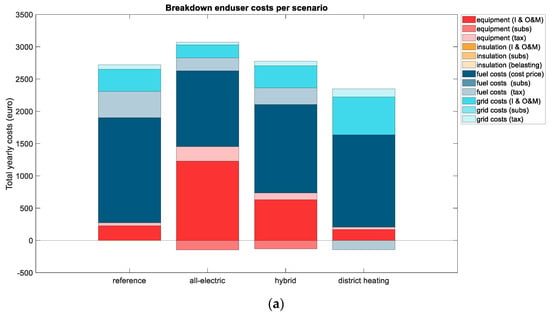
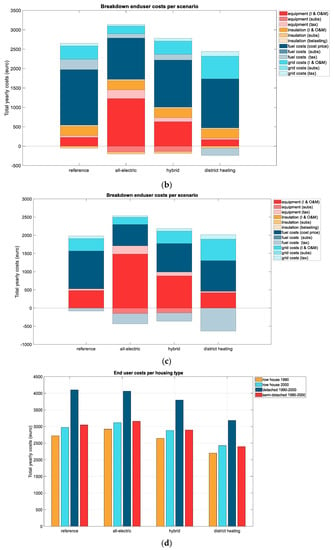
Figure A2.
Total yearly costs, broken down in cost components: (a) scenario with boiler replacement, (b) scenario with boiler replacement and insulation, (c) boiler replacement with solar PV, and (d) costs for four different housing types.
References
- Pereverza, K.; Pasichnyi, O.; Kordas, O. Modular participatory backcasting: A unifying framework for strategic planning in the heating sector. Energy Policy 2019, 124, 123–134. [Google Scholar] [CrossRef]
- McGookin, C.; Ó Gallachóir, B.; Byrne, E. Participatory methods in energy system modelling and planning—A review. Renew. Sustain. Energy Rev. 2021, 151, 111504. [Google Scholar] [CrossRef]
- Corsini, F.; Certomà, C.; Dyer, M.; Frey, M. Participatory energy: Research, imaginaries and practices on people’ contribute to energy systems in the smart city. Technol. Forecast. Soc. Change 2019, 142, 322–332. [Google Scholar] [CrossRef]
- Huttunen, S.; Ojanen, M.; Ott, A.; Saarikoski, H. What about citizens? A literature review of citizen engagement in sustainability transitions research. Energy Res. Soc. Sci. 2022, 91, 102714. [Google Scholar] [CrossRef]
- Bouw, K.; Noorman, K.J.; Wiekens, C.J.; Faaij, A. Local energy planning in the built environment: An analysis of model characteristics. Renew. Sustain. Energy Rev. 2021, 144, 111030. [Google Scholar] [CrossRef]
- Stober, D.; Suškevičs, M.; Eiter, S.; Müller, S.; Martinát, S.; Buchecker, M. What is the quality of participatory renewable energy planning in Europe? A comparative analysis of innovative practices in 25 projects. Energy Res. Soc. Sci. 2021, 71, 101804. [Google Scholar] [CrossRef]
- Lennon, B.; Dunphy, N.P.; Sanvicente, E. Community acceptability and the energy transition: A citizens’ perspective. Energy. Sustain. Soc. 2019, 9, 35. [Google Scholar] [CrossRef]
- Owens, S.; Driffill, L. How to change attitudes and behaviours in the context of energy. Energy Policy 2008, 36, 4412–4418. [Google Scholar] [CrossRef]
- Cajot, S.; Peter, M.; Bahu, J.M.; Koch, A.; Maréchal, F. Energy planning in the urban context: Challenges and perspectives. Energy Procedia 2015, 78, 3366–3371. [Google Scholar] [CrossRef]
- Cuppen, E. Diversity and constructive conflict in stakeholder dialogue: Considerations for design and methods. Policy Sci. 2012, 45, 23–46. [Google Scholar] [CrossRef]
- Urrutia-Azcona, K.; Tatar, M.; Molina-Costa, P.; Flores-Abascal, I. Cities4ZERO: Overcoming carbon lock-in in municipalities through smart urban transformation processes. Sustainability 2020, 12, 3590. [Google Scholar] [CrossRef]
- Smart Energy Cities Smart Energy Cities. Available online: https://www.smartenergycities.nl/ (accessed on 20 October 2022).
- Heaslip, E.; Fahy, F. Developing transdisciplinary approaches to community energy transitions: An island case study. Energy Res. Soc. Sci. 2018, 45, 153–163. [Google Scholar] [CrossRef]
- Bouw, K.; Tigchelaar, C.; Faaij, A. A new approach for modelling techno-economic performance of integrated energy systems on district scale for informed decision-making in a multi-stakeholder context. Renew. Sustain. Energy Transit. 2023, 3, 100045. [Google Scholar] [CrossRef]
- Bouw, K.; Wiekens, C.; Elbert, S.; Faaij, A. How to plan for success? An exploration of social context factors in neighbourhood energy planning. Energy Res. Soc. Sci. 2022, 92, 102761. [Google Scholar] [CrossRef]
- Callahan, K. Citizen participation: Models and methods. Int. J. Public Adm. 2007, 30, 1179–1196. [Google Scholar] [CrossRef]
- Mouter, N.; Shortall, R.M.; Spruit, S.L.; Itten, A.V. Including young people, cutting time and producing useful outcomes: Participatory value evaluation as a new practice of public participation in the Dutch energy transition. Energy Res. Soc. Sci. 2021, 75, 101965. [Google Scholar] [CrossRef]
- McCoy, M.L.; Scully, P.L. Deliberative Dialogue to Expand Civic Engagement: What Kind of Talk Does Democracy Need? Natl. Civ. Rev. 2002, 91, 117–135. [Google Scholar] [CrossRef]
- Fraune, C. Gender matters: Women, renewable energy, and citizen participation in Germany. Energy Res. Soc. Sci. 2015, 7, 55–65. [Google Scholar] [CrossRef]
- Kordas, M.S. Whose Vision, Whose Places, Whose Future?: Charrettes in the Scottish Planning System. Ph.D. Thesis, University of Glasgow, Glasgow, Scotland, 2020. [Google Scholar]
- Kowalski, K.; Stagl, S.; Madlener, R.; Omann, I. Sustainable energy futures: Methodological challenges in combining scenarios and participatory multi-criteria analysis. Eur. J. Oper. Res. 2009, 197, 1063–1074. [Google Scholar] [CrossRef]
- Polatidis, H.; Haralambopoulos, D.A. Local renewable energy planning: A participatory multi-criteria approach. Energy Sources 2004, 26, 1253–1264. [Google Scholar] [CrossRef]
- Kalkbrenner, B.J.; Roosen, J. Citizens’ willingness to participate in local renewable energy projects: The role of community and trust in Germany. Energy Res. Soc. Sci. 2016, 13, 60–70. [Google Scholar] [CrossRef]
- Yildiz, Ö.; Rommel, J.; Debor, S.; Holstenkamp, L.; Mey, F.; Müller, J.R.; Radtke, J.; Rognli, J. Renewable energy cooperatives as gatekeepers or facilitators? Recent developments in Germany and a multidisciplinary research agenda. Energy Res. Soc. Sci. 2015, 6, 59–73. [Google Scholar] [CrossRef]
- Dóci, G.; Vasileiadou, E. “Let’s do it ourselves” Individual motivations for investing in renewables at community level. Renew. Sustain. Energy Rev. 2015, 49, 41–50. [Google Scholar] [CrossRef]
- Koirala, B.P.; Araghi, Y.; Kroesen, M.; Ghorbani, A.; Hakvoort, R.A.; Herder, P.M. Trust, awareness, and independence: Insights from a socio-psychological factor analysis of citizen knowledge and participation in community energy systems. Energy Res. Soc. Sci. 2018, 38, 33–40. [Google Scholar] [CrossRef]
- Bauwens, T.; Gotchev, B.; Holstenkamp, L. What drives the development of community energy in Europe? The case of wind power cooperatives. Energy Res. Soc. Sci. 2016, 13, 136–147. [Google Scholar] [CrossRef]
- Harwood, R.; Scully, P.; Dennis, K. Will Any Kind of Talk Do? Moving from Personal Concerns to Public Life; Kettering Foundation and The Harwood Group: Dayton, OH, USA, 1996. [Google Scholar]
- Komendantova, N.; Ekenberg, L.; Marashdeh, L.; Al Salaymeh, A.; Danielson, M.; Linnerooth-Bayer, J. Are energy security concerns dominating environmental concerns? Evidence from stakeholder participation processes on energy transition in Jordan. Climate 2018, 6, 88. [Google Scholar] [CrossRef]
- Mah, D.N.Y.; Lam, V.; Siu, A.; Ye, H.; Ogata, S.; Wu, Y.Y. Understanding undergraduate students’ perceptions of dynamic pricing policies: An exploratory study of two pilot deliberative pollings (DPs) in Guangzhou, China and Kyoto, Japan. J. Clean. Prod. 2018, 202, 160–173. [Google Scholar] [CrossRef]
- Abrahamse, W.; Steg, L.; Vlek, C.; Rothengatter, T. The effect of tailored information, goal setting, and tailored feedback on household energy use, energy-related behaviors, and behavioral antecedents. J. Environ. Psychol. 2007, 27, 265–276. [Google Scholar] [CrossRef]
- Steg, L.; Perlaviciute, G.; van der Werff, E. Understanding the human dimensions of a sustainable energy transition. Front. Psychol. 2015, 6, 805. [Google Scholar] [CrossRef]
- Bouw, K.; Wiekens, C.; Faaij, A. Social fingerprints: Social characterisation of neighbourhoods as design frame for sustainable communities. In Proceedings of the Eceee Summer Study Proceedings, Hyères, France, 6–10 June 2022. [Google Scholar]
- Knippenberg, D.V.; Daamen, D. Providing information in public opinion surveys: Motivation and ability effects in the information-and-choice questionnaire. Int. J. Public Opin. Res. 1996, 8, 70–82. [Google Scholar] [CrossRef]
- de Best-Waldhober, M.; Daamen, D.; Ramirez, A.R.; Faaij, A.; Hendriks, C.; de Visser, E. Informed public opinion in the Netherlands: Evaluation of CO2 capture and storage technologies in comparison with other CO2 mitigation options. Int. J. Greenh. Gas Control 2012, 10, 169–180. [Google Scholar] [CrossRef]
- de Best-Waldhober, M.; Daamen, D.; Faaij, A. Informed and uninformed public opinions on CO2 capture and storage technologies in the Netherlands. Int. J. Greenh. Gas Control 2009, 3, 322–332. [Google Scholar] [CrossRef]
- de Best-Waldhober, M.; Daamen, D.; Hendriks, C.; de Visser, E.; Ramirez, A.R.; Faaij, A. How the Dutch evaluate CCS options in comparison with other CO2 mitigation options. In Results of a Nationwide Information-Choice Questionnaire Survey,” Report of the CATO Project; Leiden University: Utrecht, The Netherlands, 2008. [Google Scholar]
- van Der Zwaan, B.; Longa, F.D.; de Boer, H.; Johnson, F.; Johnson, O.; van Klaveren, M.; Mastop, J.; Ogeya, M.; Rietkerk, M.; Straver, K.; et al. An expert elicitation of public acceptance of renewable energy in Kenya. Chall. Sustain. 2019, 7, 30–39. [Google Scholar] [CrossRef]
- Li, P.H.; Keppo, I.; Strachan, N. Incorporating homeowners’ preferences of heating technologies in the UK TIMES model. Energy 2018, 148, 716–727. [Google Scholar] [CrossRef]
- Afman, M.; Meyer, M.; van der Vlies, D.; Kruip, C. Openingsbod Groningen; CE Delft: Delft, The Netherlands, 2019. [Google Scholar]
- CBS. Kerncijfers Wijken en Buurten 2018. Available online: https://www.cbs.nl/nl-nl/maatwerk/2018/30/kerncijfers-wijken-en-buurten-2018 (accessed on 20 June 2022).
- CBS. Kerncijfers Wijken en Buurten 2020. Available online: https://www.cbs.nl/nl-nl/maatwerk/2020/29/kerncijfers-wijken-en-buurten-2020 (accessed on 18 March 2021).
- CBS. Kerncijfers Wijken en Buurten 2021. Available online: https://www.cbs.nl/nl-nl/maatwerk/2021/31/kerncijfers-wijken-en-buurten-2021 (accessed on 20 June 2022).
- Centgraf, S. Supporting civic engagement in German energy cooperatives—Transdisciplinary research based on the reflection of individual needs. Energy Res. Soc. Sci. 2018, 44, 112–121. [Google Scholar] [CrossRef]
- Thomas, M.; Partridge, T.; Pidgeon, N.; Harthorn, B.H.; Demski, C.; Hasell, A. Using role play to explore energy perceptions in the United States and United Kingdom. Energy Res. Soc. Sci. 2018, 45, 363–373. [Google Scholar] [CrossRef]
- Dignum, M.; van der Kooij, P.; Kunseler, E.; van Schie, M.; Schilder, F.; van der Staak, M. Warmtetransitie in de Praktijk—Leren Van Ervaringen Bij Het Aardgasvrij Maken Van Wijken; PBL: Den Haag, The Netherlands, 2021. [Google Scholar]
- MarketResponse. Bewonerstevredenheid Proeftuinen Aardgasvrije Wijken Inhoudsopgave; MarketResponse: Utrecht, The Netherlands, 2021. [Google Scholar]
- Mourik, R.; Boekelo, M. Sociale Structuren in Aardgasvrije Wijken: Ideeën en Methoden Voor Wederzijdse Versterking; DuneWorks: Amsterdam, The Netherlands, 2021. [Google Scholar]
- Karytsas, S.; Theodoropoulou, E. Determinants of citizens’ involvement in community energy initiatives. Int. J. Sustain. Energy 2022, 41, 1836–1848. [Google Scholar] [CrossRef]
- CBS. Bevolking; Kerncijfers. Available online: https://opendata.cbs.nl/statline/#/CBS/nl/dataset/37296NED/table?fromstatweb (accessed on 18 March 2021).
- CBS. Inkomen Van Huishoudens; Inkomensklassen, Huishoudenskenmerken. Available online: https://opendata.cbs.nl/statline/#/CBS/nl/dataset/83932NED/table?ts=1565008102724 (accessed on 18 March 2021).
- CBS. Bevolking; Onderwijsniveau; Geslacht, Leeftijd en Migratieachtergrond. Available online: https://opendata.cbs.nl/statline/#/CBS/nl/dataset/82275NED/table?fromstatweb (accessed on 18 March 2021).
- CBS. Arbeidsdeelname; Kerncijfers. Available online: https://www.cbs.nl/nl-nl/cijfers/detail/82309NED (accessed on 18 March 2021).
- CBS. Werknemers in 2018 Gemiddeld 65 Jaar Bij Pensionering. Available online: https://www.cbs.nl/nl-nl/nieuws/2019/32/werknemers-in-2018-gemiddeld-65-jaar-bij-pensionering (accessed on 18 March 2021).
- CBS. Kerncijfers Wijken en Buurten 2019. Available online: https://www.cbs.nl/nl-nl/maatwerk/2019/31/kerncijfers-wijken-en-buurten-2019 (accessed on 18 March 2021).
- PBL. Klimaat-en Energieverkenning 2022; PBL: Den Haag, The Netherlands, 2022. [Google Scholar]
Disclaimer/Publisher’s Note: The statements, opinions and data contained in all publications are solely those of the individual author(s) and contributor(s) and not of MDPI and/or the editor(s). MDPI and/or the editor(s) disclaim responsibility for any injury to people or property resulting from any ideas, methods, instructions or products referred to in the content. |
© 2023 by the authors. Licensee MDPI, Basel, Switzerland. This article is an open access article distributed under the terms and conditions of the Creative Commons Attribution (CC BY) license (https://creativecommons.org/licenses/by/4.0/).