

Analysis of Factors Influencing Illegal Waste Dumping Generation Using GIS Spatial Regression Methods


 , , and
Abstract
1. Introduction
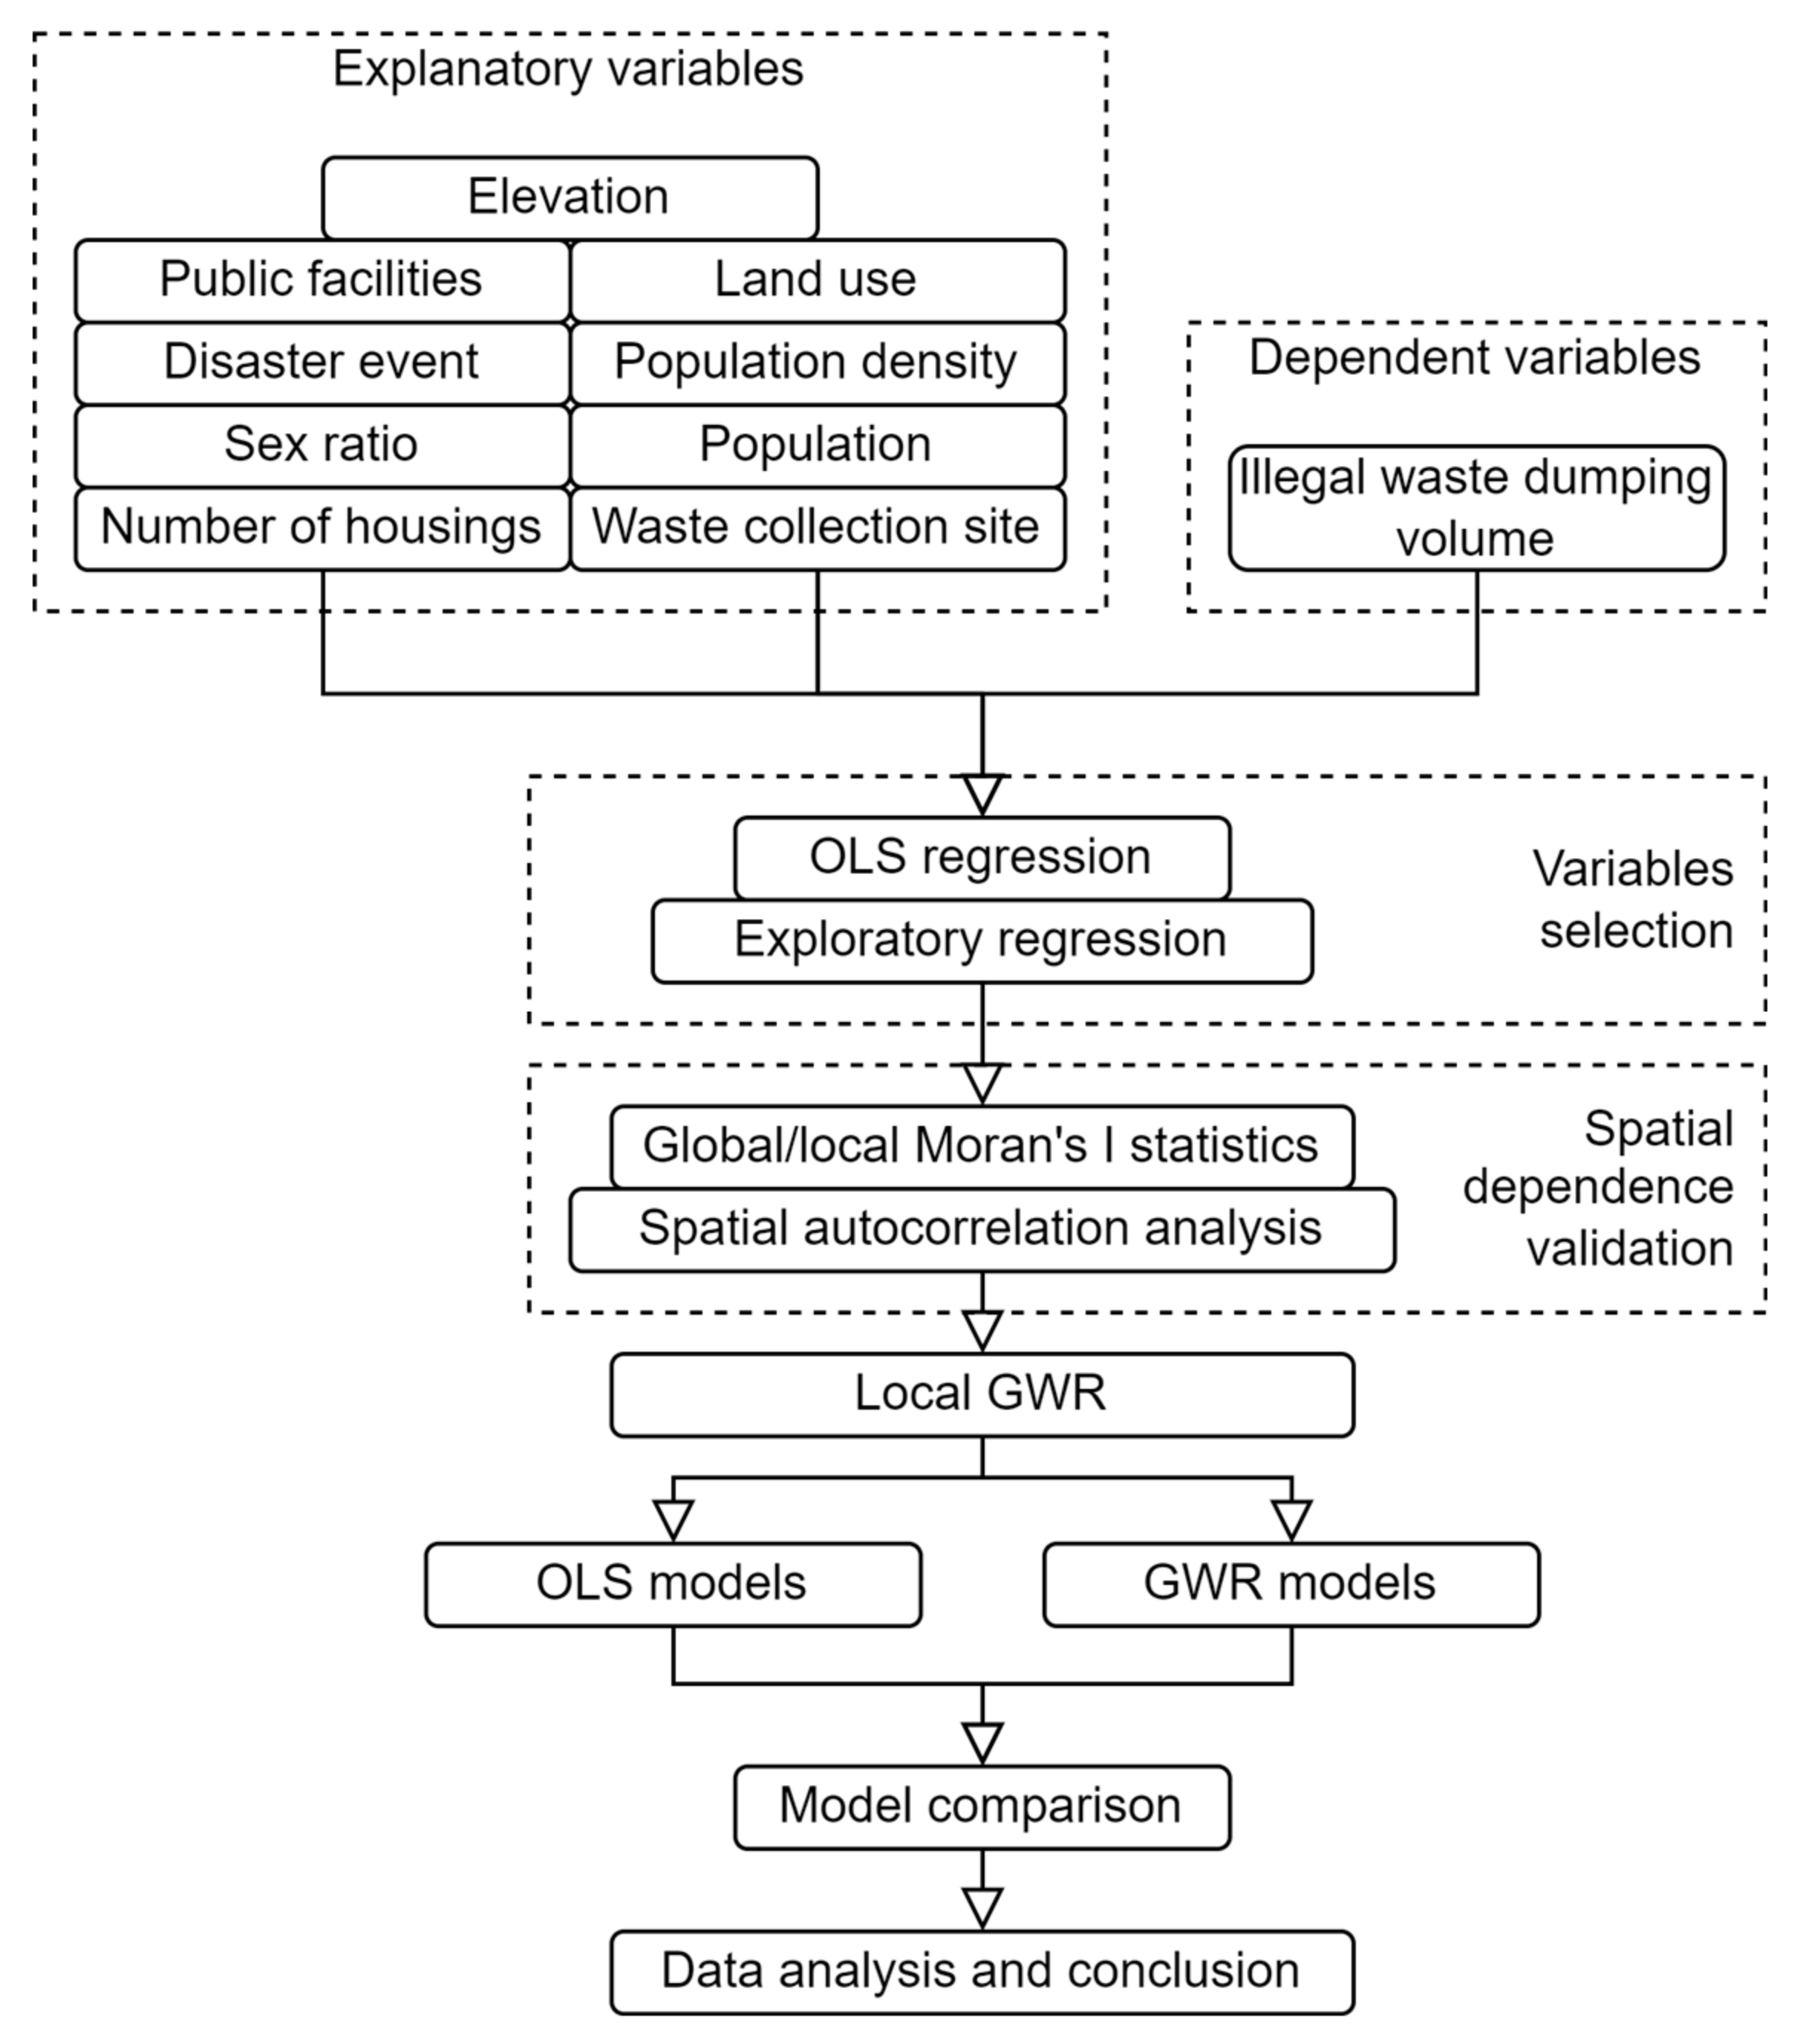
2. Materials and Methods
2.1. Factors Influencing Illegal Dumping Practices
2.2. Spatial and Nonspatial Analysis
3. Results
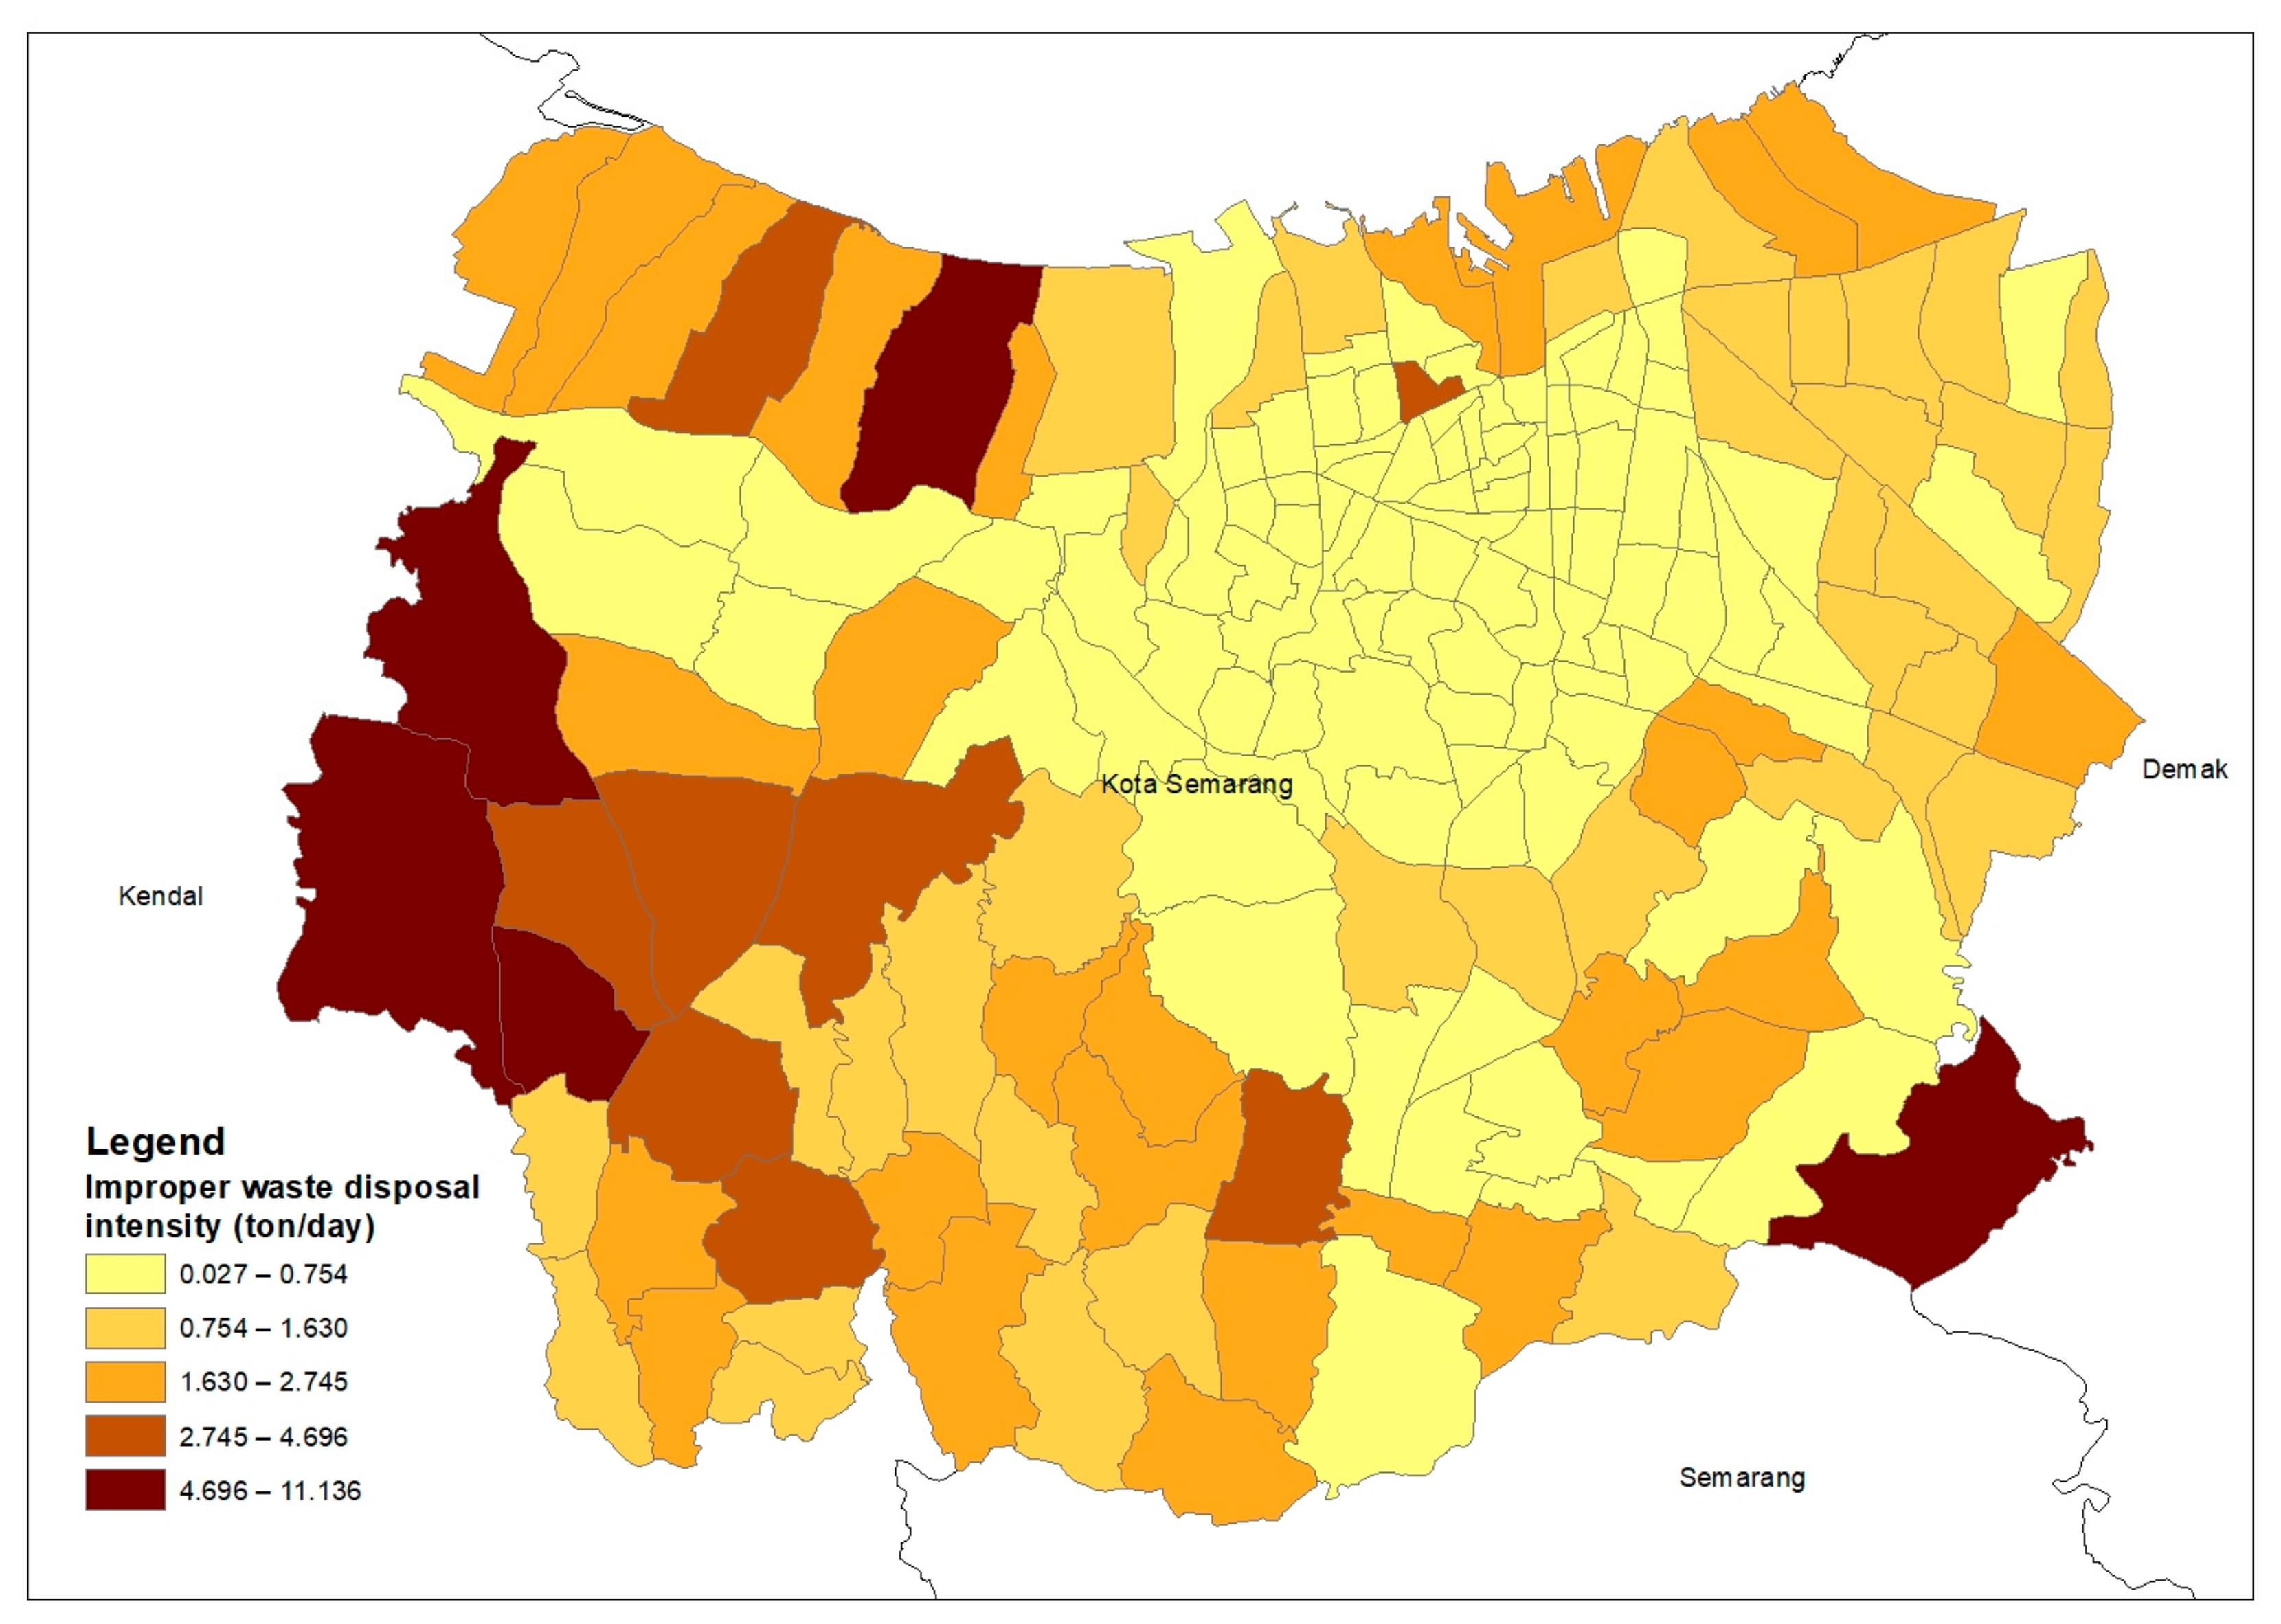
3.1. Semarang City Waste Management Profile
3.2. OLS Output
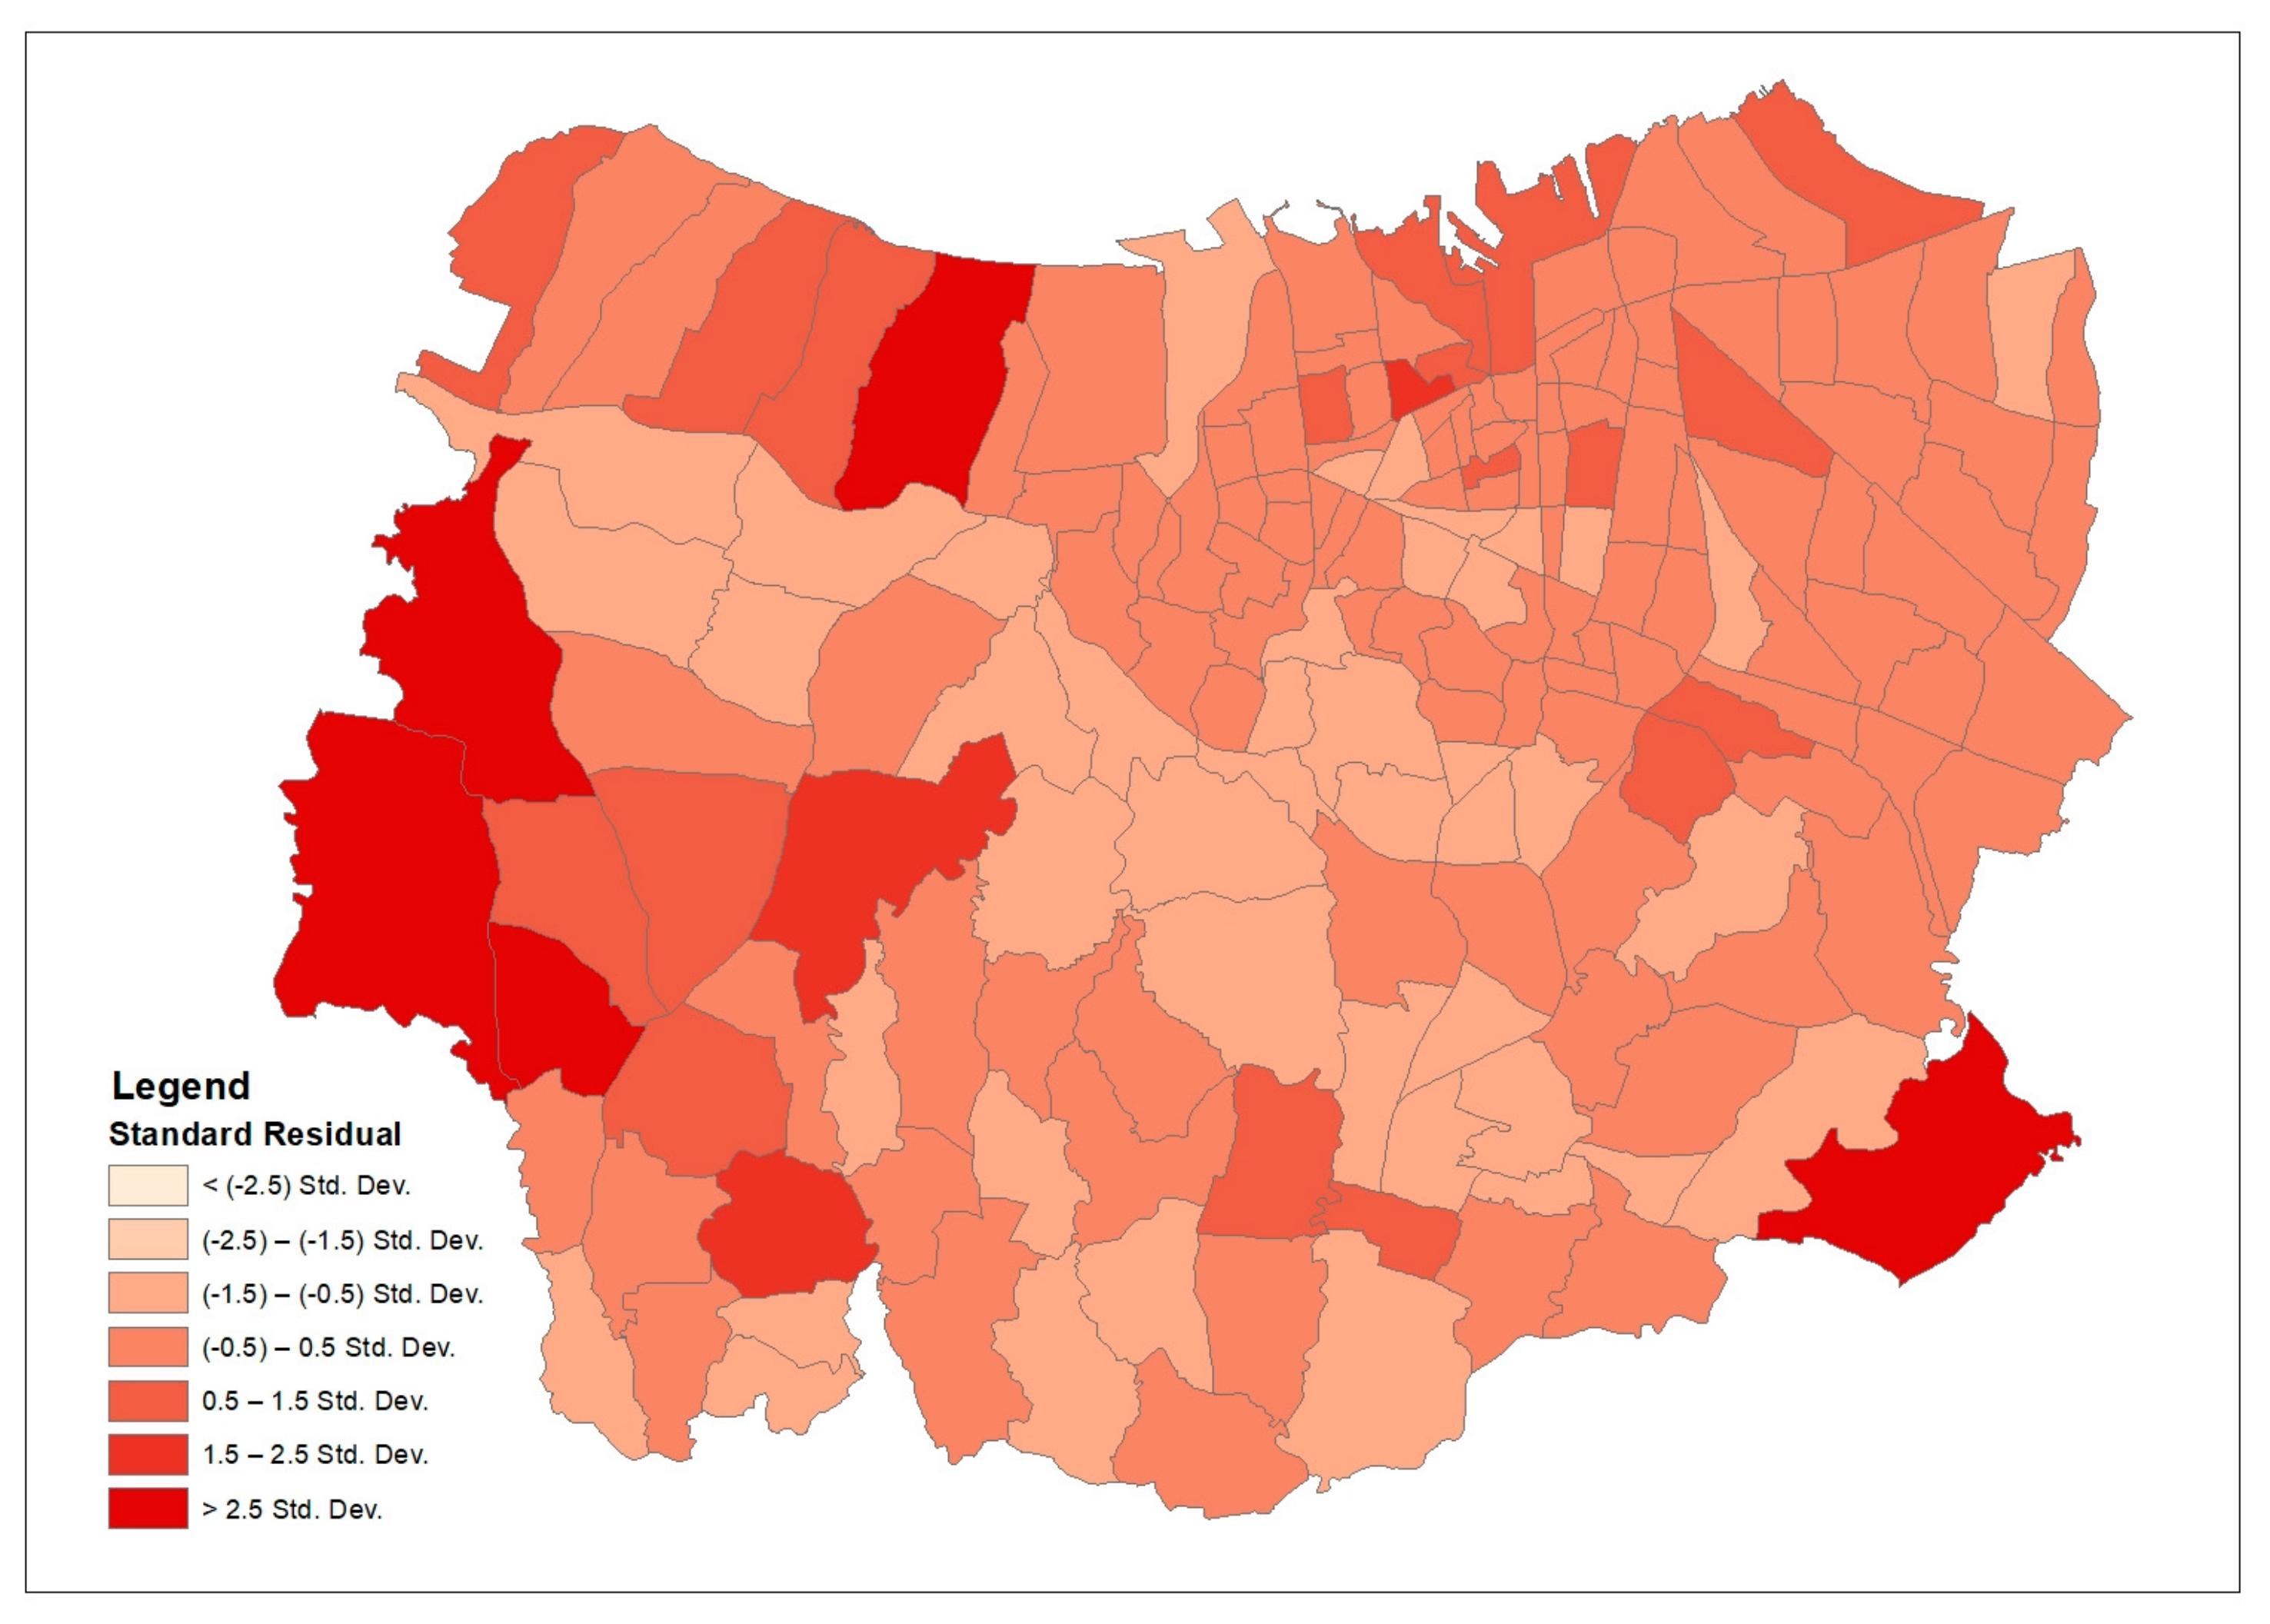
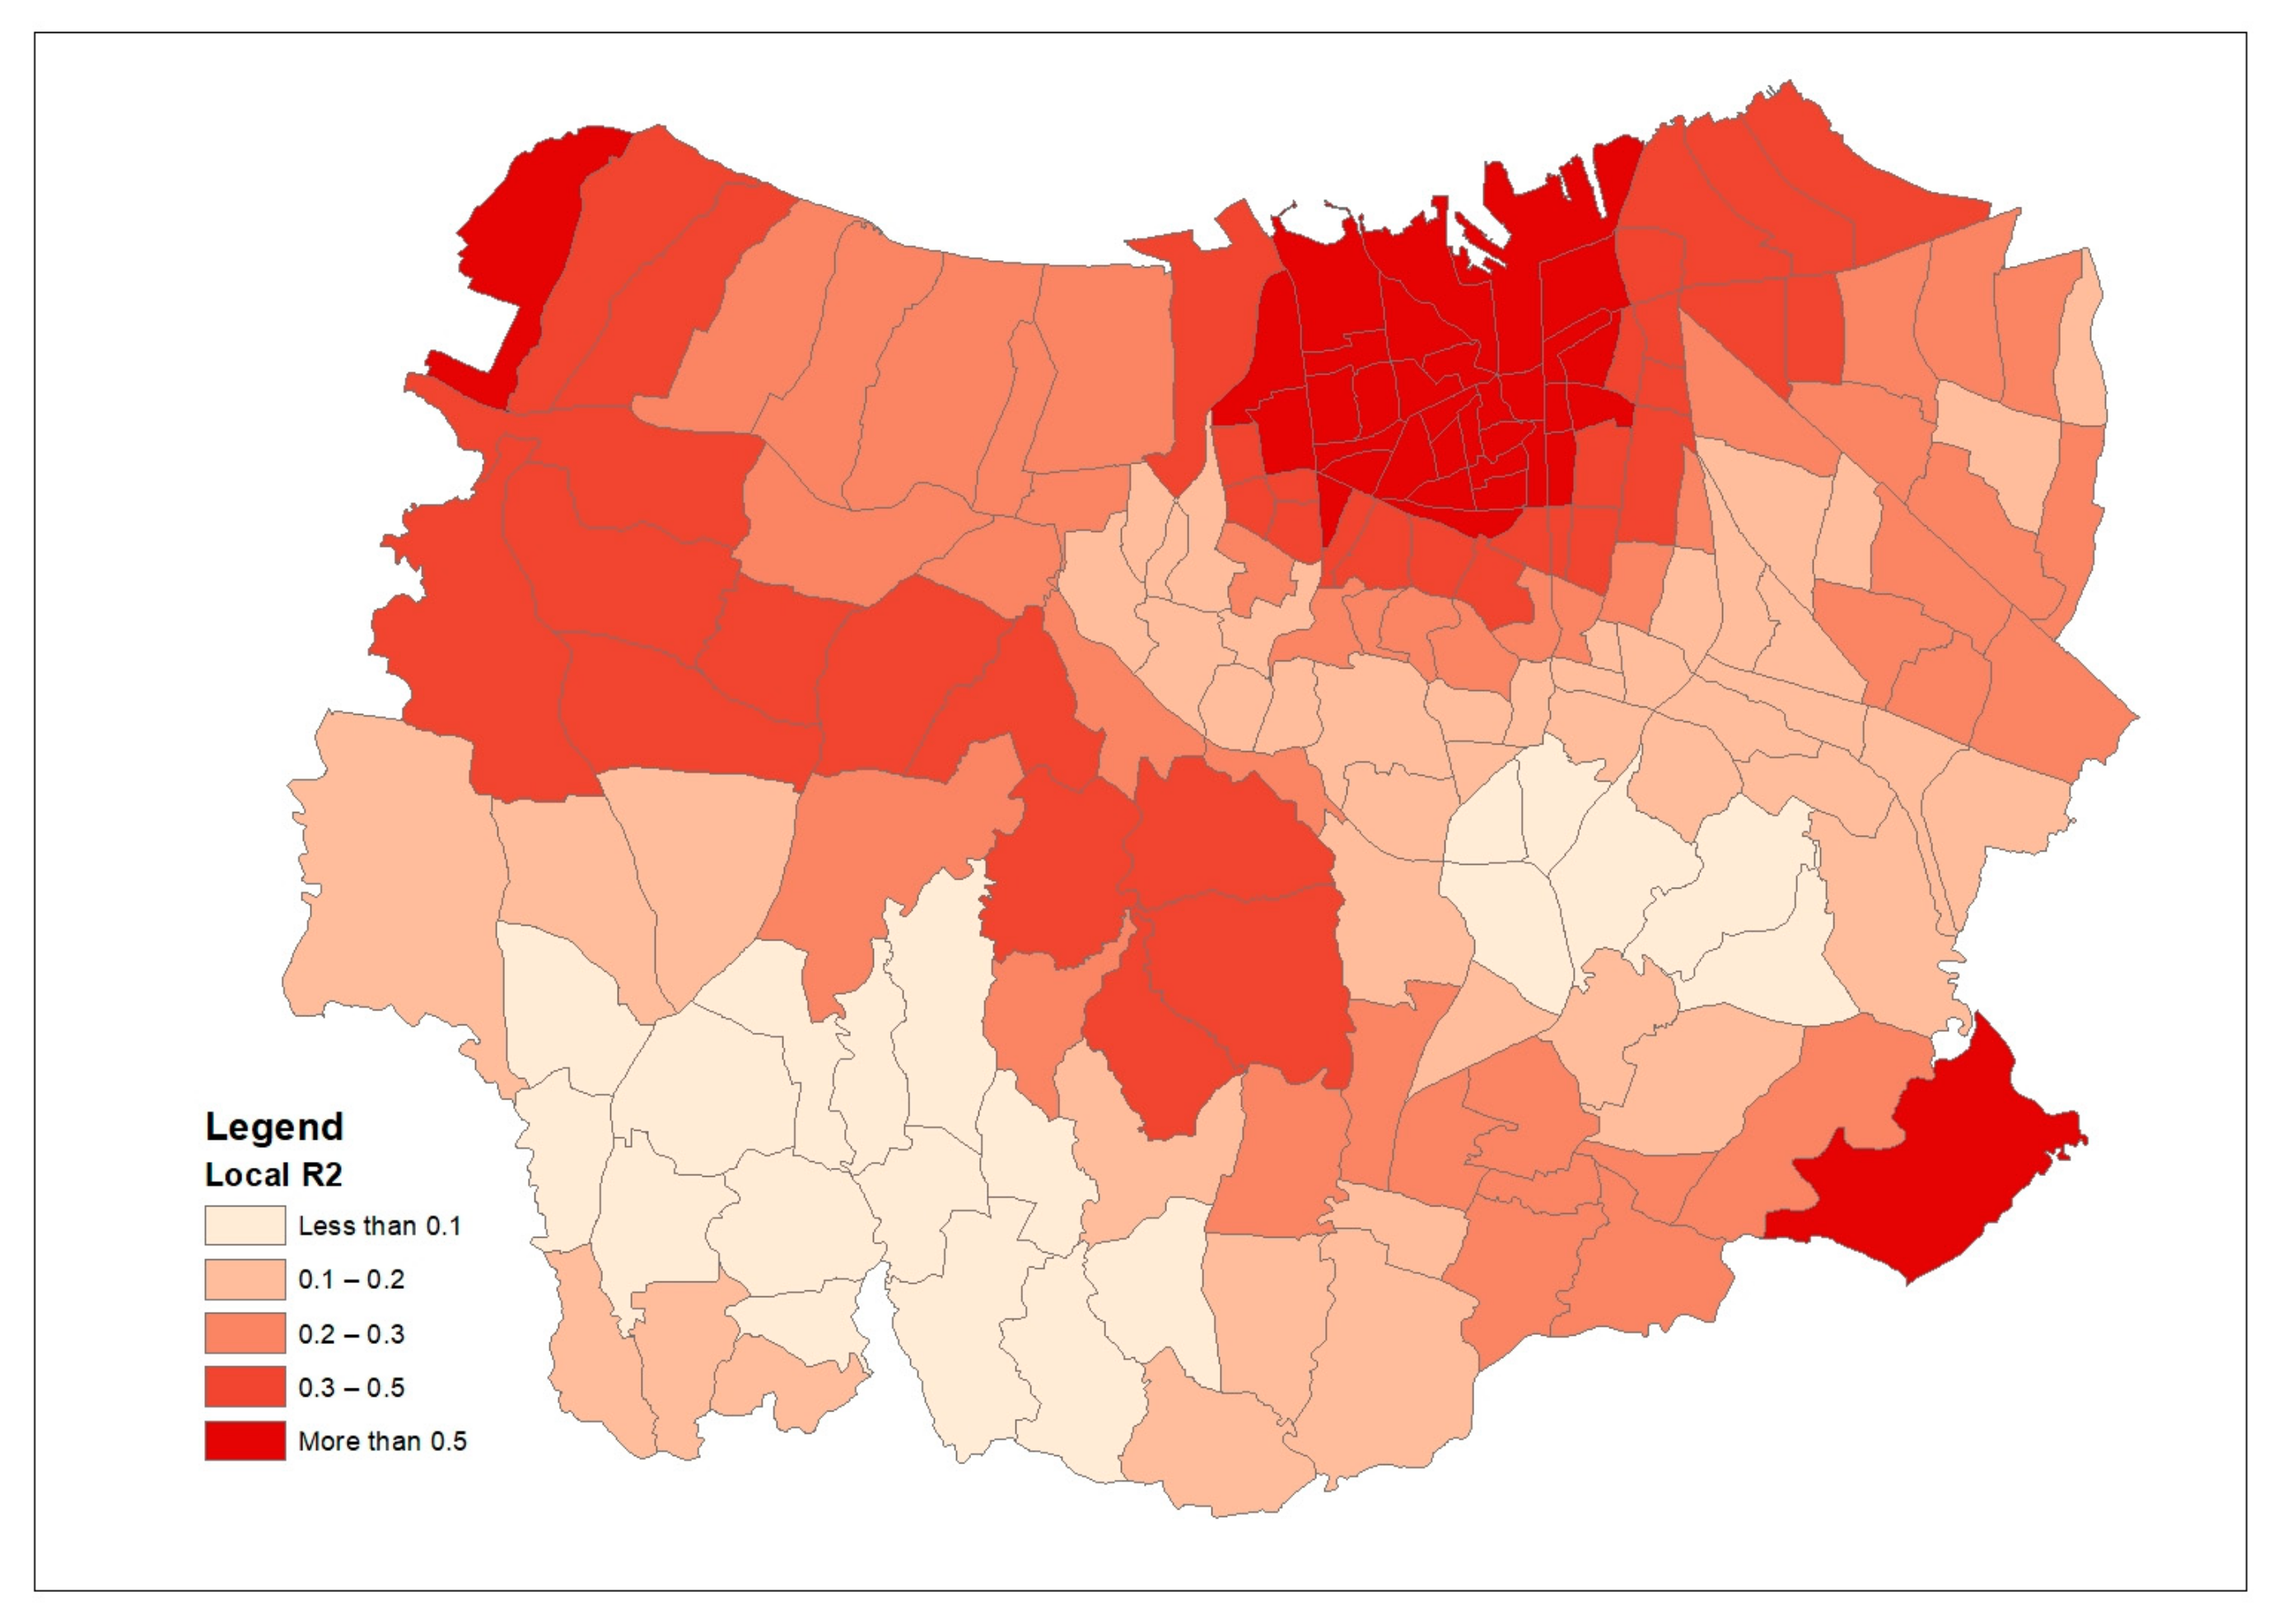
3.3. GWR Results
4. Discussion
5. Conclusions
Author Contributions
Funding
Institutional Review Board Statement
Informed Consent Statement
Data Availability Statement
Conflicts of Interest
References
- Nanda, S.; Berruti, F. Municipal Solid Waste Management and Landfilling Technologies: A Review. Environ. Chem. Lett. 2021, 1433–1456. [Google Scholar] [CrossRef]
- Seng, B.; Fujiwara, T.; Spoann, V. Households’ Knowledge, Attitudes, and Practices toward Solid Waste Management in Suburbs of Phnom Penh, Cambodia. Waste Manag. Res. 2018, 36, 993–1000. [Google Scholar] [CrossRef] [PubMed]
- Baker, L.H.; Collins, W.J.; Olivié, D.J.L.; Cherian, R.; Hodnebrog, O.; Myhre, G.; Quaas, J. Climate Responses to Anthropogenic Emissions of Short-Lived Climate Pollutants. Atmos. Chem. Phys. 2015, 15, 8201–8216. [Google Scholar] [CrossRef]
- Premakumara, D.G.J.; Menikpura, S.N.M.; Singh, R.K.; Hengesbaugh, M.; Magalang, A.A.; Ildefonso, E.T.; Valdez, M.D.C.M.; Silva, L.C. Reduction of Greenhouse Gases (GHGs) and Short-Lived Climate Pollutants (SLCPs) from Municipal Solid Waste Management (MSWM) in the Philippines: Rapid Review and Assessment. Waste Manag. 2018, 80, 397–405. [Google Scholar] [CrossRef] [PubMed]
- Siddiqua, A.; Hahladakis, J.N.; Al-Attiya, W.A.K.A. An Overview of the Environmental Pollution and Health Effects Associated with Waste Landfilling and Open Dumping. Env. Sci. Pollut. Res. 2022, 29, 58514–58536. [Google Scholar] [CrossRef]
- Ramadan, B.S.; Rachman, I.; Ikhlas, N.; Kurniawan, S.B.; Miftahadi, M.F.; Matsumoto, T. A Comprehensive Review of Domestic-Open Waste Burning: Recent Trends, Methodology Comparison, and Factors Assessment. J. Mater. Cycles Waste Manag. 2022, 24, 1633–1647. [Google Scholar] [CrossRef]
- Agovino, M.; Musella, G. Separate Waste Collection in Mountain Municipalities. A Case Study in Campania. Land Use Policy 2020, 91, 104408. [Google Scholar] [CrossRef]
- Nagpure, A.S. Assessment of Quantity and Composition of Illegal Dumped Municipal Solid Waste (MSW) in Delhi. Resour. Conserv. Recycl. 2019, 141, 54–60. [Google Scholar] [CrossRef]
- Matsumoto, S.; Takeuchi, K. The Effect of Community Characteristics on the Frequency of Illegal Dumping. Env. Econ. Policy Stud. 2011, 13, 177–193. [Google Scholar] [CrossRef]
- Šedová, B. On Causes of Illegal Waste Dumping in Slovakia. J. Environ. Plan. Manag. 2016, 59, 1277–1303. [Google Scholar] [CrossRef]
- Kadang, J.M.; Sinaga, N. Pengembangan Teknologi Konversi Sampah Untuk Efektifitas Pengolahan Sampah dan Energi Berkelanjutan. Teknika 2021, 15, 33–44. [Google Scholar]
- Ramadan, B.S.; Rachman, I.; Matsumoto, T. Activity and Emission Inventory of Open Waste Burning at the Household Level in Developing Countries: A Case Study of Semarang City. J. Mater. Cycles Waste Manag. 2022, 24, 1194–1204. [Google Scholar] [CrossRef]
- Menikpura, N.; Singh, R.K.; Gamaralalage, P.J.D. Assessment of Climate Impact of Black Carbon Emissions from Open Burning of Solid Waste in Asian Cities; United Nation Environment Programme: Nairobi, Kenya, 2022; p. 56. [Google Scholar]
- Daoud, A.O.; Othman, A.A.E.; Robinson, H.; Bayyati, A. An Investigation into Solid Waste Problem in the Egyptian Construction Industry: A Mini-Review. Waste Manag. Res. 2020, 38, 371–382. [Google Scholar] [CrossRef] [PubMed]
- Keser, S.; Duzgun, S.; Aksoy, A. Application of Spatial and Non-Spatial Data Analysis in Determination of the Factors That Impact Municipal Solid Waste Generation Rates in Turkey. Waste Manag. 2012, 32, 359–371. [Google Scholar] [CrossRef]
- Antczak, E. Regionally Divergent Patterns in Factors Affecting Municipal Waste Production: The Polish Perspective. Sustainability 2020, 12, 6885. [Google Scholar] [CrossRef]
- Rybova, K. Do Sociodemographic Characteristics in Waste Management Matter? Case Study of Recyclable Generation in the Czech Republic. Sustainability 2019, 11, 2030. [Google Scholar] [CrossRef]
- Agovino, M.; Marchesano, K.; Musella, G. Inequality and Regressivity in Italian Waste Taxation. Is There an Alternative Route? Waste Manag. 2021, 122, 1–14. [Google Scholar] [CrossRef]
- Kim, Y.; Tanaka, K.; Ge, C. Estimating the Provincial Environmental Kuznets Curve in China: A Geographically Weighted Regression Approach. Stoch Env. Res. Risk Assess. 2018, 32, 2147–2163. [Google Scholar] [CrossRef]
- Madden, B.; Florin, N.; Mohr, S.; Giurco, D. Using the Waste Kuznet’s Curve to Explore Regional Variation in the Decoupling of Waste Generation and Socioeconomic Indicators. Resour. Conserv. Recycl. 2019, 149, 674–686. [Google Scholar] [CrossRef]
- Anilkumar, P.P.; Chithra, K. Land Use Based Modelling of Solid Waste Generation for Sustainable Residential Development in Small/Medium Scale Urban Areas. Procedia Environ. Sci. 2016, 35, 229–237. [Google Scholar] [CrossRef]
- Albuquerque Sant’Anna, A. Not So Natural: Unequal Effects of Public Policies on the Occurrence of Disasters. Ecol. Econ. 2018, 152, 273–281. [Google Scholar] [CrossRef]
- Torkashvand, J.; Farzadkia, M. A Systematic Review on Cigarette Butt Management as a Hazardous Waste and Prevalent Litter: Control and Recycling. Env. Sci. Pollut. Res. 2019, 26, 11618–11630. [Google Scholar] [CrossRef] [PubMed]
- Rybova, K.; Burcin, B.; Slavik, J. Spatial and Non-Spatial Analysis of Socio-Demographic Aspects Influencing Municipal Solid Waste Generation in the Czech Republic. Detritus 2018, 1, 3–7. [Google Scholar] [CrossRef]
- Nazeer, M.; Bilal, M. Evaluation of Ordinary Least Square (OLS) and Geographically Weighted Regression (GWR) for Water Quality Monitoring: A Case Study for the Estimation of Salinity. J. Ocean Univ. China 2018, 17, 305–310. [Google Scholar] [CrossRef]
- Sadma, O. The Role of Environmental-Based “Green Startup” in Reducing Waste Problem and Its Implication to Environmental Resilience. Res. Horiz. 2021, 1, 106–114. [Google Scholar] [CrossRef]
- Syafrudin; Budihardjo, M.A.; Yuliastuti, N.; Ramadan, B.S. Assessment of Greenhouse Gases Emission from Integrated Solid Waste Management in Semarang City, Central Java, Indonesia. Evergreen 2021, 8, 23–35. [Google Scholar] [CrossRef]
- Budihardjo, M.A.; Humaira, N.G.; Putri, S.A.; Syafrudin; Yohana, E.; Ramadan, B.S.; Zaman, B.; Sutrisno, E. Indonesian Efforts to Overcome Covid-19’s Effects on Its Municipal Solid Waste Management: A Review. Cogent Eng. 2022, 9, 2143055. [Google Scholar] [CrossRef]
- Budihardjo, M.A.; Ardiansyah, S.Y.; Ramadan, B.S. Community-Driven Material Recovery Facility (CdMRF) for Sustainable Economic Incentives of Waste Management: Evidence from Semarang City, Indonesia. Habitat Int. 2022, 119, 102488. [Google Scholar] [CrossRef]
- Sejati, A.W.; Buchori, I.; Rudiarto, I. The Spatio-Temporal Trends of Urban Growth and Surface Urban Heat Islands over Two Decades in the Semarang Metropolitan Region. Sustain. Cities Soc. 2019, 46, 101432. [Google Scholar] [CrossRef]


| Variable | Code | Correlation | Description/Hypothesis | References |
|---|---|---|---|---|
| Waste collection site | WCS | Negative | Fewer waste collection sites will increase the possibility of illegal dumping practices. | [7,8] |
| Population | Pop | Positive | The bigger the population, the bigger the waste generation, leading to a higher possibility of illegal dumping practices. | [16,20] |
| Population density | PD | Negative | A more significant population density will increase the lower possibility of illegal dumping practices since the waste collection service is provided well. | [7,20] |
| Land use score | LUFINAL | Negative | The higher the activity, the lower potential for illegal dumping practices. | [21] |
| Elevation | ELEV | Positive | The higher the elevation, the higher possibility of illegal dumping practices. | [7] |
| Number of housing | HOUSE | Positive | The number of households indicates the higher activities in the area, thus increasing the number of illegal disposal sites. | [16,20] |
| Sex ratio | SR | Negative | The higher percentage of males in a subdistrict will increase the number of illegal dumping practices. | [2] |
| Disaster event | DE | Positive | The higher potential of disaster will lead to a higher possibility of illegal dumping practices. | [22] |
| Public facilities | CF | Negative | The more significant number of public facilities in an area, the less possibility of illegal dumping sites. | [23] |
| Variable | Unit | Max | Min | Mean | St. Dev |
|---|---|---|---|---|---|
| Waste collection site | unit | 7 | 0 | 1.07 | 1.26 |
| Land use score | km2 | 9,195,316 | 2,461,048 | 4,420,573 | 842,025 |
| Elevation | m | 349 | 0 | 75 | 99 |
| Population density | people/km2 | 29,166 | 246 | 7758 | 5787 |
| Sex ratio | - | 1.09 | 0.87 | 0.98 | 0.04 |
| Number of housing | unit | 12,524 | 204 | 3099 | 2025 |
| Disaster event | times | 11 | 0 | 0.95 | 1.89 |
| Public facilities | unit | 215.00 | 9.00 | 50.72 | 30.17 |
| Improper waste disposal weight | tons/day | 11.14 | 0.03 | 1.13 | 1.51 |
| Variable | 2017 | 2018 | 2019 | 2020 | 2021 | Sources |
|---|---|---|---|---|---|---|
| Population | 1,658,552 | 1,668,578 | 1,674,358 | 1,685,909 | 1,687,222 | Population and Civil Registration Agency (a) |
| GDP (IDR/million) | 91.19 | 98.1 | 105.93 | 114.2 | 123.98 | Central Bureau of Statistics |
| Waste handled (ton) | 414,647.3 | 423,830.7 | 356,782.59 | 349,823.9 | 319,718.1 | Open data of Semarang City |
| Waste generated (ton) | 419,189.45 | 478,905.55 | 456,873.35 | 466,010.79 | 430,749.75 | Open data of Semarang City (b) |
| Waste generation per capita (kg/cap/day) | 0.69 | 0.79 | 0.75 | 0.76 | 0.70 | ((a/b)/365)*1000 |
| Waste collected to landfill (%) | 88 | 88.5 | 89 | 89.5 | 90 | Open data of Semarang City |
| The waste bank operated (unit) | 32 | 25 | 54 | 47 | 47 | Open data of Semarang City |
| Waste recycled (m3) | 4544 | 4645 | 4747 | 4852 | 4959 | Open data of Semarang City |
| Variable | Coefficient | Standard Error | t-Statistics | VIF |
|---|---|---|---|---|
| Intercept | 1.667615 | 0.241355 | 6.909 | - |
| Elevation | 0.002896 | 0.001177 | 2.461 | 1.404 |
| Population density | −0.000098 | 0.000021 | −4.763 | 1.404 |
| Variable | OLS Result | GWR Result |
|---|---|---|
| R-squared | 0.250 | 0.691 |
| Adjusted R-squared | 0.241 | 0.606 |
| AICc | 605.4840 | 512.167 |
Disclaimer/Publisher’s Note: The statements, opinions and data contained in all publications are solely those of the individual author(s) and contributor(s) and not of MDPI and/or the editor(s). MDPI and/or the editor(s) disclaim responsibility for any injury to people or property resulting from any ideas, methods, instructions or products referred to in the content. |
© 2023 by the authors. Licensee MDPI, Basel, Switzerland. This article is an open access article distributed under the terms and conditions of the Creative Commons Attribution (CC BY) license (https://creativecommons.org/licenses/by/4.0/).
Share and Cite
Syafrudin, S.; Ramadan, B.S.; Budihardjo, M.A.; Munawir, M.; Khair, H.; Rosmalina, R.T.; Ardiansyah, S.Y. Analysis of Factors Influencing Illegal Waste Dumping Generation Using GIS Spatial Regression Methods. Sustainability 2023, 15, 1926. https://doi.org/10.3390/su15031926
Syafrudin S, Ramadan BS, Budihardjo MA, Munawir M, Khair H, Rosmalina RT, Ardiansyah SY. Analysis of Factors Influencing Illegal Waste Dumping Generation Using GIS Spatial Regression Methods. Sustainability. 2023; 15(3):1926. https://doi.org/10.3390/su15031926
Chicago/Turabian StyleSyafrudin, Syafrudin, Bimastyaji Surya Ramadan, Mochamad Arief Budihardjo, Munawir Munawir, Hafizhul Khair, Raden Tina Rosmalina, and Septa Yudha Ardiansyah. 2023. "Analysis of Factors Influencing Illegal Waste Dumping Generation Using GIS Spatial Regression Methods" Sustainability 15, no. 3: 1926. https://doi.org/10.3390/su15031926
APA StyleSyafrudin, S., Ramadan, B. S., Budihardjo, M. A., Munawir, M., Khair, H., Rosmalina, R. T., & Ardiansyah, S. Y. (2023). Analysis of Factors Influencing Illegal Waste Dumping Generation Using GIS Spatial Regression Methods. Sustainability, 15(3), 1926. https://doi.org/10.3390/su15031926