

On the Internal Synergistic Mechanism of Operating System of Beijing’s High-Technology Industry Chain: Evidence from Science and Technology Service Industry

Abstract
1. Introduction
2. Literature Review
3. Modeling
3.1. Data Sources
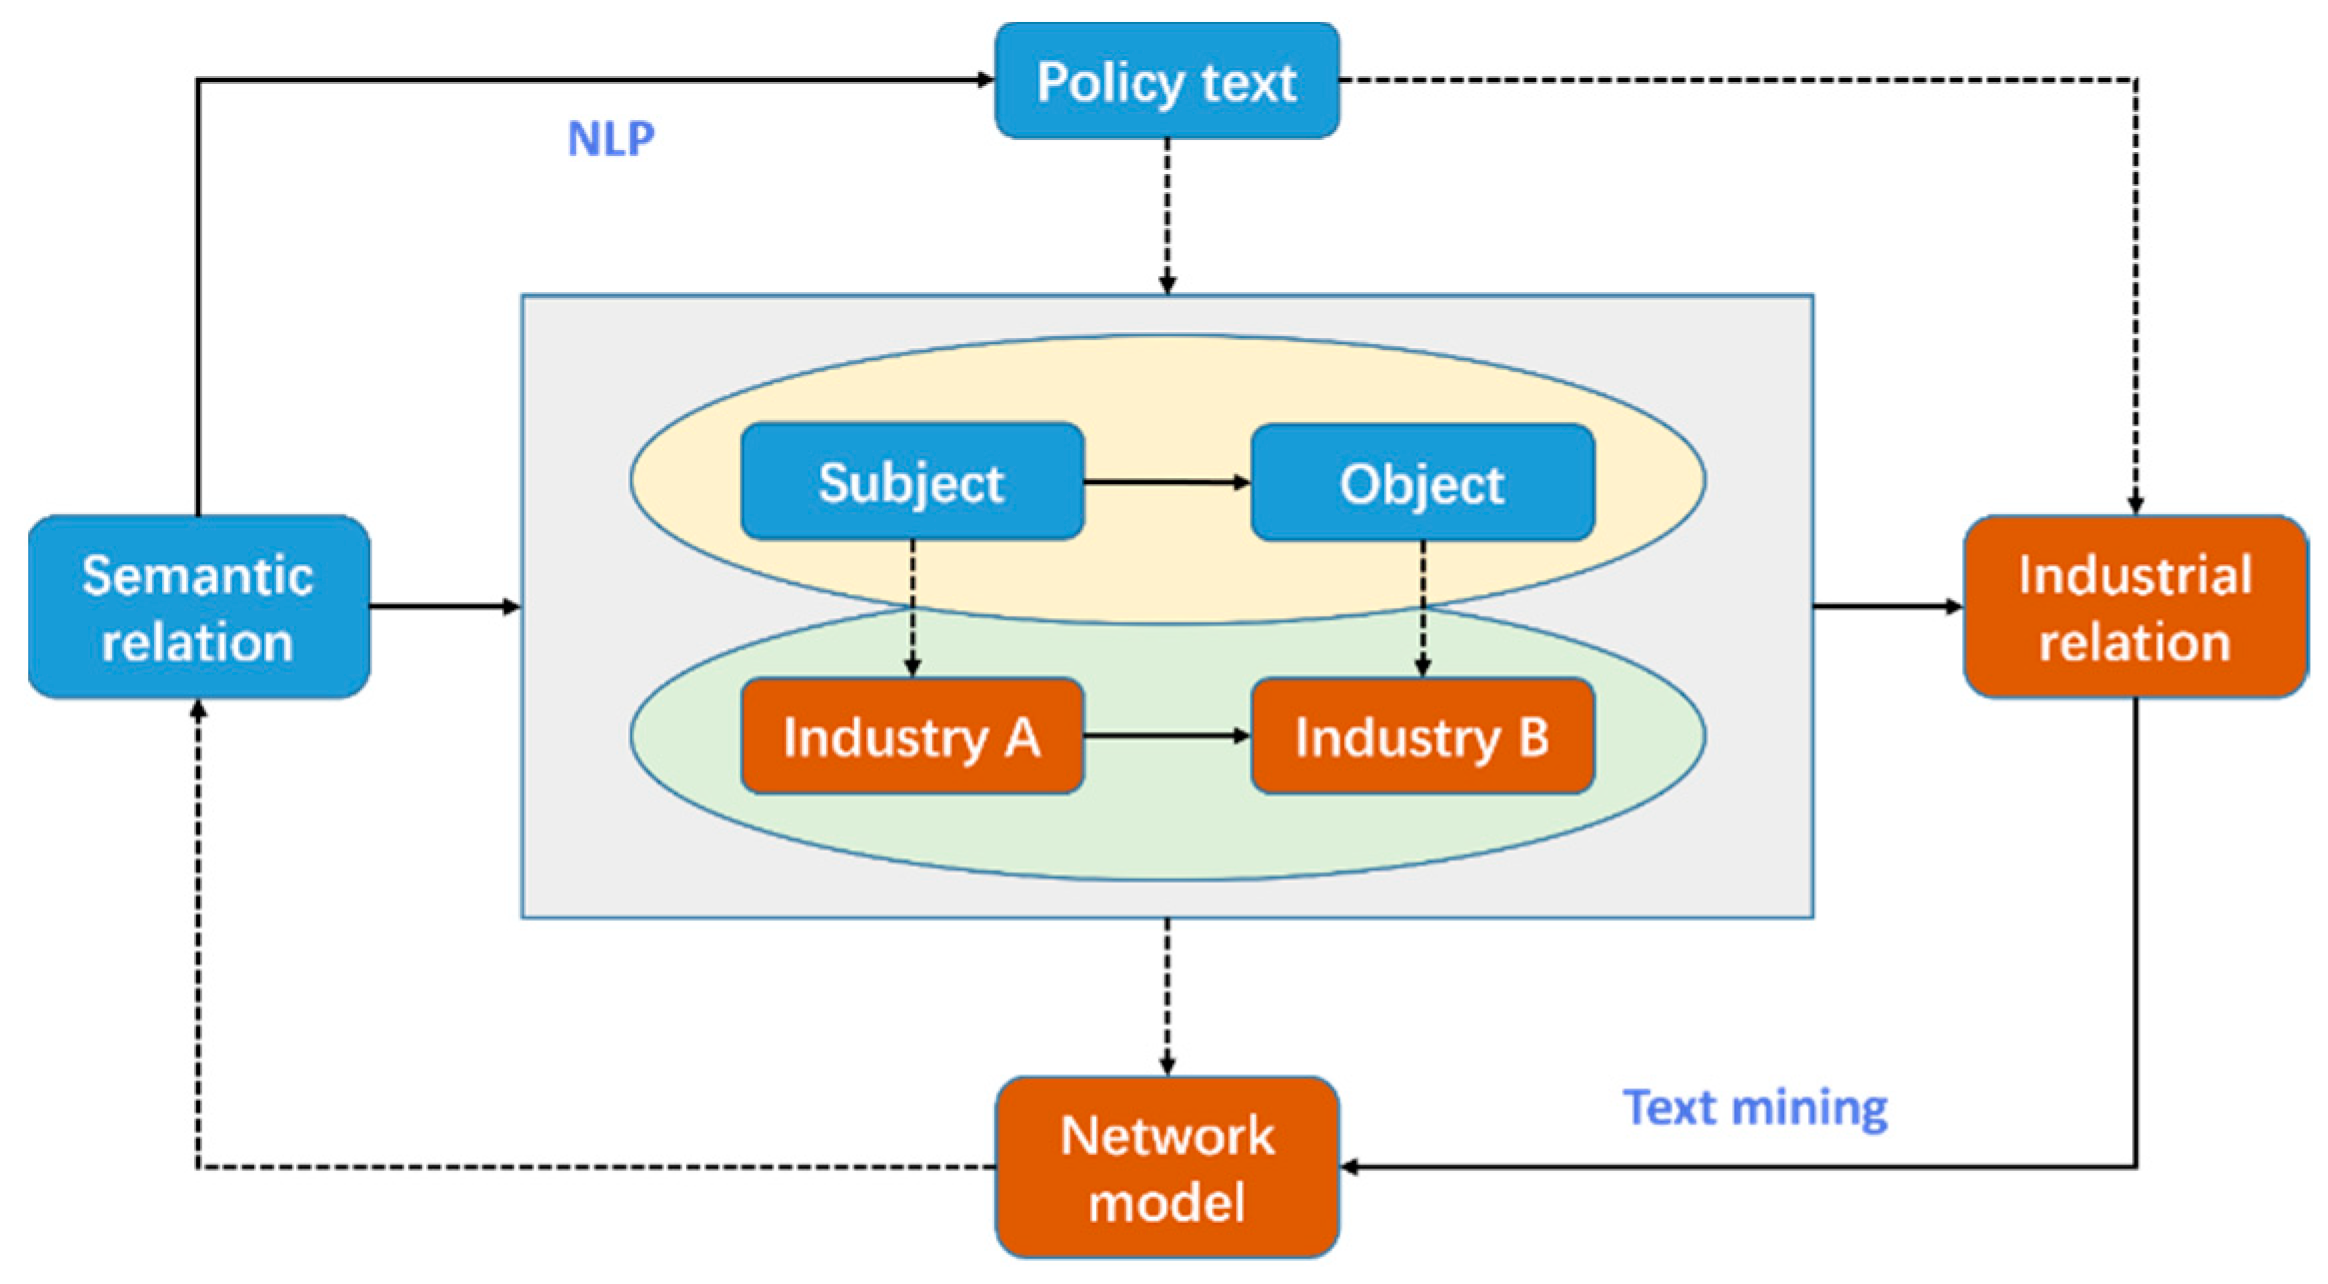
3.2. Network Modeling
4. Methodology
4.1. Overall Network Analysis
4.2. Betweenness Centrality of the Node
4.3. Betweenness Centrality of the Edge
5. Results and Discussions
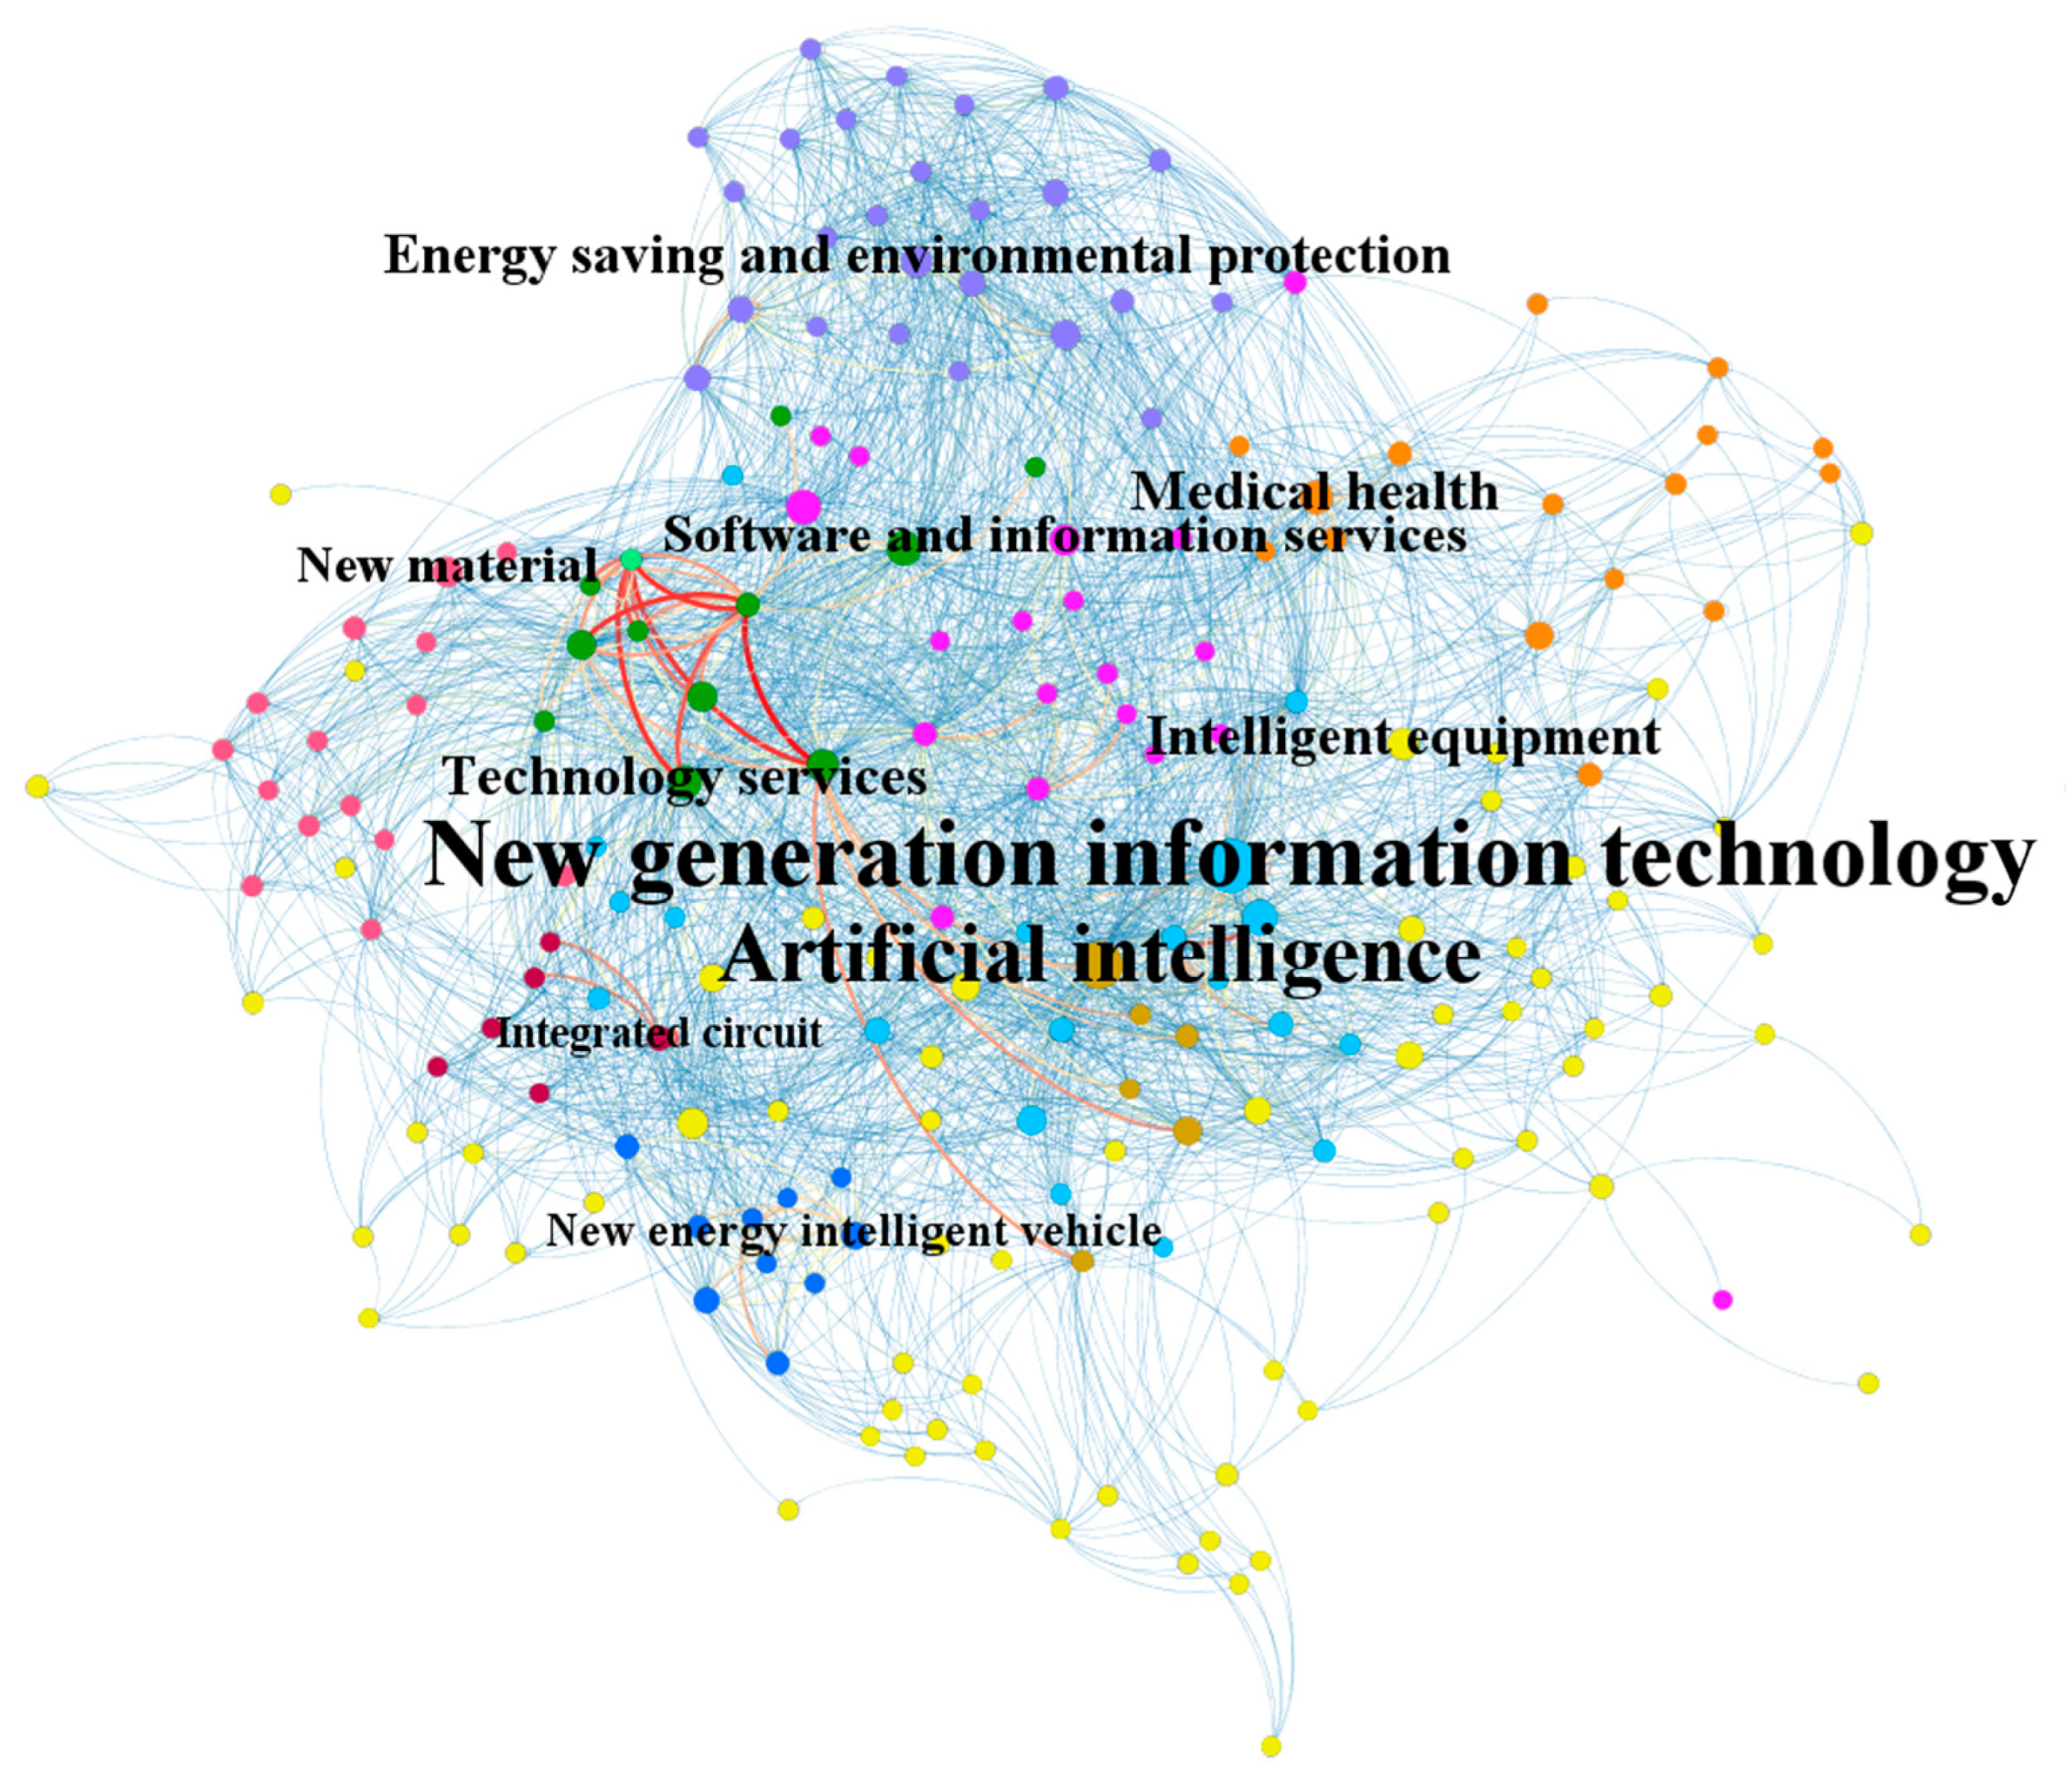
5.1. Overall Network Analysis
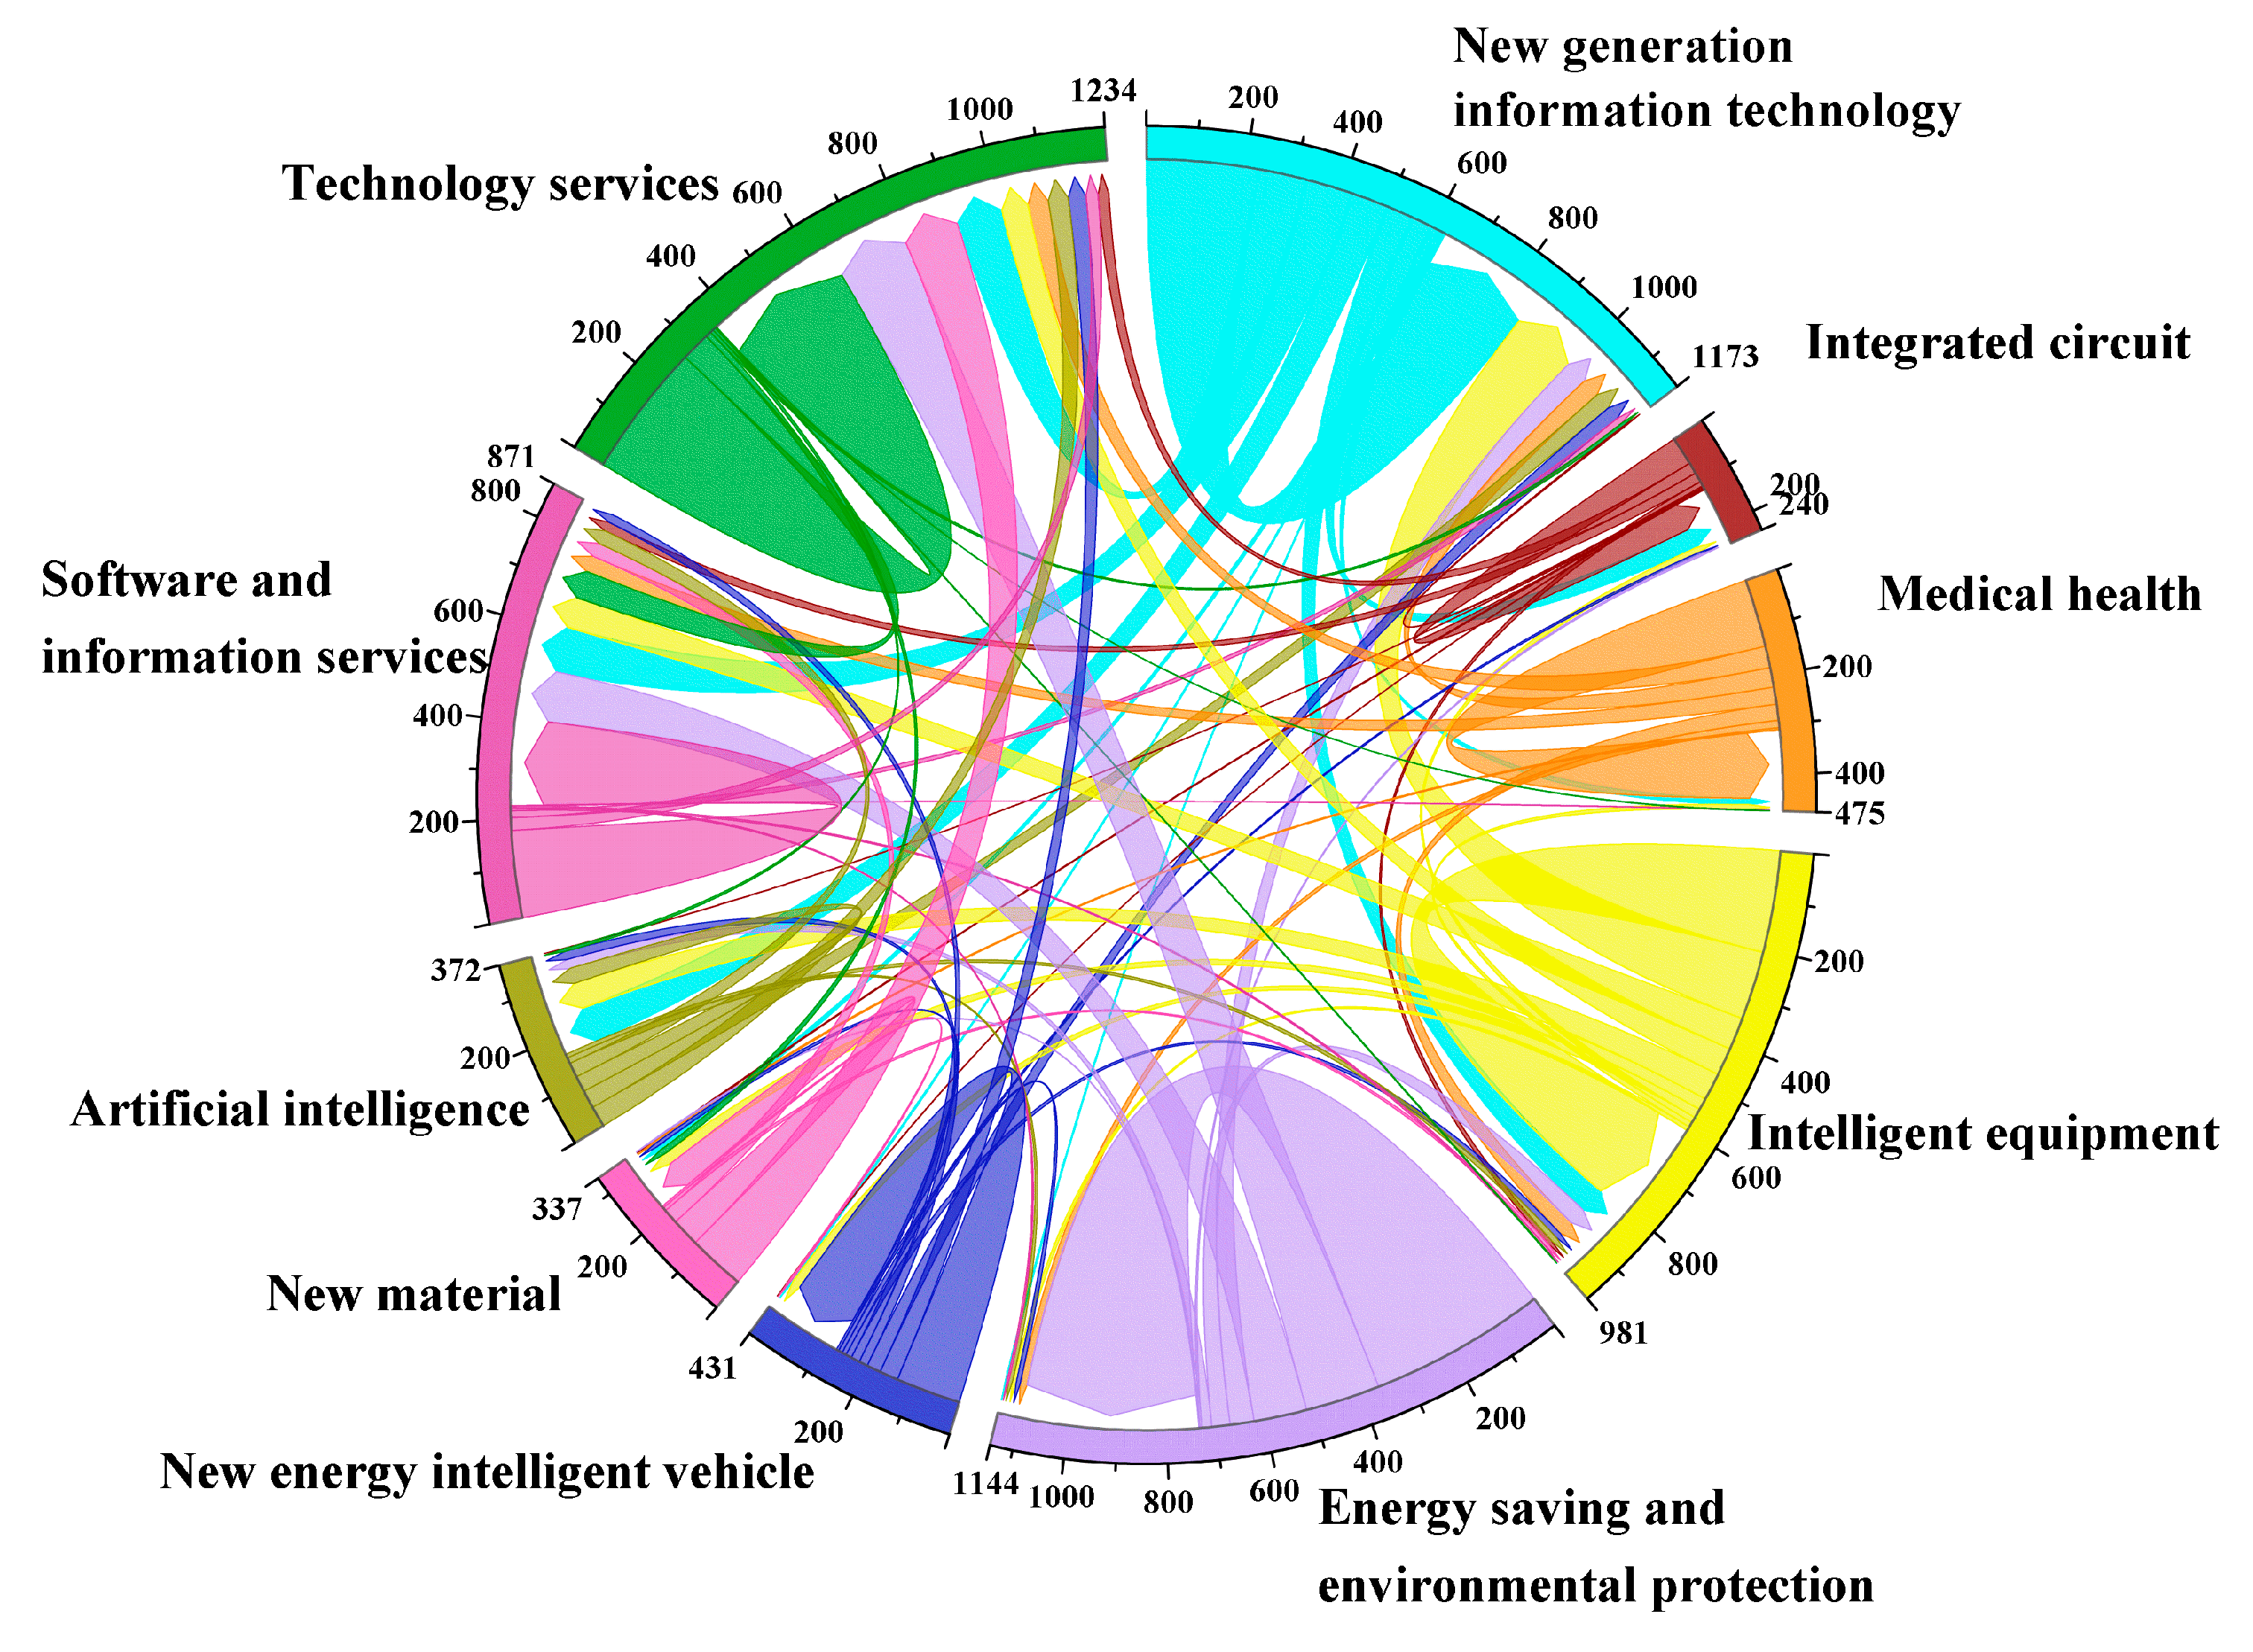
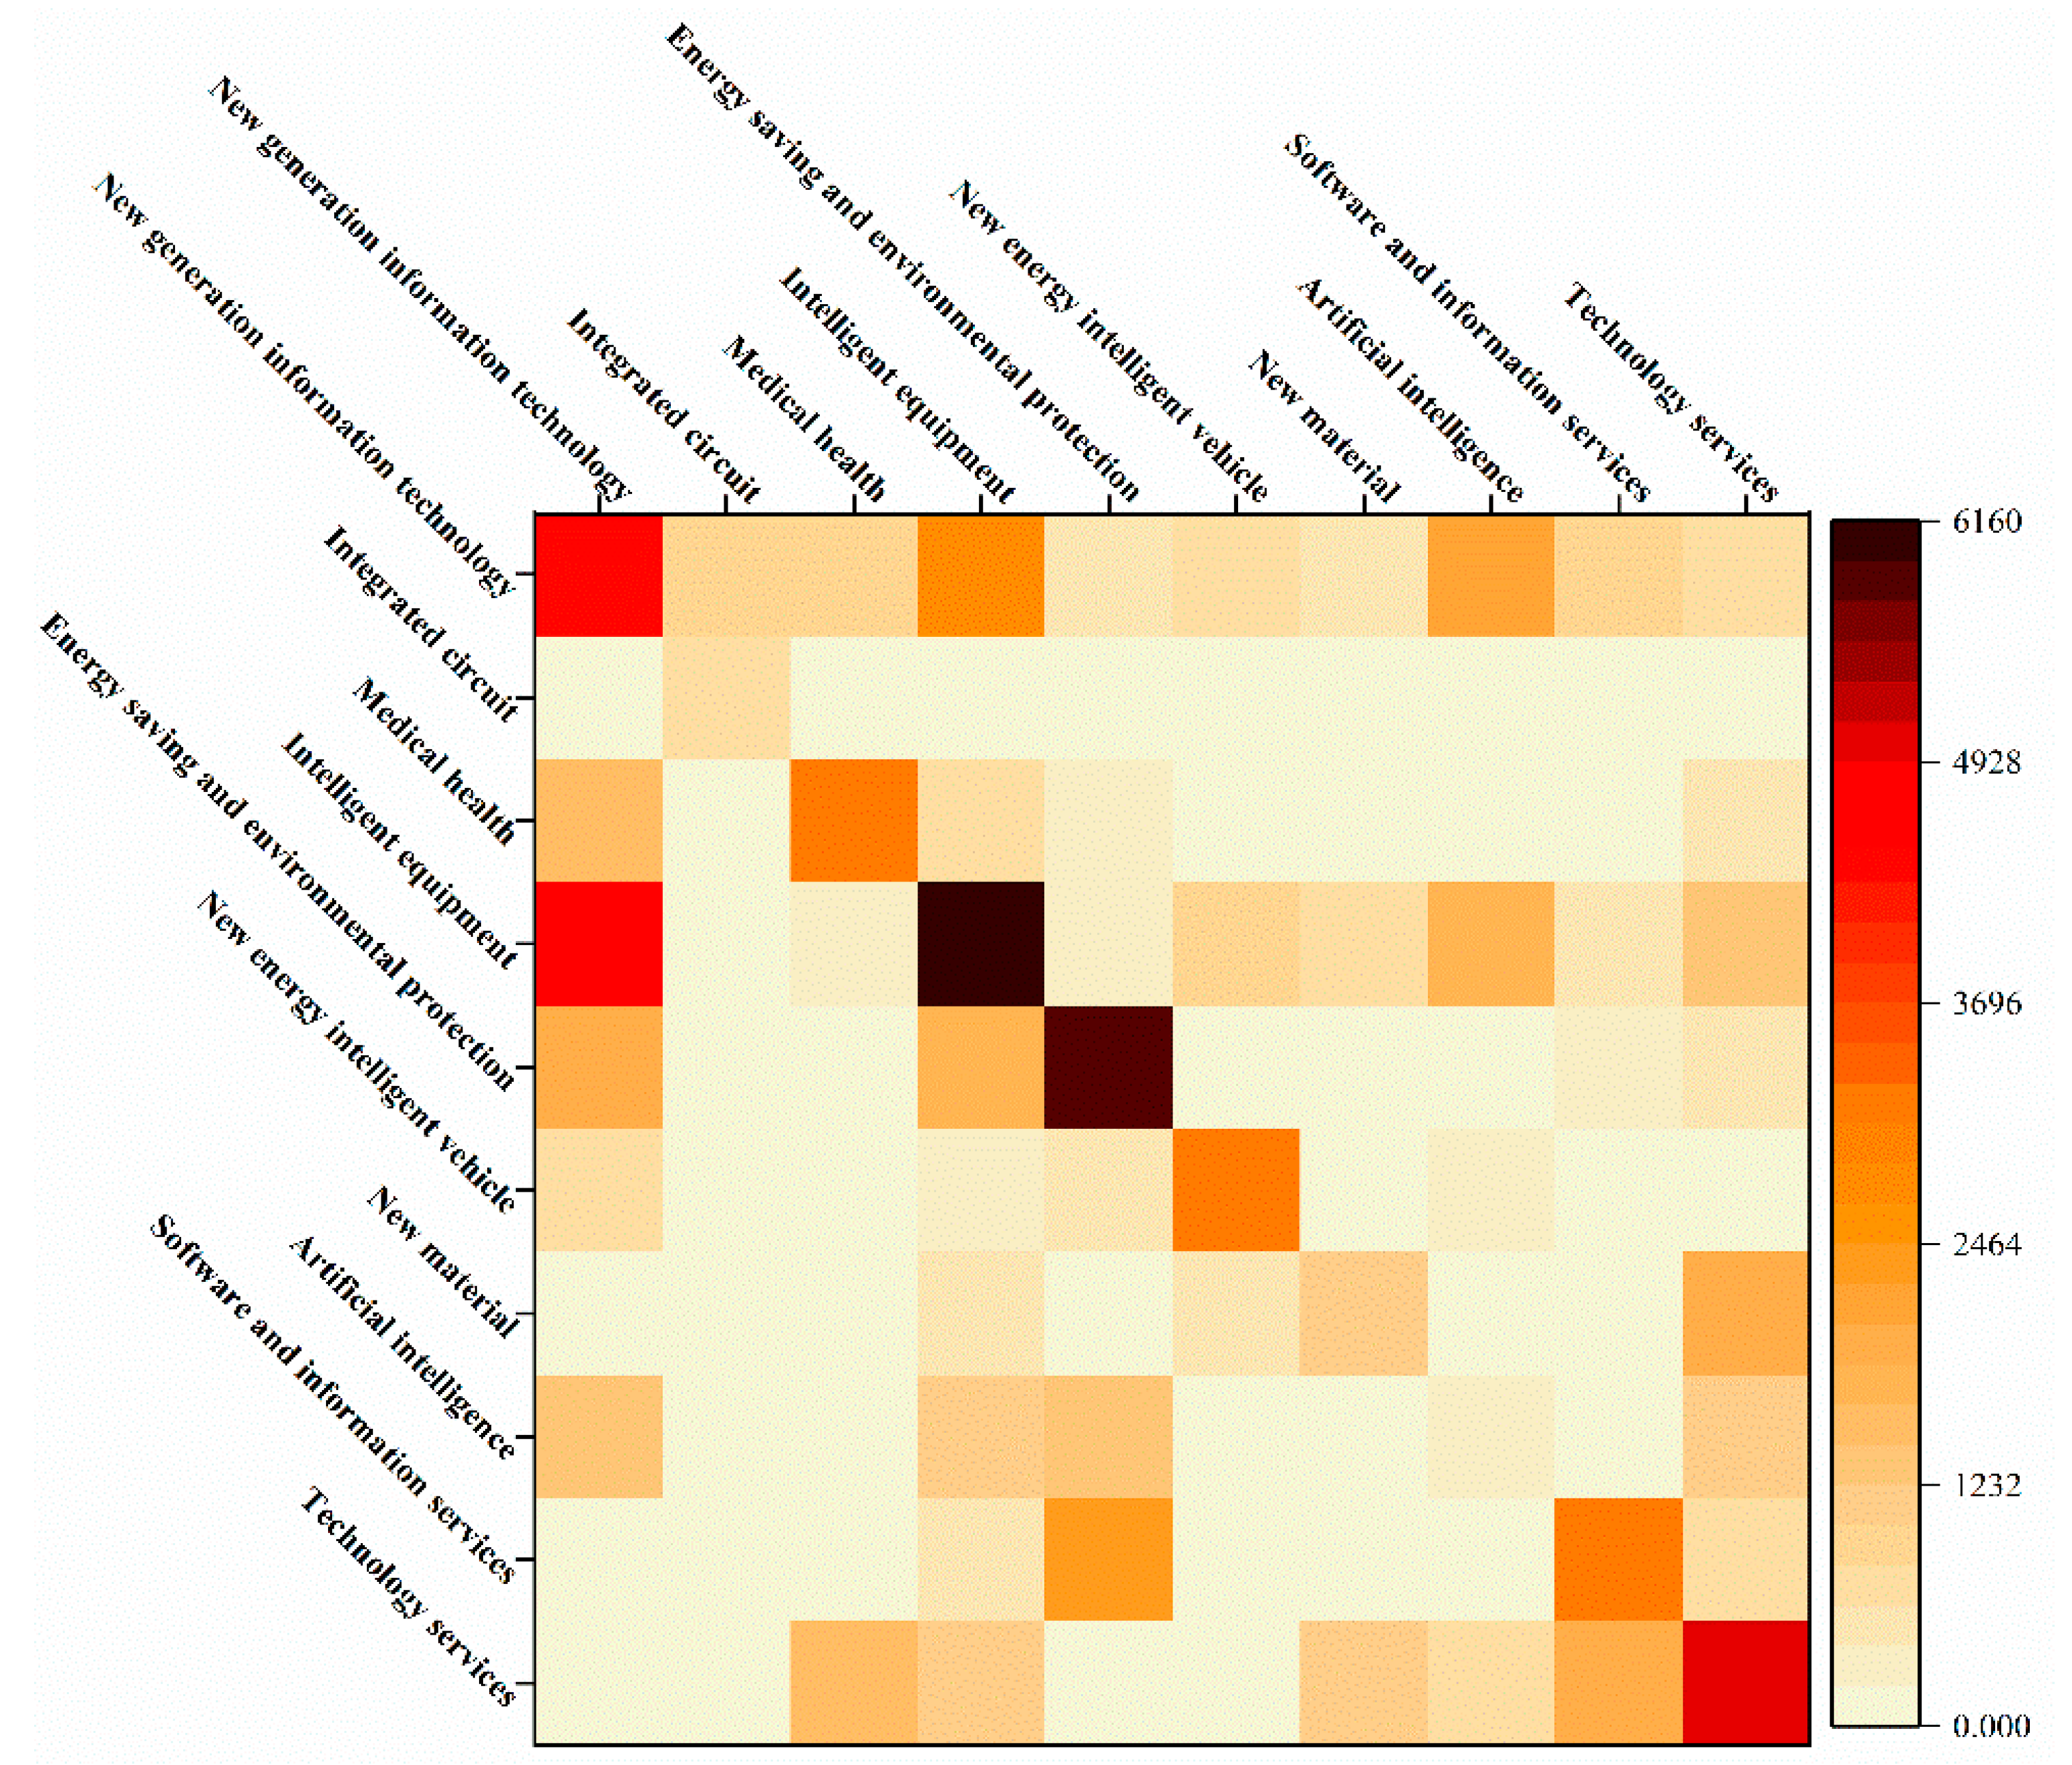
5.2. Network Analysis by Industries
6. Empirical Study: The Positioning and Role of Science and Technological Service Industry
6.1. Research Related to the Function and Status of the S&T Service Industry
6.2. Analysis of the Status of the S&T Service Industry in Beijing
6.3. Functional Analysis of Beijing’s S&T Service Industry
7. Conclusions
- (1)
- To address the bottlenecks in the development of the S&T service industry, it is necessary to dedicate more support from the government side by ensuring consistent government-sponsored programs, avoiding information isolation, beggar-thy-neighbor, and internal competition for profits, and improving the efficiency of industrial resource use. More policy support should be given to S&T financing and business incubation. The comprehensive financial service platform for small and medium-sized enterprises should be better utilized, to establish an online-and-offline financing system with governmental support. The S&T financial institutions shall serve the development of high-tech industries, and broaden the financing channels for “specialized and new” enterprises.
- (2)
- The dynamic audit system should be built for S&T service entities, with well-developed and detailed evaluation criteria and standardized industrial definitions. Sub-industries that cannot deliver high-quality service and high-level specialization and socialization should be removed from the directory of high-tech industries and deprived of preferential treatment. Instead, those who have played a key role in promoting the innovative development of high-tech industries should be promptly added to the directory and given a certain degree of policy support.
- (3)
- Efficient platforms should be built to promote in-depth cooperation between relevant enterprises and industrial technology alliances, industry associations, research institutions, and higher education institutions in the fields of technology research and development, knowledge transfer, and market application. A cooperation mechanism featuring synergistic development, complementary advantages, resource pooling, and risk sharing should be established between industry and academia, thus forming a symbiotic value chain of market demand, research and development, production, sales, and services.
- (4)
- The serviceability of S&T service institutions shall be improved. As a large proportion of S&T service institutions in Beijing used to have a state-owned background, they usually lack innovation vitality and revenue-generating capacity. Beijing should therefore further promote the transformation and upgrading of these entities and enhance the incentive mechanism. Based on the total workload, performance, and market price factors, a dynamic remuneration adjustment mechanism should be established. While raising the basic salary level, special focus should also be placed on incentive bonuses to highlight “actual contribution” and guarantee the competitiveness of revenue in this industry. In this way, the innovation motivation and profitability of S&T service entities can be uplifted.
Supplementary Materials
Author Contributions
Funding
Institutional Review Board Statement
Informed Consent Statement
Data Availability Statement
Conflicts of Interest
References
- Yang, L.; Liu, D.H. Research on Influence of Science and Technology Service Industry Agglomeration on Industrial Upgrading. Sci. Technol. Manag. Res. 2021, 41, 169–176. [Google Scholar] [CrossRef]
- Wang, Z.Y.; Feng, H. The development of Science and Technology Service Industry on China’s Economic Growth. Macroeconomics 2020, 6, 102–113+121. [Google Scholar] [CrossRef]
- Corrocher, N.; Cusmano, L.; Morrison, A. Modes of innovation in knowledge-intensive business services evidence from Lombardy. J. Evol. Econ. 2009, 19, 173–196. [Google Scholar] [CrossRef]
- Chichkanov, N. Patterns of Knowledge-Intensive Business Services Use Across Europe. Foresight STI Gov. 2022, 16, 22–23. [Google Scholar] [CrossRef]
- Giacinto, D.V.; Micucci, G.; Tosoni, A. The agglomeration of knowledge-intensive business services firms. Ann. Reg. Sci. 2020, 65, 557–590. [Google Scholar] [CrossRef]
- D’Antone, S.; Santos, J.B. When purchasing professional services supports innovation. Ind. Mark. Manag. 2016, 58, 172–186. [Google Scholar] [CrossRef]
- Rubin, T.H.; Aas, T.H.; Stead, A. Knowledge flow in Technological Business Incubators: Evidence from Australia and Israel. Technovation 2015, 41, 11–24. [Google Scholar] [CrossRef]
- Pina, K.; Tether, B.S. Towards understanding variety in knowledge intensive business services by distinguishing their knowledge bases. Res. Policy 2016, 45, 401–413. [Google Scholar] [CrossRef]
- Wang, H.Q.; Li, Y.Y.; Wang, S.S. Research on the characteristics and locational factors of the agglomeration structure of science and technology service industry. Sci. Res. Manag. 2022, 43, 24–32. [Google Scholar] [CrossRef]
- Wu, Q.; Jiang, F.X. Influence of Agglomeration of Science and Technology Services on Regional Innovation Efficiency in the View of Innovation Value Chain. Forum Sci. Technol. China 2020, 5, 128–137. [Google Scholar] [CrossRef]
- Wei, W. Coupling Coordination Relationship Between Science and Technology Service Industry and High-tech Industry in Hunan Province. Sci. Technol. Manag. Res. 2022, 42, 68–72. [Google Scholar] [CrossRef]
- Huang, X.Q.; Xu, F. Innovative Effect of Co-agglomeration of S&T Service Industry and High-Tech Industries: Theoretical Analysis and Empirical Test. Forum Sci. Technol. China 2021, 3, 93–102. [Google Scholar] [CrossRef]
- Li, X.L.; Ran, G.H.; Zheng, W. Spatial Agglomeration of Science and Technology Services and Improvement of Enterprise Innovation Efficiency-Empirical Evidence from High-tech Industries in China. RD Manag. 2017, 29, 1–10. [Google Scholar] [CrossRef]
- Zhou, K.; Wu, M.H. Impact of Science and Technology Service Industry on Manufacturing Efficiency: Based on Heterogeneity of Scientific and Technological Innovation Activities. Sci. Technol. Manag. Res. 2020, 40, 131–138. [Google Scholar] [CrossRef]
- Zhang, Y.Y. Analysis of the industrial linkage between China’s science and technology service industry and manufacturing industry. Stat. Decis. 2018, 34, 135–138. [Google Scholar] [CrossRef]
- Lafuente, E.; Vaillant, Y.; Vendrell-Herrero, F. Territorial servitization: Exploring the virtuous circle connecting knowledge-intensive services and new manufacturing businesses. Int. J. Prod. Econ. 2017, 192, 19–28. [Google Scholar] [CrossRef]
- Meng, Q.M.; Mei, Q. Interactive Innovation Mechanism and Countermeasures of Science and Technology Services and Manufacturing Enterprises. Forum Sci. Technol. China 2011, 5, 38–42. [Google Scholar] [CrossRef]
- Li, J.B.; Wang, M.D.; Ren, G.Q. Research on the Development of Science and Technology Service Industry in Beijing: Based on the Perspective of Industrial Synergy and Institutional Resonance. Sci. Technol. Prog. Policy 2011, 28, 51–56. [Google Scholar] [CrossRef]
- Zhang, Q.Z.; Li, G.P. Research on Agglomeration of Science and Technology Service Industry and Its Influencing Factors in China. China Soft Sci. 2015, 7, 75–93. [Google Scholar] [CrossRef]
- Zhou, Z.L.; Zhang, H.; Zheng, J. Spatial and Time Correlation Analysis of Ecological Protection Efficiency and Development Efficiency of Science and Technology Service Industry in the Yangtze River Economic Belt. Sci. Technol. Prog. Policy 2020, 37, 51–58. [Google Scholar] [CrossRef]
- Gong, F.; Chen, B.X. Development of Science and Technology Service Industry Based on Entropy Method and Grey Comprehensive Evaluation Method in Inner Mongolia. Resour. Dev. Mark. 2016, 32, 1034–1037+1063. [Google Scholar] [CrossRef]
- Luo, J.Q.; Zhao, Y.P. Gray Relative Analysis on Relationship between Science & Technology Service Industry and Manufacturing Industry. Technol. Econ. 2012, 31, 43–46. [Google Scholar] [CrossRef]
- Ma, Z.L.; Huang, Y.P. The Spatial Pattern and Influencing Factors of Urban Science and Technology Service Industry: A Case Study of Wuhan Metropolitan Area. South Archit. 2022, 1, 41–47. [Google Scholar] [CrossRef]
- Beijing Municipal People’s Government. Guiding Opinions on Accelerating Science and Technology Innovation and Developing Science and Technology Service Industry in Beijing. Available online: http://www.beijing.gov.cn/fuwu/lqfw/ztzl/kjcxgjj/wj/xlwj/t1502866.htm (accessed on 20 December 2017).
- Fan, H.J. Research on High-Tech Industries in Beijing: History, Present and Evaluation; Capital University of Economics and Business Publishing House: Beijing, China, 2021. [Google Scholar]
- Xing, L.Z.; Han, Y. Extracting the Backbone of Global Value Chain from High-Dimensional Inter-Country Input-Output Network. Stud. Comput. Intell. 2021, 944, 559–570. [Google Scholar] [CrossRef]
- Freeman, L.C. Centrality in Social Networks Conceptual Clarification. Soc. Netw. 1979, 1, 215–239. [Google Scholar] [CrossRef]
- Xing, L.Z.; Dong, X.L.; Guan, J.; Qiao, X.Y. Betweenness Centrality for Similarity-Weight Network and Its Application to Measuring Industrial Sectors’ Pivotability on the Global Value Chain. Phys. A Stat. Mech. Its Appl. 2019, 516, 19–36. [Google Scholar] [CrossRef]
- Girvan, M.; Newman, M.E.J. Community structure in social and biological networks. Proc. Natl. Acad. Sci. USA 2002, 99, 7821–7826. [Google Scholar] [CrossRef]
- Xing, L.Z.; Han, Y.; Wang, D.W. Measuring economies’ pivotability on the global value chain under the perspective of inter-country input–output network. Mod. Phys. Lett. B 2021, 35, 2150289. [Google Scholar] [CrossRef]
- State Council of the People’s Republic of China. Several Opinions on Accelerating the Development of Science and Technology Service Industry. Available online: http://www.gov.cn/zhengce/content/2014-10/28/content_9173.htm (accessed on 9 October 2014).
- Yao, Z.Q. Research on the influence of science and technology service industry clustering on industrial upgrading. J. Beijing Univ. Technol. Bus. Soc. Sci. Ed. 2020, 35, 104–114. [Google Scholar] [CrossRef]
- Feng, H.; Wang, Z.Y. An empirical study on the relationship between science and technology service industry and economic growth in China. Soft Sci. 2018, 32, 6–10. [Google Scholar] [CrossRef]
- Wang, Z.Y. Research on the effect of China’s science and technology service industry on promoting technological innovation--Analysis of the intermediary role of science and technology service industry in the process of integrating innovation factors into technological innovation. Price Theory Pract. 2020, 3, 163–166+178. [Google Scholar] [CrossRef]
- Wang, P.; Zheng, J.Y. The impact of science and technology service efficiency on industrial structure transformation and upgrading and its spatial spillover effect. Res. Dev. Manag. 2018, 30, 46–60. [Google Scholar] [CrossRef]
- Li, Z.Z. Measurement of economic driving effect of science and technology service industry. Stat. Decis. Mak. 2022, 38, 135–139. [Google Scholar] [CrossRef]
- Xie, Z.; Bu, W. Science and technology service industry agglomeration, regional innovation capacity and economic growth—The case of Beijing. Beijing Soc. Sci. 2018, 6, 108–118. [Google Scholar] [CrossRef]
- Wang, M.; Xi, M. Does technology service industry agglomeration enhance industrial efficiency? Sci. Res. Manag. 2022, 43, 40–47. [Google Scholar]
- Du, B.G.; Chen, L. Research on the influencing factors and optimization paths of science and technology service industry to contribute to the high-quality development of Chinese economy—A comprehensive analysis based on GRA model and CRITIC weighting method. Sci. Technol. Manag. Res. 2022, 42, 91–98. [Google Scholar] [CrossRef]
- Wang, H.Q.; Wang, M.; Li, Y. Research on the composition and sustainable development of regional science and technology service industry from the perspective of ecological relationship. China Sci. Technol. Forum 2021, 1, 117–126. [Google Scholar] [CrossRef]
- Zu, M.; Zhu, J.T. Suggestions for the development of China’s science and technology service industry in 2035. Forum Sci. Technol. China 2020, 12, 6–8. [Google Scholar] [CrossRef]
- Wang, Y.; Lan, Y.F.; Wang, L. Evaluation of the development level of science and technology service industry in central region based on TOPSIS method. Stat. Decis. Mak. 2019, 35, 53–56. [Google Scholar] [CrossRef]
- Zhang, P.; Liang, Y.Q.; Yang, Y.J. Research on the assessment of the development level of China’s science and technology service industry and regional layout. Sci. Res. 2019, 37, 833–844. [Google Scholar] [CrossRef]
- Wang, H.Q.; Li, Y.Y.; Wang, S.S. Research on structural characteristics and locational factors of science and technology service industry agglomeration—Based on 31 provincial trichotomous industry data. Sci. Res. Manag. 2021, 43, 24. Available online: https://kns.cnki.net/kcms/detail/11.1567.G3.20211021.1712.016.html (accessed on 20 December 2022).
- Xi, G.Q.; Wei, C.; Fu, H. Research on the four-helix collaborative innovation development model for science and technology service industry. Sci. Technol. Manag. Res. 2020, 40, 31–37. [Google Scholar] [CrossRef]


| Indicator | Equation | Description | Meaning |
|---|---|---|---|
| Network density | where is the actual number of directed edges in the network, and is the number of nodes in the network. The value range of is . | The greater the network density, the more connected the network members are to each other. | |
| Global efficiency | where is the shortest path between nodes and . In its calculation, , which works by first computing for all pairs of source-to-sink nodes for , then , etc. | The greater the global efficiency, the greater the ability of the network to disseminate information. | |
| Average distance | The shorter the average distance of the network, the lower the degree of separation between nodes. | ||
| Clustering coefficient | where is the actual number of edges among the adjacent edges of node . If there is only one adjacent node or none of node , . | The larger the clustering coefficient, the higher the degree of node clustering in the network. | |
| In-degree relative central potential | where and are the maximum values of relative degree in two directions. | When , the nodes in the network tend to connect; when , the node connections tend to be disconnected. | |
| Out-degree relative central potential | |||
| Network assortativity | where E is the number of edges in the network, or is the degree of source node or sink node of edge , , as well as and . | If , the network is homogeneous, i.e., high-degree nodes tend to connect with high-degree nodes; if , it indicates that the network is heterogeneous, i.e., high-degree nodes tend to connect with low-degree nodes. |
| Indicator | |||||||
|---|---|---|---|---|---|---|---|
| Value | 0.06 | 0.26 | 2.76 | 0.43 | 0.12 | 0.45 | 0.44 |
| High-Tech Industries | |||||||
|---|---|---|---|---|---|---|---|
| New information technology | 0.26 | 0.38 | 1.66 | 0.74 | 0.35 | 0.57 | 0.55 |
| Integrated circuit | 0.80 | 0.90 | 1.20 | 0.90 | 0.55 | 0.25 | 0.85 |
| Medicine and health | 0.31 | 0.45 | 1.54 | 0.77 | 0.22 | 0.37 | 0.67 |
| Smart equipment | 0.03 | 0.06 | 2.30 | 0.16 | 0.09 | 0.20 | 0.33 |
| Energy conservation and Environmental protection | 0.42 | 0.61 | 1.58 | 0.77 | 0.44 | 0.62 | 0.75 |
| New energy vehicles | 0.59 | 0.69 | 1.27 | 0.90 | 0.10 | 0.51 | 0.81 |
| New materials | 0.25 | 0.35 | 1.48 | 0.55 | 0.29 | 0.37 | 0.58 |
| Artificial intelligence | 0.63 | 0.72 | 1.21 | 0.93 | 0.25 | 0.55 | 0.77 |
| Software and information service | 0.28 | 0.47 | 1.73 | 0.74 | 0.30 | 0.61 | 0.63 |
| Science and technology service | 0.58 | 0.69 | 1.33 | 0.92 | 0.18 | 0.51 | 0.81 |
| Rank | Industry | Sub-Industry | Name of Service | |
|---|---|---|---|---|
| 1 | New information technology | IoT and its application | IoT tech support | 5405 |
| 2 | New information technology | Data processing and storage | Internet data services | 3311 |
| 3 | Science and technology service | Research and development (R&D) | Engineering and technology R&D | 2845 |
| 4 | AI | AI applications | Application development | 2799 |
| 5 | Medicine and health | Biologicals manufacturing | Biological pharmacy | 2601 |
| 6 | Science and technology service | S&T consultancy | S&T agency | 2506 |
| 7 | Software and information service | Information system integration | Information system integration | 2412 |
| 8 | Energy conservation and environmental protection | Environmental protection equipment | Environmental protection equipment manufacturing | 2354 |
| 9 | Science and technology service | Quality control technology | Inspection service | 2149 |
| 10 | Energy conservation and environmental protection | Environmental sanitation | Environmental sanitation | 2098 |
| Rank | Industry | Sub-Industry | Name of Service | |
|---|---|---|---|---|
| 3 | Science and technology service | R&D | Engineering and technology R&D | 2845 |
| 6 | Science and technology service | S&T consultancy | S&T agency | 2506 |
| 9 | Science and technology service | quality control technology | Quality inspection | 2149 |
| 14 | Science and technology service | R&D | Natural science R&D | 1678 |
| 15 | Science and technology service | Intellectual property (IP) services | IP services | 1478 |
| 24 | Science and technology service | Engineering management | Engineering management | 1126 |
| 60 | Science and technology service | Startup workspace | Startup workspace | 467 |
| 89 | Science and technology service | R&D | Medical sciences R&D | 339 |
| 94 | Science and technology service | Specialized design | Specialized design | 337 |
| 101 | Science and technology service | Engineering investigation and design | Engineering investigation and design | 332 |
| 133 | Science and technology service | R&D | Agricultural sciences R&D | 329 |
| 134 | Science and technology service | Specialized design | Industrial design | 329 |
| Rank | Upstream Industry | Downstream Industry | |
|---|---|---|---|
| 1 | Quality control technology | Biologicals manufacturing | 1585 |
| 2 | Information system integration | Environmental sanitation | 1246 |
| 3 | IoT and application | Rail transportation | 1011 |
| 4 | S&T consultancy | Quality control technology | 905 |
| 5 | Data processing and storage | AI application | 879 |
| 6 | Intellectual property | Rail transportation | 868 |
| 7 | Environmental protection equipment | IoT and its application | 832 |
| 8 | Biologicals manufacturing | Data processing and storage | 751 |
| 9 | Environmental protection equipment | High-end energy equipment | 739 |
| 10 | R&D | Information system integration | 719 |
| Rank | Upstream Industry | Downstream Industry | |
|---|---|---|---|
| 1 | Quality control technology | Biologicals manufacturing | 1585 |
| 4 | S&T consultancy | Quality control technology | 905 |
| 6 | Intellectual property services | Rail transportation | 868 |
| 10 | Engineering and technology R&D | Information system integration | 719 |
| 12 | Engineering and technology R&D | S&T consultancy | 669 |
| 20 | S&T consultancy | Online public service platform | 404 |
| 31 | Engineering and technology R&D | AI application | 343 |
| 39 | Engineering management | S&T consultancy | 321 |
| 41 | Engineering and technology R&D | Polymeric optical, electrical, and magnetic materials | 315 |
| 46 | Natural sciences R&D | Polymeric optical, electrical, and magnetic materials | 306 |
| 47 | Intellectual property services | S&T consultancy | 306 |
| 50 | Natural Sciences R&D | Quality control technology | 286 |
| Rank | Upstream Industry | Downstream Industry | |
|---|---|---|---|
| 4 | S&T consultancy | Quality control technology | 905 |
| 12 | Engineering and technology R&D | S&T consultancy | 669 |
| 15 | AI system | Natural sciences R&D | 569 |
| 39 | Engineering management | S&T consultancy | 321 |
| 47 | IP services | S&T consultancy | 306 |
| 50 | Natural sciences R&D | Quality control technology | 286 |
Disclaimer/Publisher’s Note: The statements, opinions and data contained in all publications are solely those of the individual author(s) and contributor(s) and not of MDPI and/or the editor(s). MDPI and/or the editor(s) disclaim responsibility for any injury to people or property resulting from any ideas, methods, instructions or products referred to in the content. |
© 2023 by the authors. Licensee MDPI, Basel, Switzerland. This article is an open access article distributed under the terms and conditions of the Creative Commons Attribution (CC BY) license (https://creativecommons.org/licenses/by/4.0/).
Share and Cite
Yang, L.; Wang, D.; Ji, Y.; Xing, L. On the Internal Synergistic Mechanism of Operating System of Beijing’s High-Technology Industry Chain: Evidence from Science and Technology Service Industry. Sustainability 2023, 15, 1904. https://doi.org/10.3390/su15031904
Yang L, Wang D, Ji Y, Xing L. On the Internal Synergistic Mechanism of Operating System of Beijing’s High-Technology Industry Chain: Evidence from Science and Technology Service Industry. Sustainability. 2023; 15(3):1904. https://doi.org/10.3390/su15031904
Chicago/Turabian StyleYang, Li, Dawei Wang, Yuanpeng Ji, and Lizhi Xing. 2023. "On the Internal Synergistic Mechanism of Operating System of Beijing’s High-Technology Industry Chain: Evidence from Science and Technology Service Industry" Sustainability 15, no. 3: 1904. https://doi.org/10.3390/su15031904
APA StyleYang, L., Wang, D., Ji, Y., & Xing, L. (2023). On the Internal Synergistic Mechanism of Operating System of Beijing’s High-Technology Industry Chain: Evidence from Science and Technology Service Industry. Sustainability, 15(3), 1904. https://doi.org/10.3390/su15031904