Abstract
Microbial fuel cells convert the chemical energy conserved in organic matter in wastewater directly to electrical energy through living microorganisms. These devices are environmentally friendly thanks to their ability to simultaneously produce electrical energy and wastewater treatment. The output power of the yeast microbial fuel cell (YMFC) depends mainly on glucose concentration and glucose/yeast ratio. Thus, the paper aims to boost the power of YMFC by identifying the best values of glucose concentration and glucose/yeast ratio. The suggested approach comprises fuzzy modelling and optimization. Fuzzy is used to build the model based on the measured data. In the optimization stage, the marine predators’ algorithm (MPA) is applied to identify the best glucose concentration values and glucose/yeast ratio corresponding to the maximum output power of YMFC. The results revealed the superiority of the combination of fuzzy and MPA compared with the response surface methodology (RSM) approach. Regarding the modelling accuracy, the coefficient of determination increased by 13.32% and 8.37%, respectively, for without methylene blue and with methylene blue compared with RSM. The integration between fuzzy and MPA succeeded in maximizing the output power from YMFC. Without MB, the power density increased by 25% and 29.3%, respectively, compared with measured data and RSM. In addition, with MB, the power density increased by 22.4% and 26%, compared with measured data and RSM.
1. Introduction
Global warming and climate change have triggered a serious need for alternatives to fossil fuels that are heavily used as primary energy sources. Such fossil fuels produce a large amount of greenhouse gases, are limited in resources, and have fluctuating prices. Several methods have been considered for eliminating or minimizing the reliance on fossil fuels, such as ameliorating the effects of the current energy systems by waste heat recovery [1], using renewable energy resources with low or no environmental impacts [2,3,4], and using novel energy conversion devices that can be fueled using renewable energy which have low or no environmental impact. Fuel cells (FCs) are energy conversion devices demonstrating high potential for several applications [5]. FCs are small in size and have little or no environmental impacts [6].
Furthermore, FCs can be fueled with biomass content from wastewater, such as the case of direct urea FCs (UFCs) [1,7] and microbial FCs (MFCs) [8,9,10]. MFCs convert chemical energy conserved in organic matter, including wastes, directly to electricity through living microorganisms (biocatalysts). These devices are environmentally friendly systems due to their ability to generate electricity and waste removal simultaneously [11,12]. Generally, MFCs consist of a bioanode and cathode separated by a membrane, whereas some are membrane-less MFC. Several parameters affect their performance, including biocatalyst type and concentration, anode or cathode material, configuration, substrate type and concentration, and membrane type (anion or cation) [10]. The substrate (fuel) is commonly oxidized by living microorganisms generating protons and electrons that transfer via respiratory enzymes inside the microorganism cell and then to the anode through the outer membrane cytochrome or transmembrane proteins (tPMETs). The generated electrons and protons travel to the cathode through the external circuit and electrolyte membrane, respectively. The electrons and protons are combined with oxygen from the air to form water.
While MFCs demonstrate favorable characteristics such as waste elimination, operating at mild conditions, an enormous range of substrates, and a sustainable, self-generated, and cheap catalyst, low power generation is still the main challenge.
Typically, the biocatalyst used in MFCs is a simple microorganism (prokaryotes) or complex microorganism (eukaryotes). Many yeast strains were used as biocatalysts in MFCs, such as Hansenula polymorpha [13], Candida melibiosica [14], Saccharomyces cerevisiae [15], Kluyveromyces marxianus [16], Arxula adeninivorans [17] and Hansenula anomala [18].
Among different strains, Saccharomyces cerevisiae is non-pathogenic and inexpensive variety of substrates, with fast and simple cultivation, which are widely used in different applications, and maintained in dried form [19,20]. Thus, they are scrutinized as biocatalysts in small and large-scale MFCs [16,21]. Saccharomyces cerevisiae has directly transferred the electrons to the anode surface via the tPMETs [22]. The anode type and structure considerably affect the electron transfer rate, hence the power generation [23]. The electron transfer rate from the yeast cell to the anode surface was enhanced by using external mediators such as Methylene blue or yeast extract [24,25]. Moreover, modifying the anode surface with metal nanolayer (cobalt, iron, titanium dioxide) [26], graphene [27,28,29], graphitic carbon nitride [30], or yeast immobilization [31] promoted the electron transfer rates and thus the MFC performance. Electron shuttles (mediators) are usually externally added to the anode chamber of MFC to enhance the rate of electron transfer from the biocatalyst to the anode. Various mediators such as methyl red, methyl orange, 2-methyl-1,4-naphthoquinone, and methylene blue were used as external mediators in yeast MFC to promote the electron transfer from the interior of the yeast cells to the anode [32,33]. Substrate concentration is an intrinsic factor that directly affects the metabolism and growth of the microorganism, electrons, and protons generated inside the microorganism’s cell, thereby affecting the performance of the MFC. Thus, optimizing the substrate concentration and the substrate to microorganism ratio is essential to achieve MFC’s highest performance. It is of substantial interest to examine the interlinkage between the yeast cells (biocatalyst) and the substrate (glucose) in the existence and absence of an external mediator. Consequently, the yeast, Saccharomyces cerevisiae, can be better utilized as a biocatalyst in MFC, achieving a high power output.
The optimal parameter estimation of YMFC is still a challenge; therefore, in this study, the combination of fuzzy and the marine predators’ algorithm (MPA) is suggested to identify the values of glucose concentration and glucose/yeast ratio in order to maximize the power density (MPD) of the YMFC. At first, based on the measured dataset, a fuzzy model is created to simulate the performance of YMFC. Then, MPA was used to conduct the parameter identification process of YMFC. The contribution of the work can be summarized as follows.
- An accurate fuzzy model of yeast-MFC is created;
- A new application of the marine predators’ algorithm is proposed to determine the optimal values of glucose concentration and glucose/yeast ratio;
- The power density of the yeast-MFC is maximized;
- The superiority of the integration between MPA and fuzzy is demonstrated.
2. Experimental Data
The experiential set up used for obtaining the dataset used in the current study is composed of an air cathode MFC. Carbon felt “CF, Toyobo Co., Osaka, Japan” was used for both anode and cathode of the fuel cell. The CF was treated with PEI “polyethylenimine” and used as the anode, while untreated CF was used as the cathode. Both electrodes have a surface area of 7 cm2. The electrolyte membrane is Nafion 117 of 175 mm thickness. A full detail of the experimental set up is available in [34]. The anodic medium (140 mL, pH 7.4) consisted of 5 g/L yeast extract, 2.5 g/L peptone, glucose as fuel, and dried yeast “Saccharomyces cerevisiae” as a biocatalyst in 0.1 M phosphate buffer solution. A hot magnetic stirrer was used to maintain the anolyte homogeneity at 25–27 °C. Different glucose concentrations of 5, 10, or 15 g/L were used to obtain glucose/yeast (G/Y) ratios of 1, 5, or 10 (w/w) for every glucose concentration with or without methylene blue (MB) of 0.1 mM. The effect of different G/Y ratios on open circuit voltage (OCV) and power generation was studied to identify the best G/Y ratio. The G/Y ratio is essential to adjust yeast growth and metabolism, achieving the highest power and current generation. Moreover, the effect of adding an external mediator (MB) was studied. The polarization curve was conducted in all runs after steady OCV (72 h) from OCV to 0 V at 10 mV/s. More details about the methodology are available in [34]. The data set used in this study is shown in Table 1.

Table 1.
The effect of the glucose concentration and the glucose/yeast ratio on the power output and OCV with and without MB [34], reproduced with permission No. 5470300382719.
3. Proposed Methodology
The methodology includes two stages in the current research work: fuzzy-based modelling and parameter identification. As presented in Figure 1, based on the measured dataset, the fuzzy model is created to simulate the performance of YMFC. Next, by applying MPA, the optimal glucose concentration and glucose/yeast ratio values are estimated to boost the maximum output power of YMFC.
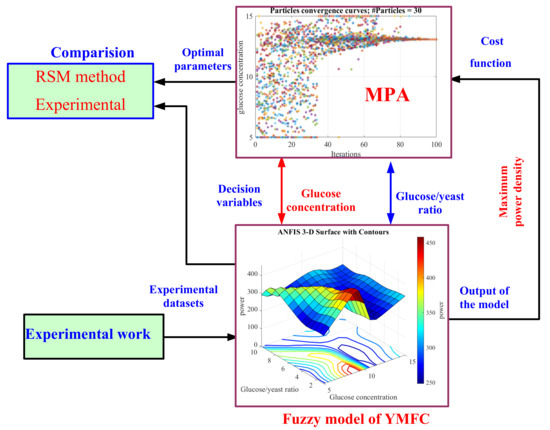
Figure 1.
Proposed solution strategy.
3.1. Fuzzy Based Model of YMFC
The mathematical model manipulates variables. In a traditional model, the values of the considered variable are drawn from a set of numbers known as a universe. Variables in fuzzy models, on the other hand, may represent fuzzy subsets of the universe. As a result, the fuzzy model necessitates the division of the universe into sections, which need not be precisely formed and can overlap. The main functional modules of the fuzzy model are the input interface, the processing module, and the output interface [35,36]. The heterogeneous data will be accepted and converted to internal format at the input interface. The processing module will handle processing related to information granules. Finally, the output interface will convert the results of processing information granules into a format acceptable to the modeling environment [37,38]. Fuzzy used the Sugeno form fuzzy rule as it is easier to formulate the process’s mathematical implementation. There are several MF forms and defuzzification methods, but the Gaussian shape and weight average are the best nominated. The relations between the inputs and outputs are modelled for the fuzzy model using the IF-THEN rule. The following relation can present an example of the fuzzy rule:
IF m is M and n is N THEN z = f(m, n)
Where, m and n are the inputs and z is the output; M and N are the MFs of m and N, respectively;
The fuzzy rule demonstrate that the output z is a function of the inputs m and n.
The output f can be estimated using the two rules’ outputs, f1 and f2 as follows:
- (output Layer)
- Evaluating (defuzzification Layer)
- (N Layer)
- (π Layer)
- are the MF values of the two inputs (fuzzification Layer)
3.2. Parameter Identification-Based MPA
The target of this stage is determining the best values of glucose concentration and glucose/yeast ratio values to boost the output power density of the YMFC using MPA. The core idea of MPA algorithm is extracted from foraging movement’s approach of predators in the ocean based on the “survival of the fittest” theory. The biological interaction between the prey and the predator in an ecosystem typically follows a random walk approach. The mathematical representation of stochastic procedure can be created using Brownian and Lévy motions as follows:
where, Pi is the ith solution (pray); xmin and xmax are the lower and upper limits. FADs is the probability effect; u is a random value [0, 1]; r is a random generator in the range [0 1]; Pr1 and Pr2 denote two solutions chosen arbitrarily. The detail of mathematical representation of MPA can be found in [39].
Once the fuzzy model is created, the MPA is applied to perform the parameter identification process of YMFC. During the optimization process, the glucose concentration and glucose/yeast ratio were considered as the decision variables where the output power of YMFC is the objective function that required to be maximum. The optimization problem can be stated as:
where, f(X) is the fuzzy model’s output; X = [x1, x2] are the input parameters, which varied in the ranges x1∈ [5, 15] and x2∈ [1, 10].
4. Results and Discussion
4.1. Modelling Phase
Using a measured dataset, in this paper, a fuzzy-based model was designed for simulating the output power of YMFC with and without methylene blue. The data points are distributed into 70% (training) and 30% (testing). For the fuzzy-based model, the rule-base list is constructed applying the ‘subtractive clustering’ approach. The fuzzy model ends up with six rules for both models, as presented in Figure 2. The modelling process has been performed based on the nine data points and trained for ten epochs. The accuracy of the fuzzy-based model is evaluated using MSE, RMSE and R2. The statistical assessment of the fuzzy model is presented in Table 2.
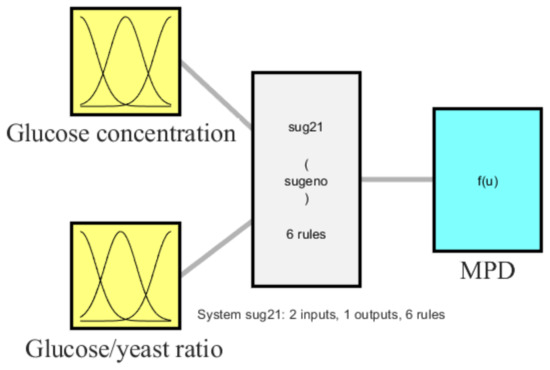
Figure 2.
Fuzzy model configuration.
Table 2.
Statistical evaluation of the fuzzy-based models.
Table 1 shows fuzzy modelling RMSE values of 4.4465 and 5.4206 for without and with MB, respectively. While using RSM [34], the RMSE values are 34.18 and 32.65 for without and with MB. This means the fuzzy modelling method sharply decreased the RMSE values by 87% and 83.4%, respectively, for without and with MB compared with RSM. Regarding the coefficient of determination values, for the model of YMFC without MB, fuzzy lifted the coefficient of determination from 0.86 to 0.9746 compared with ANOVA (lifted by 13.32). Additionally, for the model of YMFC without MB, the coefficient of determination was lifted from 0.89 to 0.9645 with a percentage of 8.37%. This emphasizes the model’s accuracy in tracking data trends. Figure 3 depicts a comparison of the fuzzy model and the measured data. The fuzzy model is compared to the measured data, which indicates the model’s consistency. A critical approach is to investigate the modeling accuracy to ensure the performance of the constructed model for any different data. The constructed model’s prediction is plotted against the dataset in both the training and testing stages to assess prediction accuracy. The plot (Figure 3b,d) demonstrates that the constructed model predictions are dispersed closely over the one hundred percent precision. The fuzzy MFs of inputs are demonstrated in Figure 4. While Figure 5 displays the three-dimensional fuzzy surface of YMFC without MB and with MB, respectively.
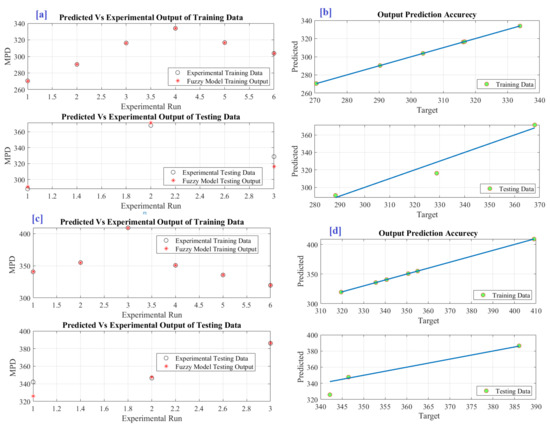
Figure 3.
Fuzzy model prediction accuracy (a) predicted vs. measured dataset without MB (b) prediction accuracy without MB, (c) predicted vs. experimental with MB and (d) prediction accuracy with MB.
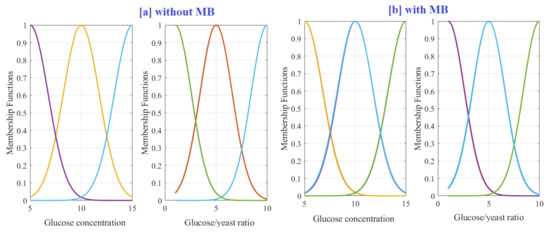
Figure 4.
The fuzzy model inputs’ MFs.
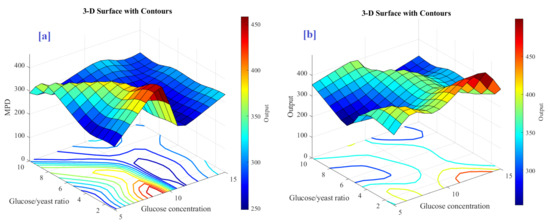
Figure 5.
Three-dimension surface for the fuzzy model (a) without MB and (b) with MB.
Figure 5 showed the three-dimension surface of the fuzzy model of the influence glucose concentration and glucose/yeast ratios on MPD of air cathode MFC with and without MB. The MPD increased by increasing the glucose concentration until a certain concentration (9.13 mg/mL), then MPD decreased with further increase. As the available amount of glucose is enough for the growth (reproduction) of all the available yeast cells, the further increase in the glucose will not affect the MPD. However, at higher glucose concentrations, the performance could be decreased due to the decrease in the anolyte conductivity by glucose (nonconductive) [34]. Furthermore, the increasing amount of glucose in the anode chamber could inhibit the yeast growth and rebate the yeast metabolism and thus the power output [40]. The effect of glucose concentration and glucose/yeast ratio significantly appears in the case of mediator-less MFC. The electron transfer occurs directly through the yeast cells attached to the anode, and the suspended yeast cells in the anolyte have no role in power generation [21,34].
4.2. Optimization Results
The main purpose of this section is to determine the best values of the glucose concentration and glucose/yeast ratio to maximize the output power of YMFC. The decision variables’ upper and lower boundaries are set to [15,10] and [5,1]. These figures are derived from measured data. The number of particle swarms, iterations, and runs are set to 20, 100, and 30, respectively. Table 3 displays the optimal values and associated outputs achieved by MPA, measured data, and RSM [34].
Table 3.
Optimum parameters applying different methods.
The integration between fuzzy and MPA improved the performance of YMFC in comparison with measure data and RSM. Without MB, the power density increased by 25% and 29.3%, respectively, compared with measured data and RSM. Additionally, with MB, the power density increased by 22.4% and 26%, respectively, compared with measured data and RSM. The optimization results cannot be reliable unless the number of trials has been done. Therefore, the MPA code was implemented 30 times. The maximum objective function found so far over all 30 runs during the optimization process is presented in Figure 6a,b, respectively for without MB and with MB. The detailed variation in the decision variable is also presented in Figure 7a–d, respectively, for glucose concentration without MB, glucose/yeast ratio without MB, glucose concentration with MB and glucose/yeast ratio with MB. Without MB, the glucose concentration and glucose/yeast ratio are 9.13 mg/mL and 1.0, respectively. Under this condition, the MPD is 460.2 mW/m2. Whereas with MB, the glucose concentration and glucose/yeast ratio are 13.06 mg/mL and 1.0, respectively. Under this condition, the MPD is 500.56 mW/m2.
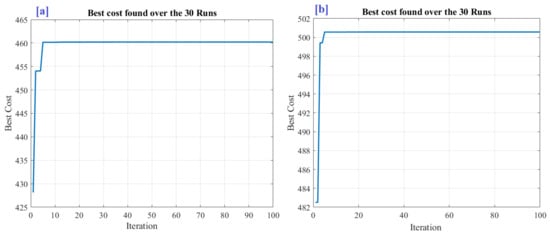
Figure 6.
Change in the objective function throughout the optimization procedure. (a) Without methylene blue and (b) with methylene blue.
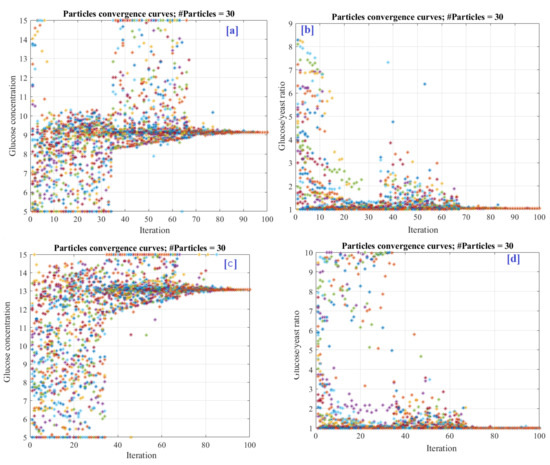
Figure 7.
Decision variable variation during the optimization process (a) glucose concentration without MB, (b) glucose/yeast ratio without MB, (c) glucose concentration with MB and (d) glucose/yeast ratio with MB.
5. Conclusions
The primary goal of this paper is to improve the performance of the yeast microbial fuel cell (YMFC) by determining the optimal glucose concentration and glucose/yeast ratio. The proposed methodology combines fuzzy modeling and the algorithm for marine predators (MPA). When using fuzzy modeling, the RMSE values without methylene blue (MB) and with methylene blue (MB) are reduced by 87% and 83.4%, respectively, compared with RSM. Additionally, the coefficient of determination values increased by 13.32% and 8.37%, respectively, for without methylene blue and with methylene blue compared with RSM. The integration between fuzzy and MPA succeeded in maximizing the output power from YMFC. Without MB, the power density increased by 25% and 29.3%, respectively, compared with measured data and RSM. Additionally, with MB, the power density increased by 22.4% and 26%, respectively, compared with measured data and RSM. Although the effectiveness of the proposed methodology in modelling and optimizing the performance of YMFC with and without MB, other variables should be investigated as they can significantly affect the performance of the cell, such as operating temperature and the pH of the anolyte solution.
Author Contributions
Conceptualization, H.R. and E.T.S.; methodology H.R., M.A.A., H.M.M. and E.T.S.; formal analysis, A.G.O., M.A.A. and H.M.M.; investigation, A.G.O. and M.A.A.; resources, A.G.O. and M.A.A.; data curation, H.M.M. and E.T.S.; writing—original draft preparation, H.R., A.G.O., M.A.A., H.M.M. and E.T.S.; writing—review and editing, H.R., A.G.O., M.A.A., H.M.M. and E.T.S.; supervision, A.G.O. and M.A.A.; project administration, H.R. and A.G.O. All authors have read and agreed to the published version of the manuscript.
Funding
This research was funded by the Deputyship for Research & Innovation, Ministry of Education in Saudi Arabia under grant number (IF2/PSAU/2022/01/20906).
Institutional Review Board Statement
Not applicable.
Informed Consent Statement
Not applicable.
Data Availability Statement
Not applicable.
Acknowledgments
The authors extend their appreciation to the Deputyship for Research & Innovation, Ministry of Education in Saudi Arabia for funding this research work through the project number (IF2/PSAU/2022/01/20906).
Conflicts of Interest
The authors declare no conflict of interest.
References
- Sayed, E.T.; Abdelkareem, M.A.; Bahaa, A.; Eisa, T.; Alawadhi, H.; Al-Asheh, S.; Chae, K.-J.; Olabi, A.G. Synthesis and performance evaluation of various metal chalcogenides as active anodes for direct urea fuel cells. Renew. Sustain. Energy Rev. 2021, 150, 111470. [Google Scholar] [CrossRef]
- Rabaia, M.K.H.; Abdelkareem, M.A.; Sayed, E.T.; Elsaid, K.; Chae, K.-J.; Wilberforce, T.; Olabi, A.G. Environmental impacts of solar energy systems: A review. Sci. Total Environ. 2021, 754, 141989. [Google Scholar] [CrossRef]
- Sayed, E.T.; Wilberforce, T.; Elsaid, K.; Rabaia, M.K.H.; Abdelkareem, M.A.; Chae, K.-J.; Olabi, A.G. A critical review on environmental impacts of renewable energy systems and mitigation strategies: Wind, hydro, biomass and geothermal. Sci. Total Environ. 2021, 766, 144505. [Google Scholar] [CrossRef] [PubMed]
- Rahman, M.M.; Sultana, N.; Velayutham, E. Renewable energy, energy intensity and carbon reduction: Experience of large emerging economies. Renew. Energy 2022, 184, 252–265. [Google Scholar] [CrossRef]
- Hou, J.; Yang, M.; Zhang, J. Active and passive fuel recirculation for solid oxide and proton exchange membrane fuel cells. Renew. Energy 2020, 155, 1355–1371. [Google Scholar] [CrossRef]
- Abdelkareem, M.A.; Elsaid, K.; Wilberforce, T.; Kamil, M.; Sayed, E.T.; Olabi, A. Environmental aspects of fuel cells: A review. Sci. Total Environ. 2021, 752, 141803. [Google Scholar] [CrossRef]
- Sayed, E.T.; Eisa, T.; Mohamed, H.O.; Abdelkareem, M.A.; Allagui, A.; Alawadhi, H.; Chae, K.-J. Direct urea fuel cells: Challenges and opportunities. J. Power Sources 2019, 417, 159–175. [Google Scholar] [CrossRef]
- Abdallah, M.; Feroz, S.; Alani, S.; Sayed, E.T.; Shanableh, A. Continuous and scalable applications of microbial fuel cells: A critical review. Rev. Environ. Sci. Bio Technol. 2019, 18, 543–578. [Google Scholar] [CrossRef]
- Alnaqbi, H.; Sayed, E.T.; Al-Asheh, S.; Bahaa, A.; Alawadhi, H.; Abdelkareem, M.A. Current progression in graphene-based membranes for low temperature fuel cells. Int. J. Hydrog. Energy, 2022; in press. [Google Scholar] [CrossRef]
- Modestra, J.A.; Reddy, C.N.; Krishna, K.V.; Min, B.; Mohan, S.V. Regulated surface potential impacts bioelectrogenic activity, interfacial electron transfer and microbial dynamics in microbial fuel cell. Renew. Energy 2020, 149, 424–434. [Google Scholar] [CrossRef]
- Wilberforce, T.; Sayed, E.T.; Abdelkareem, M.A.; Elsaid, K.; Olabi, A. Value added products from wastewater using bioelectrochemical systems: Current trends and perspectives. J. Water Process Eng. 2021, 39, 101737. [Google Scholar] [CrossRef]
- Birjandi, N.; Younesi, H.; Ghoreyshi, A.A.; Rahimnejad, M. Enhanced medicinal herbs wastewater treatment in continuous flow bio-electro-Fenton operations along with power generation. Renew. Energy 2020, 155, 1079–1090. [Google Scholar] [CrossRef]
- Shkil, H.; Schulte, A.; Guschin, D.A.; Schuhmann, W. Electron transfer between genetically modified Hansenula polymorpha yeast cells and electrode surfaces via Os-complex modified redox polymers. ChemPhysChem 2011, 12, 806–813. [Google Scholar] [CrossRef]
- Hubenova, Y.; Mitov, M. Potential application of Candida melibiosica in biofuel cells. Bioelectrochemistry 2010, 78, 57–61. [Google Scholar] [CrossRef]
- Christwardana, M.; Joelianingsih, J.; Yoshi, L.A. Performance of yeast microbial fuel cell integrated with sugarcane bagasse fermentation for cod reduction and electricity generation. Bull. Chem. React. Eng. Catal. 2021, 16, 446–458. [Google Scholar] [CrossRef]
- Kaneshiro, H.; Takano, K.; Takada, Y.; Wakisaka, T.; Tachibana, T.; Azuma, M. A milliliter-scale yeast-based fuel cell with high performance. Biochem. Eng. J. 2014, 83, 90–96. [Google Scholar] [CrossRef]
- Haslett, N.D.; Rawson, F.J.; Barriëre, F.; Kunze, G.; Pasco, N.; Gooneratne, R.; Baronian, K.H. Characterisation of yeast microbial fuel cell with the yeast Arxula adeninivorans as the biocatalyst. Biosens. Bioelectron. 2011, 26, 3742–3747. [Google Scholar] [CrossRef]
- Parkash, A. Design and fabrication of a double chamber microbial fuel cell for voltage generation from biowaste. J. Bioprocess. Biotech. 2015, 5, 1. [Google Scholar] [CrossRef]
- Sudhakar, M.P.; Arunkumar, K.; Perumal, K. Pretreatment and process optimization of spent seaweed biomass (SSB) for bioethanol production using yeast (Saccharomyces cerevisiae). Renew. Energy 2020, 153, 456–471. [Google Scholar] [CrossRef]
- Kyriakou, M.; Patsalou, M.; Xiaris, N.; Tsevis, A.; Koutsokeras, L.; Constantinides, G.; Koutinas, M. Enhancing bioproduction and thermotolerance in Saccharomyces cerevisiae via cell immobilization on biochar: Application in a citrus peel waste biorefinery. Renew. Energy 2020, 155, 53–64. [Google Scholar] [CrossRef]
- Sayed, E.T.; Abdelkareem, M.A. Yeast as a biocatalyst in microbial fuel cell. In Old Yeasts-New Questions; InTech: Rijeka, Croatia, 2017; pp. 41–65. [Google Scholar]
- Sayed, E.T.; Tsujiguchi, T.; Nakagawa, N. Catalytic activity of baker’s yeast in a mediatorless microbial fuel cell. Bioelectrochemistry 2012, 86, 97–101. [Google Scholar] [CrossRef] [PubMed]
- Sayed, E.T.; Nakagawa, N. Critical issues in the performance of yeast based microbial fuel cell. J. Chem. Technol. Biotechnol. 2018, 93, 1588–1594. [Google Scholar] [CrossRef]
- Rossi, R.; Fedrigucci, A.; Setti, L. Characterization of electron mediated microbial fuel cell by Saccharomyces cerevisiae. Chem. Eng. Trans. 2015, 43, 337–342. [Google Scholar]
- Permana, D.; Rosdianti, D.; Ishmayana, S.; Rachman, S.D.; Putra, H.E.; Rahayuningwulan, D.; Hariyadi, H.R. Preliminary investigation of electricity production using dual chamber microbial fuel cell (dcMFC) with Saccharomyces cerevisiae as biocatalyst and methylene blue as an electron mediator. Procedia Chem. 2015, 17, 36–43. [Google Scholar] [CrossRef]
- Sayed, E.T.; Alawadhi, H.; Elsaid, K.; Olabi, A.; Adel Almakrani, M.; Bin Tamim, S.T.; Alafranji, G.H.; Abdelkareem, M.A. A carbon-cloth anode electroplated with iron nanostructure for microbial fuel cell operated with real wastewater. Sustainability 2020, 12, 6538. [Google Scholar] [CrossRef]
- Olabi, A.; Wilberforce, T.; Sayed, E.T.; Elsaid, K.; Rezk, H.; Abdelkareem, M.A. Recent progress of graphene based nanomaterials in bioelectrochemical systems. Sci. Total Environ. 2020, 749, 141225. [Google Scholar] [CrossRef]
- Sayed, E.T.; Alawadhi, H.; Olabi, A.; Jamal, A.; Almahdi, M.S.; Khalid, J.; Abdelkareem, M.A. Electrophoretic deposition of graphene oxide on carbon brush as bioanode for microbial fuel cell operated with real wastewater. Int. J. Hydrog. Energy 2021, 46, 5975–5983. [Google Scholar] [CrossRef]
- Kasem, E.T.; Tsujiguchi, T.; Nakagawa, N. Effect of metal modification to carbon paper anodes on the performance of yeast-based microbial fuel cells part Ι: In the case without exogenous mediator. Key Eng. Mater. 2013, 534, 76–81. [Google Scholar] [CrossRef]
- Sayed, E.T.; Abdelkareem, M.A.; Alawadhi, H.; Elsaid, K.; Wilberforce, T.; Olabi, A. Graphitic carbon nitride/carbon brush composite as a novel anode for yeast-based microbial fuel cells. Energy 2021, 221, 119849. [Google Scholar] [CrossRef]
- Hadiyanto, H.; Christwardana, M.; Pratiwi, W.Z.; Purwanto, P.; Sudarno, S.; Haryani, K.; Hoang, A.T. Response surface optimization of microalgae microbial fuel cell (MMFC) enhanced by yeast immobilization for bioelectricity production. Chemosphere 2022, 287, 132275. [Google Scholar] [CrossRef]
- Rozene, J.; Morkvenaite-Vilkonciene, I.; Bruzaite, I.; Zinovicius, A.; Ramanavicius, A. Baker’s yeast-based microbial fuel cell mediated by 2-methyl-1, 4-naphthoquinone. Membranes 2021, 11, 182. [Google Scholar] [CrossRef]
- Christwardana, M.; Frattini, D.; Accardo, G.; Yoon, S.P.; Kwon, Y. Effects of methylene blue and methyl red mediators on performance of yeast based microbial fuel cells adopting polyethylenimine coated carbon felt as anode. J. Power Sources 2018, 396, 1–11. [Google Scholar] [CrossRef]
- Christwardana, M.; Frattini, D.; Accardo, G.; Yoon, S.P.; Kwon, Y. Optimization of glucose concentration and glucose/yeast ratio in yeast microbial fuel cell using response surface methodology approach. J. Power Sources 2018, 402, 402–412. [Google Scholar] [CrossRef]
- Tang, Y.M.; Zhang, L.; Bao, G.Q.; Ren, F.J.; Pedrycz, W. Symmetric implicational algorithm derived from intuitionistic fuzzy entropy. Iran. J. Fuzzy Syst. 2022, 19, 27–44. [Google Scholar] [CrossRef]
- Pekaslan, D.; Wagner, C.; Garibaldi, J.M. ADONiS—Adaptive Online Nonsingleton Fuzzy Logic Systems. IEEE Trans. Fuzzy Syst. 2020, 28, 2302–2312. [Google Scholar] [CrossRef]
- Badri, A.; Ameli, Z.; Birjandi, A.M. Application of Artificial Neural Networks and Fuzzy logic Methods for Short Term Load Forecasting. Energy Procedia 2012, 14, 1883–1888. [Google Scholar] [CrossRef]
- Mas’ud, A.A.; Ardila-Rey, J.A.; Albarracín, R.; Muhammad-Sukki, F.; Bani, N.A. Comparison of the Performance of Artificial Neural Networks and Fuzzy Logic for Recognizing Different Partial Discharge Sources. Energies 2017, 10, 1060. [Google Scholar] [CrossRef]
- Faramarzi, A.; Heidarinejad, M.; Mirjalili, S.; Gandomi, A.H. Marine Predators Algorithm: A nature-inspired metaheuristic. Expert Syst. Appl. 2020, 152, 113377. [Google Scholar] [CrossRef]
- Ghoreyshi, A.; Jafary, T.; Najafpour, G.; Haghparast, F. Effect of type and concentration of substrate on power generation in a dual chambered microbial fuel cell. In Proceedings of the World Renewable Energy Congress-Sweden, Linköping; Sweden, 8–13 May 2011; pp. 1174–1181. [Google Scholar]
Disclaimer/Publisher’s Note: The statements, opinions and data contained in all publications are solely those of the individual author(s) and contributor(s) and not of MDPI and/or the editor(s). MDPI and/or the editor(s) disclaim responsibility for any injury to people or property resulting from any ideas, methods, instructions or products referred to in the content. |
© 2023 by the authors. Licensee MDPI, Basel, Switzerland. This article is an open access article distributed under the terms and conditions of the Creative Commons Attribution (CC BY) license (https://creativecommons.org/licenses/by/4.0/).