
Quality Assessment of Sludge from Filter Backwash Water in Swimming Pool Facilities

Abstract
1. Introduction
2. Materials and Methods
2.1. Subject of the Study
2.2. Characteristics of the Sludge
2.3. Assessment of the Phytotoxicity of Sludge
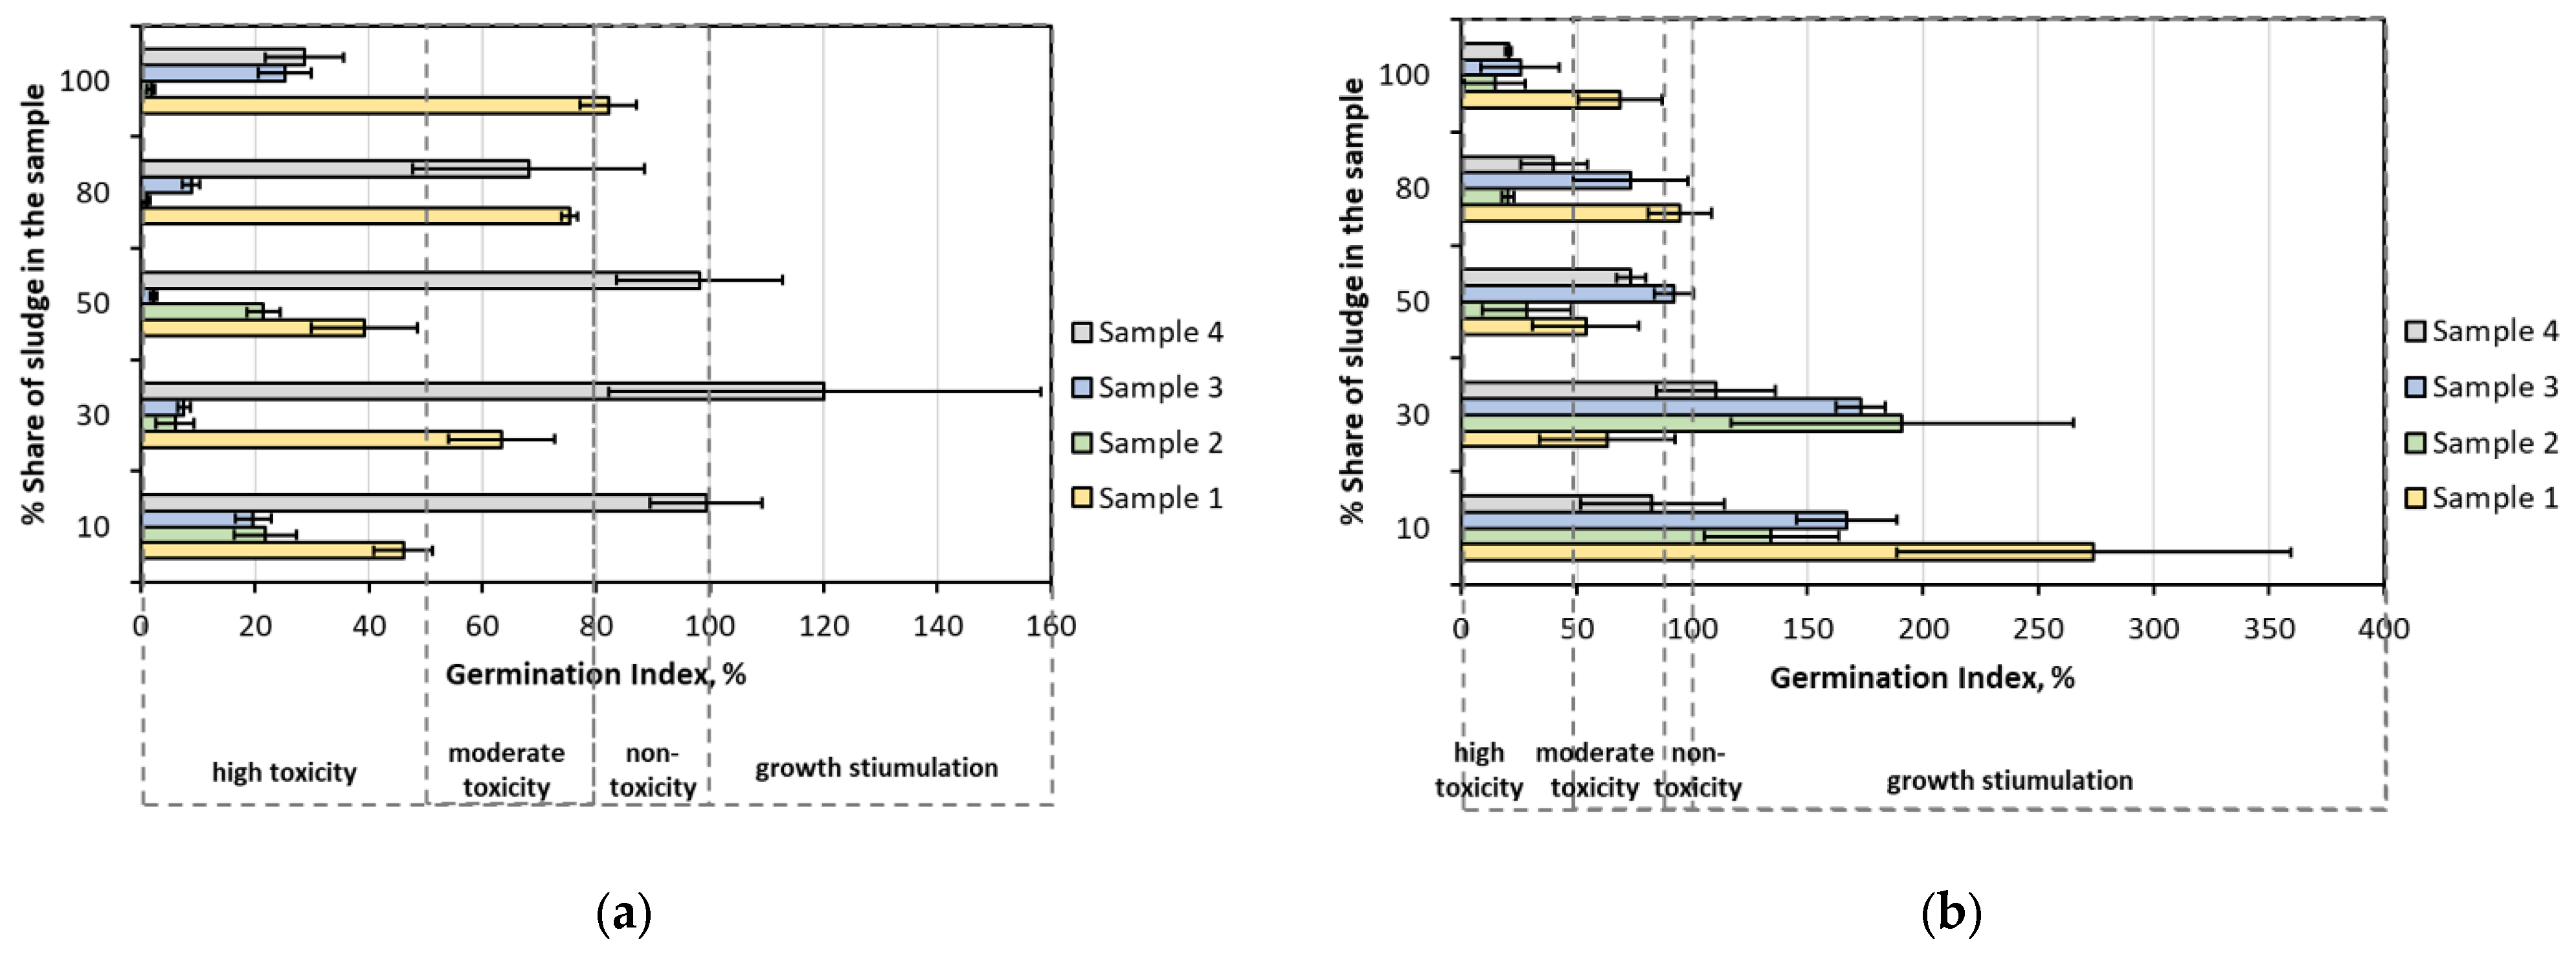
Germination Inhibition Test
3. Results
3.1. Characteristic of the Sludge
3.2. Phytotoxicity Assessment of the Sludges
4. Discussion
5. Conclusions
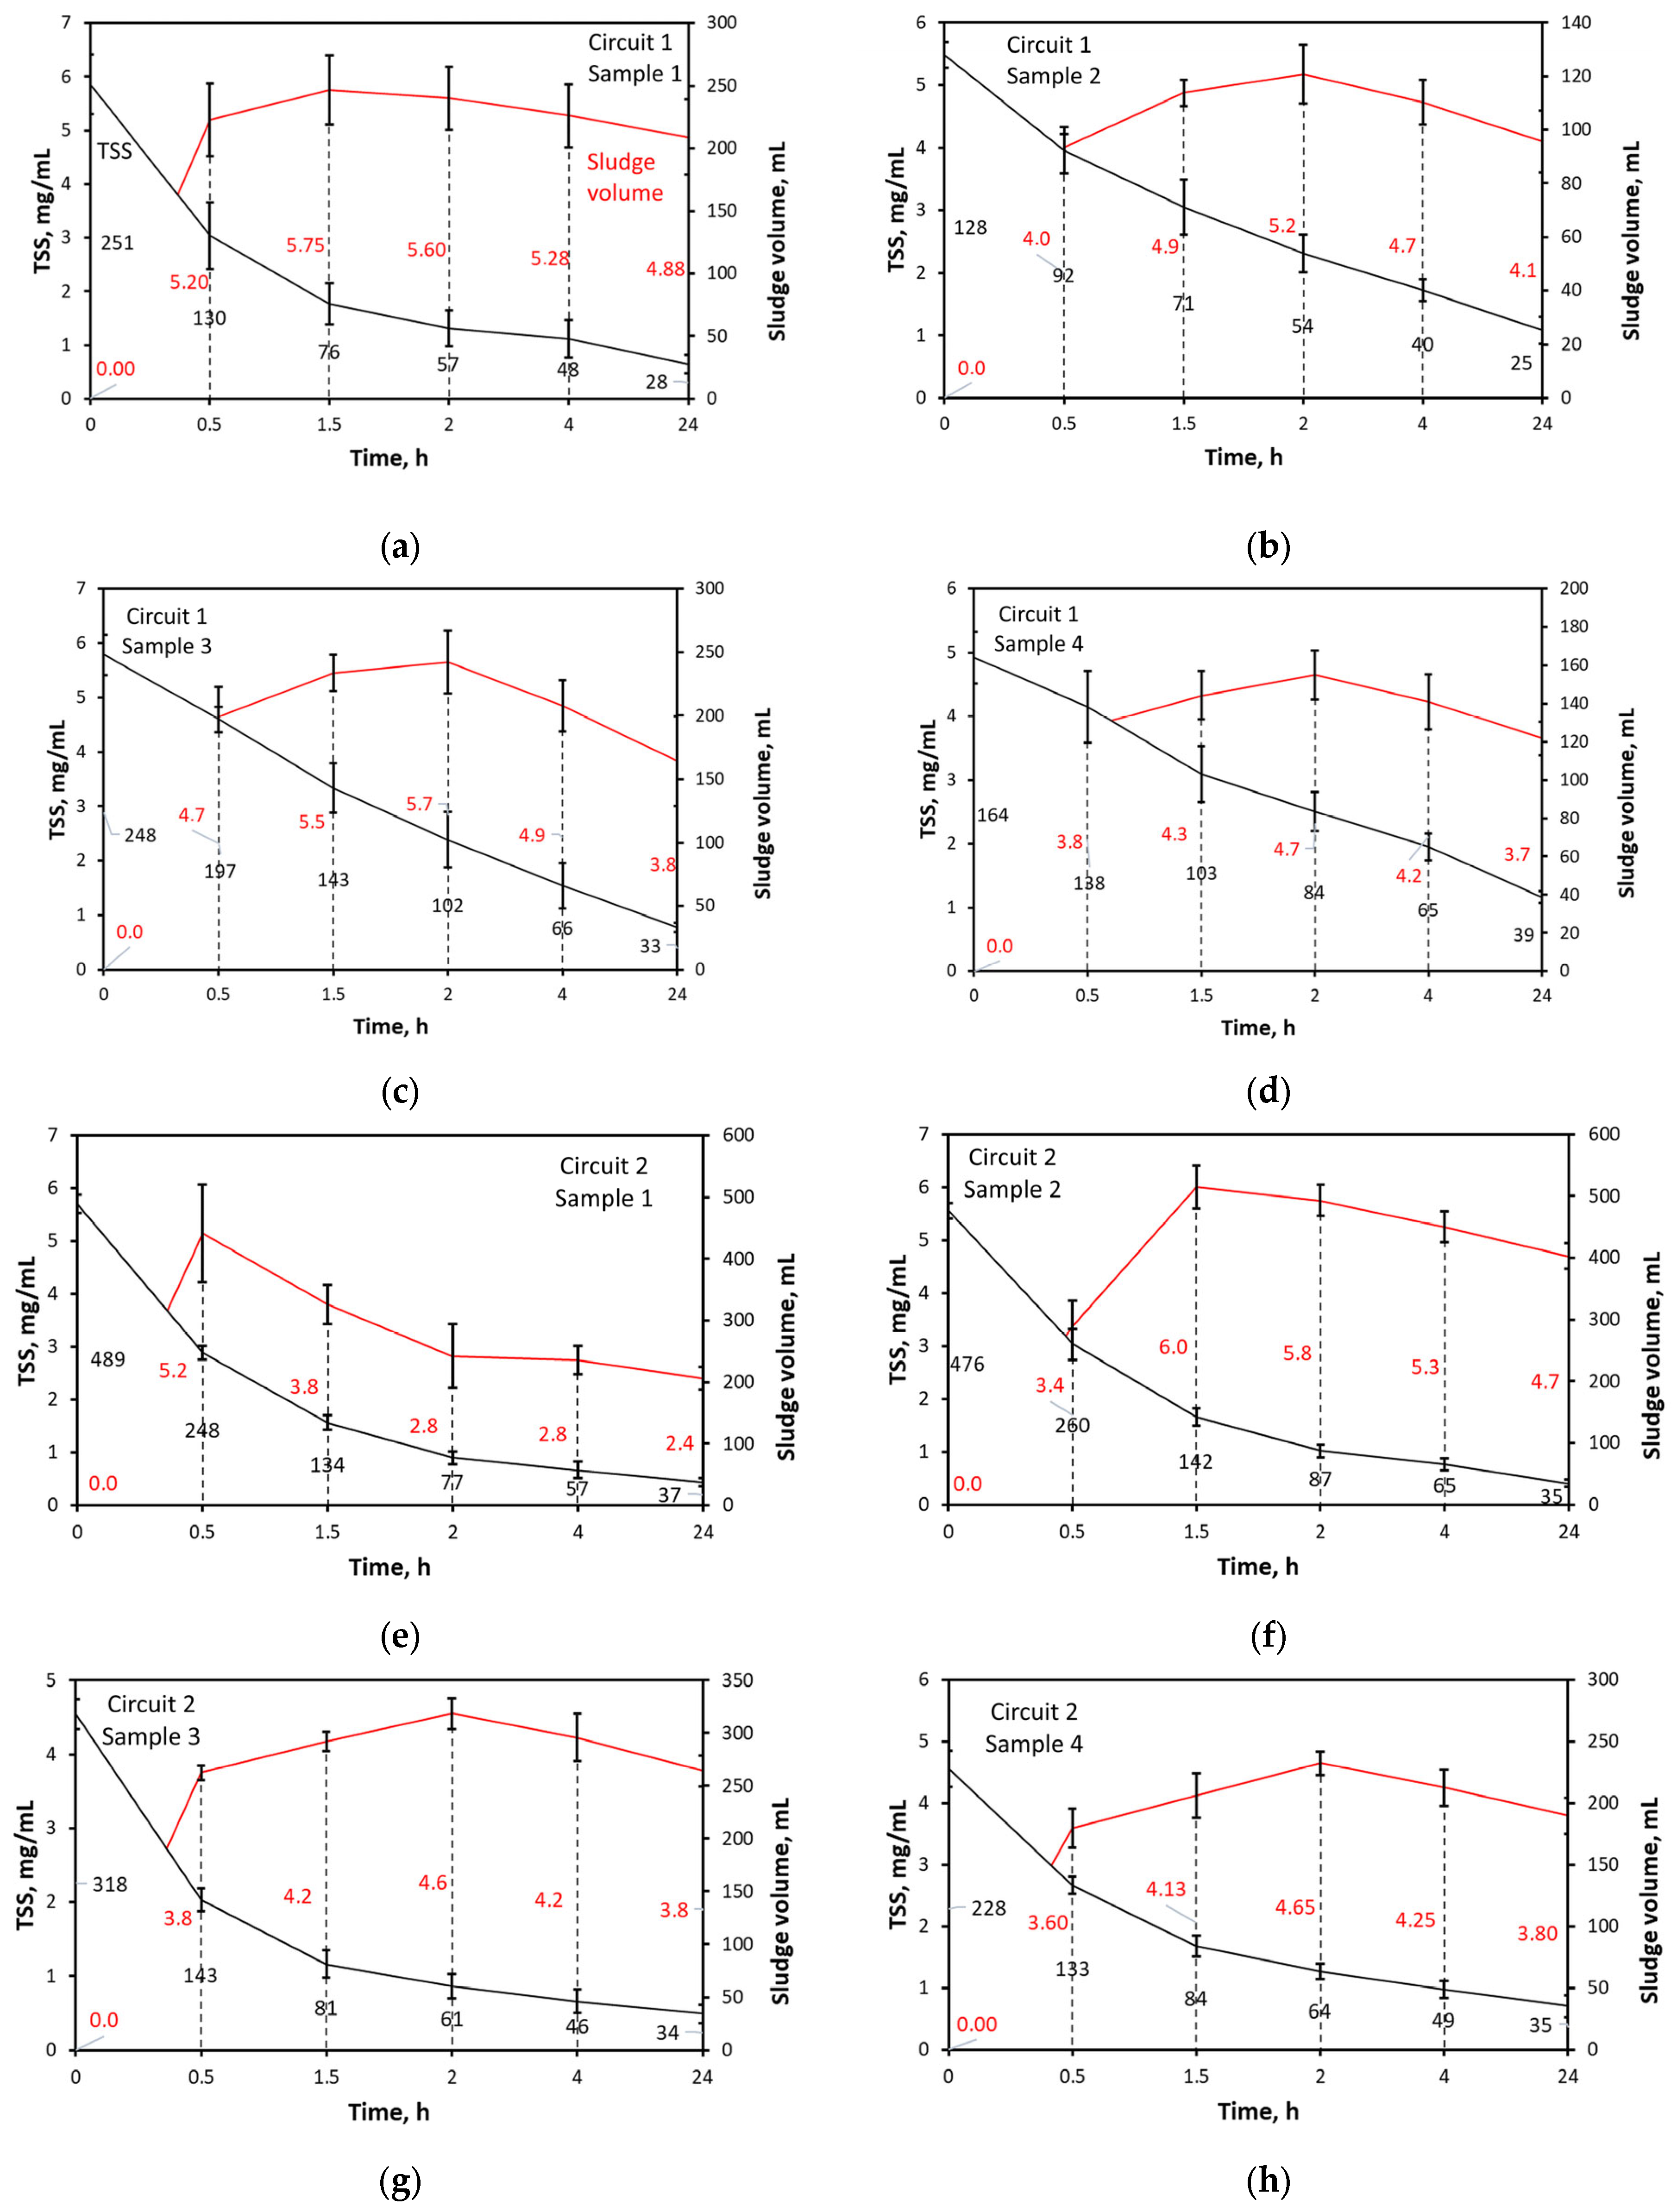
- The tested post-coagulation sludges were characterized by high content of total suspended solids.
- The sludges were concentrated gravitationally and the volume contribution of sludge in the backwash water was from 2 to 7.5%.
- The hydrolyzed coagulant (Circuit 2) contributed to the improvement of sedimentation capabilities of sludges.
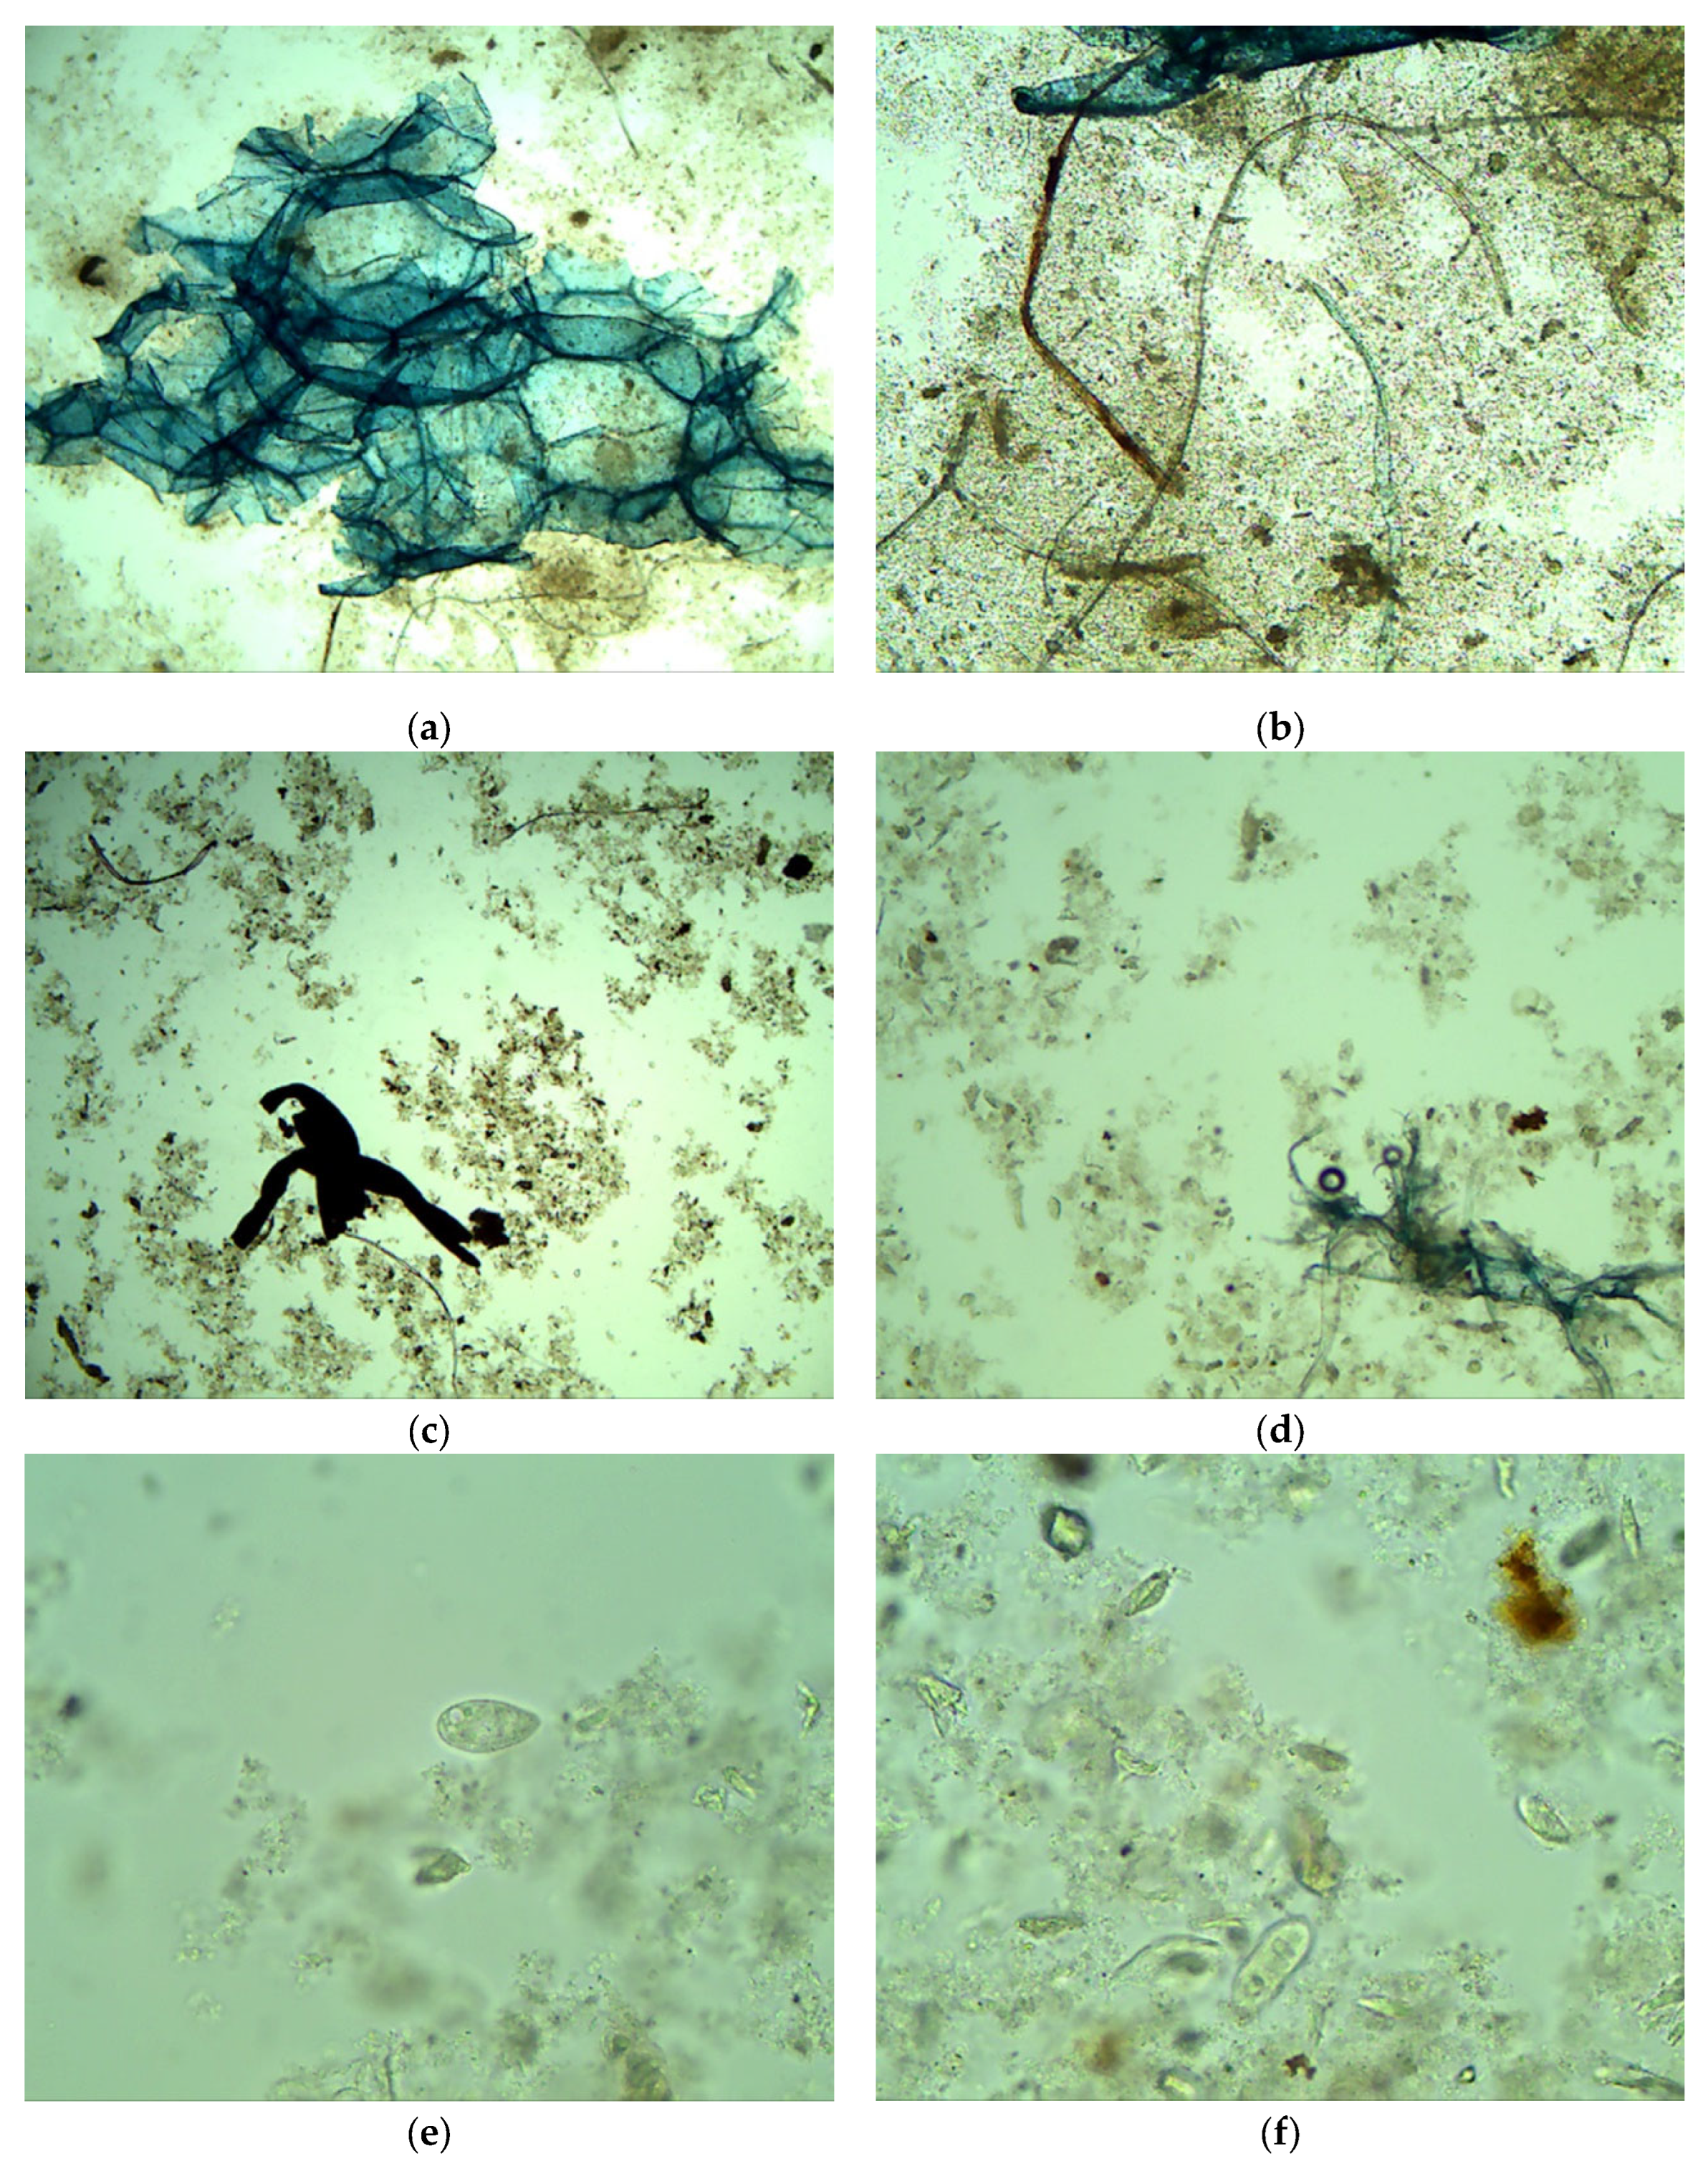
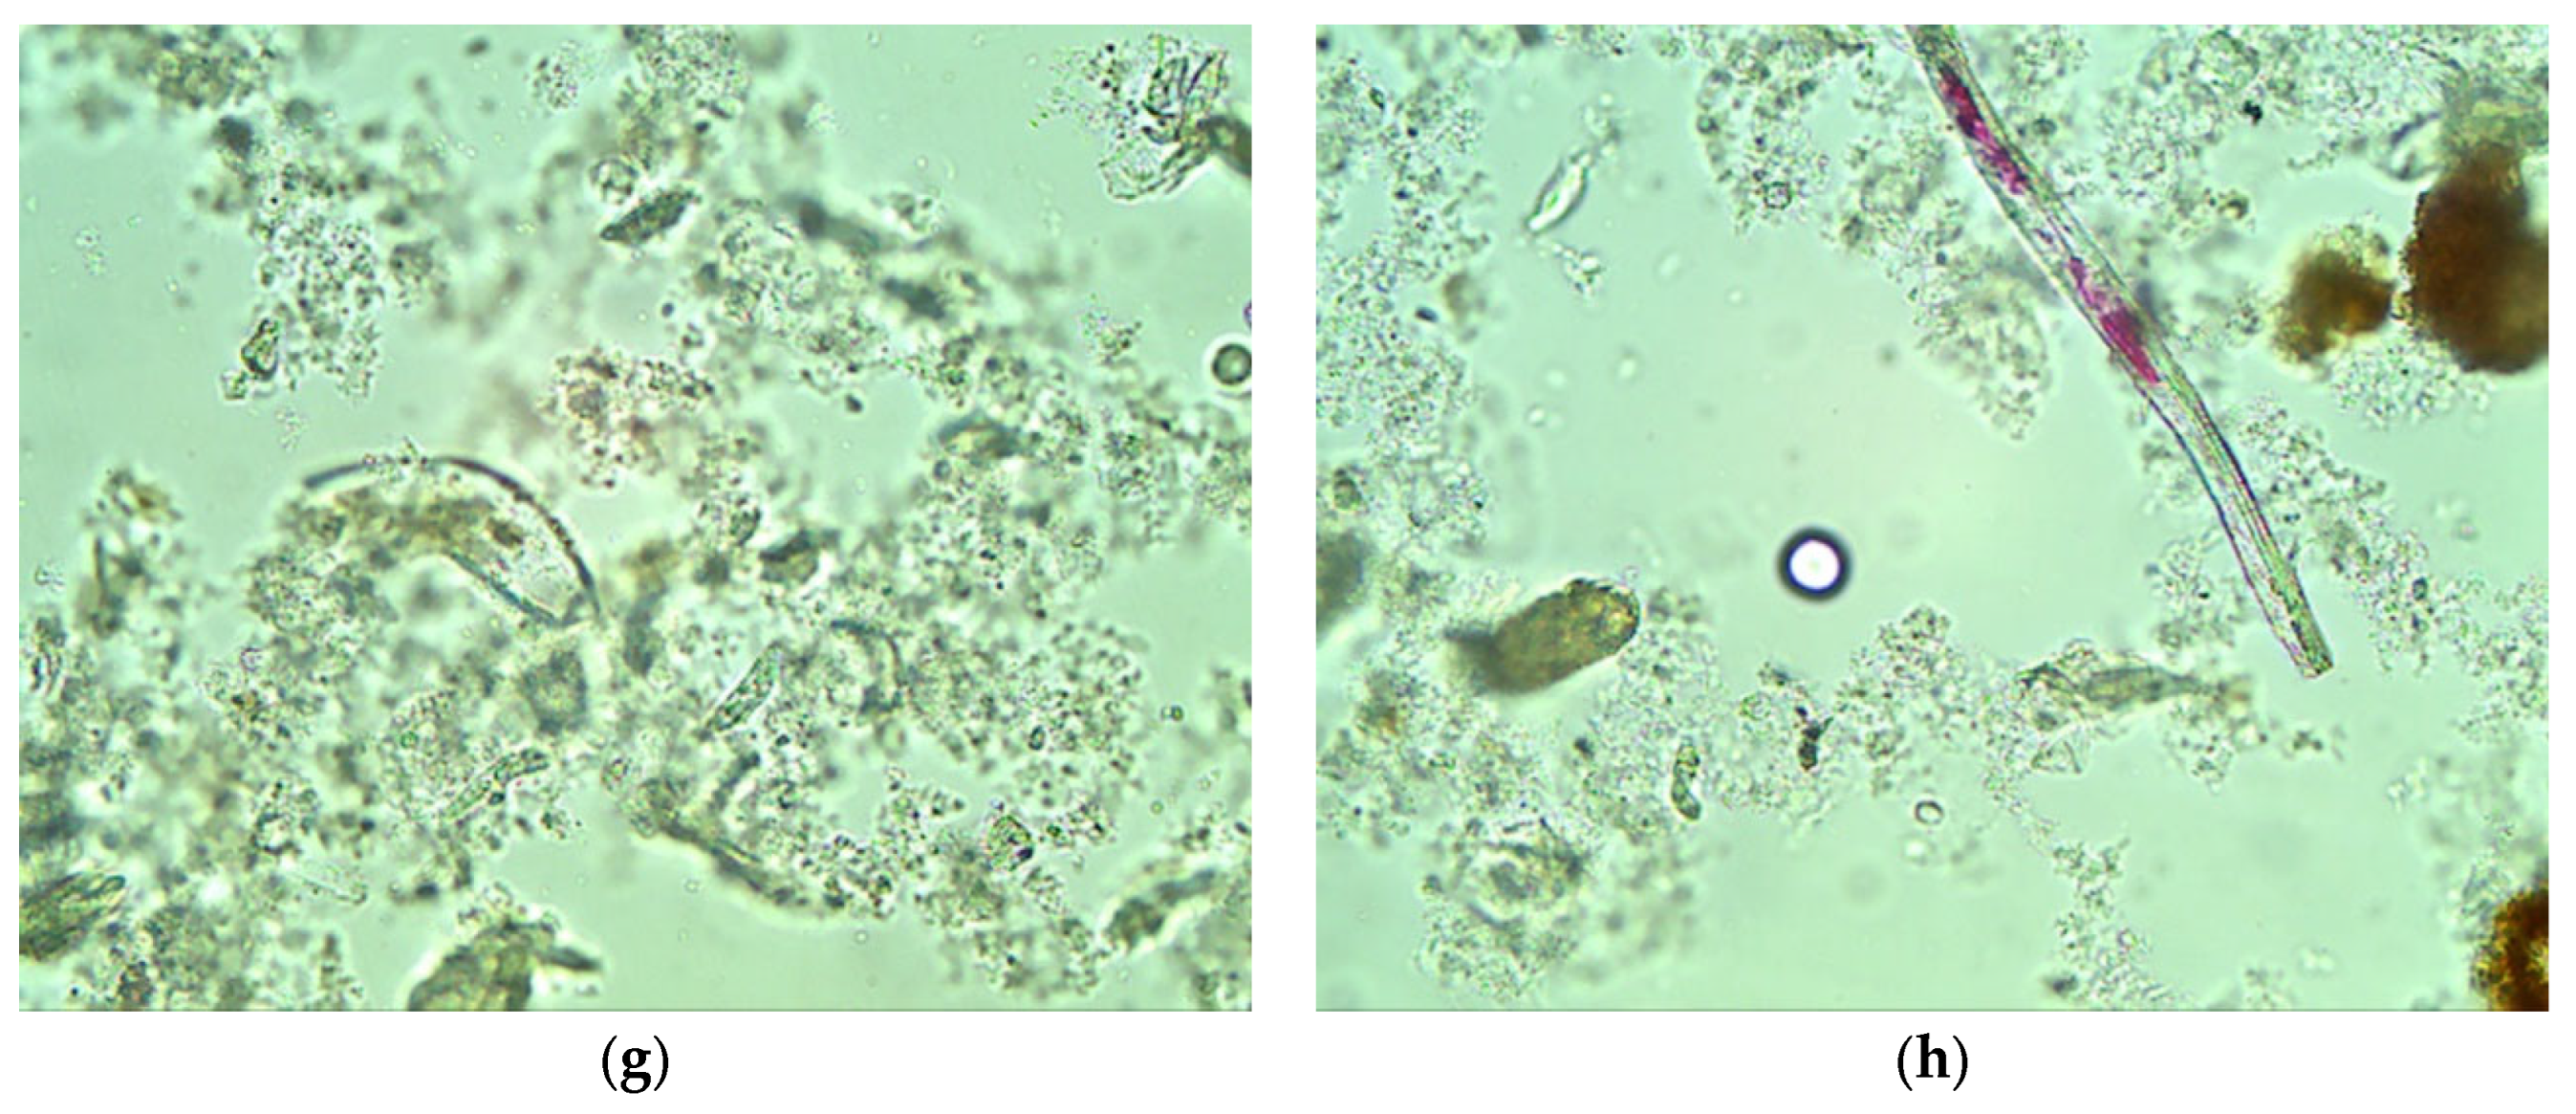
- The concentrated sediments, apart from the flocculent suspension, contained numerous other solid impurities—material fibers, hair, sand and hydroanthracite particles (washed out of the filter bed during backwashing), as well as microorganisms. Sludge particles had a wide size distribution from 1.0 to 1000 μm.
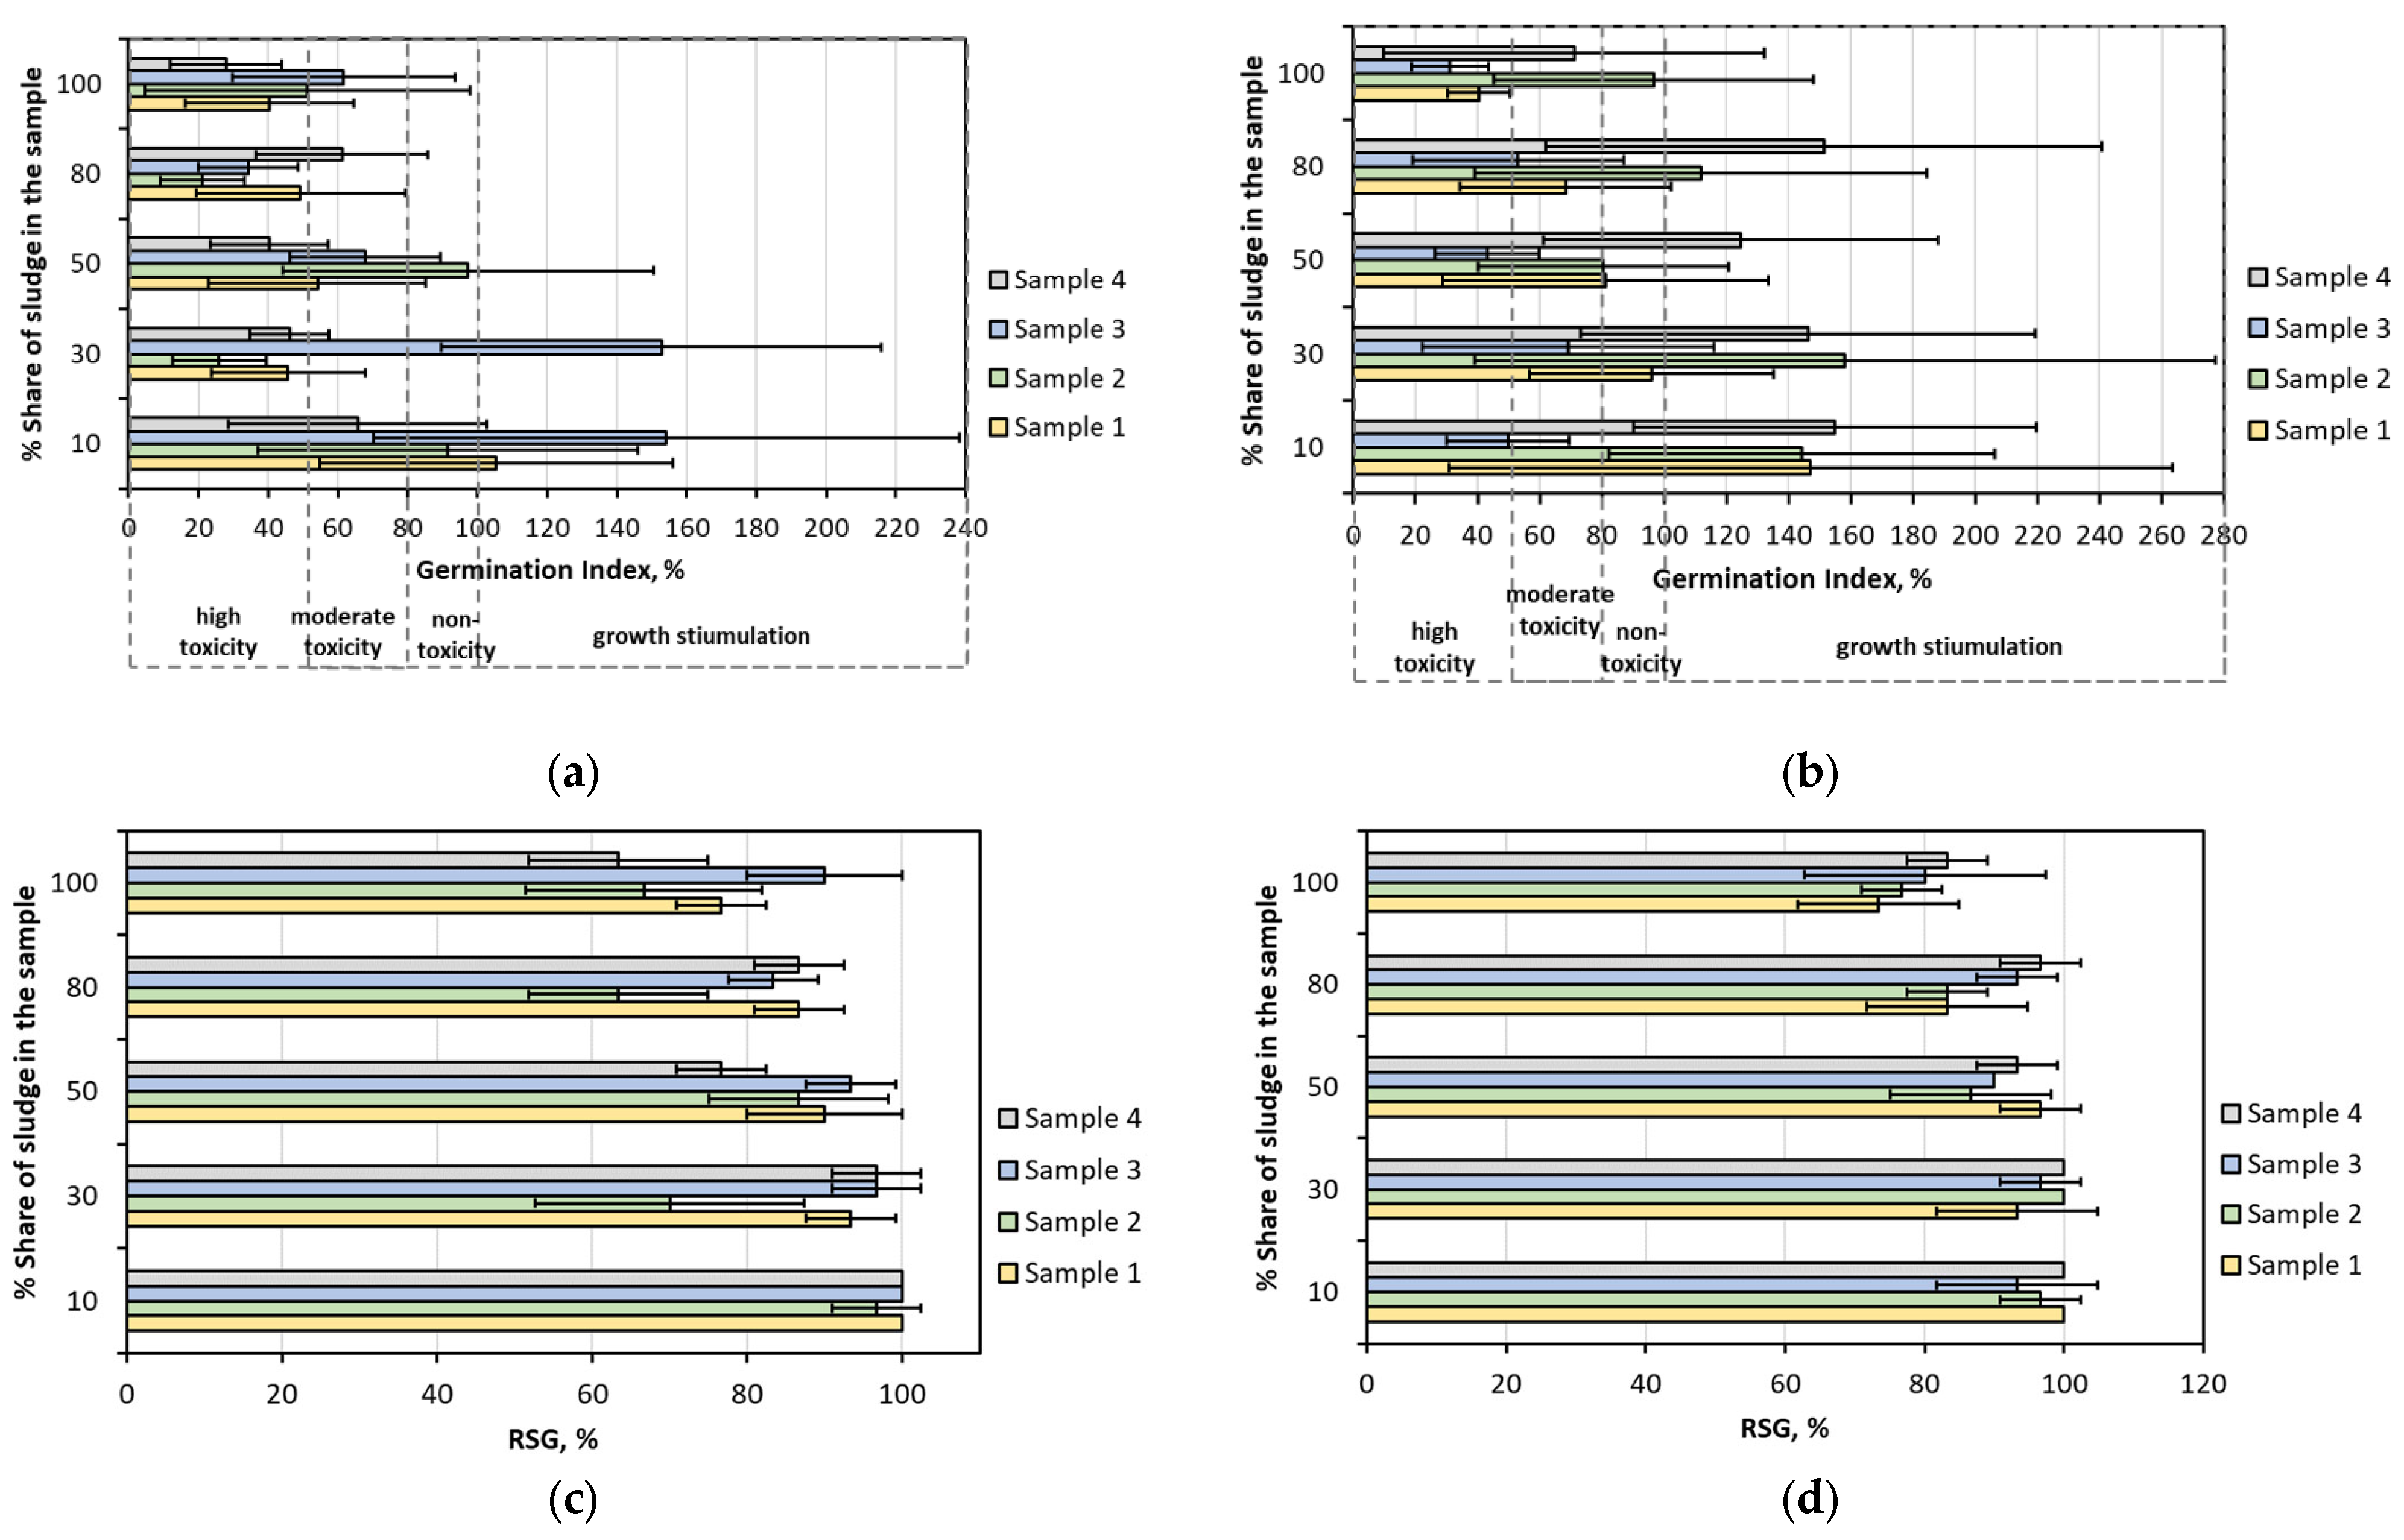
- No direct relationship could be observed between the type of coagulant (hydrolyzed/non-hydrolyzed) and the toxic effect among the tested test organisms.
- The results of the toxicity assessment indicate that the post-coagulation sludge may pose a hazard to plants. Although growth stimulation was noted in some of the tested samples, as in the case of tests with Lemna minor and Raphanus sativus, it must be remembered that the consequences of long-term contact of plants with post-coagulation sediments from swimming pool facilities is unknown.
- In this case, the next research step is to extend the analyses with pot experiments, in which sludges could be an admixture to the soil.
- The presented results are also important from the point of view of the potential for the management of the backwash water itself. Recognizing the seriousness of the threats posed by post-coagulation sludge allows establishing a strategy for cleaning the washings before using it, for example, for greenery care.
Supplementary Materials
Funding
Institutional Review Board Statement
Informed Consent Statement
Data Availability Statement
Acknowledgments
Conflicts of Interest
References
- Ricart, S.; Villar-Navascués, R.A.; Hernández-Hernández, M.; Rico-Amorós, A.M.; Olcina-Cantos, J.; Moltó-Mantero, E. Extending Natural Limits to Address Water Scarcity? The Role of Non-Conventional Water Fluxes in Climate Change Adaptation Capacity: A Review. Sustainability 2021, 13, 2473. [Google Scholar] [CrossRef]
- Iglesias, A.; Garrote, L. Adaptation strategies for agricultural water management under climate change in Europe. Agric. Water Manag. 2015, 155, 113–124. [Google Scholar] [CrossRef]
- Wyczarska-Kokot, J. The Study of Possibilities for Reuse of Washing from Swimming Pool Circulation. Ecol. Chem. Eng. S 2016, 23, 447–459. [Google Scholar] [CrossRef]
- Łaskawiec, E.; Dudziak, M.; Wyczarska-Kokot, J. The application of membrane filtration for recovery of water from filtration bed backwashing stream. Desalinat. Water Treat. 2018, 128, 89–95. [Google Scholar] [CrossRef]
- Liebersbach, J.; Żabnienska-Góra, A.; Polarczyk, I.; Sayegh, M.A. Feasibility of Grey Water Heat Recovery in Indoor Swimming Pools. Energies 2021, 14, 4221. [Google Scholar] [CrossRef]
- Regulation (EU) 2020/741 of the European Parliament and the Council of 25 May 2020 on Minimum Requirements for Water Reuse; Official Journal of the European Union, L 177/32, 5.6.2020; European Union: Brussels, Belgium, 2020.
- Łaskawiec, E.; Dudziak, M.; Wyczarska-Kokot, J. Treatment of pool water installation washings in a flocculation/ultrafiltration integrated system. J. Ecol. Eng. 2017, 18, 96–103. [Google Scholar]
- Wyczarska-Kokot, J.; Dudziak, M.; Lempart, A. Effects of Modernization of the Water Treatment System in a Selected Swimming Pool. Environ. Prot. Eng. 2019, 45, 31–43. [Google Scholar] [CrossRef]
- De Deus, F.P.; Mesquita, M.; Testezlaf, R.; de Almeida, R.C.; de Oliveira, H.F.E. Methodology for hydraulic characterisation of the sand filter backwashing processes used in micro irrigation. MethodsX 2020, 7, 100962. [Google Scholar] [CrossRef]
- Lu, P.; Amburgey, J.E.; Hill, V.R.; Murphy, J.L.; Schneeberger, C.; Arrowood, M.J. A full-scale study of Cryptosporidium parvum oocyst and Cryptosporidium-sized microsphere removals from swimming pools via sand filtration. Water Qual. Res. J. 2017, 52, 18–25. [Google Scholar] [CrossRef]
- Slavik, I.; Jehmlich, A.; Uhl, W. Impact of backwashing procedures on deep bed filtration productivity in drinking water treatment. Water Res. 2013, 47, 6348–6357. [Google Scholar] [CrossRef]
- DIN 19643-1:2012-11; Treatment of Water of Swimming Pools and Baths—Part 1: General Requirements. Beuth Verlag Berlin: Berlin, Germany, 1997.
- Wyczarska-Kokot, J.; Lempart-Rapacewicz, A.; Dudziak, M.; Łaskawiec, E. Impact of swimming pool water treatment system factors on the content of selected disinfection by-products. Environ. Monit. Assess. 2020, 192, 722. [Google Scholar] [CrossRef] [PubMed]
- Maglionico, M.; Stojkov, I. Water consumption in a public swimming pool. Water Sci. Technol. Water Supply 2015, 15, 1304–1311. [Google Scholar] [CrossRef]
- McCormick, N.; Porter, M.; Walsh, M.E. Disinfection by-products in filter backwash water: Implications to water quality in recycle designs. Water Res. 2010, 44, 4581–4589. [Google Scholar] [CrossRef] [PubMed]
- Reissmann, F.G.; Uhl, W. Ultrafiltration for the reuse of spent filter backwash water from drinking water treatment. Desalination 2006, 198, 225–235. [Google Scholar] [CrossRef]
- Wyczarska-Kokot, J.; Lempart, A. The reuse of washings from pool filtration plants after the use of simple purification processes. ACEE Arch. Civil. Eng. Environ. 2018, 11, 163–170. [Google Scholar] [CrossRef]
- Smol, M.; Adam, C.; Preisner, M. Circular economy model framework in the European water and wastewater sector. J. Mater. Cycles Waste Manag. 2020, 22, 682–697. [Google Scholar] [CrossRef]
- United States Environmental Protection Agency EPA. Method 160.2 (Gravimetric, Dried at 103–105 °C) Total Suspended Solids (TSS); United States Environmental Protection: Washington, DC, USA, 1997.
- United States Environmental Protection Agency EPA. Ecological Effects Test Guidelines OCSPP 850.4400: Aquatic Plant Toxicity Test Using Lemna spp.; United States Environmental Protection: Washington, DC, USA, 2012.
- Dudziak, M.; Kopańska, D. Indirect effect of made ground on the aquatic flora and fauna. Environ. Prot. Eng. 2017, 44, 15–24. [Google Scholar] [CrossRef]
- Phytotoxkit. Seed Germination and Early Growth Microbiotest with Higher Plants; MicroBio Test Inc.: Nazareth, Belgium, 2004; Volume 24. [Google Scholar]
- Hoekstra, N.J.; Bosker, T.; Lantinga, E.A. Effects of cattle dung from farms with different feeding strategies on germination and initial root growth of cress (Lepidium sativum L.). Agric. Ecosyst. Environ. 2002, 93, 189–196. [Google Scholar] [CrossRef]
- Persoone, G.; Marsalek, B.; Blinova, I.; Törökne, A.; Zarina, D.; Manusadzianas, L.; Nalecz-Jawecki, G.; Tofan, L.; Stepanova, N.; Tothova, L.; et al. A practical and user-friendly toxicity classification system with microbiotests for natural waters and wastewaters. Environ. Toxicol. 2003, 18, 395–402. [Google Scholar] [CrossRef]
- Horst, W.J.; Wang, Y.; Eticha, D. The role of the root apoplast in aluminium-induced inhibition of root elongation and in aluminium resistance of plants: A review. Ann. Bot. 2010, 106, 185–197. [Google Scholar] [CrossRef]
- Silva, S. Aluminium Toxicity Targets in Plants. J. Bot. 2012, 2012, 219462. [Google Scholar] [CrossRef]
- Rao, I.M.; Miles, J.W.; Beebe, S.E.; Horst, W.J. Root adaptations to soils with low fertility and aluminium toxicity. Ann. Bot. 2016, 118, 593–605. [Google Scholar] [CrossRef] [PubMed]
- Bernegossi, A.C.; Freitas, B.L.S.; Castro, G.B.; Marques, J.P.; Trindade, L.F.; de Lima e Silva, M.R.; Felipe, M.C.; Ogura, A.P. A systematic review of the water treatment sludge toxicity to terrestrial and aquatic biota: State of the art and management challenges. J. Environ. Sci. Health A 2022, 57, 282–297. [Google Scholar] [CrossRef] [PubMed]
- Dassanayake, K.B.; Jayasinghe, G.Y.; Surapaneni, A.; Hetherington, C. A review on alum sludge reuse with special reference to agricultural applications and future challenges. Waste Manag. 2015, 38, 321–335. [Google Scholar] [CrossRef] [PubMed]
- Żoczek, Ł.; Dudziak, M. Types and Valorization of Sludge Generated in Water Treatment Processes. ACEE 2022, 1, 115–121. [Google Scholar]
- Kluczka, J.; Zołotajkin, M.; Ciba, J.; Staroń, M. Assessment of aluminum bioavailability in alum sludge for agricultural utilization. Environ. Monit. Assess. 2017, 189, 422. [Google Scholar] [CrossRef]
- Studziński, W.; Poćwiardowski, W.; Osińska, W. Application of the Swimming Pool BackwashWater Recovery System with the Use of Filter Tubes. Molecules 2021, 26, 6620. [Google Scholar] [CrossRef]
- Pretti Ogura, A.; Sabogal-Paz, L.P. Detection of Cryptosporidium Parvum Oocysts in Artificially Contaminated Filter Backwash Water and Ozone Treatment at Pilot Scale. Ozone Sci. Eng. 2021, 44, 426–437. [Google Scholar] [CrossRef]
- Suppesa, L.M.; Canales, R.A.; Gerba, C.P.; Reynolds, K.A. Cryptosporidium risk from swimming pool exposures. Int. J. Hyg. Environ. Health 2016, 2019, 915–919. [Google Scholar] [CrossRef] [PubMed]
- Yuan, N.; Wang, C.; Wendling, L.A.; Pei, Y. Ecotoxicological assessment of dewatered drinking water treatment residue for environmental recycling. Environ. Technol. 2016, 38, 2241–2252. [Google Scholar] [CrossRef]
- Yang, L.; Chene, X.; Shef, Q.; Cao, G.; Liu, Y.; Chang, V.W.C.; Tangh, C.Y. Regulation, formation, exposure, and treatment of disinfection by-products (DBPs) in swimming pool waters: A critical review. Environ. Int. 2018, 121, 1039–1057. [Google Scholar] [CrossRef] [PubMed]
- Carter, R.A.A.; Joll, C. Occurrence and formation of disinfection by-products in the swimming pool environment: A critical review. J. Environ. Sci. 2017, 58, 19–50. [Google Scholar] [CrossRef] [PubMed]
- Nowacka, A.; Włodarczyk-Makuła, M.; Macherzyński, B. Comparison of effectiveness of coagulation with aluminum sulfate and pre-hydrolyzed aluminum coagulants. Desalinat. Water Treat. 2014, 52, 19–21. [Google Scholar] [CrossRef]
- Ahmad, T.; Ahmad, K.; Alam, M. Sustainable management of water treatment sludge through 3‘R’ concept. J. Clean. Prod. 2016, 124, 1–13. [Google Scholar] [CrossRef]
- Muisa, N.; Nhapi, I.; Ruziwa, W.; Manyuchi, M.W. Utilization of alum sludge as adsorbent for phosphorus removal in municipal wastewater: A review. J. Water Process. Eng. 2020, 35, 101187. [Google Scholar] [CrossRef]
- De Carvalho Gomesa, S.; Zhoua, J.L.; Lia, W.; Long, G. Progress in manufacture and properties of construction materials incorporating water treatment sludge: A review. Resour. Conserv. Recycl. 2019, 145, 148–159. [Google Scholar] [CrossRef]
- Geraldo, R.H.; Fernandes, L.F.R.; Camarini, G. Water treatment sludge and rice husk ash to sustainable geopolymer production. J. Clean. Prod. 2017, 149, 146–155. [Google Scholar] [CrossRef]
- Chen, R.F.; Zhang, F.L.; Zhang, Q.M.; Sun, Q.B.; Donga, X.Y.; Shen, R.F. Aluminium–phosphorus interactions in plants growing on acid soils: Does phosphorus always alleviate aluminium toxicity? J. Sci. Food Agric. 2012, 92, 995–1000. [Google Scholar] [CrossRef]
- Imadi, S.R.; Waseem, S.; Kazi, A.G.; Azooz, M.M.; Ahmad, P. Chapter 1-Aluminum Toxicity in Plants: An Overview. In Plant Metal Interaction Emerging Remediation Techniques; Elsevier: Amsterdam, The Netherlands, 2016; pp. 1–20. [Google Scholar]
- Singh, S.; Tripathi, D.K.; Singh, S.; Sharma, S.; Dubey, N.K.; Chauhan, D.K.; Vaculík, M. Toxicity of aluminium on various levels of plant cells and organism: A review. Environ. Exp. Bot. 2017, 137, 177–193. [Google Scholar] [CrossRef]
- Nika, C.E.; Vasilaki, V.; Expósito, A.; Katsou, E. Water Cycle and Circular Economy: Developing a Circularity Assessment Framework for Complex Water Systems. Water Res. 2020, 187, 116423. [Google Scholar] [CrossRef]
- Pirone, D.; Cimorelli, L.; Del Giudice, G.; Pianese, D. Short-term rainfall forecasting using cumulative precipitation fields from station data: A probabilistic machine learning approach. J. Hydro. 2023, 617, 128949. [Google Scholar] [CrossRef]
- Lama, G.F.C.; Giovannini, M.R.M.; Errico, A.; Mirzaei, S.; Chirico, G.B.; Preti, F. The impacts of Nature Based Solutions (NBS) on vegetated flows’ dynamics in urban areas. In Proceedings of the 2021 IEEE International Workshop on Metrology for Agriculture and Forestry (MetroAgriFor), Trento-Bolzano, Italy, 3–5 November 2021; Volume 2021, pp. 58–63. [Google Scholar]
- Heish, C.Y.; Meng-Hsiun, T.; Ryan, K.; Pancorbo, O. Toxicity of the 13 priority pollutant metals to Vibrio fisheri in the Microtox® chronic toxicity test. Sci. Total Environ. 2004, 320, 37–50. [Google Scholar]
- Baran, A.; Tarnawski, M. Phytotoxkit/Phytotestkit and Microtox® as tools for toxicity assessment of sediments. Ecotoxicol. Environ. Saf. 2012, 98, 19–27. [Google Scholar] [CrossRef] [PubMed]


Disclaimer/Publisher’s Note: The statements, opinions and data contained in all publications are solely those of the individual author(s) and contributor(s) and not of MDPI and/or the editor(s). MDPI and/or the editor(s) disclaim responsibility for any injury to people or property resulting from any ideas, methods, instructions or products referred to in the content. |
© 2023 by the author. Licensee MDPI, Basel, Switzerland. This article is an open access article distributed under the terms and conditions of the Creative Commons Attribution (CC BY) license (https://creativecommons.org/licenses/by/4.0/).
Share and Cite
Łaskawiec, E. Quality Assessment of Sludge from Filter Backwash Water in Swimming Pool Facilities. Sustainability 2023, 15, 1811. https://doi.org/10.3390/su15031811
Łaskawiec E. Quality Assessment of Sludge from Filter Backwash Water in Swimming Pool Facilities. Sustainability. 2023; 15(3):1811. https://doi.org/10.3390/su15031811
Chicago/Turabian StyleŁaskawiec, Edyta. 2023. "Quality Assessment of Sludge from Filter Backwash Water in Swimming Pool Facilities" Sustainability 15, no. 3: 1811. https://doi.org/10.3390/su15031811
APA StyleŁaskawiec, E. (2023). Quality Assessment of Sludge from Filter Backwash Water in Swimming Pool Facilities. Sustainability, 15(3), 1811. https://doi.org/10.3390/su15031811