Abstract
Digitalization has brought great changes to economic and social development, and corporate digital transformation has gradually become the focus of academic attention. We explore the economic impacts of digital transformation from the perspective of corporate innovation utilizing a sample of China’s A-share listed manufacturing firms from 2008 to 2020, depending on the quasi-natural experiment of “Integration of Informatization & Industrialization”. Using the difference-in-differences (DID) model, we document that the growth of innovation considerably tends to rise via corporate digital transformation, and top management team (TMT) heterogeneity plays a positively moderating role in this process. The findings are still reliable after the parallel trend test, PSM-DID, placebo test, and the test of excluding alternative explanations. Extended analyses find that the innovation incentive effect of digital transformation will enhance corporate value in the later stage. Our findings not only contribute to the advancement of the study in digital transformation, but also offer theoretical support and useful advice for furthering corporate digitalization and upgrading the mechanism for creative growth.
1. Introduction
Innovation is the primary driving force for economic development. In his classic “growth model”, Solow [1] mentioned the important role of innovation in a country’s economic growth. Porter [2] believes that in strategic management, innovation is very important for an enterprise to maintain its competitive advantage. As a basic corporate behavior, innovation is affected by many factors. With the increasingly complex external environment and fierce competition among enterprises, the rapid development of various technologies has gradually broken the original industrial classification and industrial form. Innovation has become an important way for enterprises to develop. The innovation process is usually considered as a process of complementary and integrated characteristics of top management team (TMT) members, so TMT characteristics are bound to have an impact on innovation decision making and implementation [3]. In this context, it is particularly important for enterprises to build a top management team (TMT) conducive to innovation.
In the new age of the digitalization, digital technologies such as artificial intelligence, blockchain, cloud computing, big data, and the Internet of Things (IoT) are being widely and aggressively integrated into the actual economy, requiring corporations to consider transformative routes. Digital technologies are different from traditional input factors that rely on physical carriers. As a new production factor, digitalization greatly improves the efficiency of information transmission in industrial production, sales and other links, and accelerates the diffusion and spillover of knowledge and technology. At the macro level, digitalization improves the efficiency of information transmission, utilization, and communication across nations on a global scale. At the micro level, digitalization promotes the cooperative development between industries and enterprises, which is conducive to knowledge sharing and technology spillover, so as to give scope to the innovation in enhancing the value of industries and enterprises. Due to the COVID-19 pandemic, manufacturing exports are facing complex external challenges. However, the deep integration of digital transformation and the manufacturing industry is gradually showing its competitive advantages.
In 2014, the Ministry of Industry and Information Technology (China) started the “Integration of Informatization and Industrialization (IoII)” pilot project in China to promote corporate digitalization. The IoII pilot project in China offers a reliable, nearly natural experimental environment for investigating the effects of corporate digital transformation. Seen from the micro viewpoint of enterprises, the new generation of digital technologies is developing rapidly after the launch of the “Integration of Informatization and Industrialization (IoII)”. The systematic reshaping of corporate management will be facilitated by the deep integration of digital technologies and traditional industries during the digital transformation process, so as to bring disruptive innovations of corporate production, operation, and management [4]. Then, will digital transformation improve the knowledge integration ability of enterprises, enhance the efficiency of information sharing, and thus improve corporate innovation? Or will it reduce innovation by complicating the internal and external environment, increasing risk and monitoring difficulties? This is an issue that needs further research to unlock the “black box” of corporate digital transformation. Therefore, we use the quasi-natural experimental scenario provided by IoII to examine the influence of digital transformation on corporate innovation and the moderating effect of the top management team (TMT) heterogeneity.
This paper makes three contributions. First, based on enterprise micro data, this paper looks into the economic effects of digitalization from the perspective of innovation and reveals the innovation incentive effect of corporate digitalization, which enriches research on digital transformation and impactful elements of corporate innovation. Second, this paper theoretically analyzes and empirically tests the moderating effect of the top management team (TMT) heterogeneity on the influence of digital transformation on corporate innovation, which further enriches relevant research. Third, this study offers factual proof for the implementation effect of the “Integration of Informatization and Industrialization” policy from a micro perspective and provides practical enlightenment for fostering innovation and accelerating corporate digital transformation.
2. Literature Review
2.1. Economic Consequences of Corporate Digital Transformation
With the continuous innovation and iteration of digital technologies, they are constantly integrated with economic and social development. The production, operation, and management of enterprises are also severely impacted by digital technologies, which has promoted the emergence of many important research topics, such as the governance and standardization of digital technology applications [5] and the influence of digital transformation on industrial transformation [6,7,8]. This brings new challenges and opportunities for the exploration of digital transformation theory and practice.
Morton [9] stated in his work that the integration of digital technologies and enterprise production and operation will surely lead to the fundamental transformation of enterprises, which is regarded as the beginning of the reference on corporate digital transformation [10]. Since then, the academic circle has started concentrating on the advancement of digital technologies, especially the research of digital technologies on organizational change. The digital technologies embedded in management and organization scenarios are being explored in more depth [11,12]. Coile [13] innovatively refined the term “digital transformation” while studying the Internet medical business model based on digital technologies. With the continuous integration of digital technologies and economic and social development, on the one hand, academics have started to deeply explore the influence of digital transformation on organizational innovation [14,15], business model change [16,17], competitive advantage [18], and other internal factors of enterprises. On the other hand, around the uncertain and complex dynamic environment, studies are gradually carried out in terms of how to build a platform or business ecosystem based on digital technologies [19] and improve their collaborative capabilities with the government, suppliers, customers, and other partners [20,21,22]. At present, digitalization is considered as the profound changes in economy, society, and industry caused by digital technologies from the macro level [23]. From the micro level, digital transformation is regarded as a behavior that promotes organizational change [24,25] and improves corporate performance [26,27]. The preceding literature demonstrates that academics have produced expansive studies on corporate digital transformation, which has laid a good foundation for further investigation of the consequence of digital transformation on corporate innovation.
2.2. Influencing Factors of Corporate Innovation
As we all know, there has been a long history of studies on the elements that affect innovation activities in enterprises, and many scholars have conducted empirical studies from multiple perspectives. From the literature, existing studies mainly examine the influencing factors of corporate innovation from the macro, meso, and micro levels.
At the macro level, existing research mainly concentrates on the impact of the policy uncertainty [28], social capital [29], tax policy [30,31,32], and government subsidies [33,34] on corporate innovation. At the meso level, scholars mainly emphasize relevant factors such as region, industry, and market participants, specifically, the impact of product market [35], analysts [36,37], and institutional investors [38,39] on corporate innovation. At the micro level, most studies have explored the influencing factors of innovation from internal factors of enterprises, such as corporate culture [40], CEO personal characteristics [41], executive compensation [42,43], executive background and experience [44,45,46], and ownership structure [47]. From the present research on the driving factors of innovation, we can clearly see a research thread from macro to micro, and from rational to irrational.
2.3. Impact of Top Management Team (TMT) Heterogeneity on Corporate Innovation
Most of the previous research focuses on the association between TMT heterogeneity and organizational success, corporate value, etc., while research on the relationship between TMT heterogeneity and corporate innovation is limited. However, the limited research has proved the correlation between TMT heterogeneity and corporate innovation. Previous research mostly concentrates on the influence of TMT heterogeneity, for instance, age, gender, educational background, and functional background, on corporate innovation. (1) Age heterogeneity and corporate innovation. Some studies have proved that senior executives at different ages will have different attitudes and styles in strategic decision making due to their different growth environments and social and work experiences. Sperber and Linde [48] analyzed the impact of the homogeneity and heterogeneity of TMT on corporate innovation and found that the age heterogeneity plays a positive or negative role during the decision-making procedure of corporate innovation. (2) Gender heterogeneity and corporate innovation. With the rise of female consciousness, more and more women break the shackles of traditional ideas and enter the management level of enterprises to take part in the decision making and operation. According to Dezsö and Ross [49], in the current complex competitive environment, the team with the combination of males and females is more capable of solving problems and has more diversified professional skills and ways of thinking than the team with only males. Women can effectively promote communication and cooperation among senior management team members, seize market opportunities more keenly, and thus better improve technology innovation to meet market and customer requirements. (3) Educational background heterogeneity and corporate innovation. An individual’s educational background contains a lot of information, which can not only reveal his knowledge and skill base, but also reflect his cognitive ability, information analysis ability, learning adaptability, and decision-making ability to a certain extent [50]. Hambrick [51] believed that senior executives with a higher education background have higher comprehensive quality, a stronger ability to find and solve problems, and can quickly identify external opportunities so as to make plans conducive to the long-term development of enterprises. Sperber and Linder [48] conducted an interview survey on TMT members of 24 European multinational companies and found that the heterogeneity of the educational background is beneficial to the innovation decisions of enterprises. (4) Functional background heterogeneity and corporate innovation. From the functional background of senior executives, we can see their job field, information analysis ability, and strategic direction decisions. Through in-depth analysis, Talke et al. [52] discovered that the diversity of functional backgrounds of TMT could noticeably enhance the output of technological innovation. The findings of Guo et al. [53] show that an inverted U-shaped relationship exists between functional background diversity of TMT and opportunity identification.
To sum up, digitalization has brought subversive innovation in production, operation, and management of enterprises, thereby producing a drastic impact on enterprises and forcing them to produce all-factor and all-process evolutionary change. There is a dearth of research that uses digital transformation as the main study object and analyzes its effects on corporate innovation, which limits the present literature to the effects of a single digital technology on corporate innovation. To make up for the shortcomings of the current research, this paper looks into the economic effects of digital transformation from the perspective of innovation, and empirically tests the moderating effect of the top management team heterogeneity on how innovation is impacted by digitalization.
3. Hypotheses Development
3.1. Digital Transformation and Corporate Innovation
During corporate digital transformation, seamless integration between digital technologies and traditional industries will promote the systematic reshaping of corporate management, so as to bring disruptive innovations of production, operation, and management. This is bound to bring a drastic impact to enterprises, force them to produce total-factor reform and whole-process reform, provide new opportunities for innovation, promote enterprises to optimize innovation technology resources, and then increase innovation output.
Under the background of the digital economy, enterprises have accumulated massive data from product design to sales terminals. The application of big data technology in the process of digital transformation is conducive to the accurate positioning of R&D. Big data technology can capture and integrate structured and unstructured data to analyze and predict the market prospect of new products or technologies more accurately, so as to avoid the waste of innovation resources [54]. Through the application of big data technology, innovation decisions are always based on large samples with higher accuracy. This will help enterprises make utility-optimal decisions and ultimately improve innovation efficiency and output.
Digital transformation can break the boundaries of time and space, integrate internal and external information and resources of enterprises, optimize resource allocation, and improve innovation efficiency [55,56]. Digital transformation promotes the gradual wider scope of resource allocation, and integrates data resources into resource allocation, which has increasingly become a new source of improving innovation efficiency. Digital transformation uses digital technologies to leverage capital, talent, and material, break the boundaries of space, organization, and technology, optimize the allocation of existing resources, make them evolve towards the dynamic direction, and comprehensively improve the efficiency of resource allocation [57,58].
Enterprises may combine information and strengthen collaboration with the aid of digital technologies. “Collaboration” refers to the process in which subjects establish a cooperative relationship through corresponding rules, stipulate and implement certain contracts with each other, and cooperate to achieve the common goals of different subjects. In this process, digitalization realizes the orderly and completely collaborative process improvement between subjects. In the dawn of the digital economy, IoT and big data technology has greatly reduced the cost of collaboration, generated economies of scale, and promoted innovation [59]. In addition, the digital transformation will also promote the development of organizational culture, so as to stimulate the innovation efficiency of enterprises [60,61,62]. Therefore, we develop the following hypothesis in light of the analysis above.
Hypothesis 1.
Digital transformation has a positive impact on corporate innovation.
3.2. The Moderating Effect of Top Management Team Heterogeneity
3.2.1. Age Heterogeneity
Nowadays, the cycle of knowledge renewal is constantly shortening. The age of TMT members largely determines their ability to accept new things, optimize the knowledge structure, change the way of thinking, and innovate the working mode. In general, older executives are less receptive to new ideas. They are more prone to maintaining the status quo and prefer to base judgments on prior experience. In contrast, young executives are more willing to alter the current state of affairs and seize R&D investment opportunities, thus forming strategic advantages for the enterprise [63]. As we know, corporate digital transformation is an activity of upgrading production technology, improving the production process, and reengineering the production process or innovating the management mode. The process of digitalization requires the determination of TMT to change the status quo and the courage to take risks. As the proportion of young members increases, the age heterogeneity of TMT raises. Enterprises are more likely to employ digital technologies to increase their innovation ability, stimulate their innovative thinking by actively deepening digital transformation, promote their R&D investment activities, and improve innovative output. Therefore, we develop the following hypothesis in light of the analysis above.
Hypothesis 2.
Age heterogeneity of TMT positively moderates the relationship between digital transformation and corporate innovation, such that digital transformation is more positively associated with corporate innovation as age heterogeneity increases.
3.2.2. Gender Heterogeneity
The focus on women in the workplace is increasing as more and more women enter the executive ranks of companies and hold important positions. Academics have also begun to discuss the gender composition of TMT. Gender differences bring male and female executives different characteristics, cognition, values, and so on, which leads to the differences in their behaviors [64,65,66]. First, from the perspective of identifying stakeholders, digital transformation affects stakeholders with different goals. TMT with gender differences is more prone to identify different stakeholder groups and implement innovative activities to meet the needs of different stakeholders. For example, female executives may be more sensitive to consumers’ demands for green innovation [64], while male executives may pay more attention to the government’s demands. Secondly, from the standpoint of information collection and processing, the information explosion caused by the application of digital technologies makes information identification more complicated. Female executives and male executives have different professional knowledge, ways of thinking, and information acquisition channels, which can enhance the ability of enterprises to process information and help them make correct and effective innovation decisions [64]. Third, in terms of teamwork, compared with male executives, female executives place a greater emphasis on maintaining the relationship between team members and are adept at communication and exchange among members, thus improving the vitality of the team. With their unique collaboration and interpersonal skills, female executives can reduce conflict and delay and improve team cooperation and cohesion through effective communication, thus improving the efficiency of digital transformation to promote corporate innovation [65]. Through the above analysis, based on the information decision theory, gender heterogeneity increases the cognitive diversity of the top management team, provides a broader perspective, and improves the information collection, processing ability, as well as team cohesion. This may have a beneficial influence on the implementation effect of digital transformation, so as to improve corporate innovation performance. Therefore, we develop the following hypothesis in light of the analysis above.
Hypothesis 3.
Gender heterogeneity of TMT positively moderates the relationship between digital transformation and corporate innovation, such that digital transformation is more positively associated with corporate innovation as gender heterogeneity increases.
3.2.3. Education Level Heterogeneity
The education level of executives reflects their cognitive level, values, and so on. Executives with different education levels may gain differences in information acquisition and processing, ways of thinking, and environmental awareness. First of all, from the perspective of information acquisition, different levels of education produce different knowledge reserves. Meanwhile, in the process of study, they accumulated different circles of contacts through approaching different people. This will provide different channels for the enterprise to obtain information. Second, in terms of information processing ability, executives with different education levels have different information processing ability. Compared with executives with a low education level, executives with a high education level have acquired more professional and scientific knowledge, more rigorous logic, as well as stronger information integration and analysis ability, which is favorable to making full use of information to boost corporate innovation. Meanwhile, executives with a higher education level are more sensitive to the environmental changes of the enterprise and the challenges faced by the enterprise and can respond in a timely manner [67]. Thirdly, from the perspective of thinking mode, senior executives with a high education level tend to have strong theoretical knowledge due to their longer schooling time and can make effective digital transformation decisions from a theoretical perspective to facilitate corporate innovation. Lower-educated executives, on the other hand, enter the workforce earlier and have more work experience and expertise. Such executives often give different opinions and ideas from the perspective of their own practical experience, which makes the digital transformation decision of enterprises more feasible. Through the above analysis, based on the information decision theory, the higher the heterogeneity of the education level, the more diversified the information obtained by the enterprise, the broader the perspective of examining the problem. This will enhance the ability of enterprises to implement digital transformation and thus improve their innovation performance. Therefore, we develop the following hypothesis in light of the analysis above.
Hypothesis 4.
Education-level heterogeneity of TMT positively moderates the relationship between digital transformation and corporate innovation, such that digital transformation is more positively associated with corporate innovation as education level heterogeneity increases.
3.2.4. Functional Background Heterogeneity
Members’ functional background in a top management team is constituted by different types of positions and different functions that they have experienced in their career before becoming top managers. A functional background is a reflection of the range and degree of different professional knowledge and skills. The functional background greatly affects the perspective of TMT members in analyzing problems and making decisions [68]. A TMT with higher functional background heterogeneity can better cope with the complex environment [69]. As the functional background heterogeneity increases, the knowledge, vision, experience, and ability in decision making will also be expanded [70]. Different from any other characteristic, it is difficult for functional background difference to render adverse effects on interpersonal communication among members. According to previous studies, the resemblance in the knowledge field and practical experience of team members will provide repeated information for decision making, and group think is more likely to occur. On the contrary, in a team with diverse functional backgrounds, members can absorb knowledge and experience from different fields and inspire stronger divergent thinking. This will encourage members to explore uncharted territory together, producing a greater variety of innovative ideas [71]. At the same time, a team with diverse functional backgrounds will provide a platform for members to communicate with and learn from each other, which is conducive to the acquisition of digital technology knowledge and internal knowledge transformation. Innovation is essentially a cognitive and exploratory activity with high complexity. In the context of the cross-integration of many disciplines, corporate digital transformation can not only rely on the knowledge of a single discipline, but also needs to integrate knowledge and ideas from multiple fields to promote innovation. Thus, the knowledge and resources needed are bound to be complex and diverse. In light of the preceding explanation, we hold opinion that the more heterogeneous the functional background is, the more diversified its knowledge and thinking will be. This will deepen the acquisition, transformation and utilization of the digital transformation knowledge, and then promote corporate innovation performance. Therefore, we develop the following hypothesis in light of the analysis above.
Hypothesis 5.
Functional background heterogeneity of TMT positively moderates the relationship between digital transformation and corporate innovation, such that digital transformation is more positively associated with corporate innovation as functional background heterogeneity increases.
3.3. Theoretical Model
Based on the above analysis, a theoretical model of the impacts of digital transformation on corporate innovation is presented in Figure 1. The basic model’s constructs are digital transformation, corporate innovation, age heterogeneity of TMT, gender heterogeneity of TMT, education level heterogeneity of TMT, and functional background heterogeneity of TMT. The relationships among these variables are shown clearly in the model.
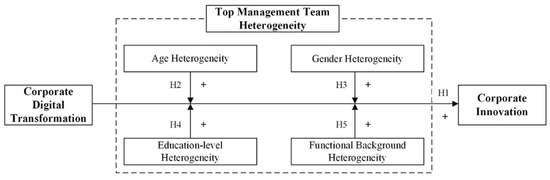
Figure 1.
Theoretical model.
4. Research Design
4.1. Regression Models
To evaluate the influence of digital transformation on corporate innovation (Hypothesis 1), we developed the DID Model (1) at the firm-year level while referencing Beck et al. [72]. According to Hypothesis 2, Model (2) was developed to examine the moderating effect of TMT age heterogeneity. According to Hypothesis 3, Model (3) was developed to examine the moderating effect of TMT gender heterogeneity. According to Hypothesis 4, Model (4) was developed to examine the moderating effect of TMT education level heterogeneity. According to Hypothesis 5, Model (5) was developed to examine the moderating effect of TMT functional background heterogeneity.
4.2. Main Variables
4.2.1. Dependent Variables
According to Hall and Harhoff [73], we calculate the quantity of new patent applications to gauge corporate innovation (Innovationi,t). Patents are the main form of representing enterprises’ innovation achievements in current research. The application of a patent is an integral part of enterprises’ R&D, and the data source is more objective. This paper uses the natural logarithm of the total number of new patent applications of listed companies in the current year plus 1 to measure the innovation level (Patent). To further the study’s depth, we use the result after taking the natural logarithm of the number of invention patent applications plus 1 to measure the quality of innovation (Patenti), and use the result after taking the natural logarithm of the sum of the number of utility model patent and design patent applications plus 1 to measure the quantity of innovation (Patentud).
4.2.2. Independent Variable
Digital transformation (DIGi,t−1) represents the treatment effect of “Integration of Informatization and Industrialization”. DIG is used here with a one-period lag since the impact of a company’s digitalization on innovation takes time. In more detail, DIG is 1 after the company is selected as an IoII pilot and 0 otherwise. α1 captures the effect that digital transformation has on corporate innovation.
4.2.3. Moderator Variables
Top management team (TMT) heterogeneity is the moderator variable in this paper. The disparities in TMT members’ ages, genders, educational levels, and functional backgrounds are taken from earlier research and utilized to quantify TMT heterogeneity. On the grounds of Blau’s [74] heterogeneity index, the Herfindahl–Hirschman coefficient is obtained for gender heterogeneity (Hgen), education level heterogeneity (Hedu), and functional background heterogeneity (Hfun) utilizing the calculation (1 − ∑i2), where i is the proportion of the group in the ith category. A high score on this index indicates variability in the functional responsibilities among team members or functional diversity, while a low score represents greater functional homogeneity. Allison [75] proposed that the coefficient of variation is the best measure of heterogeneity when the demographic characteristics are measured using continuous variables (such as age). As a result, the coefficient of variation is used in this research to evaluate age heterogeneity (Hage).
4.2.4. Control Variables
Xi,t is a set of firm-level control variables that includes firm size (Size), financial leverage (Lev), cash flow (Cfo), return on assets (ROA), growth rate (Growth), market power (Market), intensity of physical assets (PPE), ownership concentration (Owncon1), listed years (LnAge), year dummy variable (Year), industry dummy variable (Industry), and firm dummy variable (Firm). Table 1 provides the definitions of these variables.

Table 1.
Variable definitions.
The variables are defined and constructed in Table 1.
4.3. Sample and Data
Since only manufacturing companies are subject to the policy of “Integration of Informatization and Industrialization”, a sample of Chinese A-share listed manufacturing companies was chosen to test the study model. The final sample is made up of 17,023 firm-year observations from 2008 to 2020, which were obtained from 2225 firms. The data for the “Integration of Informatization and Industrialization” comes from the Ministry of Industry and Information Technology’s (China) website. Other data are taken from the China Stock Market and Accounting Research (CSMAR) database and Chinese Research Data Services (CNRDS). Additionally, we winsorize the continuous variables at the 1st and 99th percentiles. Standard errors are clustered at the firm level.
5. Empirical Testing
5.1. Descriptive Statistics
Table 2 presents descriptive statistical results for all relevant variables. As for innovation, the standard deviation of Patent is 1.586, whilst the spread ranges from 0 to 6.151, indicating significant variation in the level of innovation output among our sample. The mean value of DIG t−1 is 0.076, signifying that only 7.6% of the sample are pilot firms. From the standard deviation, maximum value, and minimum value, it can be seen that the age heterogeneity (Hage), gender heterogeneity (Hgen), education level heterogeneity (Hedu), and functional background heterogeneity (Hfun) of the top management team all show certain differences.
Table 2.
Summary statistics.
5.2. Test Results of Hypotheses
5.2.1. Digital Transformation and Corporate Innovation
To test H1, we first estimate Model (1) and examine the IoII policy’s effect on innovation. The results given are in Table 3. As Table 3 shows, all of the regressions on DIG t-1 to Patent, Patenti, and Patentud are significantly positive (Patent: β = 0.193, t = 4.548; Patenti: β = 0.155, t = 2.604; Patentud: β = 0.159, t = 2.453). This demonstrates that as digitalization advances, the output of corporate innovation (Patent) rises. Additionally, corporate digitalization enhances both the number and quality of inventions (Patentud and Patenti). This evidence supports Hypothesis 1.
Table 3.
Digital transformation and corporate innovation.
5.2.2. The Moderating Effect of Age Heterogeneity
Table 4 reports the moderating effect of age heterogeneity on the linkages between digitalization and innovation. The regression coefficients on the cross-product term (DIGt−1 × Hage) to Patent, Patenti, and Patentud are substantially positive. This shows that age heterogeneity of TMT positively moderates the relationship between digitalization and innovation, such that digital transformation is more positively associated with corporate innovation as age heterogeneity increases. The above statistics support Hypothesis 2.
Table 4.
The moderating effect of age heterogeneity.
5.2.3. The Moderating Effect of Gender Heterogeneity
Table 5 reports the moderating effect of gender heterogeneity on the linkages between digitalization and innovation. The regression coefficients on the cross-product term (DIGt−1 × Hgen) to Patent, Patenti, and Patentud are substantially positive. This shows that gender heterogeneity of TMT positively moderates the relationship between digitalization and innovation, such that digital transformation is more positively associated with corporate innovation as gender heterogeneity increases. The above statistics support Hypothesis 3.
Table 5.
The moderating effect of gender heterogeneity.
5.2.4. The Moderating Effect of Education Level Heterogeneity
Table 6 reports the moderating effect of education level heterogeneity on the linkages between digitalization and innovation. The regression coefficients on the cross-product term (DIGt−1 × Hedu) to Patent, Patenti, and Patentud are substantially positive. This signifies that education level heterogeneity of TMT positively moderates the relationship between digitalization and innovation, such that digital transformation is more positively associated with corporate innovation as education level heterogeneity increases. The above statistics support Hypothesis 4.
Table 6.
The moderating effect of education level heterogeneity.
5.2.5. The Moderating Effect of Functional Background Heterogeneity
Table 7 reports the moderating effect of functional background heterogeneity on the linkages between digitalization and innovation. The regression coefficients on the cross-product term (DIGt−1 × Hfun) to Patent, Patenti, and Patentud are substantially positive. This indicates that functional background heterogeneity of TMT positively moderates the relationship between digitalization and innovation, such that digital transformation is more positively associated with corporate innovation as functional background heterogeneity increases. The above statistics support Hypothesis 5.
Table 7.
The moderating effect of functional background heterogeneity.
6. Robustness Tests
6.1. Parallel Trend Test
A fundamental prerequisite for the use of the DID model is that the parallel trend presumption must be valid. Referencing Beck et al. [72], we set Model (6) to investigate the time trend of the treated and the control group.
In Model (6), we set a series of dummy variables. Specifically, Before1 is assigned a value of 1 for the first year before the treatment group enters the IoII pilot list, and 0 otherwise. Before2 was assigned a value of 1 for the second year before the treatment group entered the IoII pilot list, and 0 otherwise. Before3 was assigned a value of 1 for the third year before the treatment group entered the IoII pilot list, and 0 otherwise. After1 is assigned a value of 1 for the first year after the treatment group entered the IoII pilot list, and 0 otherwise. After2 is assigned a value of 1 for the second year after the treatment group entered the IoII pilot list, and 0 otherwise. The estimation results of Beforej{j = 1,2,3} and Afterj{j= 1,2} indicate whether there is a substantial disparity in the trend of innovation output between the treatment group and the control group in the jth year before and after entering the IoII pilot list, respectively. Table 8 illustrates that the coefficients of Before3, Before2, and Before1 are not significant. It demonstrates the validity of the parallel trend premise.
Table 8.
The results of the parallel trend test.
6.2. PSM-DID
In order to avoid the possible influence of systematic variance between the treatment group and the control group on the research results, referencing Chen et al. [76], we utilized propensity score matching (1:1 nearest neighbor matching) to further screen the samples of the control group, so as to reduce the group variance between the treatment and the control group. The outcomes of the covariate balancing test for all variables both before and after matching are displayed in Table 9. After the above processing, the results of the difference test between groups show that there is no substantial disparity in the control variables between the samples of the treatment and the control groups.
Table 9.
Test of covariate balancing.
Table 10 displays the results of the PSM-DID test. All of DIGt−1’s regression coefficients are statistically positive, suggesting that the results of this study are still valid after controlling the possible impact of group differences between the treatment group and the control group.
Table 10.
PSM-DID.
6.3. Placebo Tests
In order to rule out the impact of accidental elements, referring to Chetty et al. [77], we randomly selected the pilot firms and years of “IoII” and repeated this process 1000 times for placebo test. Figure 2 demonstrates how the benchmark regression’s coefficients, which are 0.193, are fully independent of the stochastic simulation’s coefficients, which are spread about 0, proving that the findings are not due to random variables.
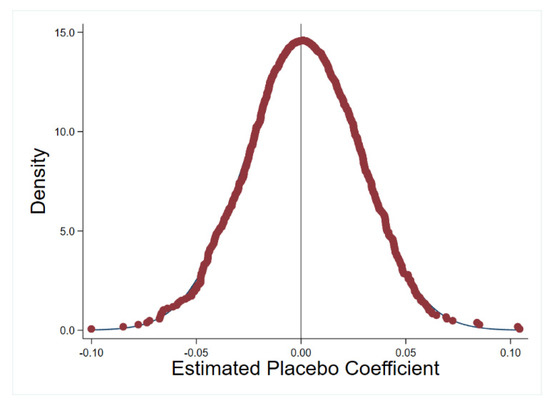
Figure 2.
Distribution of placebo estimates.
6.4. Alternative Explanation: The Innovation Manipulation Hypothesis
The primary results of this paper reveal that corporate digitalization has an innovation incentive effect and can significantly improve the patent output of enterprises. However, this conclusion needs to expel an alternative explanation: management may face higher market expectations and pressures after a company has embarked on digital transformation. Management may deliberately overreport the quantity of patent applications for innovation in order to create good performances in innovation output. We call this the innovation manipulation hypothesis. To rule out this hypothesis, the innovation output in the basic model is no longer calculated by the quantity of patent applications, but by the quantity of patent licensing (Patent_license, Patenti_license, and Patentud_license). If innovation manipulation occurs, corporate digital transformation should not have a significantly positive influence on the number of patents licensing. Table 11 displays the results of the regression. In the regression model of patent licensing, since all of the DIGt−1’s coefficients are significantly positive, there is no evidence of innovation tampering.
Table 11.
Alternative explanation: the innovation manipulation hypothesis.
7. Extended Analyses: An Analysis of Value Enhancement
Innovation reduces costs and advances technologies. Innovation assists firms in achieving competitive advantages, such as a favorable image and an increase in stakeholder confidence in a firm’s performance [78]. By improving product differentiation, firms can earn a premium and thereby increase their corporate value [79]. Thus, corporate value can be utilized to determine whether a firm benefits from digital transformation by increasing its output of innovation. We further analyze if digital transformation increases a firm’s value via innovation. The value-enhancing function of innovation focuses on verifying whether the innovation output generated by a firm’s digital transformation can be converted into corporate value. According to Quan and Yin [80] and Lin and Long [81], the research Model (7) has been constructed.
where TobinQi,t represents corporate value. The cross-product term is the core variable and its coefficient β3 measures the impact of digital transformation on the relationship between innovation output and corporate value. If β3>0, the corporate digital transformation improves corporate value through innovation output, and if β3<0, then the corporate digital transformation decreases corporate value through innovation output. A number of variables Xi,t that may affect corporate value are controlled, including financial leverage (Lev), listed years (LnAge), firm size (Size), cash flow (Cfo), nature of ownership (SOE), growth rate (Growth), market power (Market), intensity of physical assets (PPE), ownership concentration (Owncon1), as well as industry dummy variable (Industry), year dummy variable (Year), and firm dummy variable (Firm). The regression results for the value-enhancing effect are shown in Table 12.
Table 12.
Extended analyses: an analysis of value enhancement.
Table 12 shows that none of coefficients β3 are significant when TobinQt is the dependent variable. When the dependent variable is TobinQt+1, the coefficient β3 of the cross-product term (DIGt−1 × Patent, DIGt−1 × Patenti) is significantly positive, but the coefficient β3 of the cross-product term (DIGt−1 × Patentud) is not significantly positive. Innovation patents may take time to convert into corporate value, which explains why there has been no increase in corporate value over the current year. According to the available literature, the application of technology patents is merely the initial stage in the R&D process. It may require a sequence of post-R&D management steps, such as pilot testing, industrialization, and commercialization [82]. It takes time for the product to become marketable and generate market value. In addition, utility model patents and design patents generated by digital transformation will not enhance corporate value, possibly because utility model patents and design patents contain fewer innovative activities and are not enough to affect corporate value. The results indicate that the innovation output, especially invention patents, generated by the digital transformation can significantly increase corporate value, and that the innovation incentive effect of digital transformation has a value-enhancing function with a one-year lag.
8. Conclusions
Innovation is a vital determinant for transforming the economic growth model and achieving sustainable development. With the rapidly evolving digital economy as a backdrop, the digitalization level of enterprises is constantly improving. Therefore, it is crucial for global economic development to study whether corporate innovation may be encouraged via digital transformation. We explore the impacts of digital transformation from the perspective of corporate innovation employing a sample of China’s A-share listed manufacturing firms from 2008 to 2020, depending on the quasi-natural experiment of “Integration of Informatization & Industrialization”.
Using the difference-in-differences (DID) model, we document that the growth of innovation considerably tends to rise via corporate digital transformation, and top management team (TMT) heterogeneity plays a positively moderating role in this process. The findings are still reliable after the parallel trend test, PSM-DID, placebo test, and the test of excluding alternative explanations. Extended analyses find that the innovation incentive effect of digital transformation will enhance corporate value in the later stage.
The contribution of this paper is that based on enterprise micro data, it looks into the economic effects of digitalization from the perspective of innovation and reveals the innovation incentive effect of corporate digitalization, which enriches research on digital transformation and impactful elements of corporate innovation. Furthermore, this paper theoretically analyzes and empirically tests the moderating effect of the top management team (TMT) heterogeneity on the influence of digital transformation on corporate innovation, which further enriches relevant research. In addition, our findings not only contribute to the advancement of the study of digital transformation, but also offer theoretical support and useful advice for furthering corporate digitalization and upgrading the mechanism for creative growth.
There is a possible limitation of this paper that must be acknowledged. Since only manufacturing companies are subject to the policy of “Integration of Informatization and Industrialization”, a sample of manufacturing companies was chosen to test the study model. If the results are transferable to other sectors of the economy, more studies need to be done.
Author Contributions
Q.Z. and M.Y. contributed to this work. Conceptualization, Q.Z.; Data curation, Q.Z.; Funding acquisition, Q.Z.; Investigation, Q.Z.; Methodology, Q.Z.; Project administration, Q.Z.; Resources, Q.Z.; Software, Q.Z.; Supervision, Q.Z. and M.Y.; Validation, Q.Z.; Visualization, Q.Z.; Writing—original draft, Q.Z. All authors have read and agreed to the published version of the manuscript.
Funding
This research was funded by MOE (Ministry of Education in China) Project of Humanities and Social Sciences-Youth Fund Program (22YJC790165), Shandong Provincial Natural Science Foundation (ZR2022QG031), Social Science Planning Project of Shandong Province (21CKFJ13).
Institutional Review Board Statement
Not applicable.
Informed Consent Statement
Not applicable.
Data Availability Statement
Not applicable.
Conflicts of Interest
The authors declare no conflict of interest.
References
- Solow, R.M. A contribution to the theory of economic growth. Q. J. Econ. 1956, 70, 65–94. [Google Scholar] [CrossRef]
- Porter, M.E. Competitive Strategy: Techniques for Analyzing Industries and Competitors; Free Press: New York, NY, USA, 1980. [Google Scholar]
- Li, H.; Li, J. Top management team conflict and entrepreneurial strategy making in China. Asia Pac. J. Manag. 2009, 26, 263–283. [Google Scholar] [CrossRef]
- Frynas, J.G.; Mol, M.J.; Mellahi, K. Management innovation made in China: Haier’s Rendanheyi. Calif. Manag. Rev. 2018, 61, 71–93. [Google Scholar] [CrossRef]
- Lanzolla, G.; Pesce, D.; Tucci, C.L. The digital transformation of search and recombination in the innovation function: Tensions and an integrative framework. J. Prod. Innov. Manag. 2021, 38, 90–113. [Google Scholar] [CrossRef]
- Li, L.; Su, F.; Zhang, W.; Mao, J.Y. Digital transformation by SME entrepreneurs: A capability perspective. Inf. Syst. J. 2018, 28, 1129–1157. [Google Scholar] [CrossRef]
- Wang, C.; Medaglia, R.; Zheng, L. Towards a typology of adaptive governance in the digital government context: The role of decision-making and accountability. Gov. Inf. Q. 2018, 35, 306–322. [Google Scholar] [CrossRef]
- Paulin, A.A. Informating public governance: Towards a basis for a digital ecosystem. In Open Government: Concepts, Methodologies, Tools, and Applications; Vienna University of Technology: Vienna, Austria, 2020; pp. 1534–1555. [Google Scholar]
- Morton, M.S. Corporation of the 1990s: Information Technology and Organizational Transformation; Oxford University Press: Oxford, UK, 1990. [Google Scholar]
- Nadkarni, S.; Prügl, R. Digital transformation: A review, synthesis and opportunities for future research. Manag. Rev. Q. 2021, 71, 233–341. [Google Scholar] [CrossRef]
- Nambisan, S.; Lyytinen, K.; Majchrzak, A.; Song, M. Digital Innovation Management: Reinventing innovation management research in a digital world. MIS Q. 2017, 41, 223–238. [Google Scholar] [CrossRef]
- Dushnitsky, G.; Lenox, M.J. When do incumbents learn from entrepreneurial ventures?: Corporate venture capital and investing firm innovation rates. Res. Policy 2005, 34, 615–639. [Google Scholar] [CrossRef]
- Coile, R.C., Jr. The digital transformation of health care. (Health Care Meets E-Commer.). Physician Exec. 2000, 26, 8–15. [Google Scholar]
- Smith, P.; Beretta, M. The gordian knot of practicing digital transformation: Coping with emergent paradoxes in ambidextrous organizing structures. J. Prod. Innov. Manag. 2021, 38, 166–191. [Google Scholar] [CrossRef]
- Caputo, A.; Pizzi, S.; Pellegrini, M.M.; Dabić, M. Digitalization and business models: Where are we going? A science map of the field. J. Bus. Res. 2021, 123, 489–501. [Google Scholar] [CrossRef]
- Gozman, D.; Willcocks, L. The emerging Cloud Dilemma: Balancing innovation with cross-border privacy and outsourcing regulations. J. Bus. Res. 2019, 97, 235–256. [Google Scholar] [CrossRef]
- Warner, K.S.R.; Wäger, M. Building dynamic capabilities for digital transformation: An ongoing process of strategic renewal. Long Range Plan. 2019, 52, 326–349. [Google Scholar] [CrossRef]
- Amit, R.; Zott, C. Creating Value Through Business Model Innovation. MIT Sloan Manag. Rev. 2012, 53, 36–44. [Google Scholar]
- Sedera, D.; Lokuge, S.; Grover, V.; Sarker, S.; Sarker, S. Innovating with enterprise systems and digital platforms: A contingent resource-based theory view. Inf. Manag. 2016, 53, 366–379. [Google Scholar] [CrossRef]
- Nambisan, S.; Wright, M.; Feldman, M. The digital transformation of innovation and entrepreneurship: Progress, challenges and key themes. Res. Policy 2019, 48, 103773. [Google Scholar] [CrossRef]
- Sambamurthy, V.; Bharadwaj, A.; Grover, V. Shaping agility through digital options: Reconceptualizing the role of information technology in contemporary firms. MIS Q. 2003, 27, 237–263. [Google Scholar] [CrossRef]
- Esposito De Falco, S.; Renzi, A.; Orlando, B.; Cucari, N. Open collaborative innovation and digital platforms. Prod. Plan. Control 2017, 28, 1344–1353. [Google Scholar] [CrossRef]
- Majchrzak, A.; Markus, M.L.; Wareham, J. Designing for digital transformation. MIS Q. 2016, 40, 267–278. [Google Scholar] [CrossRef]
- Patel, K.; McCarthy, M.P. Digital Transformation: The Essentials of E-Business Leadership; McGraw-Hill Professional: New York, NY, USA, 2000. [Google Scholar]
- DeMark, E.F.; Harcourt, R.R. Companies must adapt to the Internet to survive. CPA J. 2004, 74, 9. [Google Scholar]
- Clohessy, T.; Acton, T.; Morgan, L. The impact of cloud-based digital transformation on IT service providers: Evidence from focus groups. Int. J. Cloud Appl. Comput. 2017, 7, 1–19. [Google Scholar] [CrossRef]
- Westerman, G.; Calméjane, C.; Bonnet, D.; Ferraris, P.; McAfee, A. Digital Transformation: A roadmap for billion-dollar organizations. MIT Cent. Digit. Bus. Capgemini Consult. 2011, 1, 1–68. [Google Scholar]
- Bhattacharya, U.; Hsu, P.H.; Tian, X.; Xu, Y. What affects innovation more: Policy or policy uncertainty? J. Financ. Quant. Anal. 2017, 52, 1869–1901. [Google Scholar] [CrossRef]
- Hasan, I.; Hoi, C.K.S.; Wu, Q.; Zhang, H. Is social capital associated with corporate innovation? Evidence from publicly listed firms in the US. J. Corp. Financ. 2020, 62, 101623. [Google Scholar] [CrossRef]
- Czarnitzki, D.; Hanel, P.; Rosa, J.M. Evaluating the impact of R&D tax credits on innovation: A microeconometric study on Canadian firms. Res. Policy 2011, 40, 217–229. [Google Scholar]
- Atanassov, J.; Liu, X. Can corporate income tax cuts stimulate innovation? J. Financ. Quant. Anal. 2020, 55, 1415–1465. [Google Scholar] [CrossRef]
- Chen, S.S.; Kao, W.C.; Wang, Y. Tax policy and innovation performance: Evidence from enactment of the alternative simplified credit. J. Bank. Financ. 2021, 125, 106081. [Google Scholar] [CrossRef]
- Bronzini, R.; Piselli, P. The impact of R&D subsidies on firm innovation. Res. Policy 2016, 45, 442–457. [Google Scholar]
- Gao, Y.; Hu, Y.; Liu, X.; Zhang, H. Can public R&D subsidy facilitate firms’ exploratory innovation? The heterogeneous effects between central and local subsidy programs. Res. Policy 2021, 50, 104221. [Google Scholar]
- Ayyagari, M.; Demirgüç-Kunt, A.; Maksimovic, V. Firm innovation in emerging markets: The role of finance, governance, and competition. J. Financ. Quant. Anal. 2011, 46, 1545–1580. [Google Scholar] [CrossRef]
- Chakravarty, A.; Grewal, R. Analyst earning forecasts and advertising and R&D budgets: Role of agency theoretic monitoring and bonding costs. J. Mark. Res. 2016, 53, 580–596. [Google Scholar]
- Guo, B.; Pérez-Castrillo, D.; Toldrà-Simats, A. Firms’ innovation strategy under the shadow of analyst coverage. J. Financ. Econ. 2019, 131, 456–483. [Google Scholar] [CrossRef]
- Bushee, B.J. The influence of institutional investors on myopic R&D investment behavior. Account. Rev. 1998, 73, 305–333. [Google Scholar]
- Luong, H.; Moshirian, F.; Nguyen, L.; Tian, X.; Zhang, B. How do foreign institutional investors enhance firm innovation? J. Financ. Quant. Anal. 2017, 52, 1449–1490. [Google Scholar] [CrossRef]
- Chkir, I.; Hassan BE, H.; Rjiba, H.; Saadi, S. Does corporate social responsibility influence corporate innovation? International evidence. Emerg. Mark. Rev. 2021, 46, 100746. [Google Scholar] [CrossRef]
- Sunder, J.; Sunder, S.V.; Zhang, J. Pilot CEOs and corporate innovation. J. Financ. Econ. 2017, 123, 209–224. [Google Scholar] [CrossRef]
- Fong, E.A. Relative CEO underpayment and CEO behaviour towards R&D spending. J. Manag. Stud. 2010, 47, 1095–1122. [Google Scholar]
- Mazouz, K.; Zhao, Y. CEO incentives, takeover protection and corporate innovation. Br. J. Manag. 2019, 30, 494–515. [Google Scholar] [CrossRef]
- Cao, X.; Wang, Z.; Li, G.; Zheng, Y. The impact of chief executive officers’(CEOs’) overseas experience on the corporate innovation performance of enterprises in China. J. Innov. Knowl. 2022, 7, 100268. [Google Scholar] [CrossRef]
- Barker, V.L., III; Mueller, G.C. CEO characteristics and firm R&D spending. Manag. Sci. 2002, 48, 782–801. [Google Scholar]
- Yuan, R.; Wen, W. Managerial foreign experience and corporate innovation. J. Corp. Financ. 2018, 48, 752–770. [Google Scholar] [CrossRef]
- Minetti, R.; Murro, P.; Paiella, M. Ownership structure, governance, and innovation. Eur. Econ. Rev. 2015, 80, 165–193. [Google Scholar] [CrossRef]
- Sperber, S.; Linder, C. The impact of top management teams on firm innovativeness: A configurational analysis of demographic characteristics, leadership style and team power distribution. Rev. Manag. Sci. 2018, 12, 285–316. [Google Scholar] [CrossRef]
- Dezsö, C.L.; Ross, D.G. Does female representation in top management improve firm performance? A panel data investigation. Strateg. Manag. J. 2012, 33, 1072–1089. [Google Scholar] [CrossRef]
- Wally, S.; Baum, J.R. Personal and structural determinants of the pace of strategic decision making. Acad. Manag. J. 1994, 37, 932–956. [Google Scholar] [CrossRef]
- Hambrick, D.C.; Mason, P.A. Upper echelons: The organization as a reflection of its top managers. Acad. Manag. Rev. 1984, 9, 193–206. [Google Scholar] [CrossRef]
- Talke, K.; Salomo, S.; Rost, K. How top management team diversity affects innovativeness and performance via the strategic choice to focus on innovation fields. Res. Policy 2010, 39, 907–918. [Google Scholar] [CrossRef]
- Guo, B.; Pang, X.; Li, W. The role of top management team diversity in shaping the performance of business model innovation: A threshold effect. Technol. Anal. Strateg. Manag. 2018, 30, 241–253. [Google Scholar] [CrossRef]
- Muffatto, M.; Roveda, M. Product architecture and platforms: A conceptual framework. Int. J. Technol. Manag. 2002, 24, 1–16. [Google Scholar] [CrossRef]
- Brynjolfsson, E.; Hitt, L.M. Computing productivity: Firm-level evidence. Rev. Econ. Stat. 2003, 85, 793–808. [Google Scholar] [CrossRef]
- Subramaniam, M.; Youndt, M.A. The influence of intellectual capital on the types of innovative capabilities. Acad. Manag. J. 2005, 48, 450–463. [Google Scholar] [CrossRef]
- Mooi, E.A.; Frambach, R.T. Encouraging innovation in business relationships—A research note. J. Bus. Res. 2012, 65, 1025–1030. [Google Scholar] [CrossRef]
- Kulangara, N.P.; Jackson, S.A.; Prater, E. Examining the impact of socialization and information sharing and the mediating effect of trust on innovation capability. Int. J. Oper. Prod. Manag. 2016, 36, 1601–1624. [Google Scholar] [CrossRef]
- Li, D.; Shen, W. Can corporate digitalization promote green innovation? The moderating roles of internal control and institutional ownership. Sustainability 2021, 13, 13983. [Google Scholar] [CrossRef]
- Mingaleva, Z.; Shironina, E.; Lobova, E.; Olenev, V.; Plyusnina, L.; Oborina, A. Organizational Culture Management as an Element of Innovative and Sustainable Development of Enterprises. Sustainability 2022, 14, 6289. [Google Scholar] [CrossRef]
- Metz, D.; Ilieș, L.; Nistor, R.L. The Impact of Organizational Culture on Customer Service Effectiveness from a Sustainability Perspective. Sustainability 2020, 12, 6240. [Google Scholar] [CrossRef]
- Matinaro, V.; Liu, Y. Towards increased innovativeness and sustainability through organizational culture: A case study of a Finnish construction business. J. Clean. Prod. 2017, 142, 3184–3193. [Google Scholar] [CrossRef]
- Prendergast, C.; Stole, L. Impetuous youngsters and jaded old-timers: Acquiring a reputation for learning. J. Political Econ. 1996, 104, 1105–1134. [Google Scholar] [CrossRef]
- He, X.; Jiang, S. Does gender diversity matter for green innovation? Bus. Strategy Environ. 2019, 28, 1341–1356. [Google Scholar] [CrossRef]
- Horbach, J.; Jacob, J. The relevance of personal characteristics and gender diversity for (eco-) innovation activities at the firm-level: Results from a linked employer–employee database in Germany. Bus. Strategy Environ. 2018, 27, 924–934. [Google Scholar] [CrossRef]
- Post, C.; Rahman, N.; Rubow, E. Green governance: Boards of directors’ composition and environmental corporate social responsibility. Bus. Soc. 2011, 50, 189–223. [Google Scholar] [CrossRef]
- Herrmann, P.; Datta, D.K. Relationships between top management team characteristics and international diversification: An empirical investigation. Br. J. Manag. 2005, 16, 69–78. [Google Scholar] [CrossRef]
- Wiersema, M.F.; Bantel, K.A. Top management team demography and corporate strategic change. Acad. Manag. J. 1992, 35, 91–121. [Google Scholar] [CrossRef]
- Finkelstein, S. Power in top management teams: Dimensions, measurement, and validation. Acad. Manag. J. 1992, 35, 505–538. [Google Scholar] [CrossRef]
- Cannella, A.A., Jr.; Park, J.H.; Lee, H.U. Top management team functional background diversity and firm performance: Examining the roles of team member colocation and environmental uncertainty. Acad. Manag. J. 2008, 51, 768–784. [Google Scholar]
- Bunderson, J.S.; Sutcliffe, K.M. Comparing alternative conceptualizations of functional diversity in management teams: Process and performance effects. Acad. Manag. J. 2002, 45, 875–893. [Google Scholar] [CrossRef]
- Beck, T.; Levine, R.; Levkov, A. Big bad banks? The winners and losers from bank deregulation in the United States. J. Financ. 2010, 65, 1637–1667. [Google Scholar] [CrossRef]
- Hall, B.H.; Harhoff, D. Recent Research on the Economics of Patents. Annu. Rev. Econ. 2012, 4, 541–565. [Google Scholar] [CrossRef]
- Blau, P.M. Inequality and Heterogeneity: A Primitive Theory of Social Structure; Free Press: New York, NY, USA, 1977. [Google Scholar]
- Allison, P.D. Measures of Inequality. Am. Sociol. Rev. 1978, 43, 865–880. [Google Scholar] [CrossRef]
- Chen, T.; Harford, J.; Lin, C. Do analysts matter for governance? Evidence from natural experiments. J. Financ. Econ. 2015, 115, 383–410. [Google Scholar] [CrossRef]
- Chetty, R.; Looney, A.; Kroft, K. Salience and taxation: Theory and evidence. Am. Econ. Rev. 2009, 99, 1145–1177. [Google Scholar] [CrossRef]
- Guo, L.L.; Qu, Y.; Tseng, M.L. The interaction effects of environmental regulation and technological innovation on regional green growth performance. J. Clean. Prod. 2017, 162, 894–902. [Google Scholar] [CrossRef]
- Chen, Y.S. The driver of green innovation and green image—Green core competence. J. Bus. Ethics 2008, 81, 531–543. [Google Scholar] [CrossRef]
- Quan, X.F.; Yin, H.Y. Chinese short selling mechanism and corporate innovation: A natural experiment based on the step-by-step expansion of margin lending and short selling. Manag. World 2017, 1, 128–144. [Google Scholar]
- Lin, Z.F.; Long, X.X. Can Short-Selling Threat Motivate the Innovation of Chinese Firms? World Econ. 2019, 42, 126–150. [Google Scholar]
- Nanda, R.; Rhodes-Kropf, M. Investment cycles and startup innovation. J. Financ. Econ. 2013, 110, 403–418. [Google Scholar] [CrossRef]
Disclaimer/Publisher’s Note: The statements, opinions and data contained in all publications are solely those of the individual author(s) and contributor(s) and not of MDPI and/or the editor(s). MDPI and/or the editor(s) disclaim responsibility for any injury to people or property resulting from any ideas, methods, instructions or products referred to in the content. |
© 2023 by the authors. Licensee MDPI, Basel, Switzerland. This article is an open access article distributed under the terms and conditions of the Creative Commons Attribution (CC BY) license (https://creativecommons.org/licenses/by/4.0/).