Article

Predicting Soil Erosion Rate at Transboundary Sub-Watersheds in Ali Al-Gharbi, Southern Iraq, Using RUSLE-Based GIS Model

1
Department of Geology, College of Science, University of Basrah, Basrah 61007, Iraq
2
General Commission of Groundwater, Ministry of Water Resources, Baghdad 00964, Iraq
3
College of Engineering, University of Misan, Misan 62010, Iraq
4
Department of Geology and Geophysics, College of Science, King Saud University, Riyadh 11451, Saudi Arabia
5
Geological Engineering Department, Missouri University of Science and Technology, McNutt Hall, 1400 N. Bishop Ave, Rolla, MO 65401, USA
*
Authors to whom correspondence should be addressed.
Sustainability 2023, 15(3), 1776; https://doi.org/10.3390/su15031776
Submission received: 13 November 2022 / Revised: 2 January 2023 / Accepted: 12 January 2023 / Published: 17 January 2023
(This article belongs to the Section Sustainable Water Management)

Abstract

:
The empirical soil loss model, RUSLE, was used in conjunction with remotely sensed data and geographic information system technology to delineate the soil erosion and watershed priorities in terms of conservation practices at seven boundary sub-watersheds (labeled as SW-00, SW-01, …, SW-06) between Iraq and Iran in the district of Ali Al-Gharbi, southern Iraq. The six factors of the RUSLE model, i.e., the rainfall erosivity, the soil erodibility, the slope steepness length, the crop management, and management practice, were calculated or estimated using information from different data sources such as remotely sensed data and previous studies. The results revealed that the annual soil erosion loss ranges from 0 to 1890 (tons h−1 y−1) with an average of 0.66 (tons h−1 y−1). Values of soil erosion were classified into five classes: very low, low, moderate, high, and very high. The potential soil loss in the high and very high classes ranges from 14.84 to 1890 (tons h−1 y−1), and these classes occupy only 27 km2 of the study area, indicating that the soil loss is very low in the area being examined. In terms of the spatial distribution of soil loss, the northern and northeastern parts (mountains and hills) of the sub-watersheds where the slope is steeper are more likely to erode than the plain area in the southern and southeastern portions, indicating that slope, in addition to rainfall erosivity, has a dominant effect on the soil erosion rate. The study of soil erosion in the watersheds under consideration reveals that only the northern portions of the SW-00, SW-02, and SW-04 watersheds require high priority conservation plans; however, these portions are primarily located in mountain regions, making the implementation of conservation plans in these areas impractical. Due to low soil loss, other sub-watersheds, particularly SW-01, SW-03, SW-05, and SW-06, are given low priority.

1. Introduction

Landscape globally is facing significant environmental challenges such as extreme climate changes, droughts, floods, and intensive agriculture practices that cause soil erosion. A significant impact of these challenges will lead to deterioration of the soil and water quality within a watershed, and might subsequently influence the sustainability and productivity of watersheds. Environmental processes in a watershed are all interdependent where the change in one can influence the other. The process of soil erosion is the detachment and transport of soil particles due to erosion forces. The forces of erosion may be caused by wind, ice, or water, such as raindrops or surface runoff [1,2,3,4]. In addition to reducing soil fertility and soil degradation, soil erosion has a negative influence on the sustainability and productivity of agricultural areas, as well as biodiversity [5,6,7,8]. A decrease in soil fertility is also a consequence of soil erosion, which has caused water quality problems and a threat to sustainable agriculture [9].
Prioritizing watersheds is a procedure for identifying environmentally stressed sub-watersheds to take action for soil conservation. The process of prioritizing a watershed involves ranking different micro-watersheds in order of their treatment with suitable soil conservation measures [10]. Therefore, prioritizing sub-watersheds will help in their efficient adoption and allocation of resources on a priority basis [11]. The degradation of land is not the only consequence of erosion, it also directly impacts watershed health by affecting the quality and quantity of water. By carrying the loose soil with it, water causes erosion, reducing the storage capacity and life of reservoirs and dams [12] and directly affecting watershed health.
To quantify soil erosion, many empirical models suitable for ungagged basins were developed in the past. For instance, soil erosion models such as the Soil and Water Assessment Tool (SWAT) [13], EROSION 3D [14], universal soil loss equation (USLE) [15], or its revised version (RUSLE) [16] have been broadly applied around the world.
In recent years, the integration of the RUSLE model with geospatial modeling, geographic information systems, and satellite imagery data has led to its widespread use in assessing soil erosion on a regional scale in a cost-effective and accurate manner [17,18,19,20,21].
On the basis of the results of its simplified structure and ease of incorporating parameters, the RUSLE model was applied by many researchers to evaluate the most vulnerable zones for any basin. Moreover, these models can be utilized to identify the potential sediment sources and estimate the sediment volume [22,23,24,25,26]. For instance, the RUSLE model has been conducted to predict soil erosion by combining and extracting some parameters of this model with Google Earth Engine [27]. Alternatively, other studies have been conducted to evaluate soil erosion loss in different regions by utilizing remote sensing (RS) and Geographical Information System (GIS) techniques as well as using the empirical soil erosion model [28,29]. Likewise, the Gavrilovic model (Erosion Potential Method (EPM)) has been widely applied to predict and assess rates of soil erosion and sediment yields. To that end, automated workflows have been developed in GIS environment [30].
Soil erosion models provide useful information including soil erosion evaluation and monitoring for any wide area [31,32,33]. Therefore, the quality of the outputs for the models is variable depending on the difference in the computational approaches and the number of required inputs.
Given the economic significance of the Ali Al-Gharbi district, northern Mayan Governorate, southern Iraq, as a promising agricultural region and the likelihood of land degradation due to natural (soil erosion) and anthropogenic factors, this study area necessitates comprehensive studies to establish management practices and determine the priorities of the watersheds. Therefore, in this study, seven transboundary (between Iraq and Iran) sub-watersheds (transboundary sub-watersheds) were assessed to prioritize watersheds in terms of soil erosion using RUSLE model. The results of the RUSLE model were used as a guide to initiate conservation plans in the study area to protect land and agricultural areas. The spatiotemporal variation in soil erosion for the four years 2017, 2018, 2019, and 2020 were evaluated to determine how the temporal variation in soil erosion as a result of rainfall and LULC variation over the basin may influence watershed priority.

2. Materials and Methods
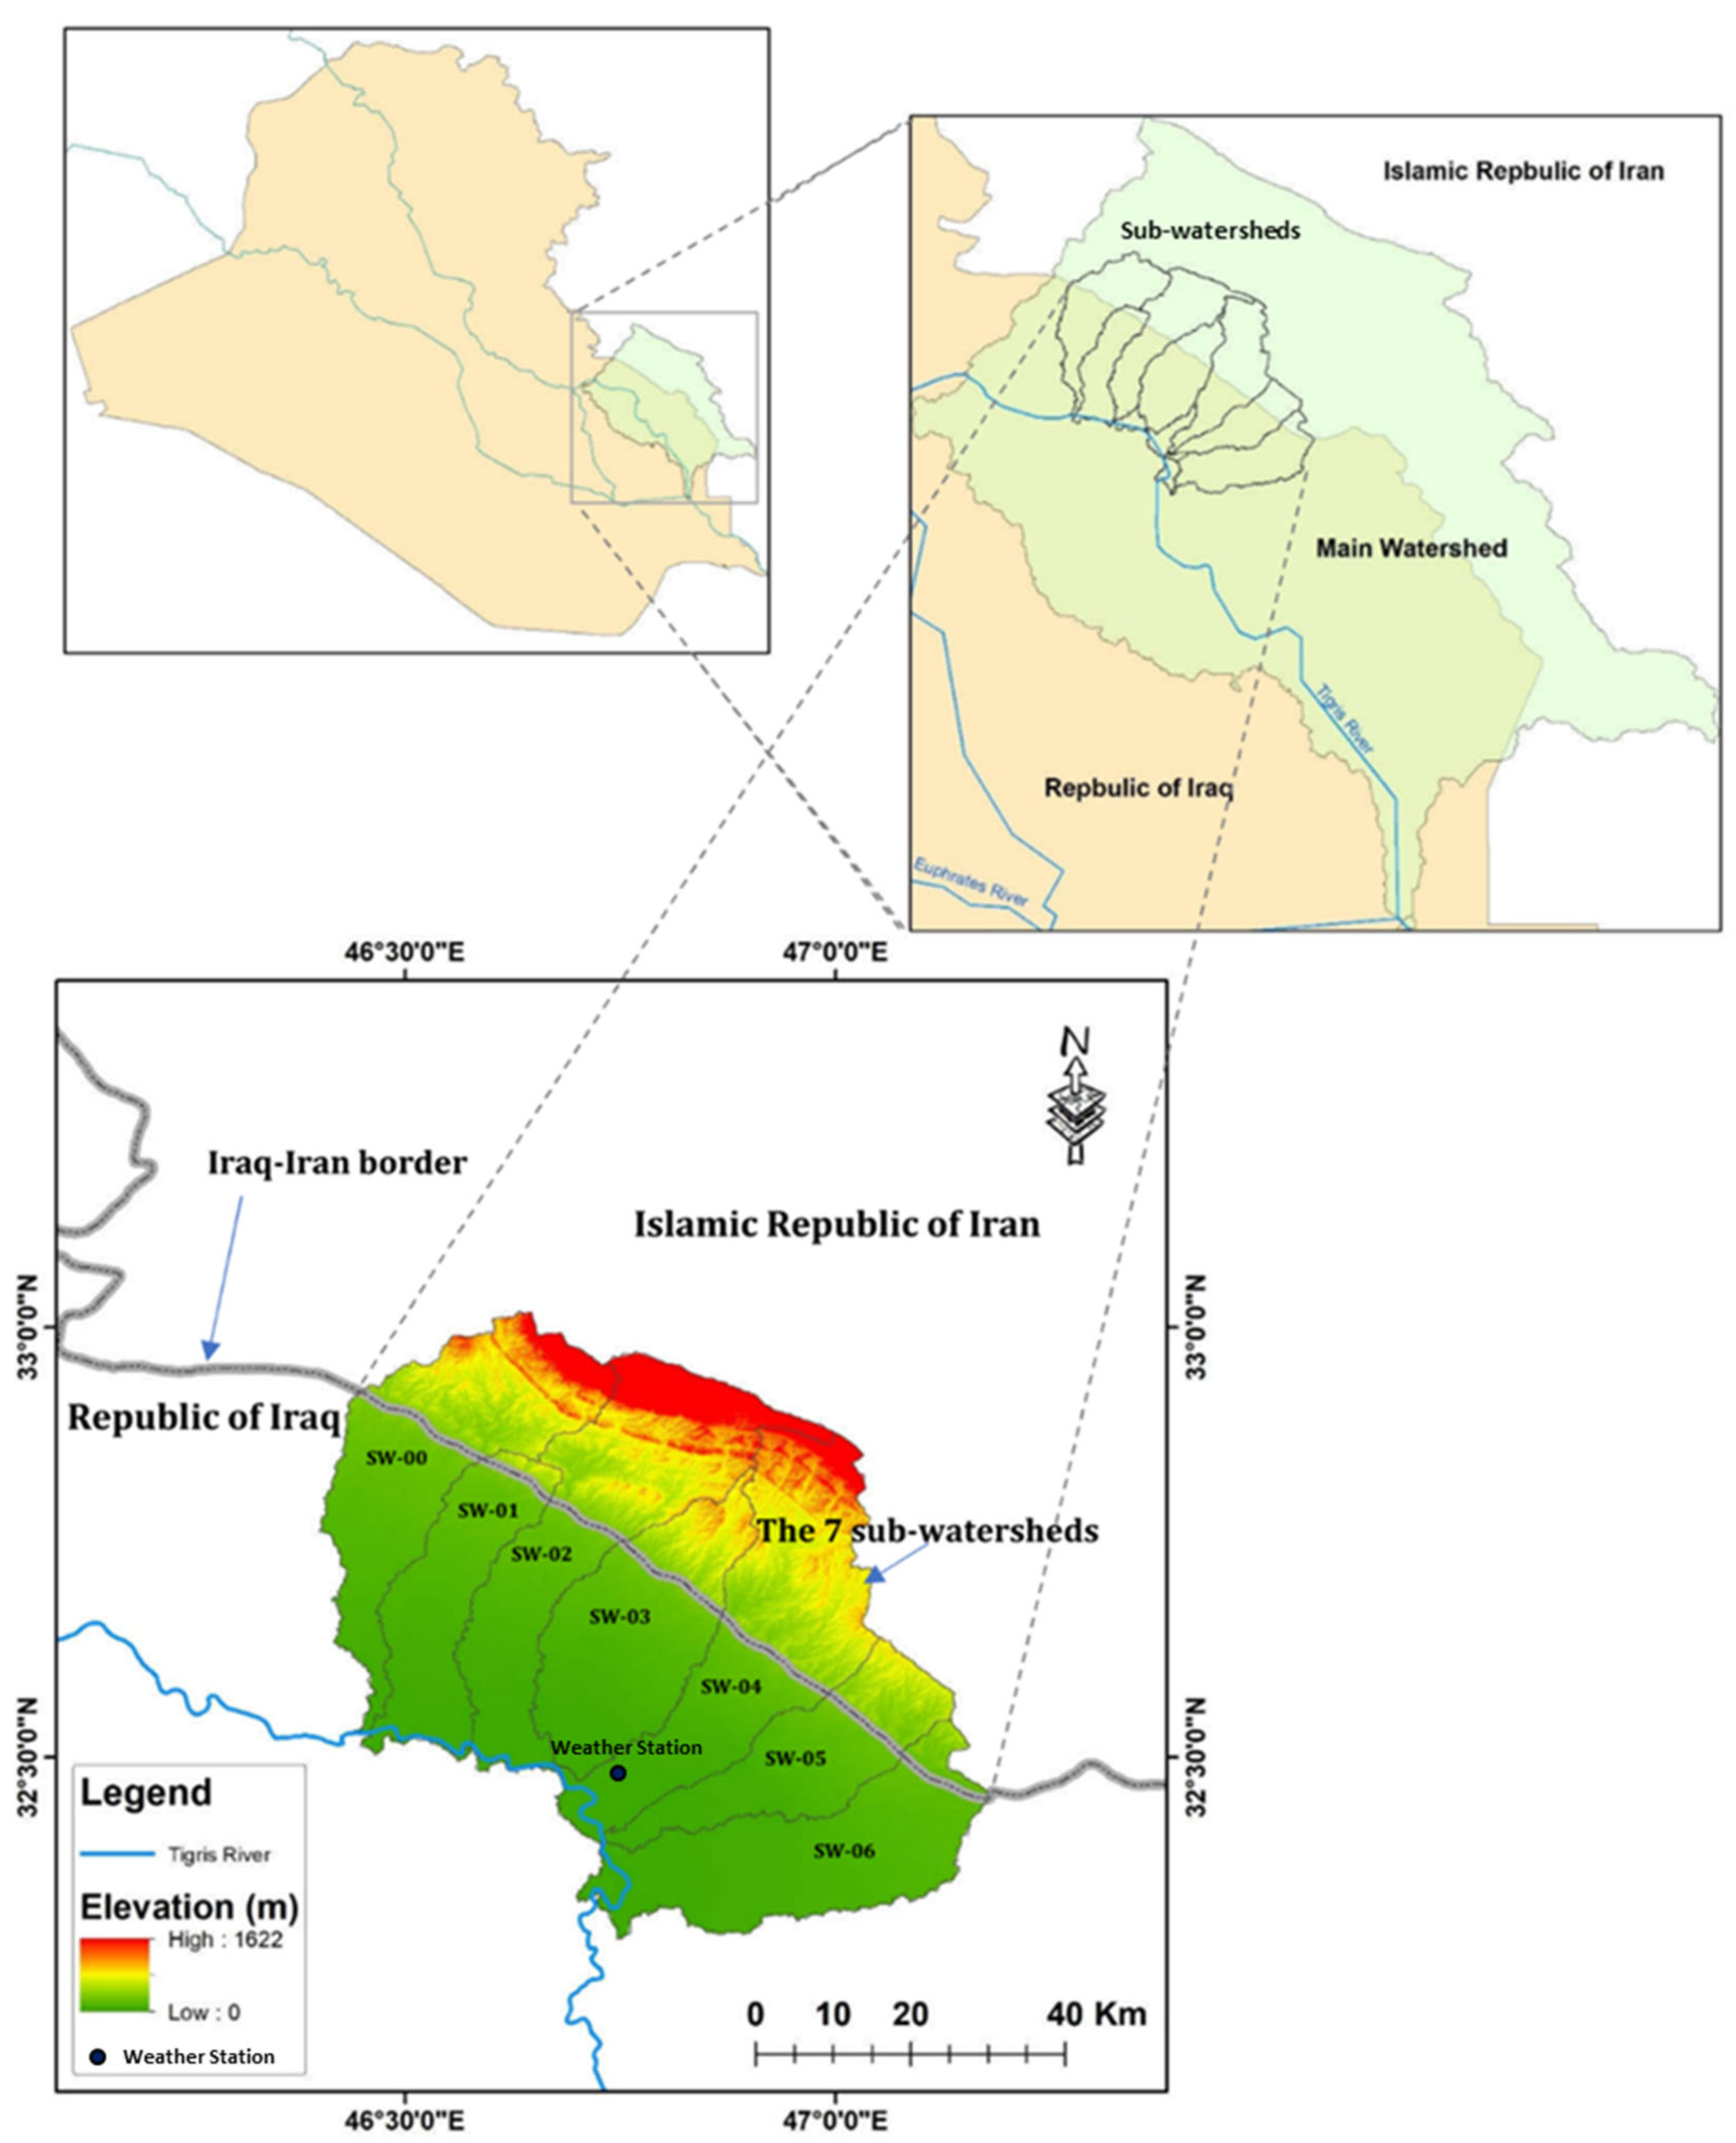
2.1. The Study Area

The seven sub-watersheds are located between Iraq and Iran and cover an area of approximately 3770 km2, (Figure 1). The main watershed spans a large portion of western Iran (Ilam province) and northeastern Maysan Governorate in Iraq. The study area contains several relatively large valleys as well as numerous smaller ones. The majority of these valleys, which flow eastward towards Iraq, are found in western Iran. The catchment area in Iraq is mostly flat land with elevations ranging from 25 m at the southeast end to 400 m at the international border. The Iranian portion of the basin, on the other hand, is comprised of high lands with elevations exceeding 2500 m. The majority of it is made up of hills and mountains, and the highest points of the mountains mark the division of the catchment area [34].
Subtropical desert climate (Köppen–Geiger type BWh) predominates in the watershed’s Iraqi portion, and hot semi-arid climate (Köppen–Geiger type BSh) predominates in the watershed’s Iranian portion. The average yearly temperature for Ali Al-Gharbi is 30.79 °C, which is 4.02 percent higher than the national average for Iraq. There are 32.41 rainy days on average each year, with annual precipitation totaling 16.85 mm. The sub- watershed’s most northern most region, Dehloran in Iran, experiences daytime highs of 19 °C and nighttime lows of 11 °C. A total of 20.48 mm of rain falls on average each year, and the humidity level is very close to 41%. According to the digital soil map of the world [35], the three main soil types in the study area are clay loam, loam, and sand, (Figure 2). For clay loam, loam, and sand, respectively, the three textures occupy 1257 km2 (33%), 2090 km2 (55%), and 423 km2 (11%) of total land area. The soil is highly permeable, resulting in high infiltration rates and low runoff, according to the distribution of loam and sand textures that belong to the B and A hydrological groups. The study area’s northern and eastern portions are covered in loam and sandy soils, while the middle and majority of the southern part are covered in clayey loam, suggesting that these regions are likely to experience runoff and flooding and thus more vulnerable to soil loss (Figure 2).
The Mesopotamian Foredeep basin and a small part of the Zagros fold belt cover most of the Iraqi portions of the research area, whereas the Zagros fold belt includes the Iranian region. The Mesopotamian Foredeep basin is an elongated epicontinental basin that formed over an earlier continental or migration basin [36]. It has buried structures such as folds, faults, and diapiric structures. The Zagros fold belt is a zone of deformed crustal rocks formed by the collision of the Arabian margin and the Eurasian plate following the closure of the Neo-Tethys Ocean during the Tertiary [37,38].

2.2. Techniques and Data Used

A wide selection of data were acquired from different sources as listed in Table 1. These include a digital elevation model (DEM SRTM) with horizontal datum (WGS 84) and vertical (EGM 96) of elevation data sets, crop management factor (C), Erosivity Database, land use, soil, as well as meteorological data. The geoprocessing tools within ArcGIS 10.8.1 software were applied to resample and calculate slope using elevation data with resolution (30 m × 30 m) of all original data.

3. Results

Water erosion occurs when soil particles are detached, transported, and deposited. Raindrops impacting the surface and water flowing over it are the major forces affecting water erosion. The factors affecting erosion can be calculated by using Equation (1) [39]:
E = f ( C ,   S ,   T ,   S S ,   M )
where E means erosion, C is climate, S is soil properties, T is topography, SS is soil surface conditions, and M is human activities.
RUSL is a function relationship expressed by Equation (2) [15]:
A = R · K · L S · C · P
where A is the average annual soil loss (tons ha−1 year−1), R is the rainfall erosivity (MJ mm ha−1 h−1 year−1), K is the soil erodibility factor (tons ha−1, h−1, MJ mm−1), LS is the slope length–steepness factor (dimensionless), C is the cropping management factor (dimensionless), and P is the practice support factor (dimensionless).
The RUSLE equation aims to guide conservation planning by providing methodical guidelines. With the aid of the equation, the planner is capable of predicting the average rate of soil erosion on any given site for every possible combination of cropping systems, management strategies, and erosion control measures.

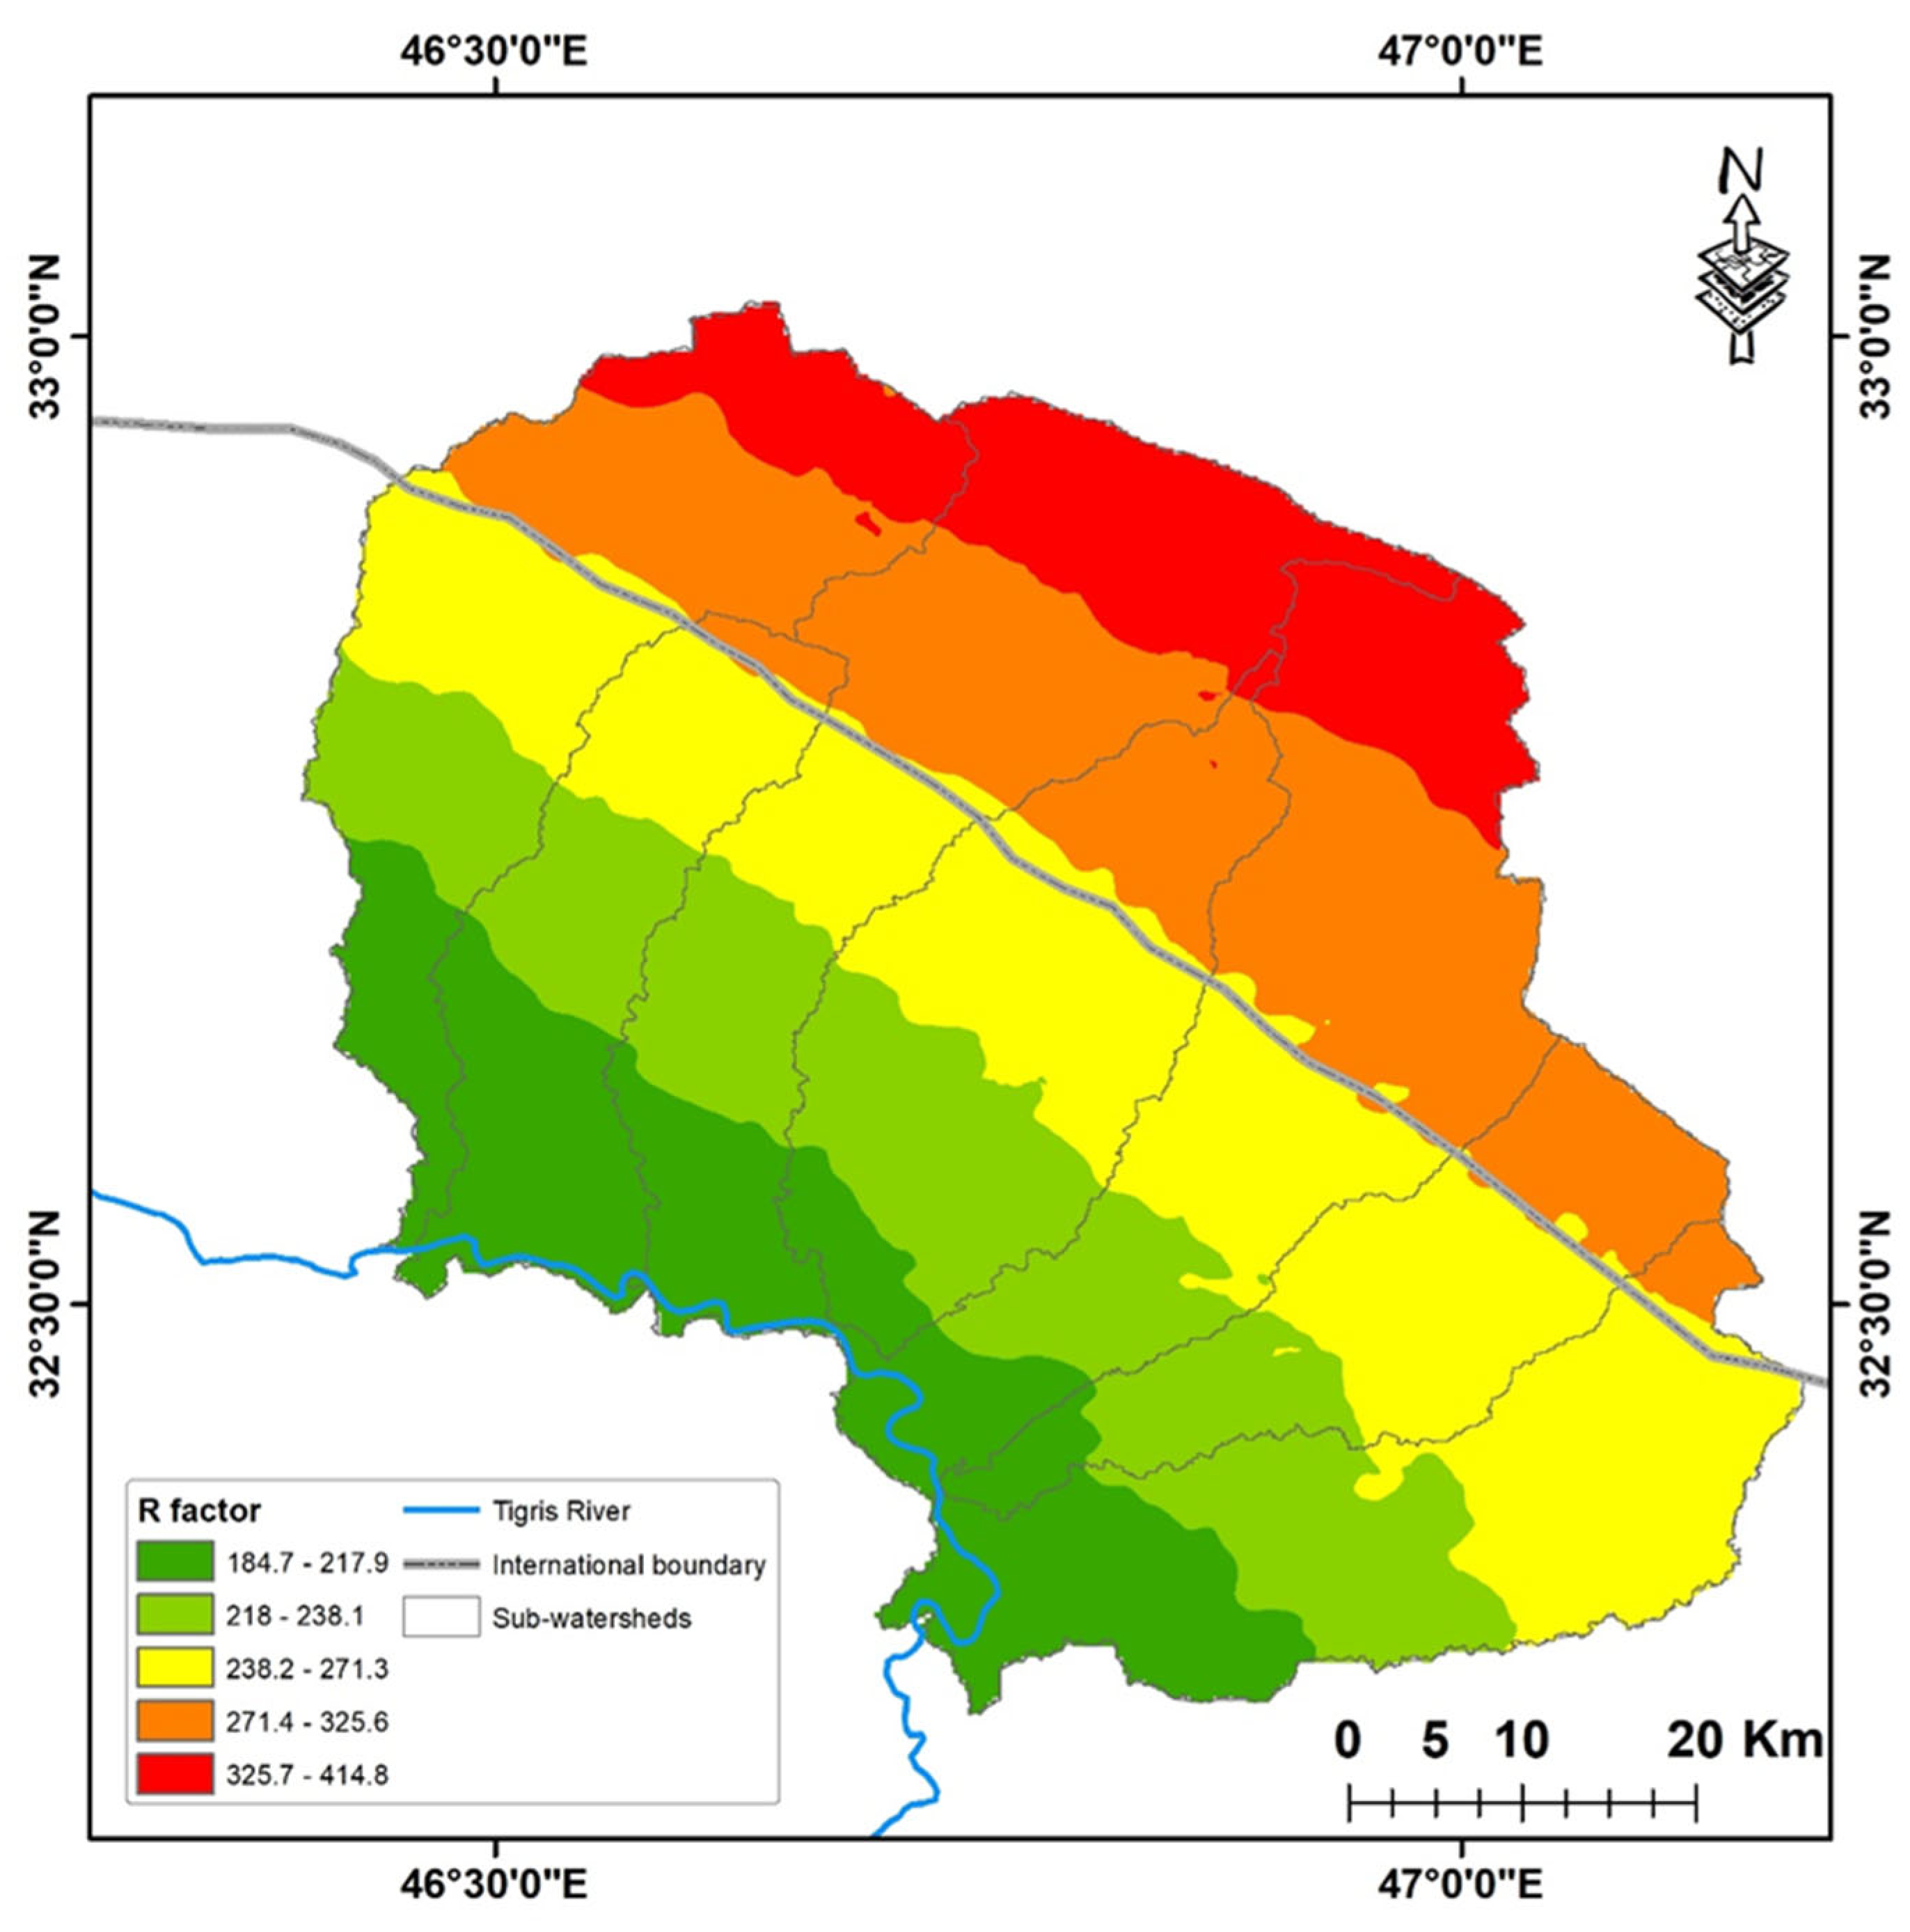
3.1. Rainfall Erosivity (R)

Basically, R is a measure of how much erosion rain could cause. R is the most crucial component for calculating erosion with RUSLE, according to a number of studies [15,40,41] and has a strong correlation with soil loss at many rain-station locations throughout the globe. It is defined as a product of the maximum intensity of rainfall over 30 min and the kinetic energy of a rainfall storm event [15]:
R = 1 n j = 1 n k = 1 m j ( E I 30 ) k
where n is the number of years included in the analysis, mj is the number of erosive events during year j, and EI30 (MJ mm ha−1 h−1) is the R for event k.
For a particular event, erosivity is calculated as follows:
E I 30 = ( r = 1 m e r · v r ) · I 30
where e r is the kinetic energy per unit of rainfall (MJ ha−1 mm−1); v r is the rainfall depth (mm) for the hydrograph’s time interval r; r is subdivided into m subintervals; I30 is the maximum rainfall intensity for a 30-min timeframe.
In ungagged watersheds such as the considered study area, Equations (3) and (4) require information rarely found. Therefore, in this study, the Global Rainfall Erosivity Database (GloREDa) [42] was used to map the R in the unit of (MJ mm ha−1 h−1 yr−1) over the study area. Approximately 3625 stations from 63 countries are included in the GloREDa to estimate the erosivity values as R-factors.
The global erosivity map of GeoTIFF format type at 1 km spatial resolution for the year 2017 is available for free download in the European Soil Data Center (ESDAC).
To obtain the spatial distribution of R in the study area, the global raster map of R was first downloaded from the previous website after completing a request form, and then extracted with a mask of the study area, reprojected, and then resampled to 30 m resolution in ArcMap 10.8.1 software (Esri Inc., Redlands, CA, USA).

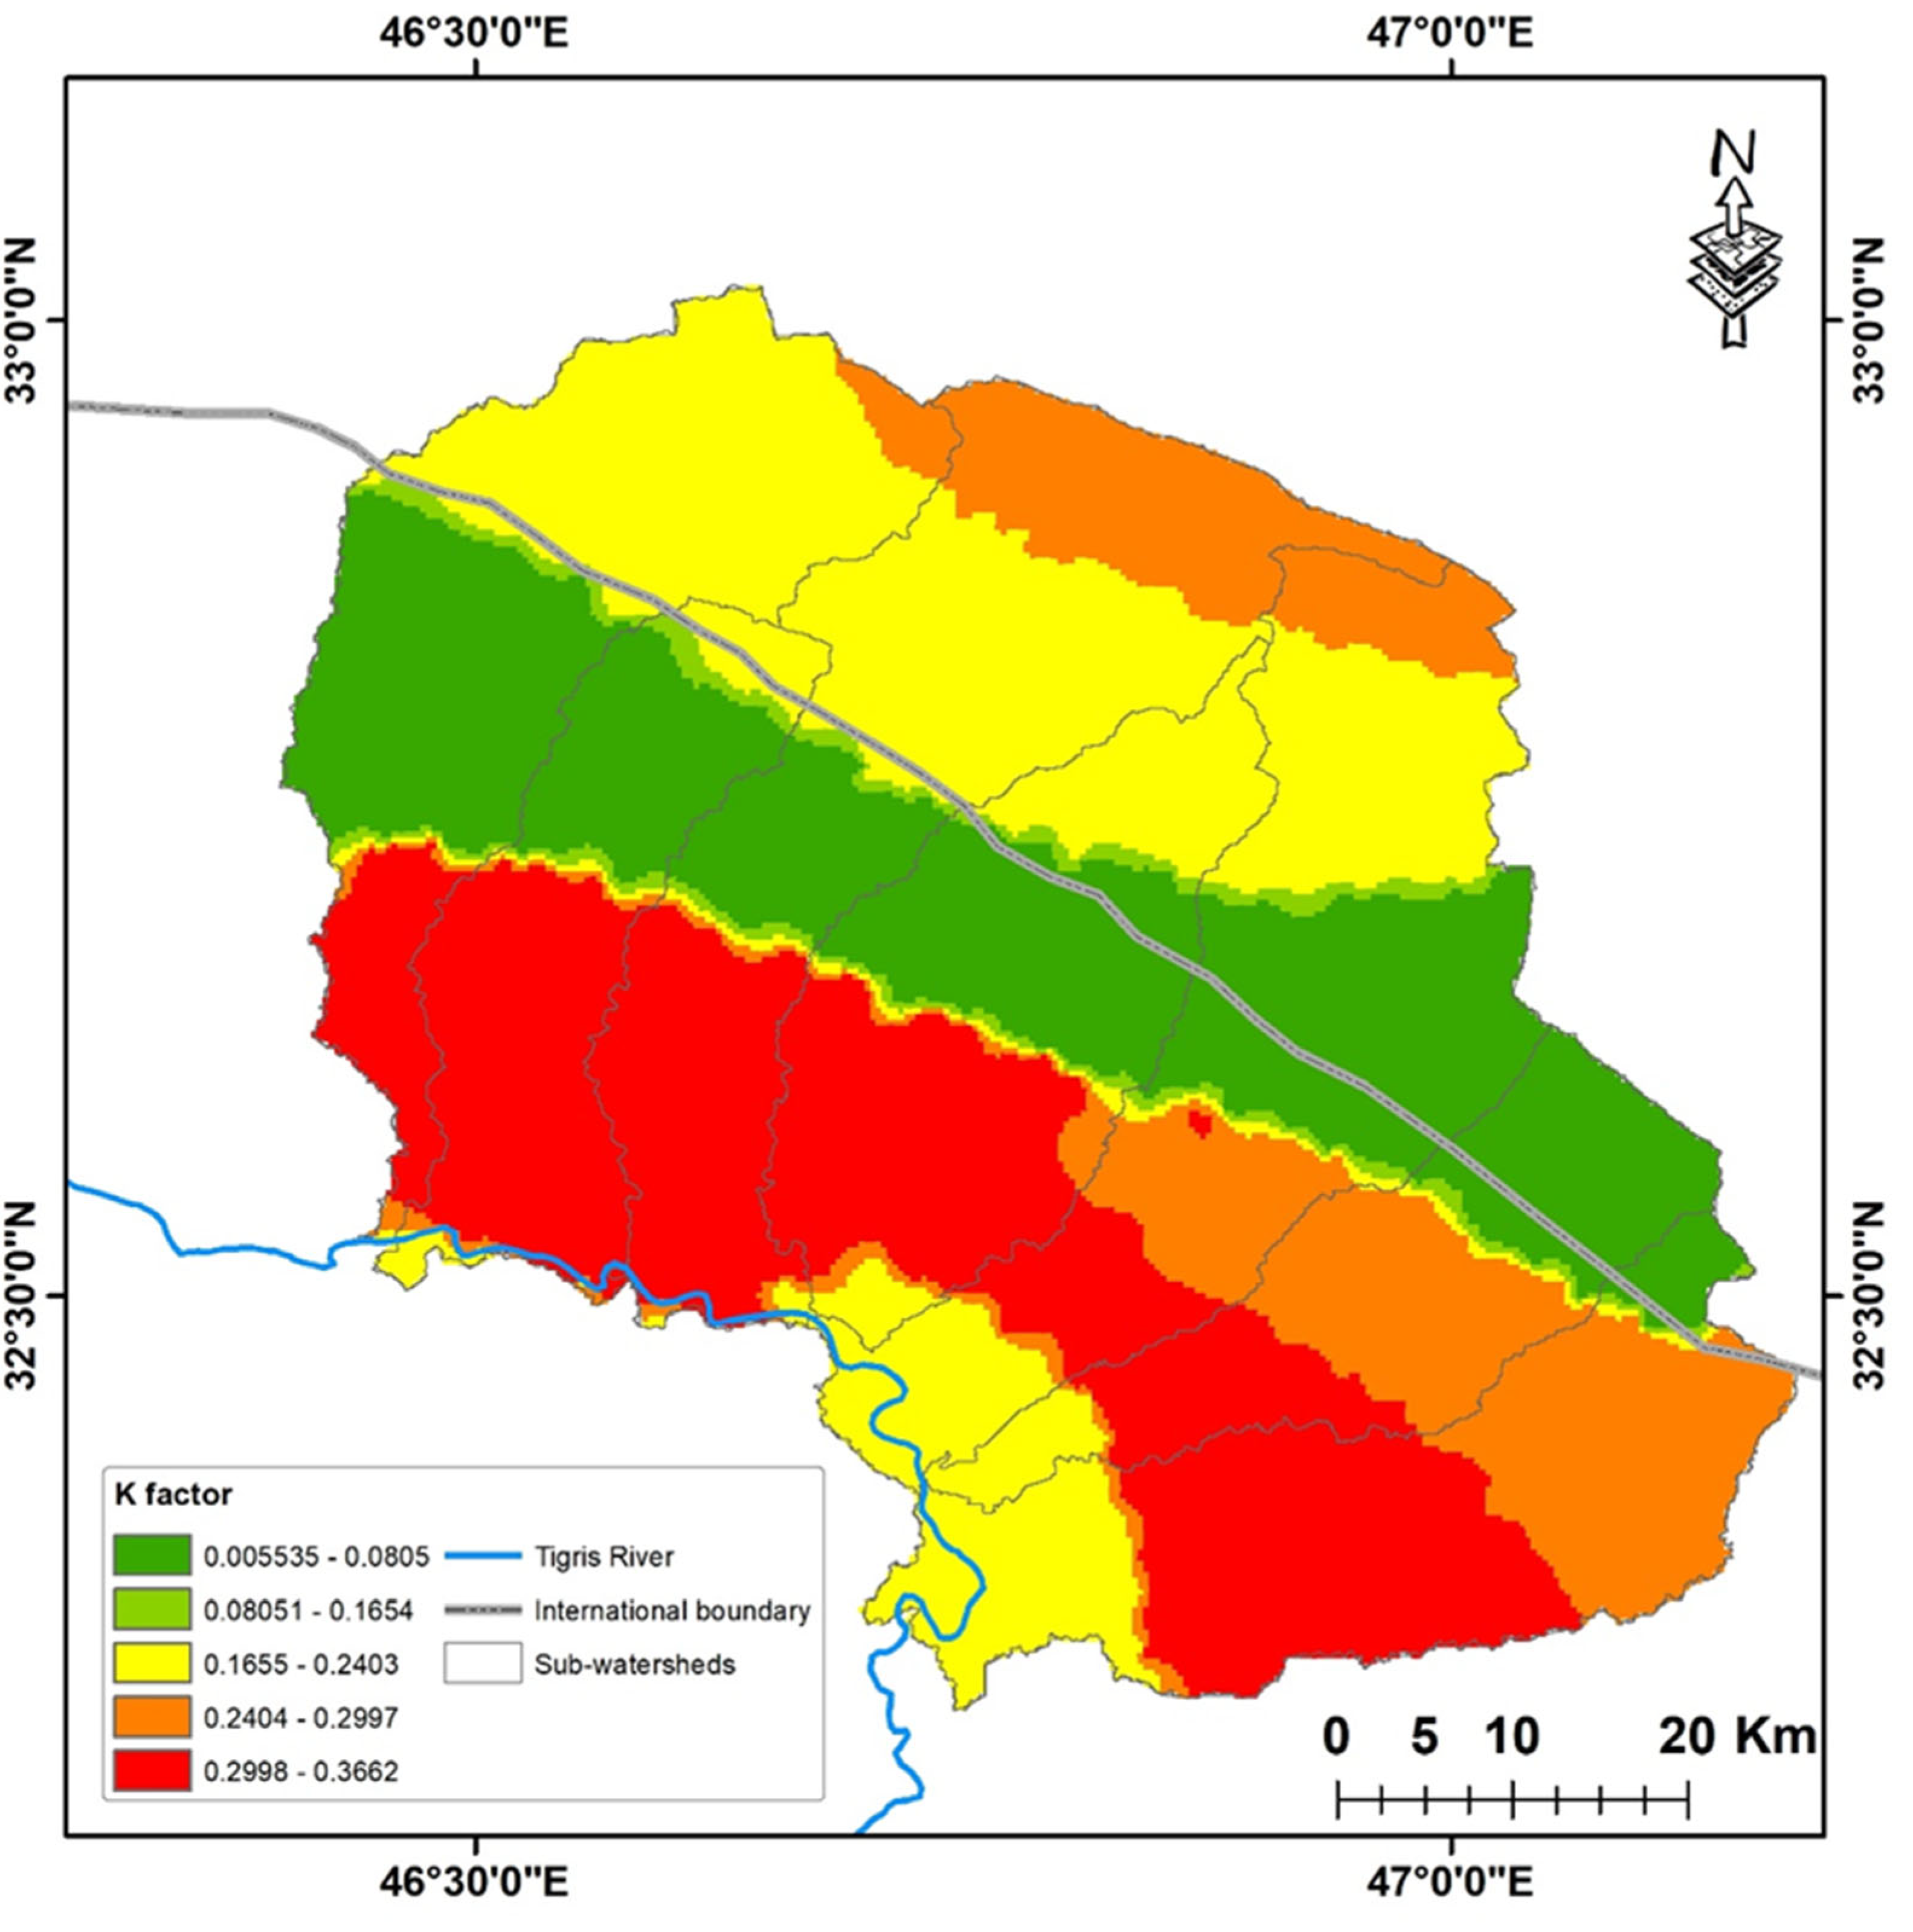
3.2. Soil Erodibility (K)

Basically, K is the degree to which a soil is erodible by raindrops and runoff. It is the product of the susceptibility of soil particles to erosion per unit of rain erosivity factor (R) for a specified soil on a unit plot, which is defined as a 22.13 m length of uniform 9% slope continuously in clean-tilled fallow [43]. Although soil texture is the main factor affecting K, organic matter, structure, and permeability are also important. The typical values of K are between 0.02 to 0.69 (tons ha−1, h−1, MJ mm−1). The K factor for the study area was estimated using the FAO global soil map [35] and its database in addition to the table provided by Roose (1996) [44], (Table 2).

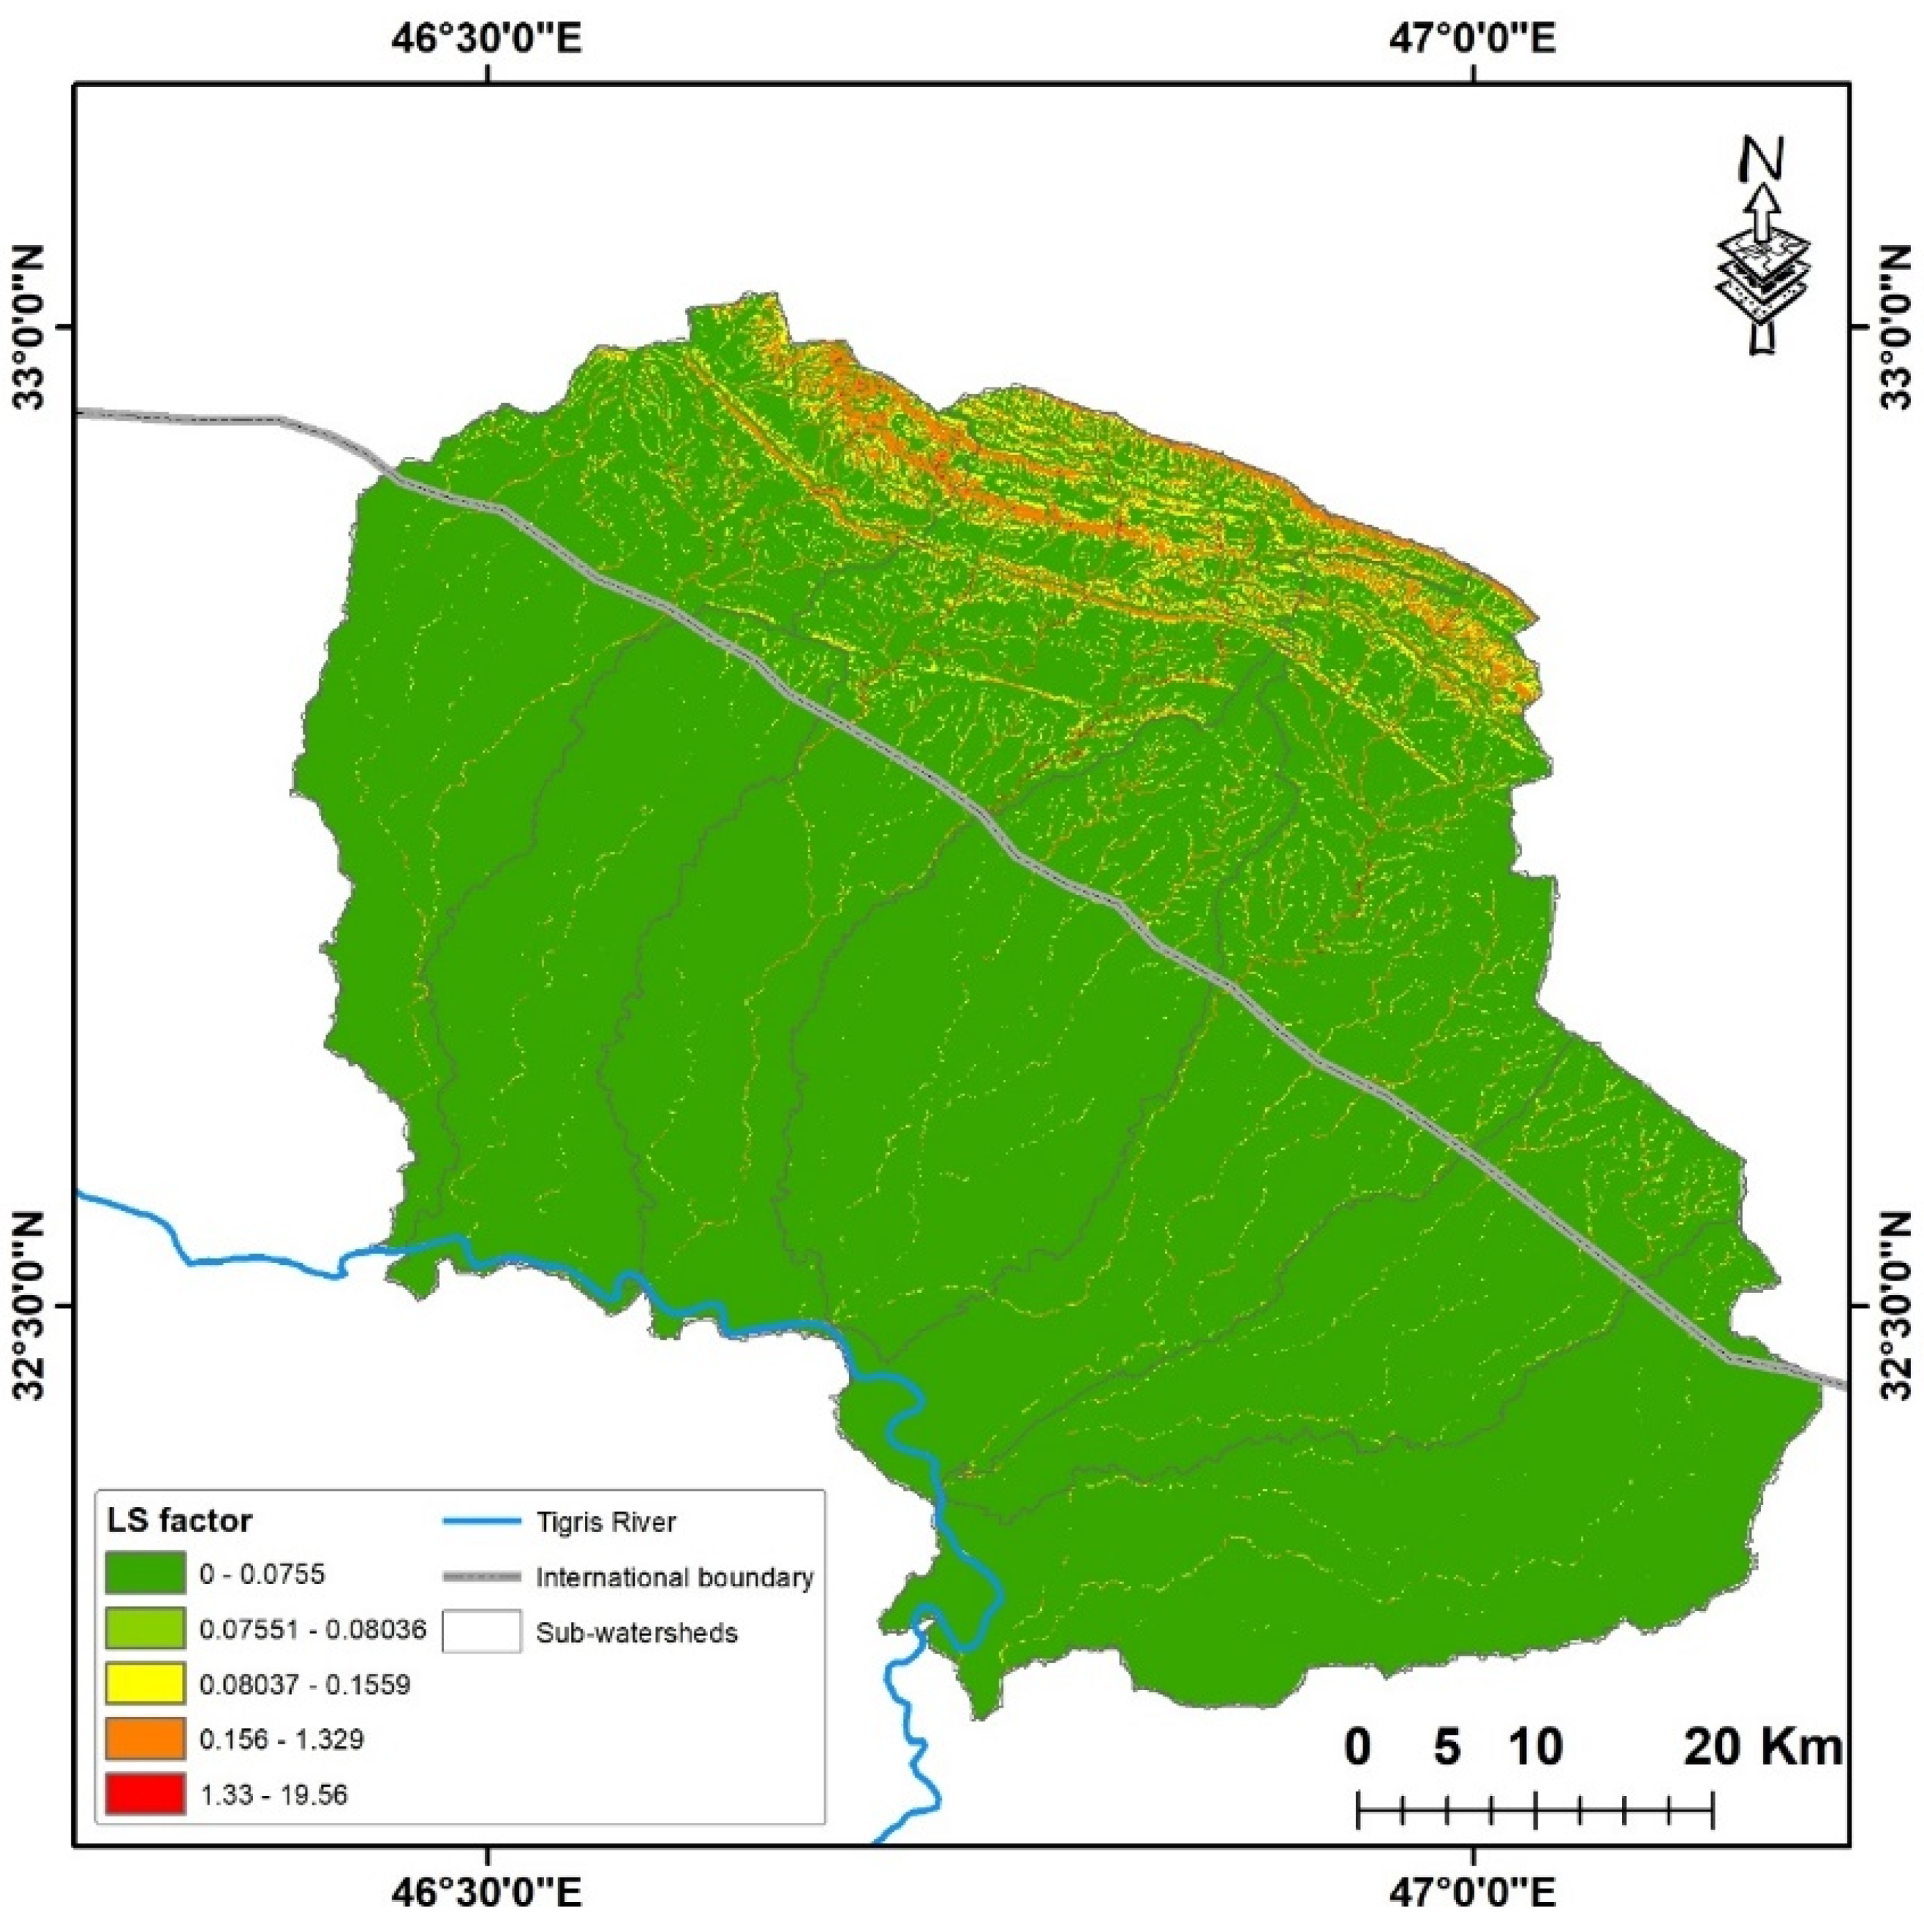
3.3. Topographic Factor

Topographic factors LS consists of slope length (L) and slope steepness (S). L, which is the ratio of soil loss from the field slope length to that from a 22.1 m length of the same soil type and gradient, is used to represent the influence of slope length on erosion [45]. It denotes the distance from the source of overland flow to the point of concentration or deposition. Due to the gradual accumulation of runoff downslope with increasing L, erosion increases. S, on the other hand, represents erosion due to slope steepness. It is defined as the ratio of soil loss caused by the field gradient to that caused by a 9% slope under otherwise similar circumstances [46]. It is more rapid for soil loss to increase with slope steepness than with slope length.
The easiest way to calculate LS is through using DEM and hydrologic analysis. The following equations were used to calculate L, S, and LS [45]:
L = [ ( F A × r a s t e r   c e l l   s i z e ) / 22.13 ] m
S = [ ( s i n β × 0.01745 ) / 0.09 ] n
L S = ( L × S ) / 100
where FA is flow accumulation layers produced by hydrologic analysis, cell size represents the DEM cell size, m ranges from 0.2–0.6, β is slope angle in %, and n ranges from 1.0–1.3.

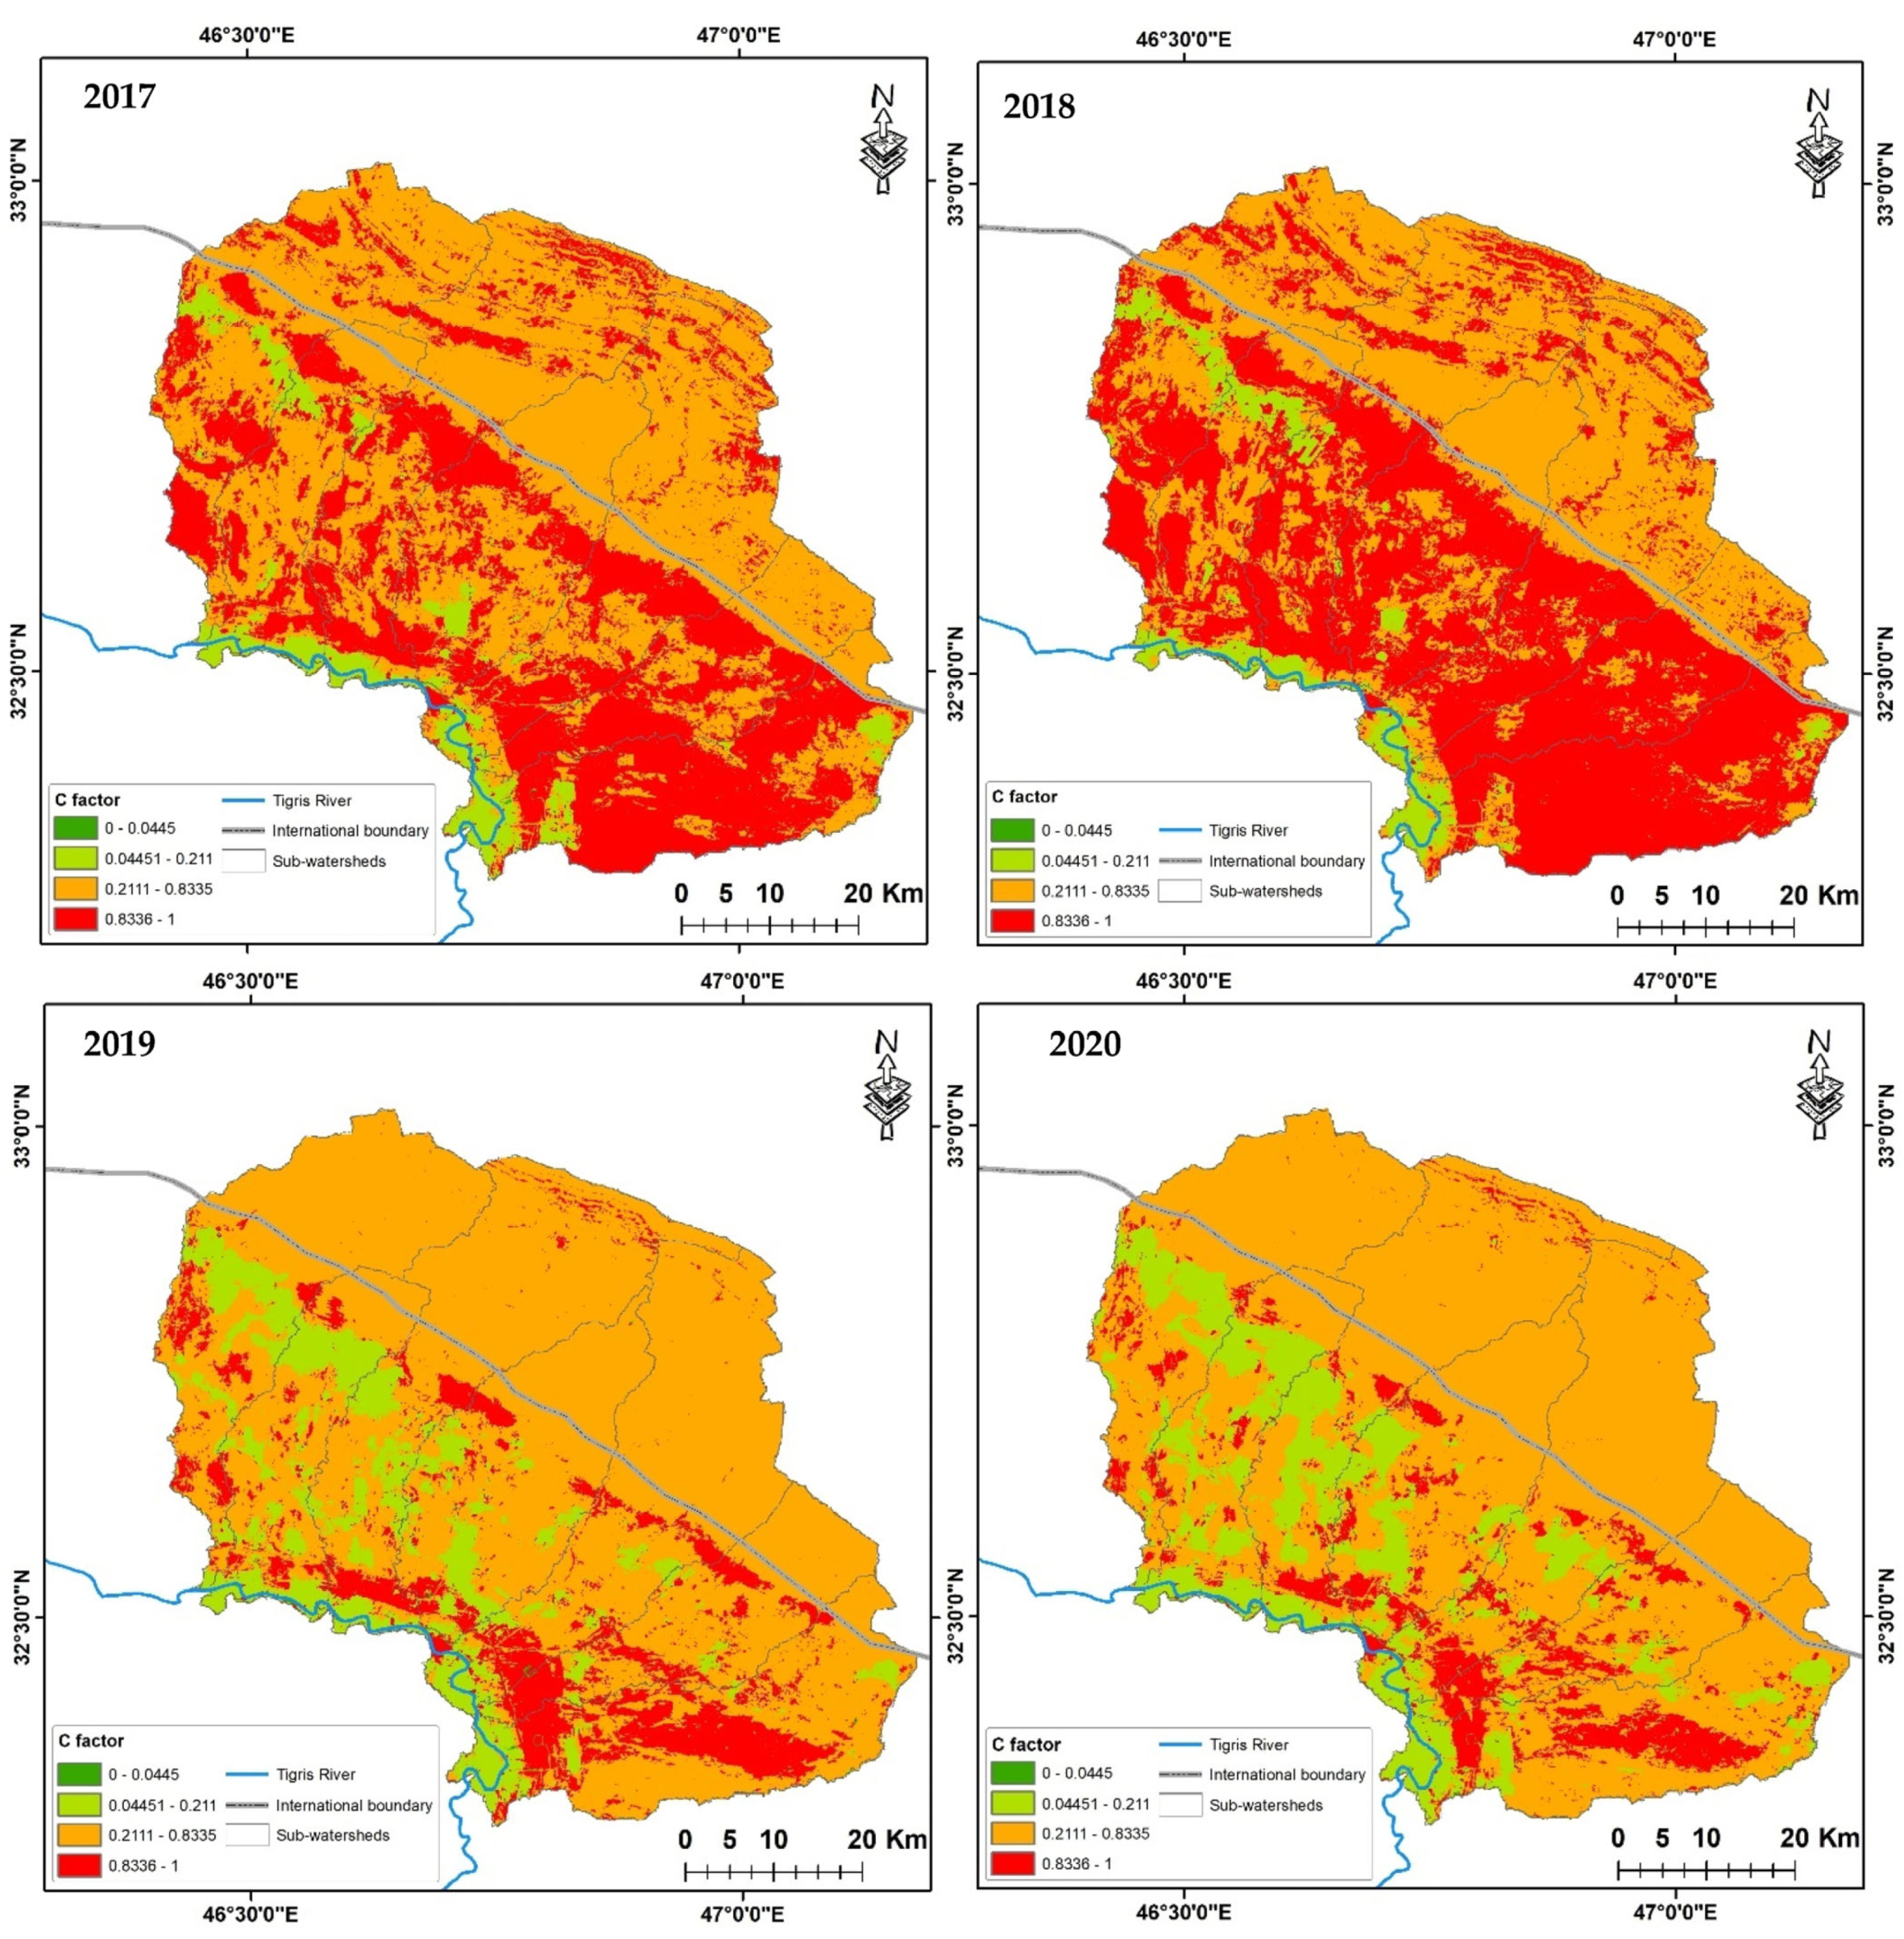
3.4. Crop Management Factor (C)

C factor refers to the ratio of soil loss from cultivated land compared to fallow, clean-tilled land in specified conditions [42,47]. The C factor will indicate how the conservation plan will contribute to soil loss and how that soil loss might be distributed over time. This factor describes the impact of vegetation and erosion control practices on soil loss. Its value ranges from 0 in water bodies to slightly greater than 1 in bare land [48]. In the present study, the C factor values have been assigned from already available studies such as the USLE fact sheet (http://www.omafra.gov.on.ca/english/engineer/facts/12-051.htm accessed on 18 April 2022), U.N, Food and Agriculture Organization (http://www.fao.org/docrep/T1765E/t1765e0c.htm accessed on 18 April 2022), and RUSLE handbook [49]. Table 3 shows the typical values of C factor for the LULC derived from ESRI 10 m sentinel data.

3.5. Practice Support Factor (P)

The ratio of soil loss at a site caused by surface conditions to soil loss from uphill and downhill cultivation is known as the P factor [42]. The lower the P value, the more effective the conservation measure at reducing soil erosion is thought to be. The P factor value is set to 1 for the entire study region because no data on management practices for the relevant area are available.

4. Discussion

The calculated rainfall erosivity (R) values range from 184 to 423 with an average of 626 (MJ mm ha−1 h−1 yr−1). Spatially, rainfall erosivity (R) increases from southwest toward northeast as shown in Figure 3. The low and moderate R values are distributed in the Iraqi portions of the watersheds, whereas the high and very high R values are located in the Iranian mountain parts of the watersheds. Specifically, the R factor strongly correlates with the decreasing trend of elevation and rainfall in the northern and eastern parts of the study area [50]. For each soil mapping unit, SNUM is a sequential number linking the soil information at the first level to the expansion file, the sequence of a sequential code ranges from 1 to 6999, some numbers have not been used.
As illustrated in Table 4, the estimated soil erodibility (K factor) values for the study area range from 0.04 to 0.33 with an average of 0.22 (tons ha−1 h−1 MJ mm−1). The spatial distribution of K in the study area is depicted in Figure 4, from which it can be concluded that low values of K are distributed in the study area’s center, while moderate and high values are concentrated in the northern and southern parts of the considered watersheds. Consequently, the middle parts of the study area are less likely to experience erosion than the rest of the study area. Therefore, K factor values reflect a compound relationship between soil physical properties and their impact on increasing soil erosion [51,52,53]. The type of DEM used to generate the LS factor for the purpose of this study was SRTM with a spatial resolution of 30 m. Based on the generated LS factor rater layer for the study area (Figure 5), it can be said that the northern regions of the study area are more vulnerable to soil erosion. However, soil erosion increases due to the gradual accumulation of runoff downslope with increasing slope length [54,55]. According to the calculated LS values, the study area is less prone to soil erosion except where the slopes are high in the mountains and hills. The C values for four node years (2017, 2018, 2019, and 2020) were mapped using Table 3 to show how the LULC variation affects the distribution of C over the study area (Figure 6). The C value range of (0.83–1) decreases as the years proceed, and lowest spatial extension of this range was found in the years 2019 and 2020 due to the dominance of the rangeland (shrub) class over bare ground and crop LULC classes. In many cases, the potential erosion of rangeland is changed with time due to either particular management practices or natural cyclic impacts such as growth during winter and spring [56,57].
To map soil erosion for the four node years, the raster calculator of ArcGIS 10.8.1 was used. The calculated soil erosion values (in tons h−1 y−1) for the four node years were classified into five classes using the natural break classification scheme [58]: very low, low, moderate, high, and very high. The natural breaks scheme is a data clustering method that determines the best classification of values by minimizing each class’s average deviation from the class mean while maximizing each class’s deviation from the means of the other groups. Based on the RUSLE model, the maximum yearly soil loss was estimated to be 1890 (tons h−1 y−1), for all node years, as shown in the results (Figure 7). In spite of the minor changes in C and the dominance of rangeland in the years 2019 and 2020 over bare ground and crop classes, soil loss remains the same and within the range 0–1890 (tons h−1 y−1). There was potential loss in two classes’ ranges from 14.84 to 1890 (tons h−1 y−1), and these classes occupy only 27 km2 of the study area, which indicates that the soil loss is very low in the area being examined. The highest risk for soil loss is in the northern portion of the study area because of the steep slopes. The high slope areas of the study area erode significantly more rapidly than the level areas in the southern part [59,60], and this may explain why soil erosion is relatively high there.
The study of soil erosion in the considered watersheds reveals that only the northern portions of the SW-00, SW-02, and SW-04 watersheds require high priority conservation plans; however, these portions are primarily located in mountain regions, making implementation of conservation plans in these areas impractical. Other sub-watersheds, particularly SW-01, SW-03, SW-05, and SW-06, are given low priority due to low soil loss.

5. Conclusions

This study demonstrated the use of the RUSLE soil loss model in conjunction with RS and GIS technologies to estimate the potential of soil erosion and priorities of transboundary of sub-watersheds at Northeastern Maysan Governorate, southern Iraq in terms of erosion conservation practices. The effects of changing LULS on erosion loss were also investigated. Results of the soil loss model indicate that the annual average loss range is 0–1890 (tons h−1 y−1). The amount of soil spatially varies significantly, with the northern and northeastern parts of the sub-watersheds inside the Iranian land (the mountain and steep slope areas) more prone to erosion than the plain southern and southwestern areas in the Iraqi land. Additionally, the results confirmed that the northern portions of the SW-00, SW-02, and SW-04 watersheds require high priority conservation plans; however, these portions are primarily located in mountainous areas, making it difficult to implement conservation plans there. Due to low soil loss, other sub-watersheds, such as SW-01, SW-03, SW-05, and SW-06, are given a low priority. The findings of this study also show that R and LS were the soil loss model factors affecting soil erosion more than other components.
It is suggested that future work include a more appropriate P factor and use more advanced and high-resolution satellite imagery to reveal vegetation cover across the study area, which is a critical component for the prevention of soil loss and watershed priority against erosion. Additionally, the final soil loss model should include the gully erosion type to correct the spatial zone soil loss and suggest the right conversation plans.

Author Contributions

Collected the data and carried out the investigation, A.A.A.; project administration, and conceived and designed the study, A.M.A.-A.; software analyzed the data and funding acquisition, H.A.; writing—original draft preparation, A.M.A.-A.; writing—review and editing, F.K.J.; visualization, S.H. All authors have read and agreed to the published version of the manuscript.

Funding

This research was supported by the Researchers Supporting Project number (RSP2023R425): King Saud University, Riyadh, Saudi Arabia.

Institutional Review Board Statement

Not applicable.

Informed Consent Statement

Not applicable.

Data Availability Statement

No new data were created or analyzed in this study. Data sharing is not applicable to this article.

Acknowledgments

This study was funded by the Researchers Supporting Project number (RSP2023R425), King Saud University, Riyadh, Saudi Arabia. The authors are grateful for King Saud University for its financial support.

Conflicts of Interest

The authors declare no conflict of interest.

References

  1. Vahabi, J.; Nikkami, D. Assessing dominant factors affecting soil erosion using a portable rainfall simulator. Int. J. Sediment Res. 2008, 23, 376–386. [Google Scholar] [CrossRef]
  2. Borrelli, P.; Ballabio, C.; Panagos, P.; Montanarella, L. Wind erosion susceptibility of European soils. Geoderma 2014, 232, 471–478. [Google Scholar] [CrossRef]
  3. Lin, D.; Shi, P.; Meadows, M.; Yang, H.; Wang, J.; Zhang, G.; Hu, Z. Measuring compound soil erosion by wind and water in the eastern agro–pastoral Ecotone of northern China. Sustainability 2022, 14, 6272. [Google Scholar] [CrossRef]
  4. Fagbohun, B.J.; Anifowose, A.Y.; Odeyemi, C.; Aladejana, O.O.; Aladeboyeje, A.I. GIS-based estimation of soil erosion rates and identification of critical areas in Anambra sub-basin, Nigeria. Model. Earth Syst. Environ. 2016, 2, 159. [Google Scholar] [CrossRef] [Green Version]
  5. Gelder, B.; Sklenar, T.; James, D.; Herzmann, D.; Cruse, R.; Gesch, K.; Laflen, J. The Daily erosion project-daily estimates of water runoff, soil detachment, and erosion. Earth Surf. Process. Landf. 2017, 43, 1105–1117. [Google Scholar] [CrossRef]
  6. Ahmad, N.S.; Mustafa, F.B.; Muhammad Yusoff, S.; Didams, G. A systematic review of soil erosion control practices on the agricultural land in Asia. Int. Soil Water Conserv. Res. 2020, 8, 103–115. [Google Scholar] [CrossRef]
  7. Stefanidis, S.; Alexandridis, V.; Ghosal, K. Assessment of Water-Induced Soil Erosion as a Threat to Natura 2000 Protected Areas in Crete Island, Greece. Sustainability 2022, 14, 2738. [Google Scholar] [CrossRef]
  8. Orgiazzi, A.; Panagos, P. Soil biodiversity and soil erosion: It is time to get married. Glob. Ecol. Biogeogr. 2018, 27, 1155–1167. [Google Scholar] [CrossRef]
  9. Prasannakumar, V.; Vijith, H.; Abinod, S.; Geetha, N. Estimation of soil erosion risk within a small mountainous sub-watershed in Kerala, India, using revised universal soil loss equation (RUSLE) and geo-information technology. Geosci. Front. 2012, 3, 209–215. [Google Scholar] [CrossRef] [Green Version]
  10. Chowdary, V.M.; Chakraborthy, D.; Jeyaram, A.; Murthy, Y.V.; Sharma, J.R.; Dadhwal, V.K. Multi-criteria decision making approach for watershed prioritization using analytic hierarchy process technique and GIS. Water Resour. Manag. 2013, 27, 3555–3571. [Google Scholar] [CrossRef]
  11. Aher, P.; Adinarayana, J.; Gorantiwar, S. Quantification of morphometric characterization and prioritization for management planning in semi-arid tropics of India: A remote sensing and GIS approach. J. Hydrol. 2014, 511, 850–860. [Google Scholar] [CrossRef]
  12. Khan, M.; Gupta, V.; Moharana, P. Watershed prioritization using remote sensing and geographical information system: A case study from Guhiya, India. J. Arid. Environ. 2001, 49, 465–475. [Google Scholar] [CrossRef]
  13. Neitsch, S.L.; Arnold, J.G.; Kiniry, J.R.; Williams, J.R. Soil and Water Assessment Tool Theoretical Documentation Version; Texas Water Resources Institute: Holleman, TX, USA, 2009. [Google Scholar]
  14. Schmidt, J.; von Werner, M.; Michael, A. EROSION 2D/3D—A Computer Model to Simulate Water Erosion—Parameter Catalogue; Saxon State Institute for Agriculture: Freiberg, Germany, 1996; Volume II. (In German) [Google Scholar]
  15. Wischmeier, W.H.; Smith, D.D. Predicting Rainfall-Erosion Losses: A Guide to Conservation Planning; Agriculture Handbook #507; U.S. Department of Agriculture, U.S. Government Printing Office: Washington, DC, USA, 1978.
  16. Renard, K.G.; Ferreira, V.A. RUSLE model description and database sensitivity. J. Environ. Qual. 1993, 22, 458–466. [Google Scholar] [CrossRef]
  17. Wang, G.; Gertner, G.; Fang, S.; Anderson, A.B. Mapping multiple variables for predicting soil loss by Geostatistical methods with TM images and a slope map. Photogramm. Eng. Remote Sens. 2003, 69, 889–898. [Google Scholar] [CrossRef]
  18. Hoyos, N. Spatial modeling of soil erosion potential in a tropical watershed of the colombian Andes. CATENA 2005, 63, 85–108. [Google Scholar] [CrossRef]
  19. Terranova, O.; Antronico, L.; Coscarelli, R.; Iaquinta, P. Soil erosion risk scenarios in the Mediterranean environment using RUSLE and GIS: An application model for Calabria (southern Italy). Geomorphology 2009, 112, 228–245. [Google Scholar] [CrossRef]
  20. Mhangara, P.; Kakembo, V.; Lim, K.J. Soil erosion risk assessment of the Keiskamma catchment, South Africa using GIS and remote sensing. Environ. Earth Sci. 2011, 65, 2087–2102. [Google Scholar] [CrossRef]
  21. Atoma, H.; Suryabhagavan, K.V.; Balakrishnan, M. Soil erosion assessment using RUSLE model and GIS in Huluka watershed, central Ethiopia. Sustain. Water Resour. Manag. 2020, 6, 12. [Google Scholar] [CrossRef]
  22. Rahman, M.R.; Shi, Z.; Chongfa, C. Soil erosion hazard evaluation—An integrated use of remote sensing, GIS and statistical approaches with biophysical parameters towards management strategies. Ecol. Model. 2009, 220, 1724–1734. [Google Scholar] [CrossRef]
  23. Haiyan, F.; Liying, S. Modelling soil erosion and its response to the soil conservation measures in the Black soil catchment, northeastern China. Soil Tillage Res. 2017, 165, 23–33. [Google Scholar] [CrossRef]
  24. Lin, J.; Lin, Y.; Zhao, H.; He, H. Soil erosion processes and geographical differentiation in Shaanxi during 1980–2015. Sustainability 2022, 14, 10512. [Google Scholar] [CrossRef]
  25. Bai, L.; Wang, N.; Jiao, J.; Chen, Y.; Tang, B.; Wang, H.; Wang, Z. Soil erosion and sediment interception by check dams in a watershed for an extreme rainstorm on the Loess Plateau, China. Int. J. Sediment Res. 2020, 35, 408–416. [Google Scholar] [CrossRef]
  26. Eniyew, S.; Teshome, M.; Sisay, E.; Bezabih, T. Integrating RUSLE model with remote sensing and GIS for evaluation soil erosion in Telkwonz watershed, northwestern Ethiopia. Remote Sens. Appl. Soc. Environ. 2021, 24, 100623. [Google Scholar] [CrossRef]
  27. Wang, H.; Zhao, H. Dynamic changes of soil erosion in the Taohe river basin using the RUSLE model and Google Earth engine. Water 2020, 12, 1293. [Google Scholar] [CrossRef]
  28. Belayneh, M.; Yirgu, T.; Tsegaye, D. Potential soil erosion estimation and area prioritization for better conservation planning in Gumara watershed using RUSLE and GIS techniques’. Environ. Syst. Res. 2019, 8, 20. [Google Scholar] [CrossRef] [Green Version]
  29. Tadesse, T.B.; Tefera, S.A. Comparing potential risk of soil erosion using RUSLE and MCDA techniques in central Ethiopia. Model. Earth Syst. Environ. 2020, 7, 1713–1725. [Google Scholar] [CrossRef]
  30. Stefanidis, S.P.; Chatzichristaki, C.A.; Stefanidis, P.S. An ArcGIS Toolbox for Estimation and Mapping Soil Erosion. J. Environ. Prot. Ecol. 2021, 22, 689–696. [Google Scholar]
  31. Zhou, W.; Wu, B. Assessment of soil erosion and sediment delivery ratio using remote sensing and GIS: A case study of upstream Chaobaihe river catchment, north China. Int. J. Sediment Res. 2008, 23, 167–173. [Google Scholar] [CrossRef]
  32. Alexakis, D.D.; Hadjimitsis, D.G.; Agapiou, A. Integrated use of remote sensing, GIS and precipitation data for the assessment of soil erosion rate in the catchment area of “Yialias” in Cyprus. Atmos. Res. 2013, 131, 108–124. [Google Scholar] [CrossRef]
  33. Abdo, H.; Salloum, J. Spatial assessment of soil erosion in Alqerdaha basin (Syria). Model. Earth Syst. Environ. 2017, 3, 26. [Google Scholar] [CrossRef]
  34. Rahi, K.A.; Al-Madhhachi, A.T.; Al-Hussaini, S.N. Assessment of surface water resources of eastern Iraq. Hydrology 2019, 6, 57. [Google Scholar] [CrossRef]
  35. Sanchez, P.A.; Ahamed, S.; Carré, F.; Hartemink, A.E.; Hempel, J.; Vanlauwe, B.; Walsh, M.G.; Zhang, G.L. Digital Soil Map of the World. Science 2009, 25, 680–681. [Google Scholar] [CrossRef] [Green Version]
  36. Fouad, S.F.A. Tectonic and structural evolution of the Mesopotamia Foredeep, Iraq. Iraqi Bull. Geol. 2010, 2, 41–53. [Google Scholar]
  37. Falcon, N. Zagros mountains, Mesozoic-Cenozoic orogenic belts. Geol. Soc. 1974, 4, 199–211. [Google Scholar] [CrossRef]
  38. Le Garzic, E.; Vergés, J.; Sapin, F.; Saura, E.; Meresse, F.; Ringenbach, J. Evolution of the NW Zagros fold-and-Thrust belt in Kurdistan region of Iraq from balanced and restored crustal-scale sections and forward modeling. J. Struct. Geol. 2019, 124, 51–69. [Google Scholar] [CrossRef]
  39. Renard, K.G.; Foster, G.R. Soil conservation: Principles of erosion by water. Dryland Agric. 1983, 23, 155–176. [Google Scholar]
  40. Renard, K.G.; Freimund, J.R. Using monthly precipitation data to estimate the R-factor in the revised USLE. J. Hydrol. 1994, 157, 287–306. [Google Scholar] [CrossRef]
  41. Fu, G.; Chen, S.; McCool, D.K. Modeling the impacts of no-till practice on soil erosion and sediment yield with RUSLE, SEDD, and ArcView GIS. Soil Tillage Res. 2006, 85, 38–49. [Google Scholar] [CrossRef]
  42. Panagos, P.; Borrelli, P.; Meusburger, K.; Yu, B.; Klik, A.; Jae Lim, K.; Ballabio, C. Global rainfall erosivity assessment based on high-temporal resolution rainfall records. Sci. Rep. 2017, 7, 4175. [Google Scholar] [CrossRef] [Green Version]
  43. Wischmeier, W.H.; Smith, D.D. A Universal Soil-Loss Estimating Equation to Guide Conservation Form Planning. 7th Conger. Intern. Soil Sci. Soc. Trans. 1961, 1, 418–425. [Google Scholar]
  44. Roose, E. Land Husbandry: Components and Strategy; FAO: Rome, Italy, 1996. [Google Scholar]
  45. Moore, I.D.; Wilson, J.P. Length-slope factors for the revised universal soil loss equation: Simplified method of estimation. J. Soil Water Conserv. 1992, 47, 423–428. [Google Scholar]
  46. Moore, I.D.; Burch, G.J. Modelling erosion and deposition: Topographic effects. Trans. ASAE 1986, 29, 1624–1630. [Google Scholar] [CrossRef]
  47. Das, G. Hydrology and Soil Conservation Engineering: Including Watershed Management; PHI Learning Pvt: Delhi, India, 2008. [Google Scholar]
  48. Shalini Tirkey, A.; Pandey, A.; Nathawat, M. Use of satellite data, GIS and RUSLE for estimation of average annual soil loss in Daltonganj watershed of Jharkhand (India). J. Remote Sens. Technol. 2013, 1, 20–30. [Google Scholar] [CrossRef]
  49. Renard, K.G. Predicting Soil Erosion by Water: A Guide to Conservation Planning with the Revised Universal Soil Loss Equation (RUSLE); United States Government Printing: Washington, DC, USA, 1997.
  50. Namdar, F.; Mahmoudi, S.; Esmali Ouri, A.; Pazira, E. Investigating the effect of land use changes on soil erosion using RS-GIS and AHP-fuzzy based techniques (Case study: Qaresu watershed, Ardabil, Iran). Nexo Rev. Científica 2020, 33, 525–538. [Google Scholar] [CrossRef]
  51. Addis, H.K.; Klik, A. Predicting the spatial distribution of soil erodibility factor using USLE nomograph in an agricultural watershed, Ethiopia. Int. Soil Water Conserv. Res. 2015, 3, 282–290. [Google Scholar] [CrossRef]
  52. Benavidez, R.; Jackson, B.; Maxwell, D.; Norton, K. A review of the (Revised) universal soil loss equation ((R)USLE): With a view to increasing its global applicability and improving soil loss estimates. Hydrol. Earth Syst. Sci. 2018, 22, 6059–6086. [Google Scholar] [CrossRef] [Green Version]
  53. Doulabian, S.; Shadmehri Toosi, A.; Humberto Calbimonte, G.; Ghasemi Tousi, E.; Alaghmand, S. Projected climate change impacts on soil erosion over Iran. J. Hydrol. 2021, 598, 126432. [Google Scholar] [CrossRef]
  54. Zhang, H.; Yang, Q.; Li, R.; Liu, Q.; Moore, D.; He, P.; Geissen, V. Extension of a GIS procedure for calculating the RUSLE equation LS factor. Comput. Geosci. 2013, 52, 177–188. [Google Scholar] [CrossRef]
  55. Schmidt, S.; Tresch, S.; Meusburger, K. Modification of the RUSLE slope length and steepness factor (LS-factor) based on rainfall experiments at steep Alpine grasslands. MethodsX 2019, 6, 219–229. [Google Scholar] [CrossRef]
  56. Zhou, P.; Luukkanen, O.; Tokola, T.; Nieminen, J. Effect of vegetation cover on soil erosion in a mountainous watershed. CATENA 2008, 75, 319–325. [Google Scholar] [CrossRef]
  57. Fan, J.; Motamedi, A.; Galoie, M. Impact of C factor of USLE technique on the accuracy of soil erosion modeling in elevated mountainous area (case study: The Tibetan Plateau). Environ. Dev. Sustain. 2021, 23, 12615–12630. [Google Scholar] [CrossRef]
  58. Jenks, G.F. The data model concept in statistical mapping. Int. Yearb. Cart. 1967, 7, 186–190. [Google Scholar]
  59. El-Hassanin, A.; Labib, T.; Gaber, E. Effect of vegetation cover and land slope on runoff and soil losses from the watersheds of Burundi. Agric. Ecosyst. Environ. 1993, 43, 301–308. [Google Scholar] [CrossRef]
  60. Ziadat, F.M.; Taimeh, A.Y. Effect of rainfall intensity, slope, land use and antecedent soil moisture on soil erosion in an arid environment. Land Degrad. Dev. 2013, 24, 582–590. [Google Scholar] [CrossRef]
Figure 1. Location of the study area.
Sustainability 15 01776 g001
Figure 2. Soil texture map.
Sustainability 15 01776 g002
Figure 3. Map of rainfall erosivity in (MJ mm ha−1 h−1 yr−1).
Sustainability 15 01776 g003
Figure 4. Soil erodibility (K factor) (tons ha−1 h−1 MJ mm−1).
Sustainability 15 01776 g004
Figure 5. LS factor (dimensionless) map.
Sustainability 15 01776 g005
Figure 6. Spatial distribution of C factor for the node years.
Sustainability 15 01776 g006
Figure 7. Soil erosion maps for the four node years.
Sustainability 15 01776 g007
Table 1. List of data used in the current study.
Type of DataSpatial ResolutionSource
Digital Elevation Model (DEM)30 m × 30 mUSGS. http://earthexplorer.usgs.gov/ (accessed on 18 April 2022).
Crop Management Factor (C)-USLE fact sheet (http://www.omafra.gov.on.ca/english/engineer/facts/12-051.htm, accessed on 18 April 2022), U.N, Food and Agriculture Organization (http://www.fao.org/docrep/T1765E/t1765e0c.htm, accessed on 18 April 2022)
Rainfall Erosivity Factor (R)1 km × 1 kmEuropean Soil Data Center (ESDAC) (https://esdac.jrc.ec.europa.eu/content/global-rainfall-erosivity, accessed on 18 April 2022)
Land Use/Land Cover (LULC)10 m × 10 mSentinel-2 10m Land Use/Land Cover Time Series
https://www.arcgis.com/apps/mapviewer/index.html?layers=d3da5dd386d140cf93fc9ecbf8da5e31 (accessed on 18 April 2022)
Soil Erodibility Factor-Sanchez et al., 2009 [35]; https://www.fao.org/soils-portal/data-hub/soil-maps-and-databases/en/ (accessed on 18 April 2022)
Table 2. Estimating K based on soil texture and organic material content [44].
Textural ClassSoil CompositionMean K (Based on % Organic Material)
SandSiltClayUnknown<2%≥2%
Clay0–450–4040–1000.220.240.21
Sandy Clay45–650–2035–550.200.200.200
Silty Clay0–2040–6040–600.260.270.26
Sand68–1000–140–100.020.030.01
Sandy Loam50–700–500–200.130.140.12
Clay Loam20–4515–5227–400.300.330.28
Loam23–5228–507–270.300.340.26
Loamy Sand70–860–300–150.040.050.04
Sandy Clay Loam45–800–2820–350.200.200.20
Silty Clay Loam0–2040–7327–400.320.350.30
Silt0–2088–1000–120.380.410.37
Silty Loam20–5074–880–270.380.410.37
Note: the table in the FAO soil database accounts for % organic matter (OM), not just organic carbon (OC). The value of OC should be multiplied by 1.72 to obtain OM.
Table 3. LULC derived from ESRI 10 m sentinel data and associated C values.
LULC Class NumberClass NameC Value
1Water0
2Trees0.025
4Flooded Vegetation1
5Crops0.05
7Build Area1
8Bare Ground1
9Snow/ice0
10Clouds0
11Rangeland0.4
Table 4. K values for the study area.
Soil TextureSNUMSoil CompositionOMK
SandSiltClay
Loam31224039212.010.26
Clay31363746175.400.21
Clay325418612160.660.21
Loamy Sand3529861043.380.04
Clay Loam35544039212.010.28
Clay36272663111.970.33
Clay36343746175.400.21
Disclaimer/Publisher’s Note: The statements, opinions and data contained in all publications are solely those of the individual author(s) and contributor(s) and not of MDPI and/or the editor(s). MDPI and/or the editor(s) disclaim responsibility for any injury to people or property resulting from any ideas, methods, instructions or products referred to in the content.

