Article

Prediction and Early Warning of Extreme Winds for High-Speed Railway Bridge Construction Using Machine-Learning Methods

1
Key Laboratory of Concrete and Prestressed Concrete Structures of Ministry of Education, Southeast University, Nanjing 210096, China
2
School of Civil and Environmental Engineering, Nanyang Technological University, Singapore 639798, Singapore
*
Authors to whom correspondence should be addressed.
Sustainability 2023, 15(24), 16921; https://doi.org/10.3390/su152416921
Submission received: 6 November 2023 / Revised: 5 December 2023 / Accepted: 13 December 2023 / Published: 17 December 2023

Abstract

:
Measuring the impact of extreme winds is important in high-speed railway bridge construction to avoid the risk of engineering accidents. This study presents an early-warning framework for high-speed railway (HSR) bridge construction under extreme wind conditions, using a long-span continuous beam bridge constructed in a typhoon-prone area as a case study. Specifically, on-site wind environment measurements during a typhoon are utilized, and parameters such as fluctuating wind turbulence intensity, gust factor, turbulence integral scale, and power spectral density are employed to characterize the wind environment. Multi-step prediction of gust wind speed during the bridge construction is performed using the hybrid Back Propagation-Genetic Algorithm (BP-GA). Hierarchical warnings and control actions are proposed and implemented based on the prediction results. The analysis results of wind parameters revealed a discrepancy between the measured and specified typhoon turbulence intensities, with the windward turbulence intensity being lower than specified. The longitudinal average gust factor exceeded the transverse value. The prediction curve based on the BP-GA algorithm closely resembles the actual curve, meeting accuracy requirements. Notably, the one-step prediction provided the most accurate results. Based on the predicted wind speed trend for the upcoming half-hour, appropriate hierarchical warnings and control measures were conducted.

1. Introduction

In the process of long-span bridge construction, the orderly management of site construction has certain benefits for the sustainable development of local resources [1]. The construction safety of a long-span bridge is not only related to the safety and quality of the project, but its smooth construction also enables more rapid improvement in local traffic movement and promotes the rapid development of the economy [2]. Accidents caused by wind are more likely to occur on long-span bridges during their construction and operation over waterways or in mountainous regions [3]. Measuring and predicting wind speed accurately is an efficient way to ensure the construction safety of long-span bridges [4], especially those facing extreme weather conditions. Early-warning systems for bridge construction in such adverse scenarios rely on advanced wind speed prediction methods.
Wind speed prediction approaches can be broadly categorized into physical methods [5], statistical methods [6], and hybrid physical statistical models [7]. Specifically, physical models demand meteorological data, such as atmospheric pressure, humidity, and temperature. These models tend to excel in forecasting over longer time horizons, typically exceeding 12 h. However, they may be less reliable for short-term wind speed predictions. Compared with physical methods, statistical approaches employ time series data to build models and predict wind speed. An example of a widely used statistical method is the Autoregressive Integrated Moving Average (ARIMA) [6], which assumes linear relationships in time series data. However, ARIMA may suffer from reduced accuracy when wind characteristics exhibit non-linearity and non-stationarity. Hybrid models combine multiple approaches to account for various components in the wind speed dataset. Typical hybrid models include ARIMA-ANN, ARIMA-SVR, and ARIMA-ANFIS, which merge linear and nonlinear models to capture the complexities of wind speed time series. However, this assumption of linear and nonlinear components within the data can limit forecasting performance in certain circumstances. Other hybrid models involve data preprocessing techniques, such as wavelet transform, empirical mode decomposition, variational mode decomposition, and empirical wavelet transform. These techniques are employed to improve forecasting accuracy by extracting inherent information from nonstationary time series. Machine learning methods have emerged as promising tools for forecasting wind speed, offering advantages in accuracy and robustness [7].
The southeast coastal region of China is a key construction zone for the country’s railroad network. Numerous high-speed railway (HSR) lines in this region are already under construction or are slated for development. However, this region’s proximity to the Pacific Ocean means that it is annually subjected to typhoons and other extreme weather events, posing significant challenges to the construction of HSR bridges [8]. Continuous beam bridges for HSRs differ from typical railroad bridges due to higher requirements for construction accuracy, engineering quality, and the final quality of the completed bridge. Within the atmospheric boundary layer, wind speed increases with height above ground, leading to larger wind loads acting on the superstructure of the continuous beam bridges. This is particularly crucial during the maximum cantilever construction stage, which has a low self-oscillation frequency. Static wind loads can generate significant internal forces at the root of the box beam and the bottom of the pier [9,10,11], risking lateral overturning and other accidents. Fluctuating wind loads can induce wind-caused shaking vibration of cantilevered box beams, which not only increases the force on the root of the box beam but can also lead to fatigue cracking in the concrete. Additionally, typhoons pose a serious threat to the safety of ancillary structures and personnel during the construction of continuous beam bridges [12,13,14].
This study takes a typical long-span HSR continuous beam bridge on the southeast coast as the engineering background, with wind environment measurements being taken on-site. Utilizing the hybrid Back Propagation-Genetic Algorithm (BP-GA), gust wind speed was predicted during construction. The resulting predictions can inform hierarchical typhoon warnings and control measures.

2. Machine Learning-Based Wind Speed Early-Warning Framework

During the construction phase of large-span HSR continuous beam bridges, typhoons and other severe weather conditions can potentially cause lateral overturning of the maximum cantilever, leading to economic losses and even fatalities. These accidents are often linked to peak gust wind speeds from typhoons. Therefore, accurate short-term gust wind speed predictions are crucial for implementing timely risk prevention and control measures, ultimately reducing the likelihood of such accidents [15].

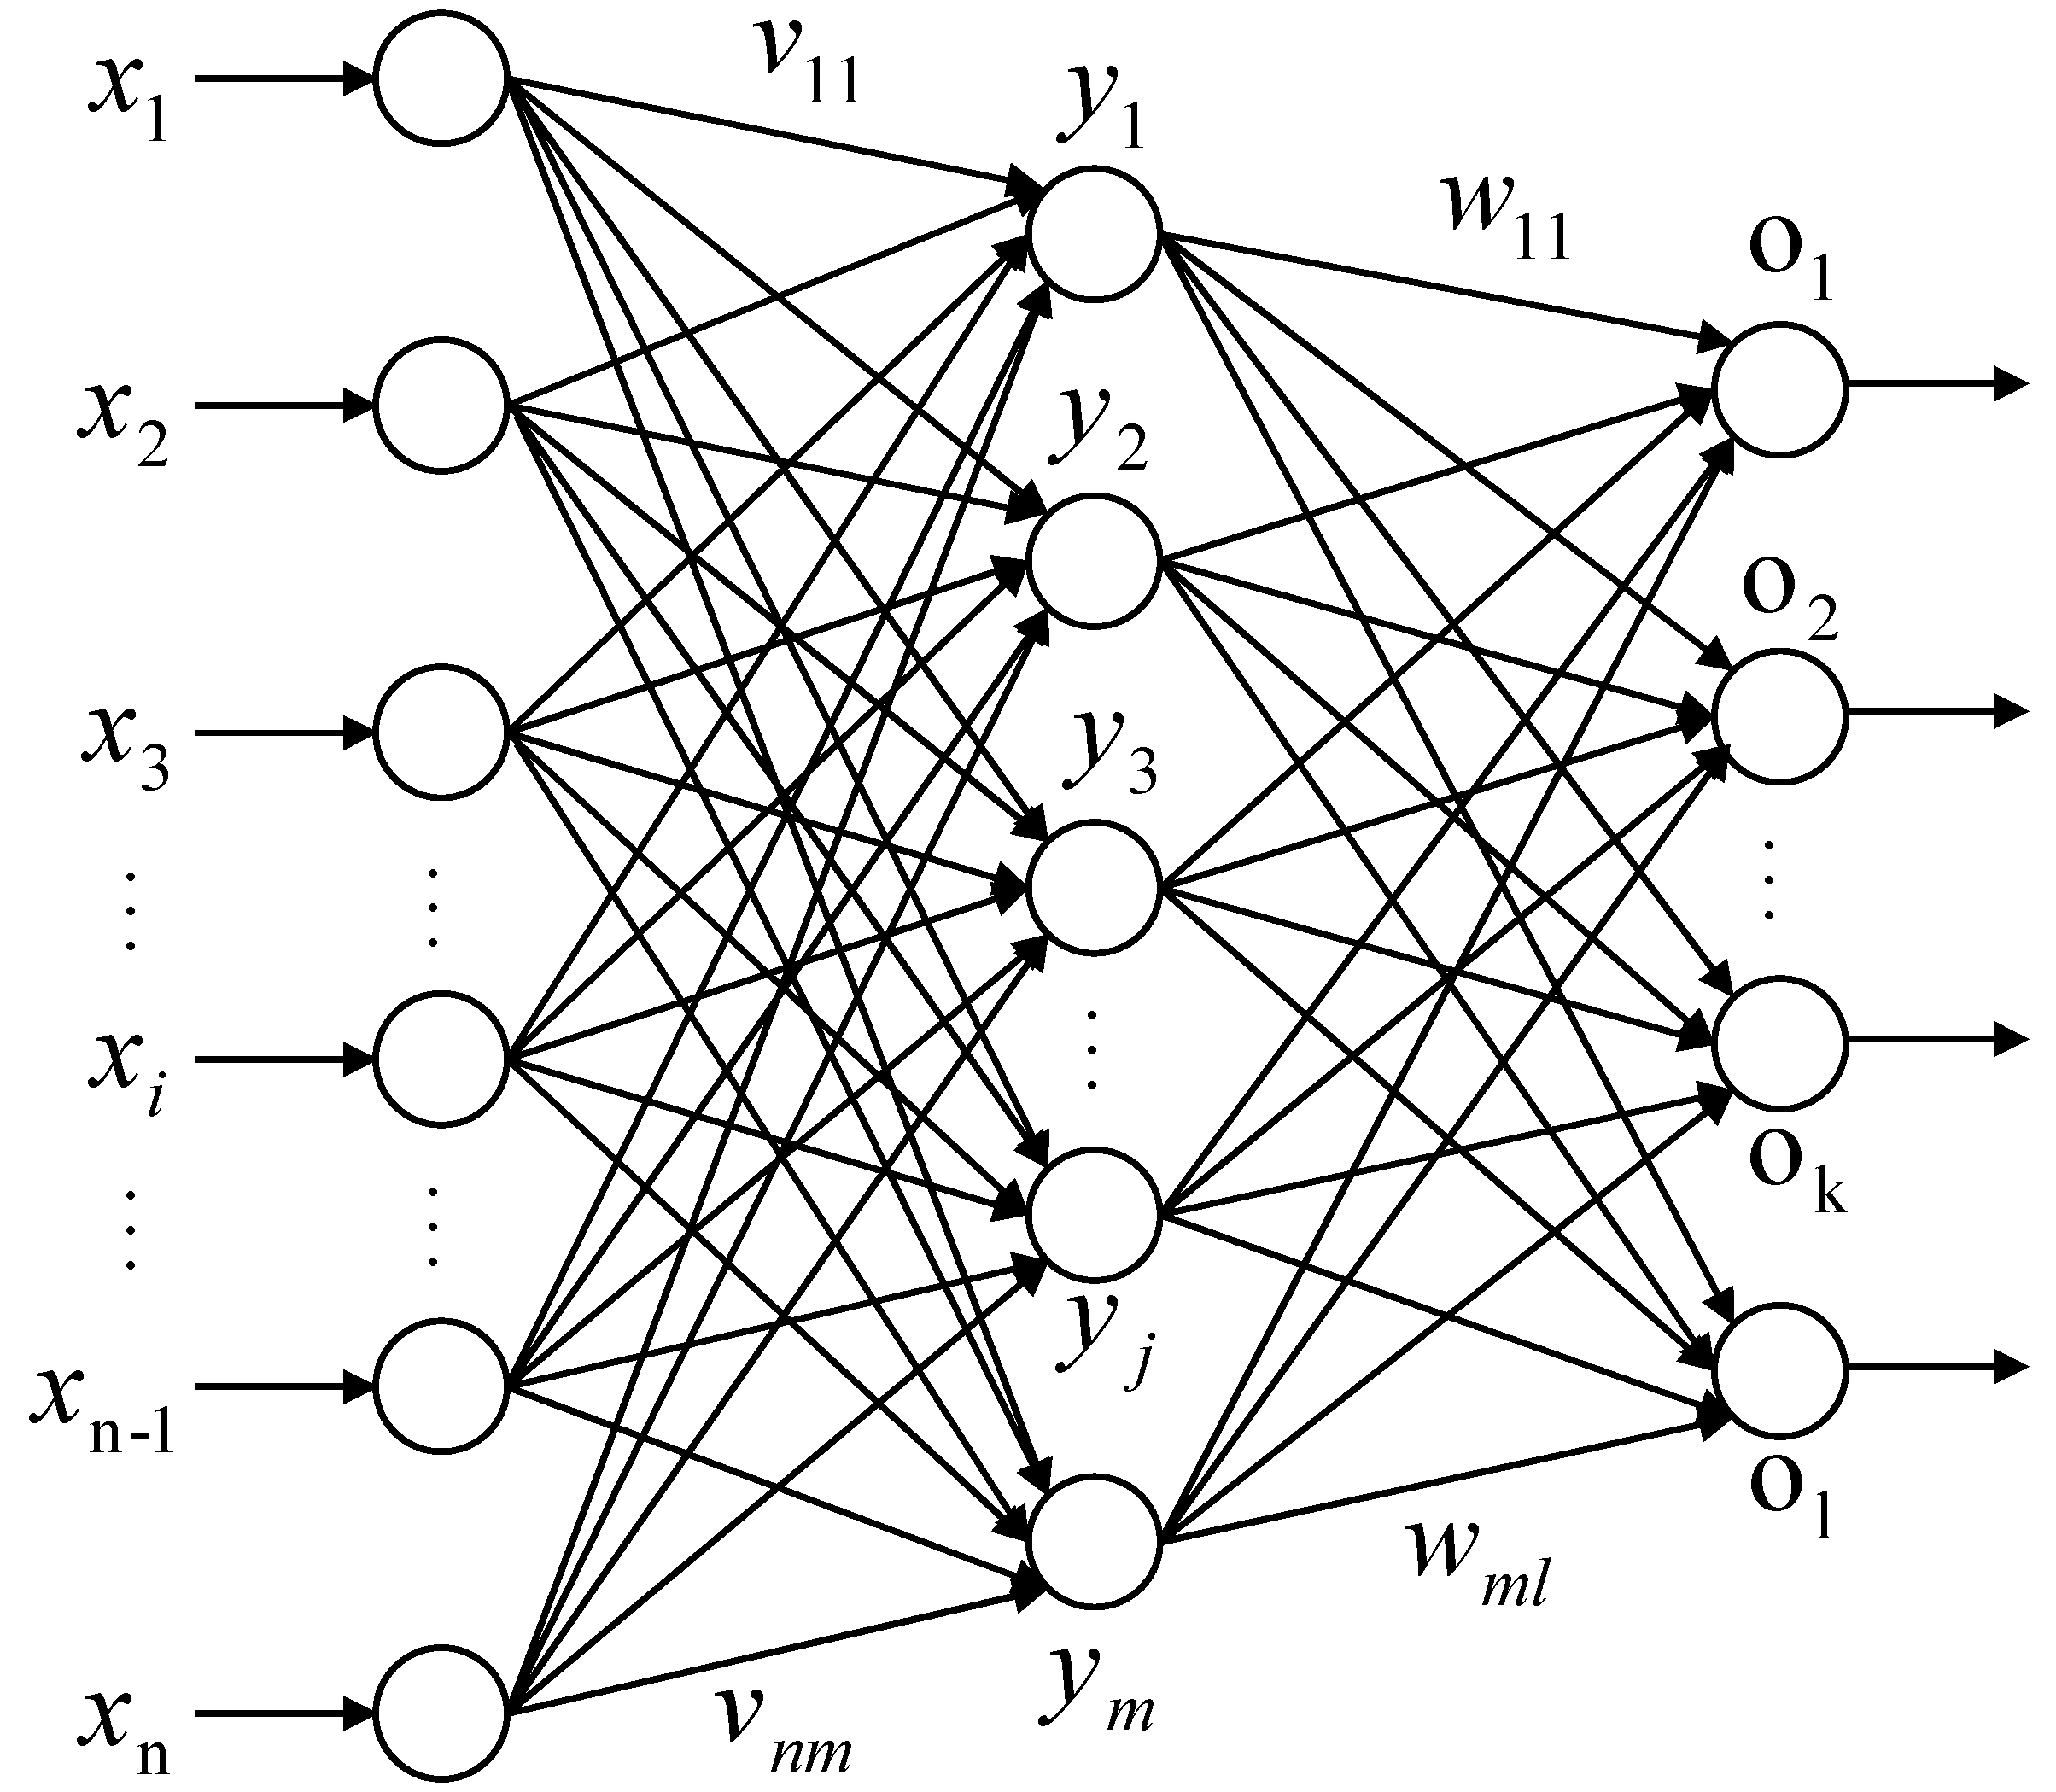
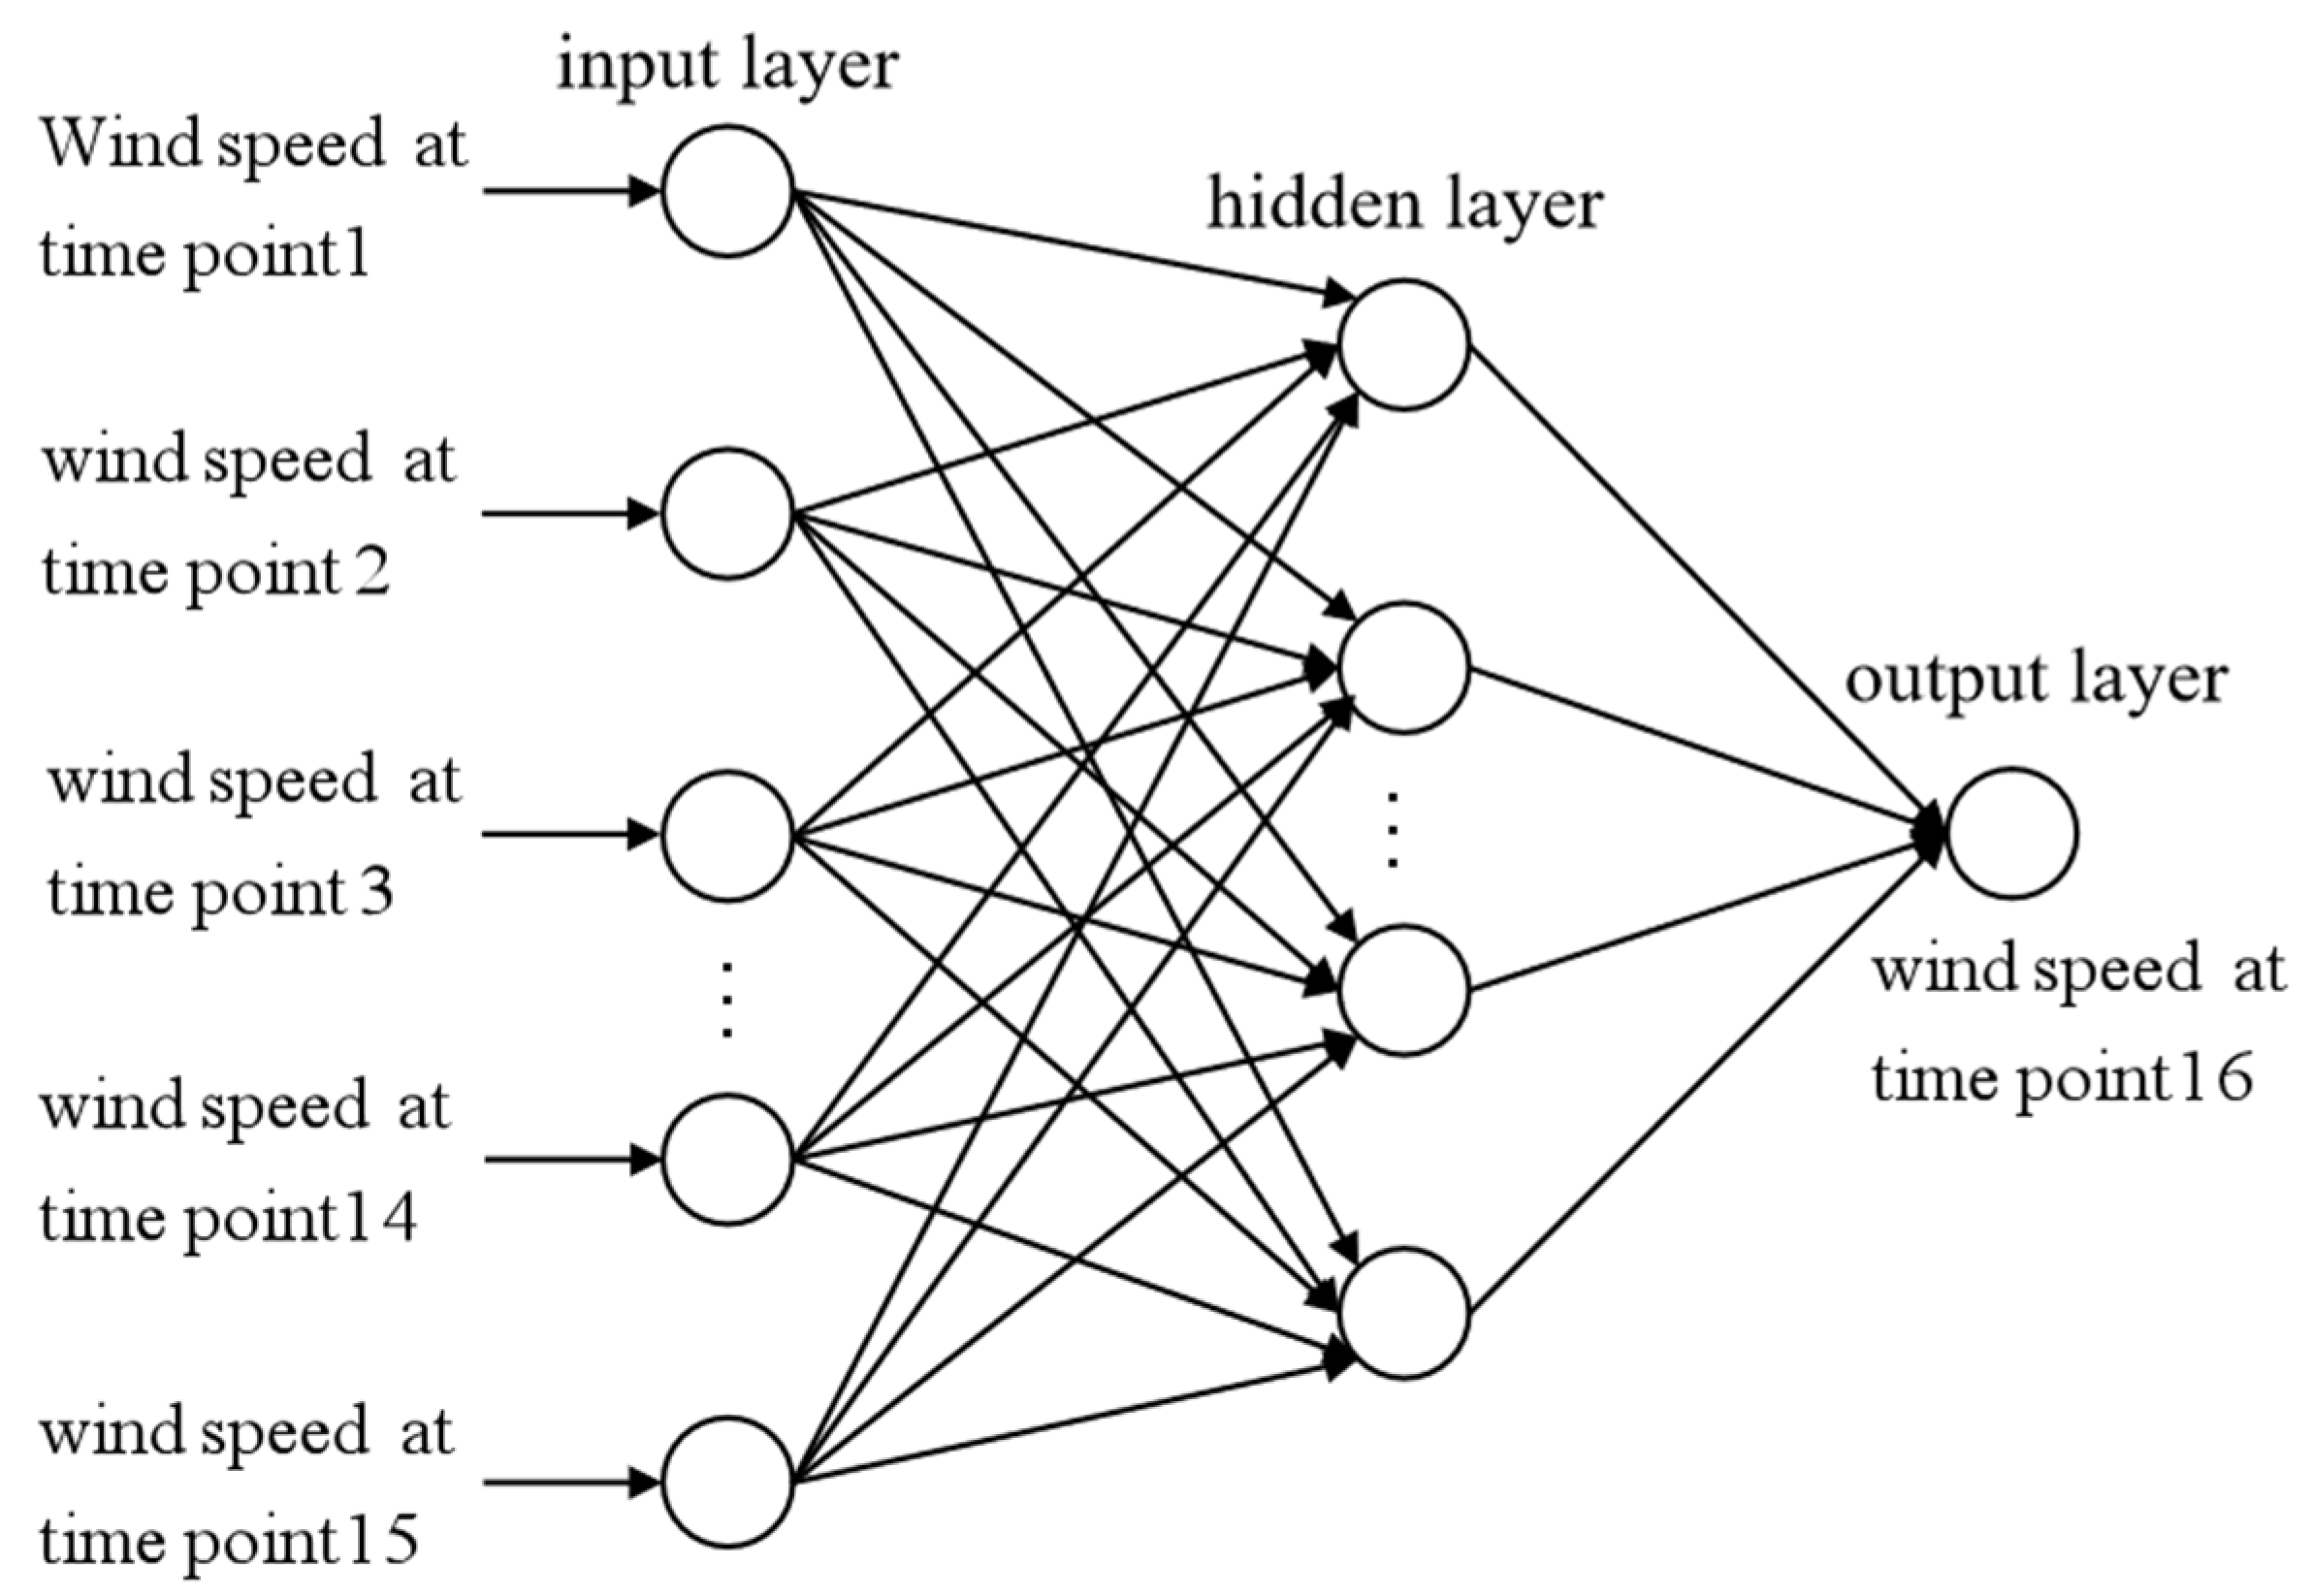
2.1. BP Neural Network
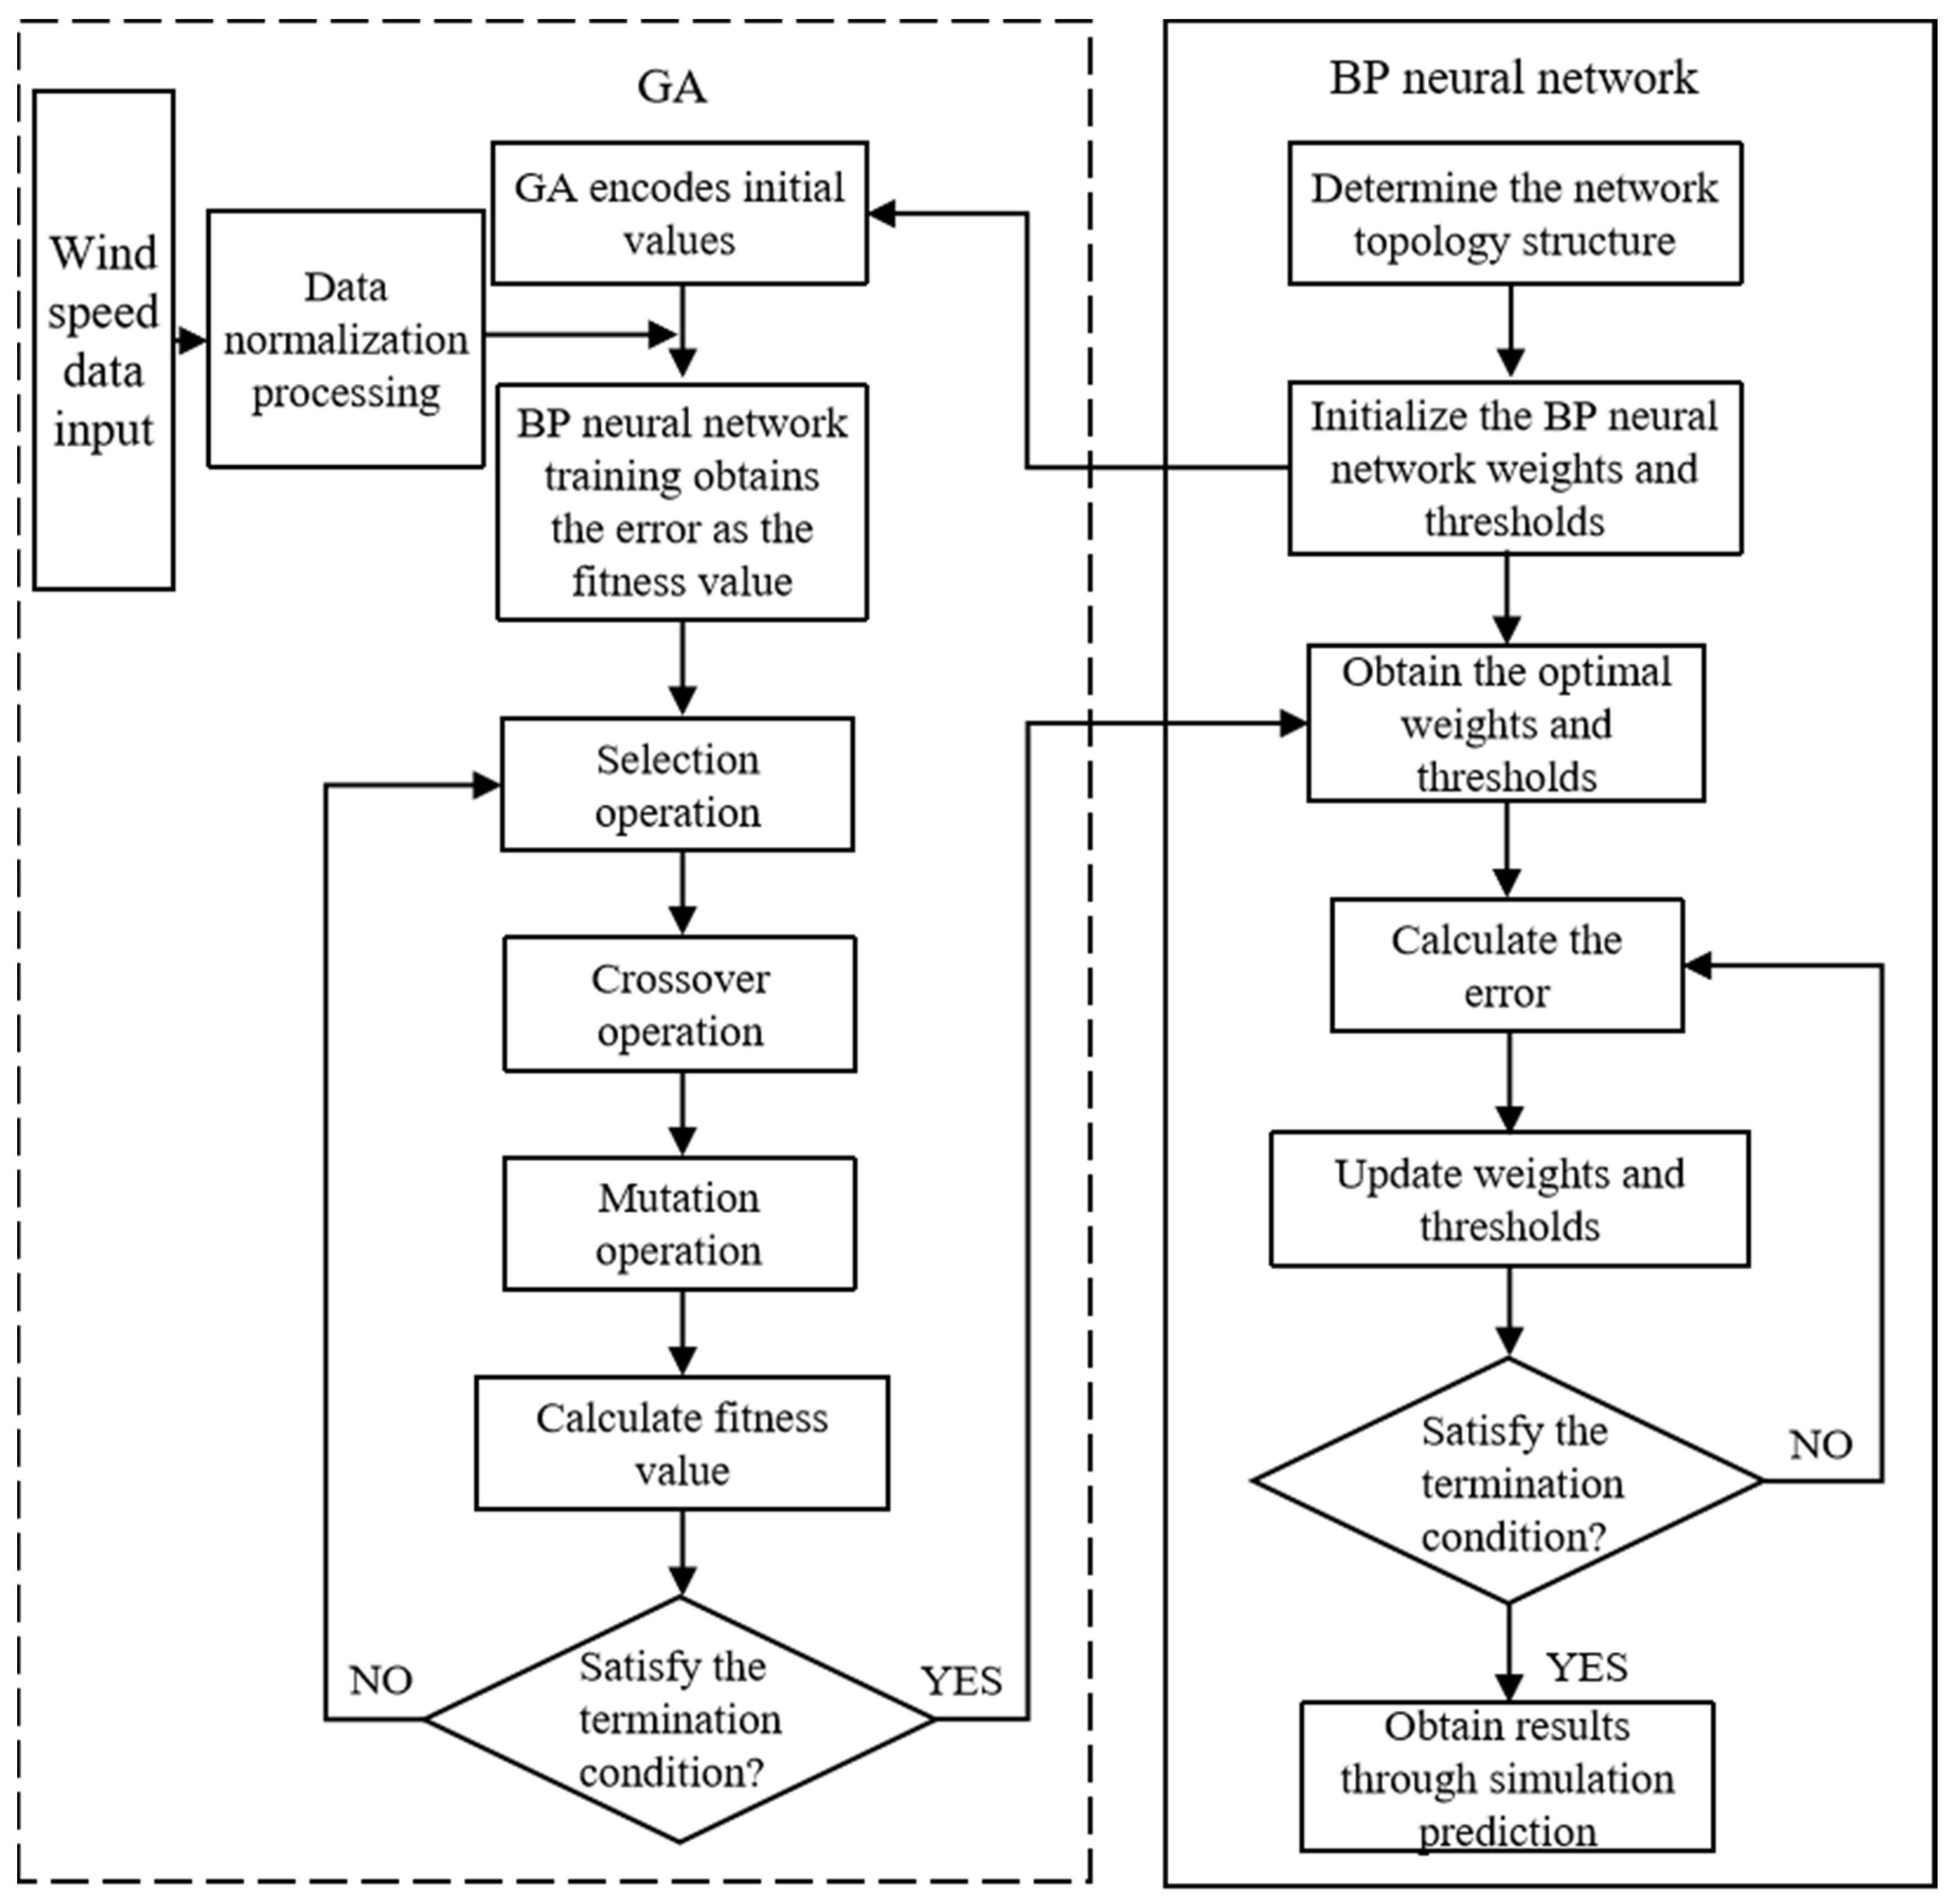
The backpropagation (BP) neural network is a multi-layer feedforward network trained with error backpropagation. It uses gradient search techniques to minimize the mean square error between the actual and desired output values. If the mean square error of the output values is not minimized, it enters a backpropagation iteration to calculate and correct the error. After repeated learning, it determines the effect of the error on the weights and thresholds of the network [16]. The BP neural network can approximate any nonlinear mapping with arbitrary precision, which has strong multidimensional nonlinear learning ability and good robustness. The network structure is shown in Figure 1.
For the output layer,
o k = f ( n e t k ) ,   k = 1 ,   2 ,   ,   l
n e t k = j = 1 m w j k y j ,   k = 1 ,   2 ,   ,   l
For the hidden layer,
y j = f ( n e t j ) ,   j = 1 ,   2 ,   ,   m
n e t j = i = 1 n v i j x i ,   j = 1 ,   2 ,   ,   m
In this case, the unipolar Sigmoid function is used as the transformation function, and the formula is as follows
f ( x ) = 1 1 + e x
The input and output data are normalized before training the network by
x ¯ i = x i x min x max x min
where xi is the layer i input vector, x = (x1, x2, xi, …, x)nT; yj is the output vector of the jth hidden layer, y = (y1, y2, yj, …, y)mT; ok is the output vector of the kth layer, o = (o1, o2, ok, …, o)lT; netk and netj are the kth and jth network layers, respectively; vij is the weight between the i-th input layer and the j-th implied layer; wjk is the weight from the j-th hidden layer to the k-th output layer; xmin, xmax are the minimum and maximum values, respectively, in the input; x ¯ i is the normalized input variable; and e is the natural exponent, with a value of approximately 2.718.

2.2. BP-GA

The main drawbacks of the BP neural network are its slow learning speed and the tendency to become stuck in local minima. Therefore, in the wind speed prediction process, we introduce the genetic algorithm (GA). First, GA is used to obtain a global optimum for the initial weights of the BP neural network, and then the training continues. This process addresses the two aforementioned drawbacks of the BP neural network and accelerates the network’s convergence speed. The wind speed prediction process based on the BP-GA algorithm is shown in Figure 2.

2.2.1. Individual Coding and Population Initialization

When analyzing problems using GA, it is necessary to encode the individuals. In cases involving multivariable and high-dimensional problems, real values of variables are used for encoding [17]. Each individual corresponds to a string of real numbers representing the weights between the input and hidden layers, the hidden layer thresholds, the weights between the hidden and output layers, and the output layer thresholds [18].
Since the neural network has multiple inputs, undetermined weights, and thresholds, real number encoding is used for individual coding in this study. Based on the BP neural network structure shown in Figure 1, the process of individual encoding and population initialization begins with generating a population of N individuals. The length of the encoding for each individual is determined by the number of initial weights and threshold values in the various structural layers of the BP neural network and can be represented as follows
S = n × q + q × m + q + m
In Equation (7), S denotes the individual coding length; n is the number of nodes in the input layer of the BP neural network; q is the number of nodes in the hidden layer; and m is node number in the output layer.

2.2.2. Adaptation Function

The fitness value F of an individual is given by the sum of the absolute errors between the wind speed prediction output and the expected network output values [19], and it can be calculated using the following formula
F = k ( i = 1 n | y i o i | )
where yi is the desired output of the ith node; oi is the predicted output of the ith node; k is the customization coefficient; and n is the number of network output nodes.

2.2.3. Selection Operations

In the wind speed prediction model, the roulette wheel selection method is used for the selection operation. The probability of selecting individual i, denoted as pi, is
f i = k F i
p i = f i j = 1 N f j
where Fi is the fitness value of individual i; k is the coefficient; N is the number of individuals in the population; and fi and fj are the fitness measures of selected individuals i and j, respectively.

2.2.4. Cross Operation

Since the individuals use real number encoding, real number crossover is used for the crossover operation, and the formula is as follows
a k j = a k j ( l b ) + a l j b
  a l j = a l j ( l b ) + a k j b
where akj is the influence factor of node k on node j; alj is the influence factor of node l on node j; and b is the weight value, which takes the range of [0, 1].

2.2.5. Variant Operations

To prevent the algorithm from falling into local minima, a mutation mechanism is introduced, and the gene aij mutation operates as follows
a i j = { a i j + ( a i j a max ) × f ( g ) ,   r > 0.5 a i j + ( a min a i j ) × f ( g ) ,   r 0.5
f ( g ) = r 2 ( 1 g / G max ) 2
where aij is the jth gene of individual i; amax, amin are the upper and lower limit values of gene aij, respectively; g is the number of iterations; Gmax is the maximum number of evolutions; r2 is the number of random numbers; and r is the probability of variation, which takes the value range of [0, 1].

3. Validation and Application

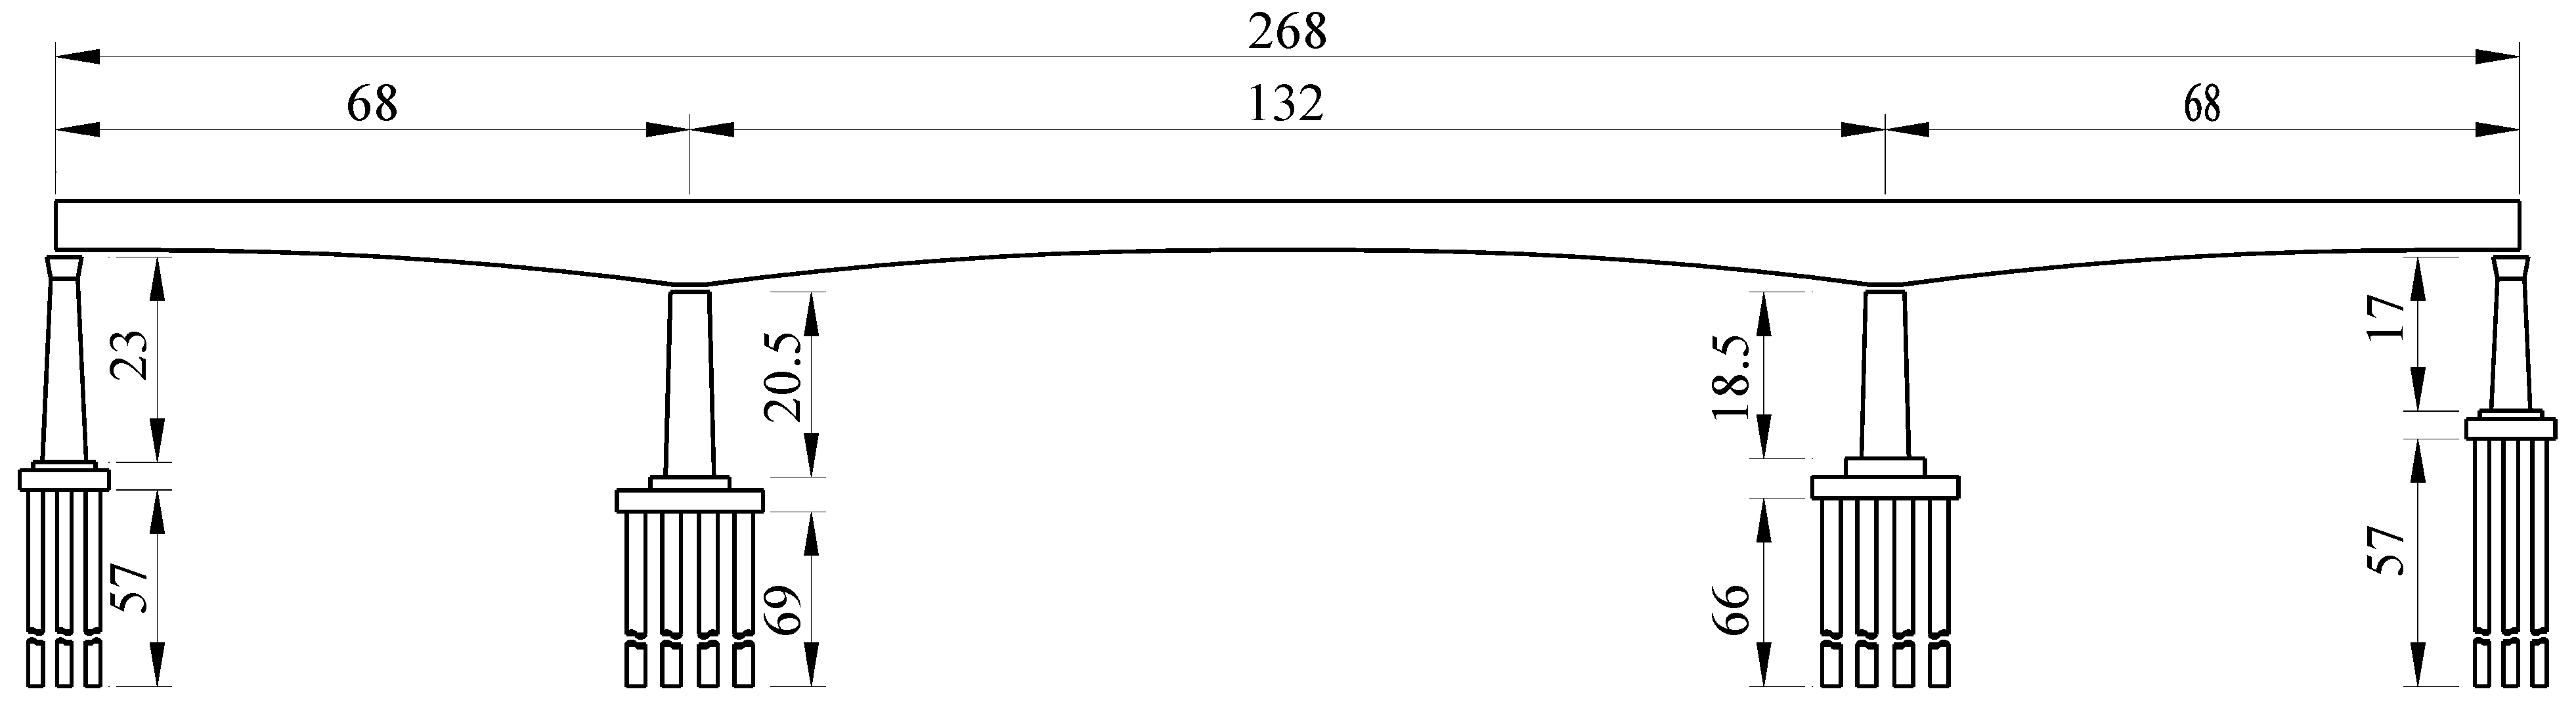
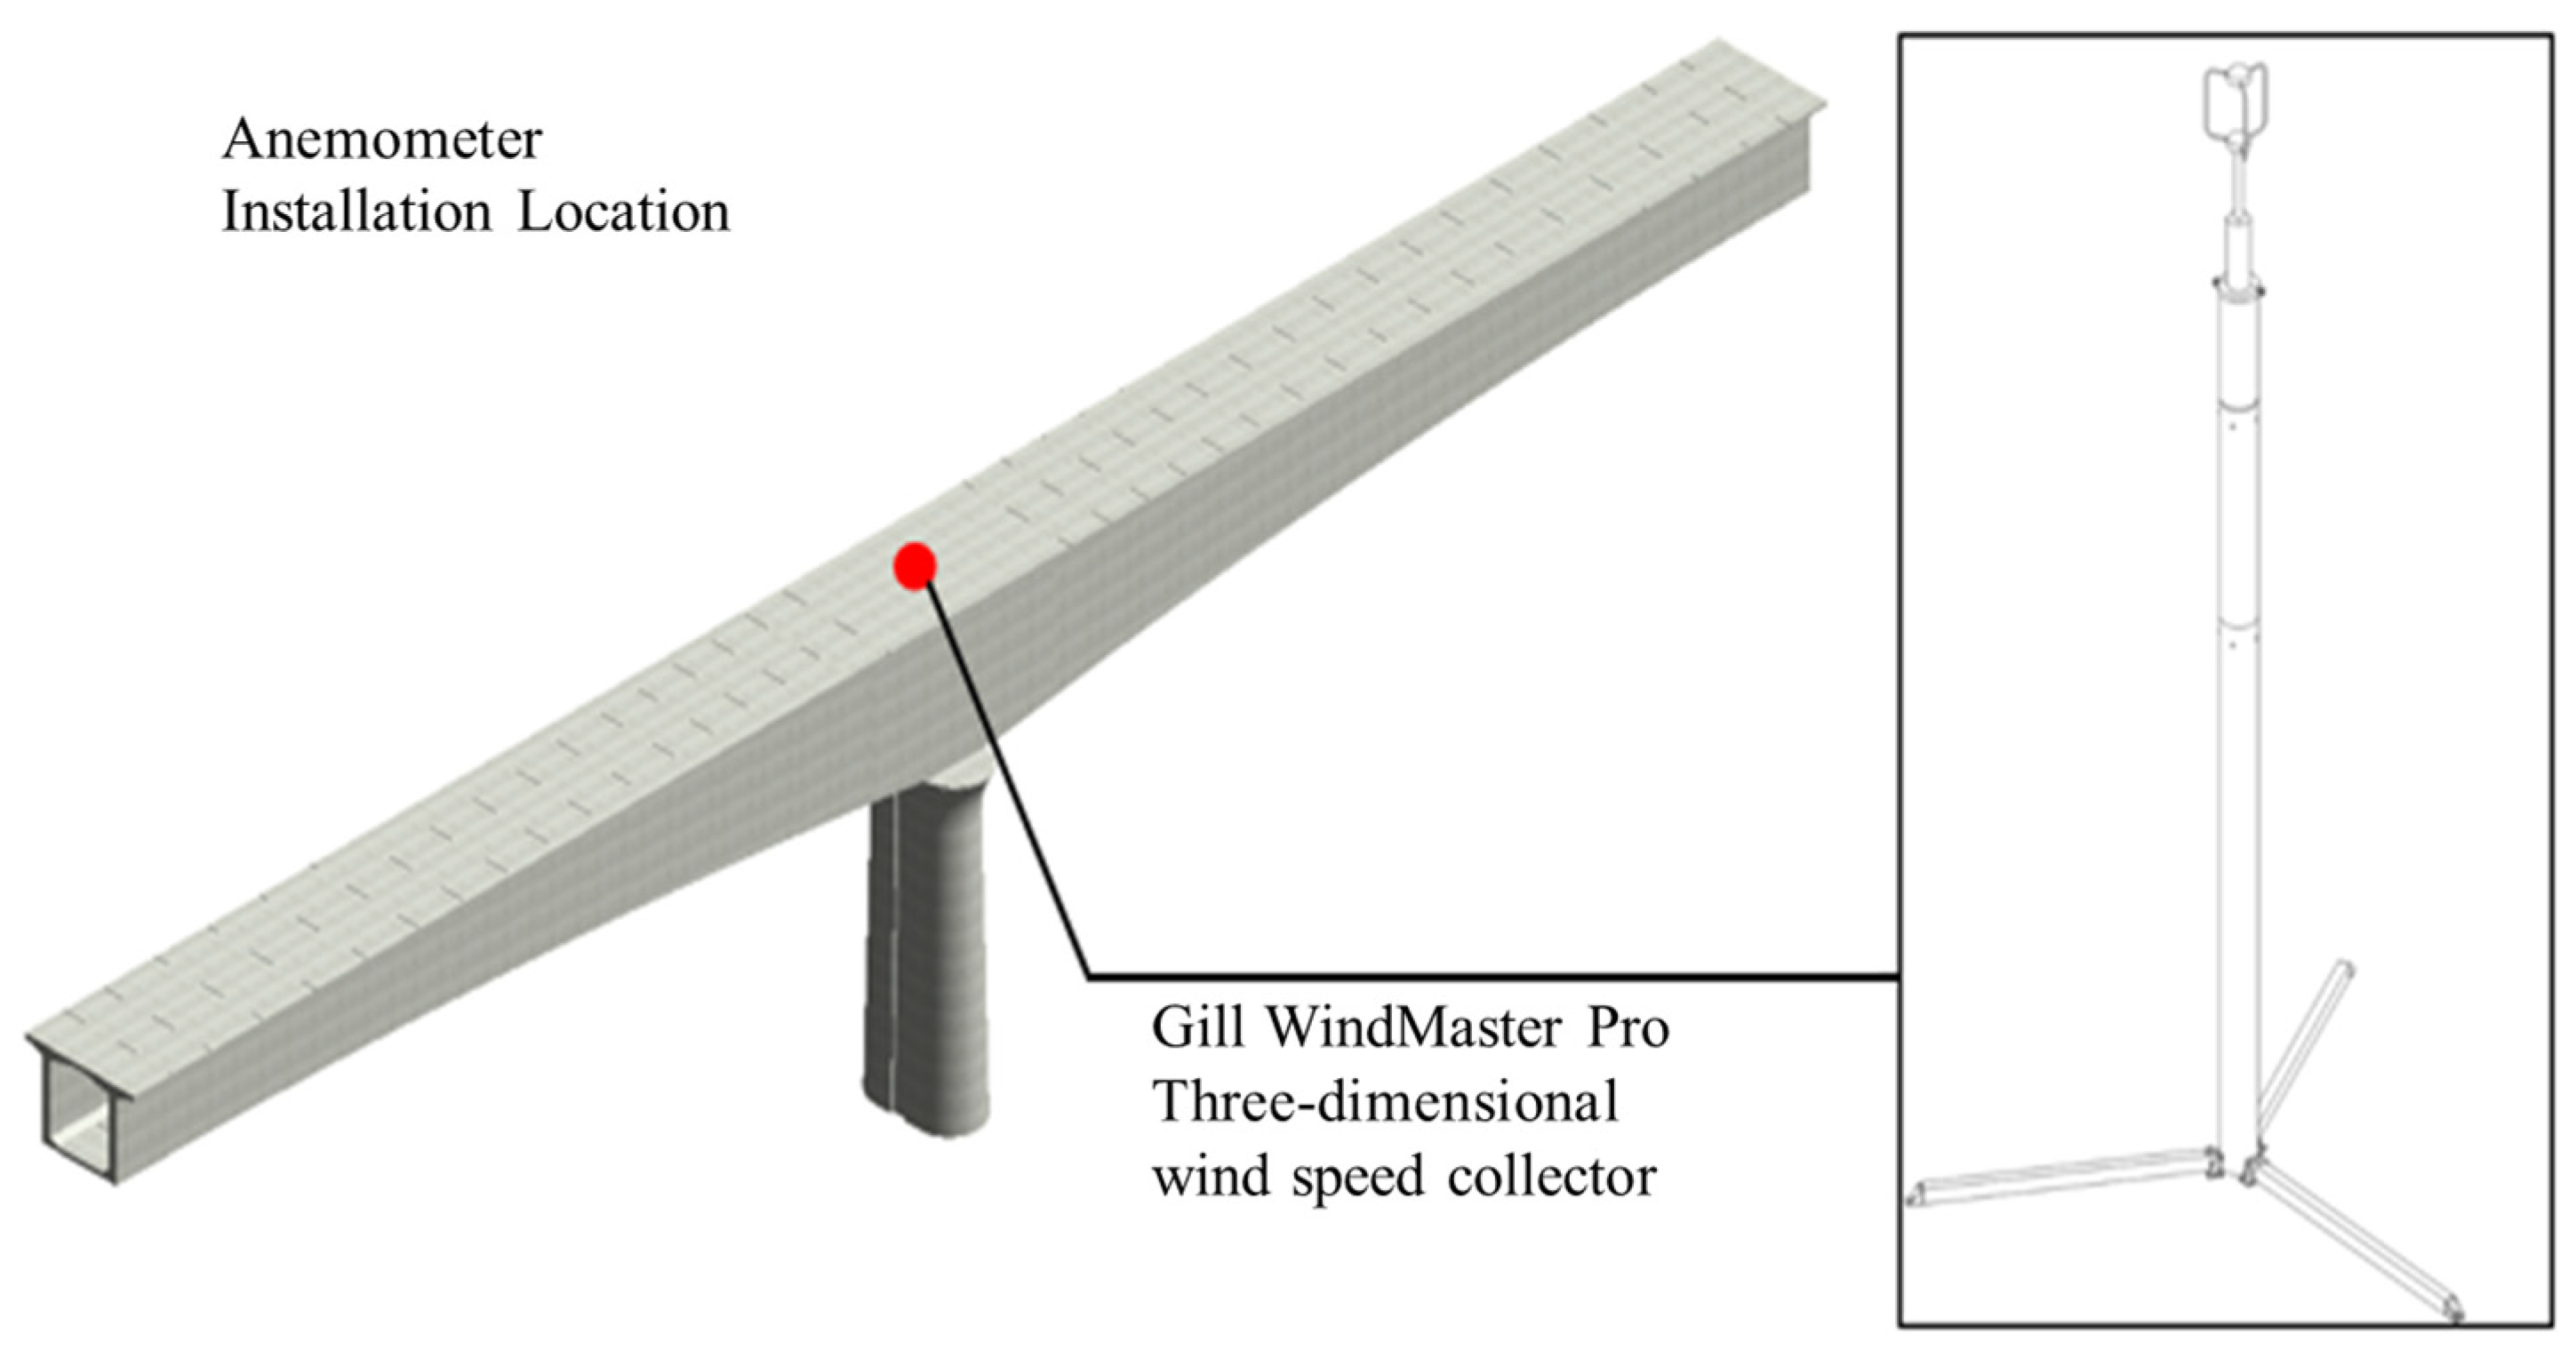
3.1. Wind Environment Monitoring System for the Bridge Site

The proposed early-warning framework is applied to a long-span HSR continuous bridge on the east coast of China. The main span of this bridge is 268 m, with a combination of 68 m + 132 m + 68 m, as shown in Figure 3. The box girder 0# block adopts the bracket cast-in-place technique, and the remaining segments adopt cantilever pouring. The beam body is temporarily cemented to the pier body, and the maximal length of the cantilever on both sides during the construction period is 65 m. The whole width of the bridge is 31 m, and the hanging basket construction scheme is adopted. The height of the cantilever root is about 11 m and the closing place is 4.5 m.
A 3D ultrasonic wind anemometer is installed for the on-site measurement of the wind environment. The meter can measure wind of 0~45 m/s and 0~65 m/s, respectively, providing sound temperature, sound speed, and three-way (UVW) vector output at 20 Hz/32 Hz output frequency. The on-site anemometer is installed at the bridge deck position of the 0# block of the main beam, as shown in Figure 4.

3.2. Wind Characteristics Analysis

The mean and fluctuating characteristics are two main features of wind. Specifically, the mean wind characteristics are mainly described by parameters such as mean wind speed and wind direction; the fluctuating wind characteristics mainly include parameters such as turbulence intensity, gust factor, and power spectral density [13]. Wind characteristics were calculated using measured data from 10 August 2019, 22:00 to 11 August 2019, 08:00 during Typhoon Lekima. The measured wind speed samples during this period are presented in Figure 5, and the sampling frequency of the anemometer adopted is 32 Hz.

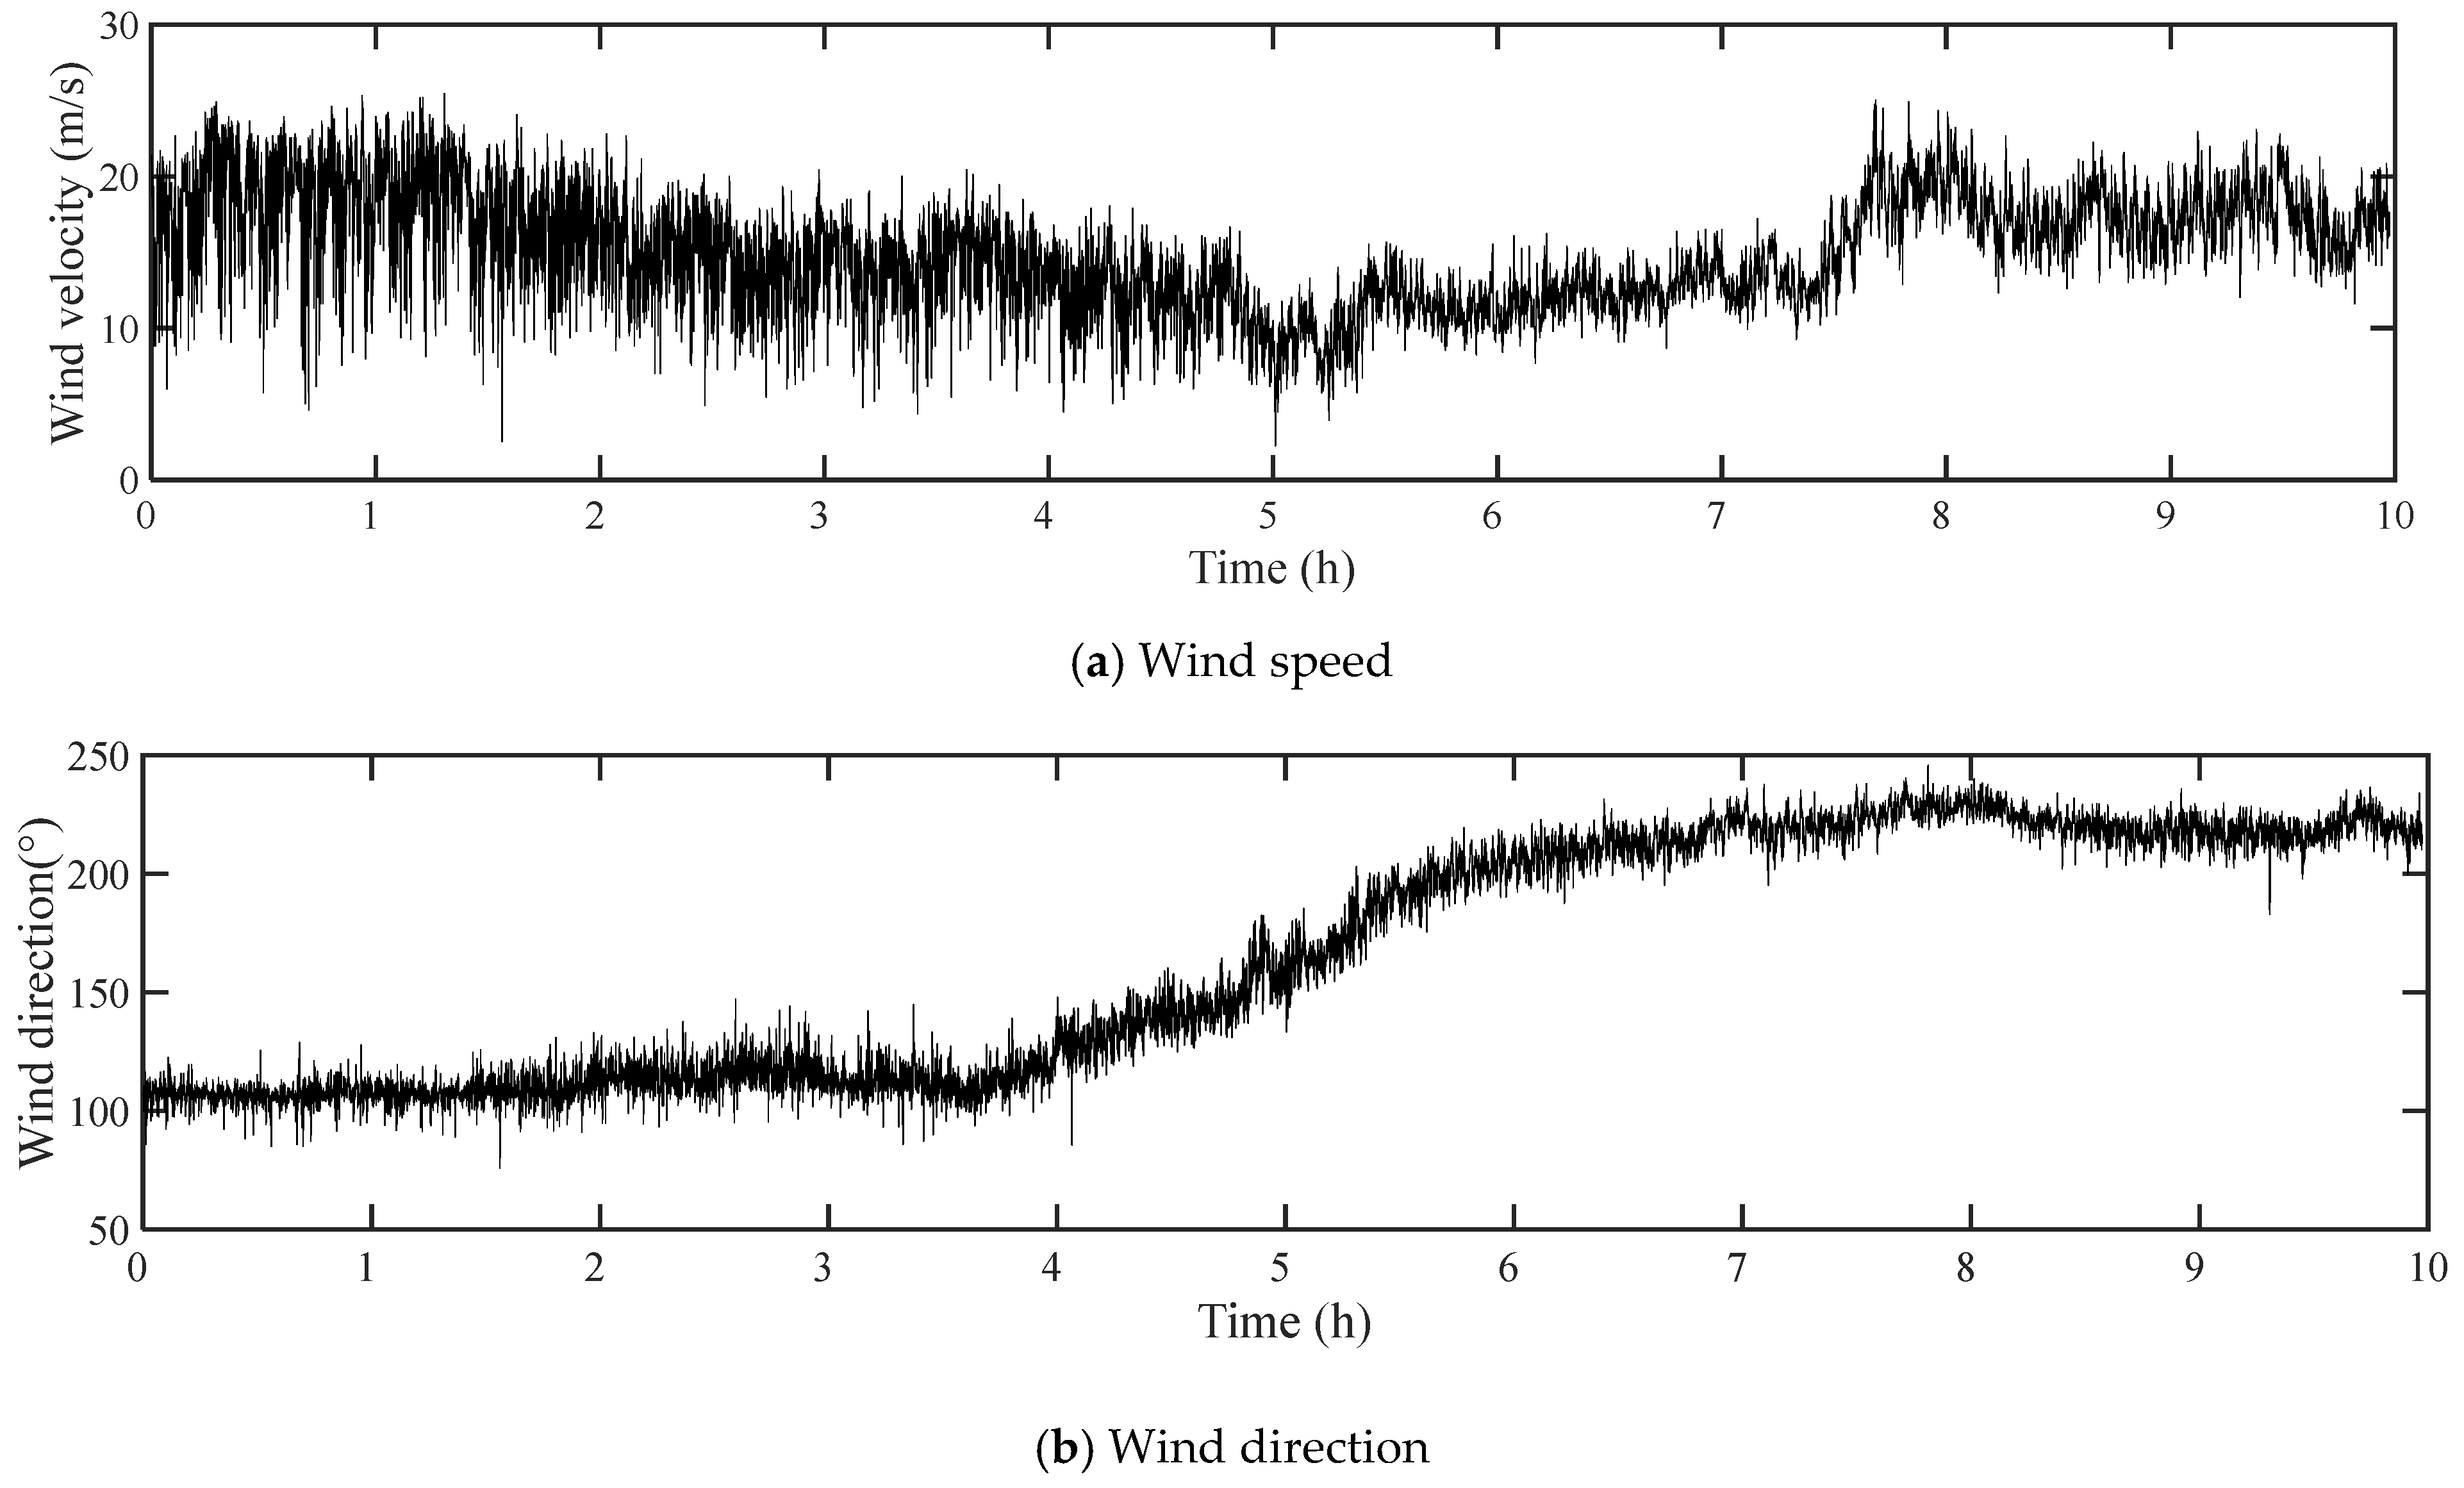
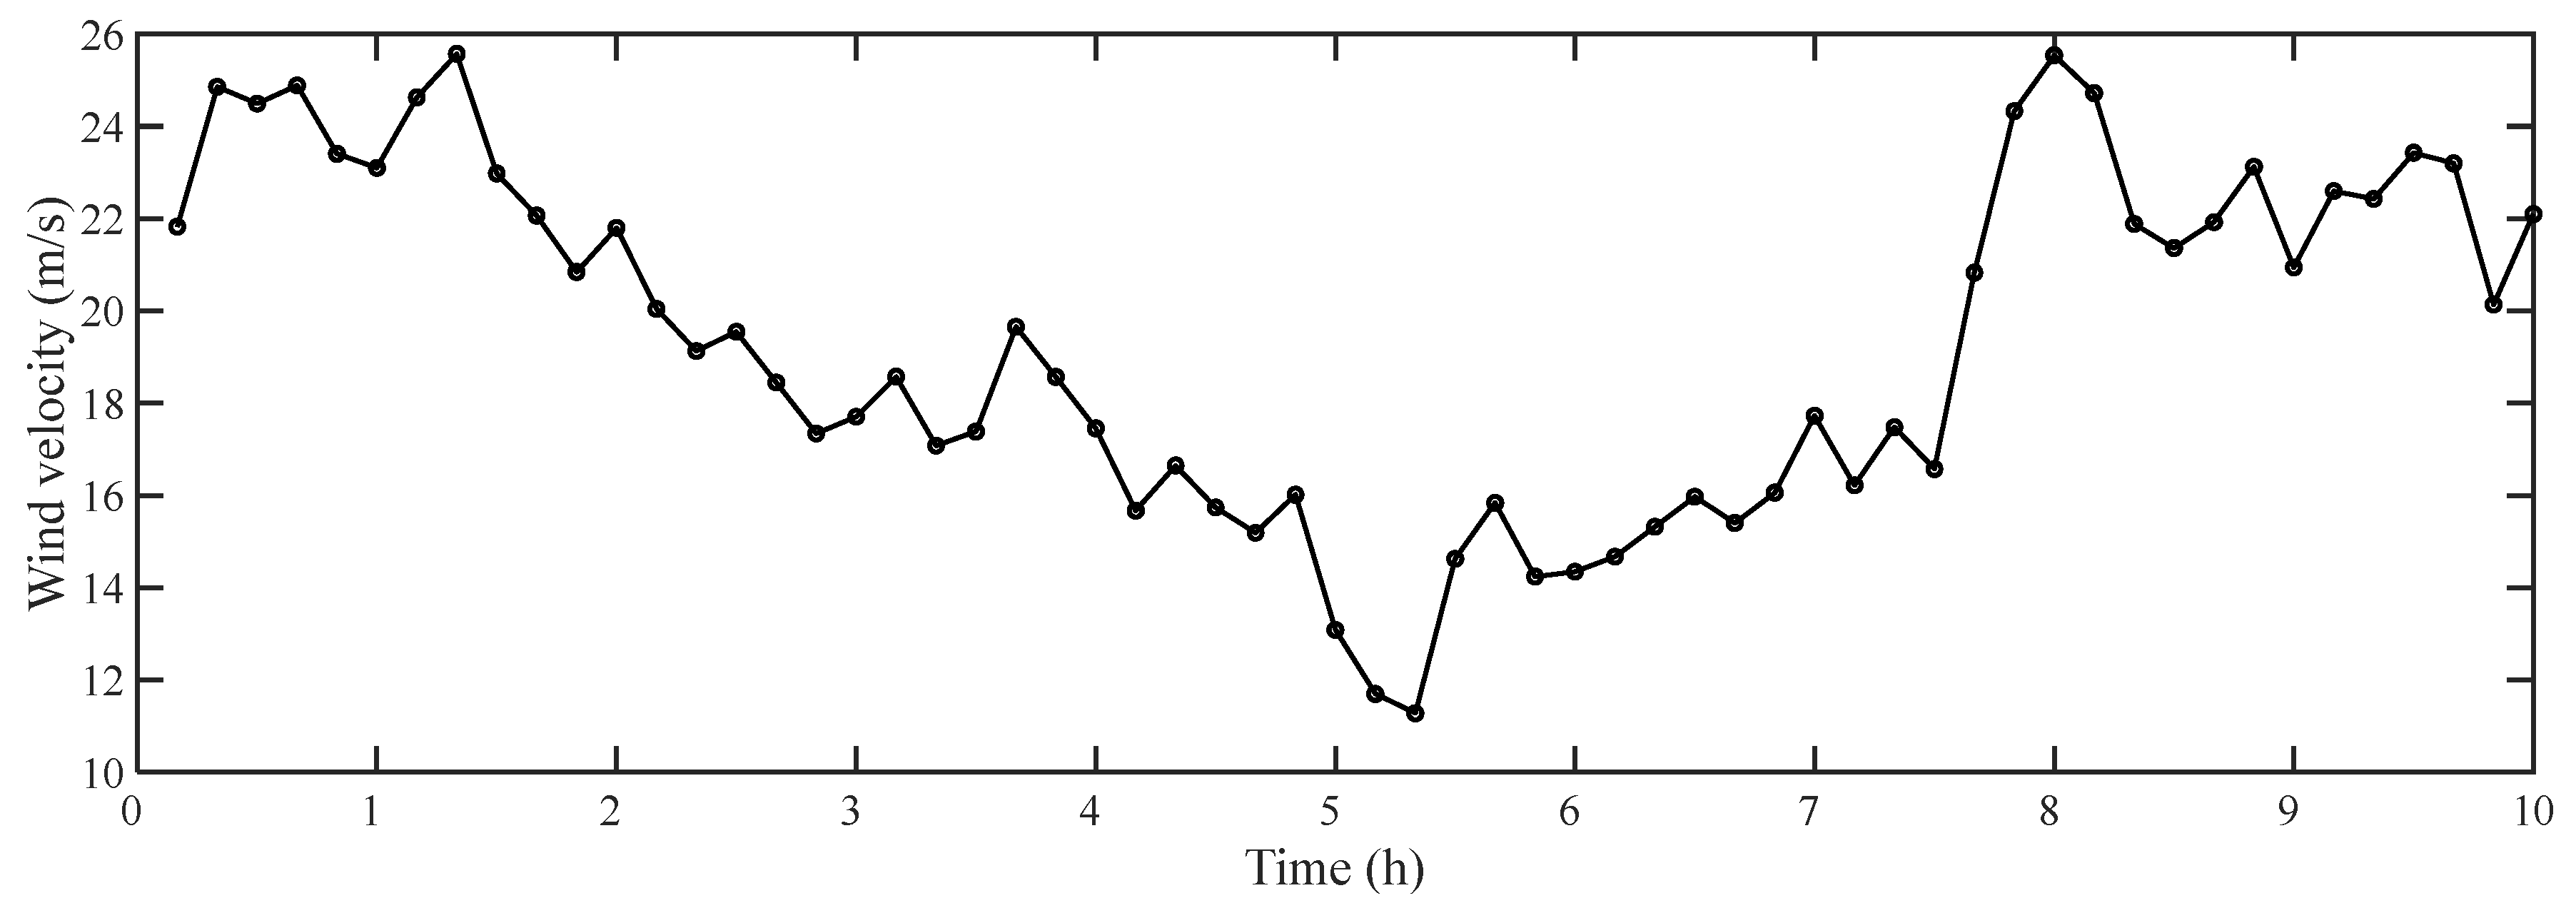
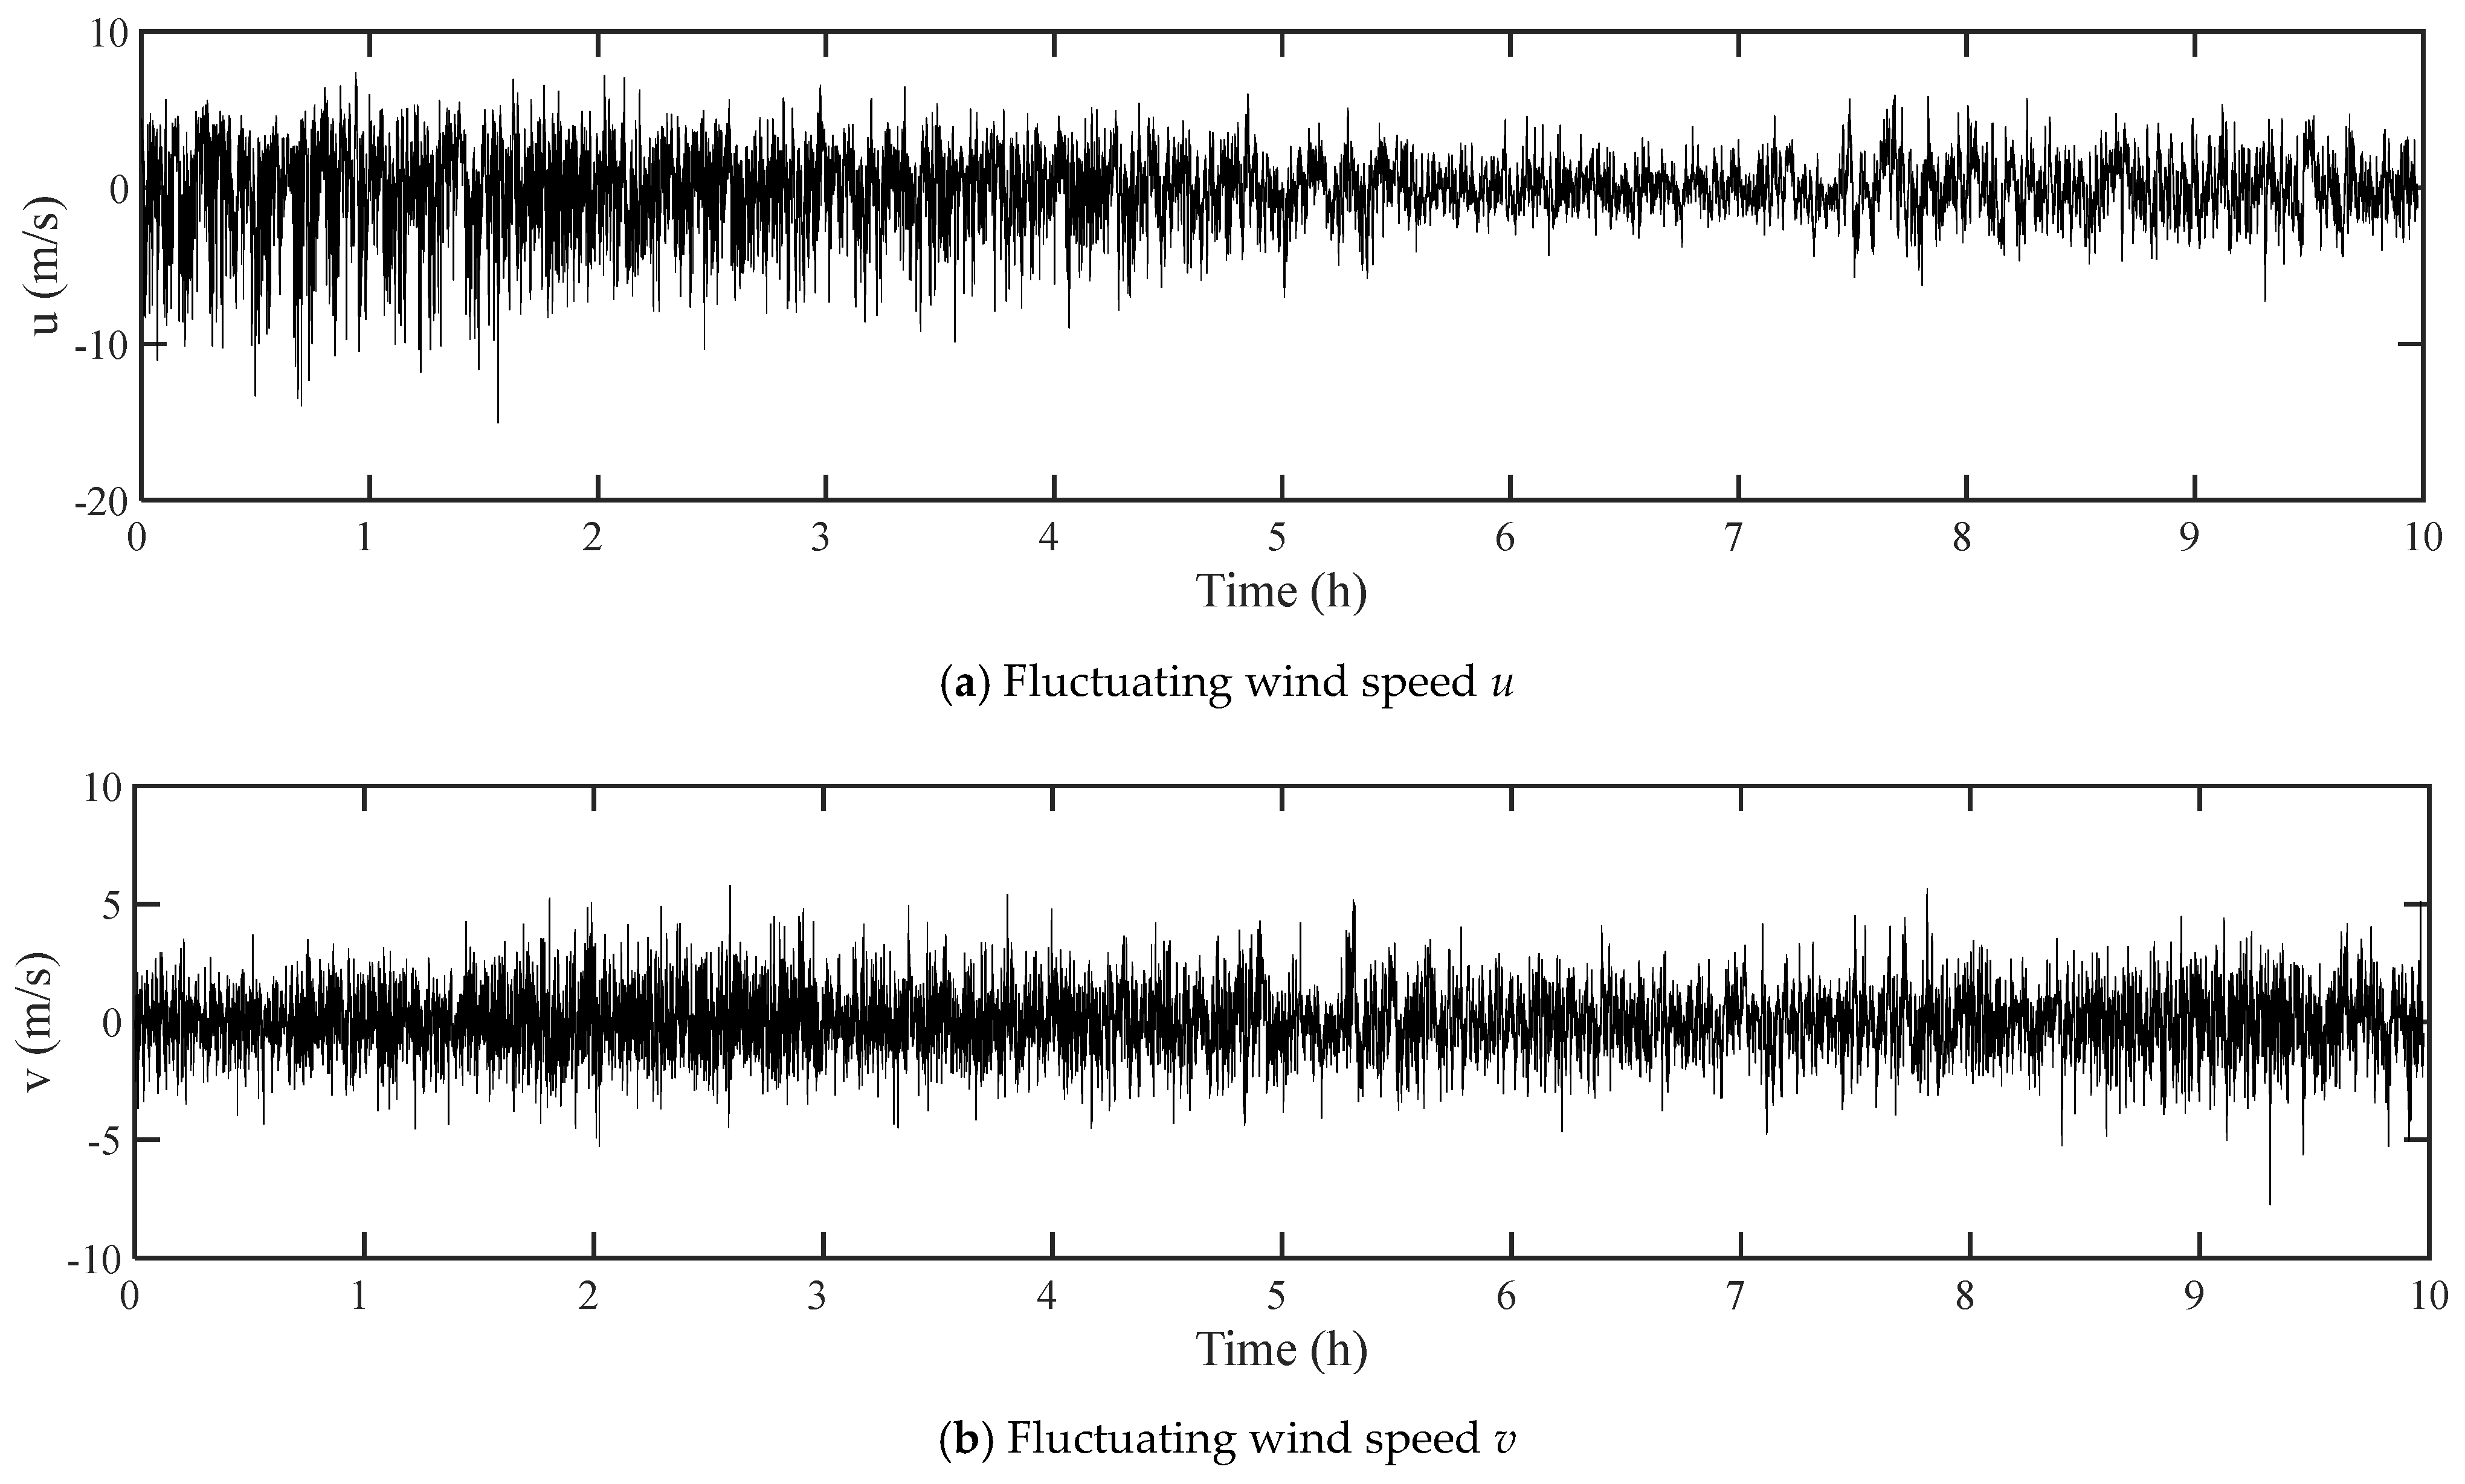
3.2.1. Mean Wind Speed and Direction

Wind speed is a vector with time-varying characteristics determined by attack angle, direction and speed. To analyze the wind characteristics of the measured wind samples in various directions, the original wind speed within the basic time interval is typically decomposed into two orthogonal wind speed time series, namely, windward (along-wind) and crosswind directions. According to the Wind-resistant Design Specification for Highway Bridges (JTG/T 3360-01-2018) in China [14], the mean wind speed and the mean wind direction for each typhoon with a basic time interval of 10 min are calculated separately by the vector decomposition method. The mean wind speed is calculated by:
U ¯ = ( u ¯ x ) 2 + ( u ¯ y ) 2
where u ¯ x and u ¯ y are the mean wind speeds in the two axial directions in the right-angle coordinate system, respectively; and U ¯ is the average wind speed.
The mean wind direction is calculated by the formula
Φ = { arccos u ¯ x U ¯ u ¯ x > 0 360 ° arccos u ¯ x U ¯ u ¯ x < 0
On this basis, the downwind fluctuating wind speed u and the crosswind fluctuating wind speed v are:
u = u x cos ϕ + u y sin ϕ U
v = u x sin ϕ + u y cos ϕ
Using the above method, we obtained the measured mean wind speed over 10 h, as well as the measured fluctuating wind speeds in both the downwind and crosswind directions, as shown in Figure 6 and Figure 7.

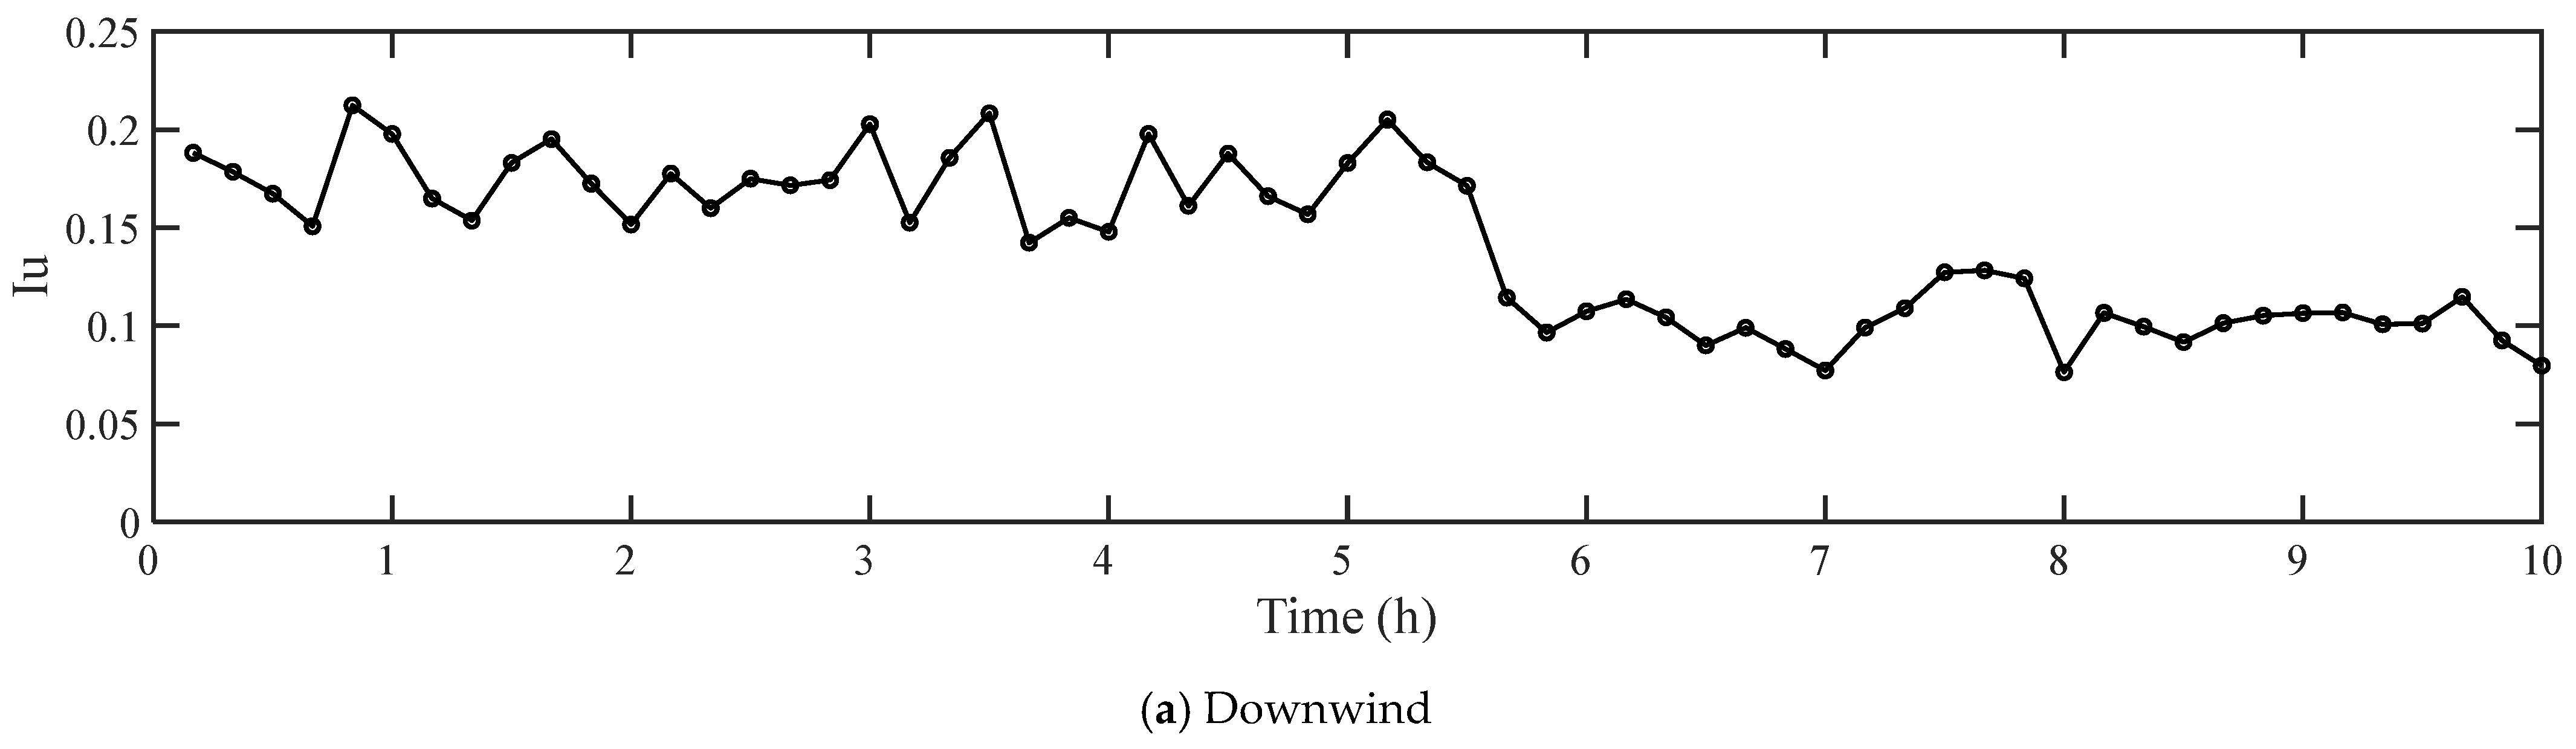
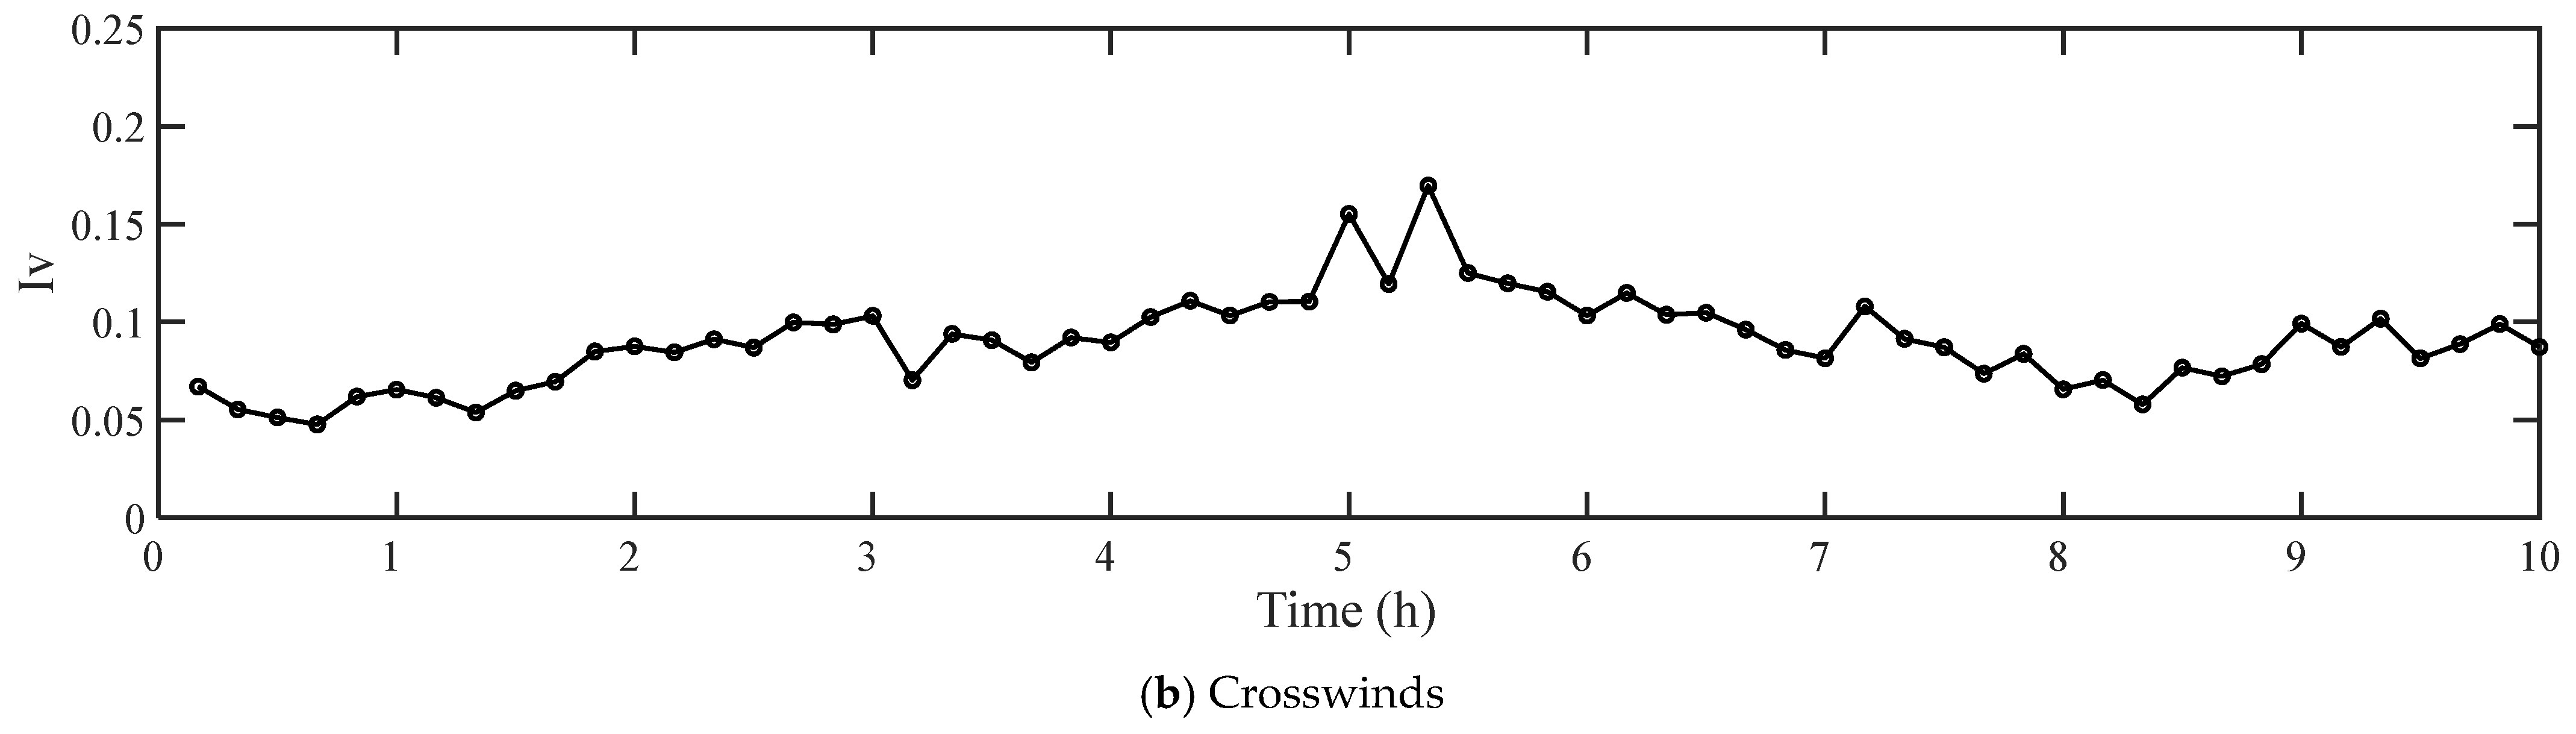
3.2.2. Turbulence Intensity
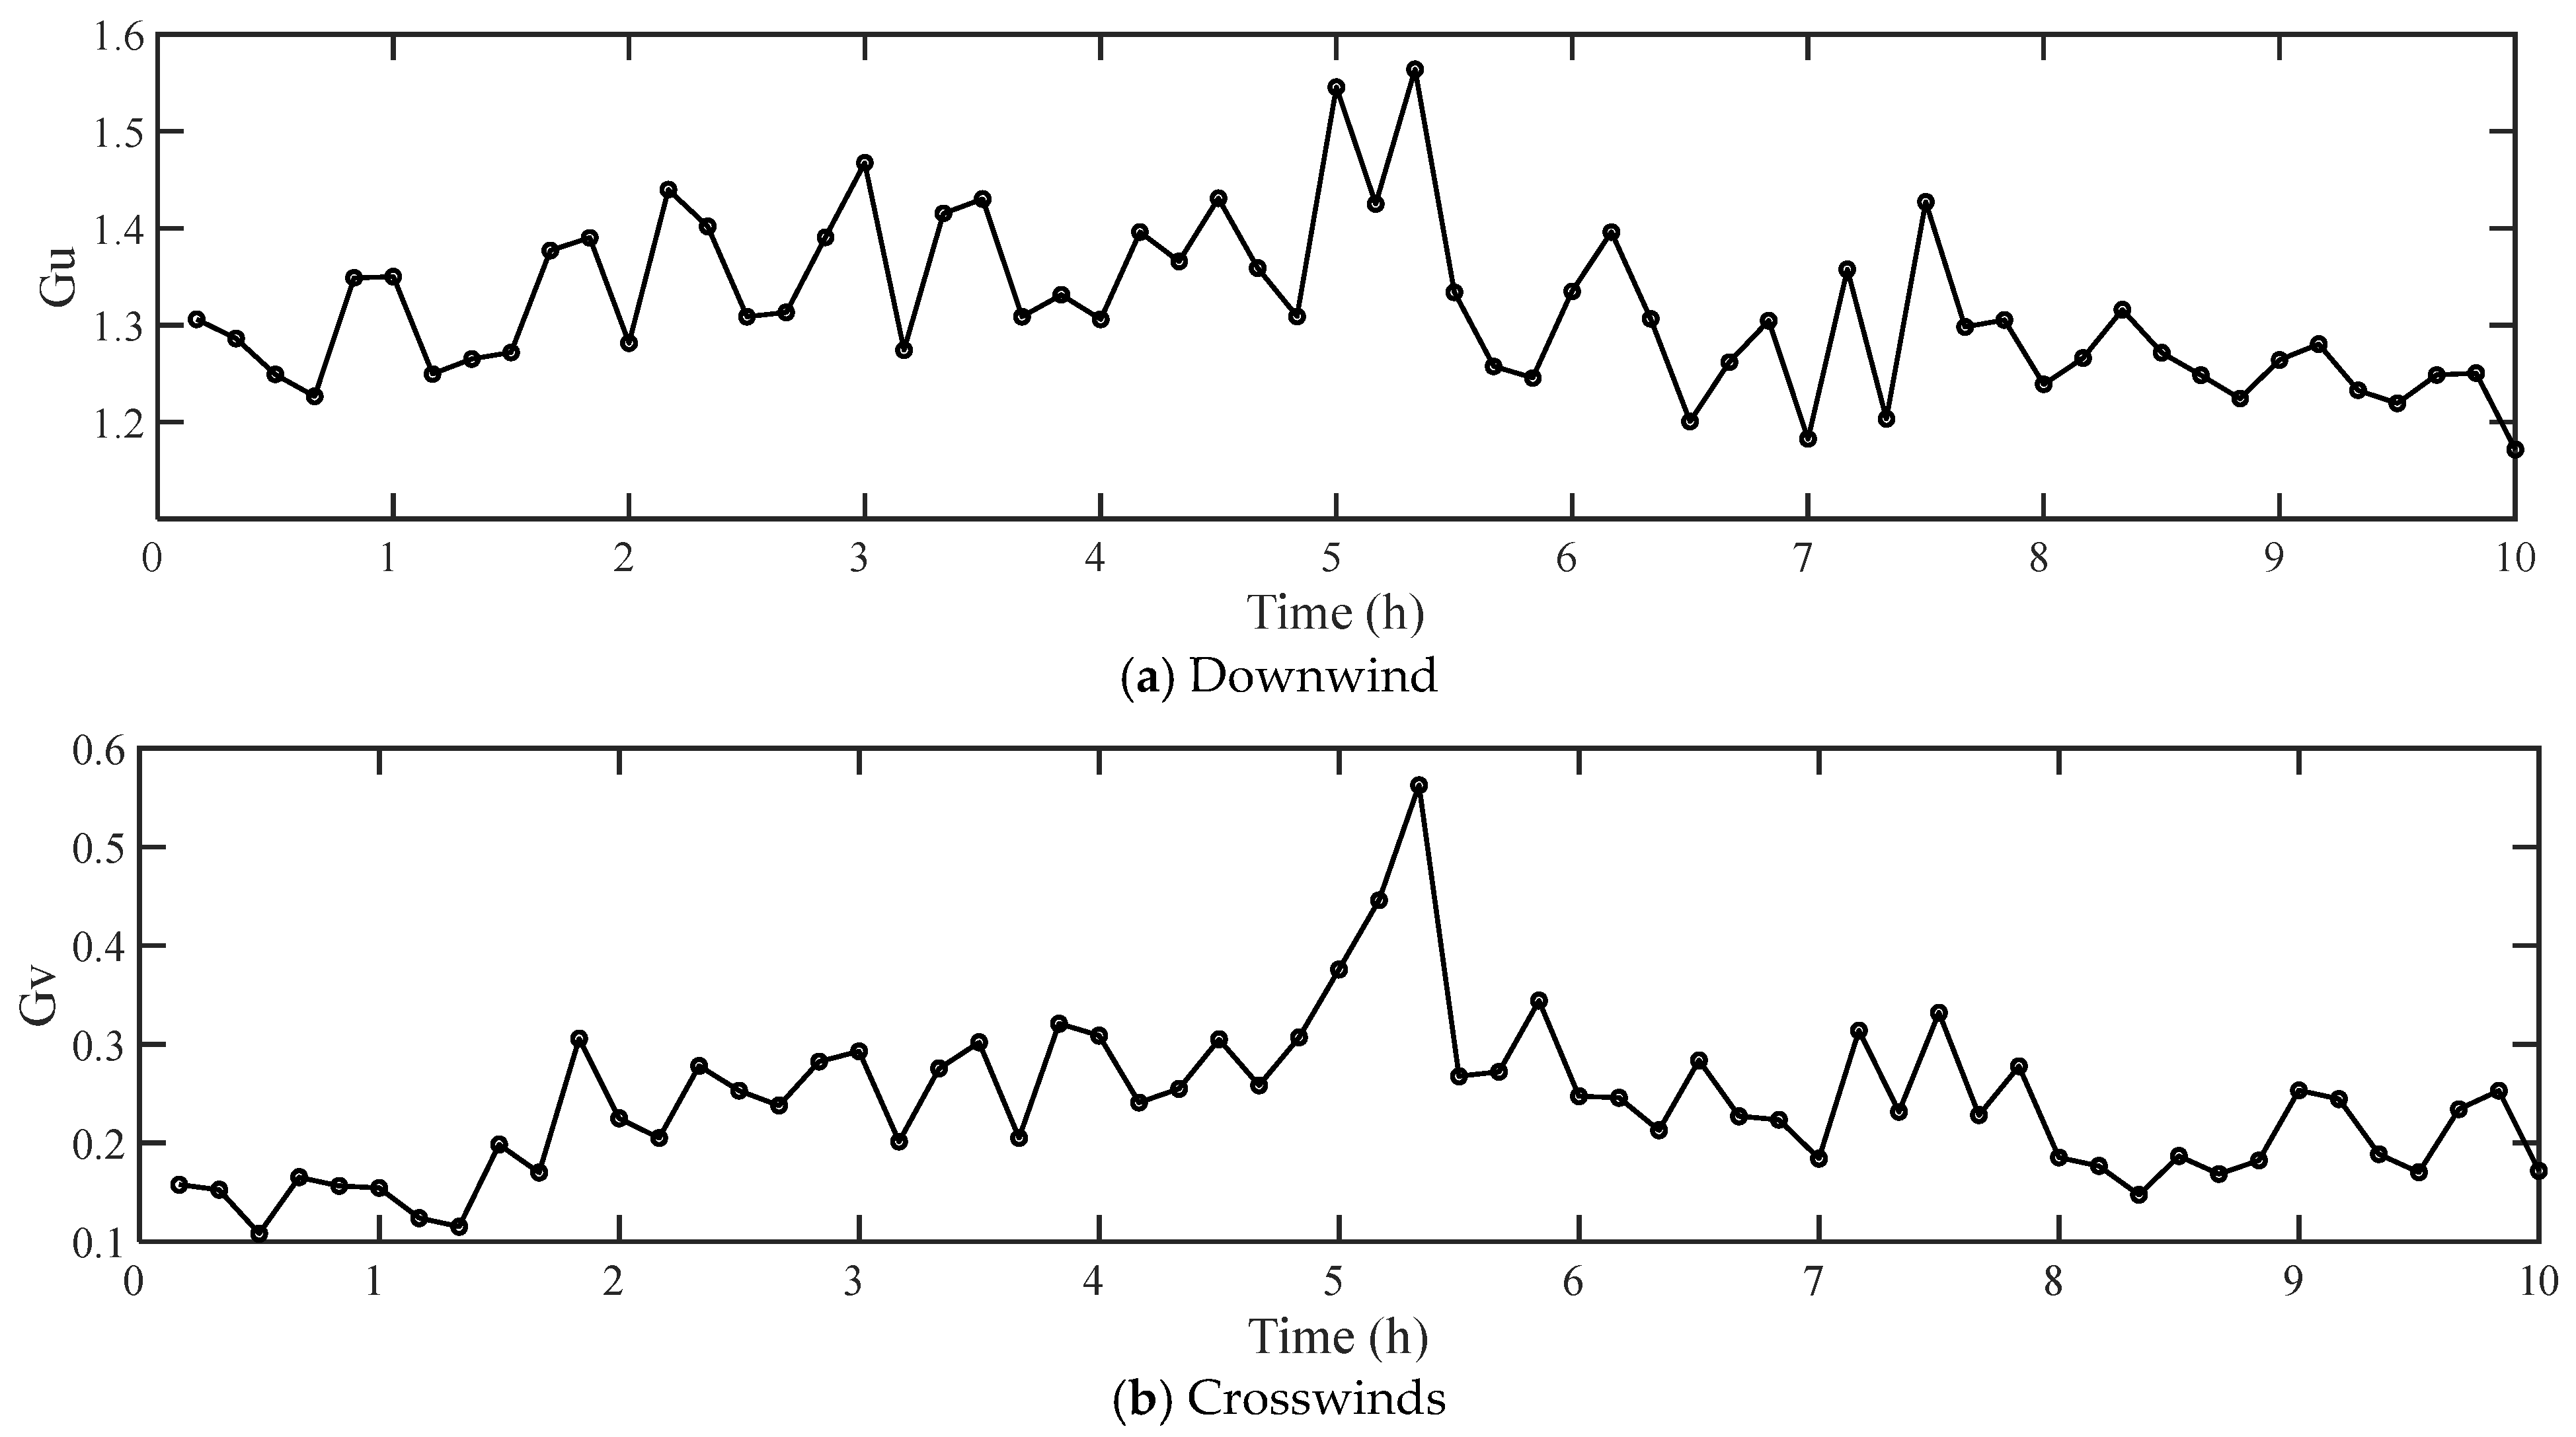
Turbulence intensity is a measure of turbulence development intensity, represented as the ratio of the standard deviation of wind speed to the wind speed itself. It is expressed as follows
I i = σ i U ¯ i = u , v
where ( I u   σ u ) and ( I v   σ v ) are the turbulence intensity (RMS of fluctuating wind speed) in the downwind and crosswind directions, respectively. The turbulence intensity in the two directions for the period when the typhoon passed through the bridge site area is shown in Figure 8.

3.2.3. Gust Factor

The gust factor represents the proportional coefficient between the instantaneous gust wind speed within a time interval (typically 3 s) and the average wind speed over the basic time interval T. The respective formulas for calculating the crosswind G v and windward gust factors G u are
G u = 1 + max [ u 3 s ( t ) ¯ ] U T ¯
G v = max [ v 3 s ( t ) ¯ ] U T ¯
where u 3 s ( t ) ¯ and v 3 s ( t ) ¯ are the mean wind speeds in the downwind and crosswind directions during the 3 s period, respectively; and U T ¯ is the average wind speed within the basic time distance T. The graph of the downwind and crosswind gust factors for the period when the typhoon passed through the bridge site area can be seen in Figure 9.

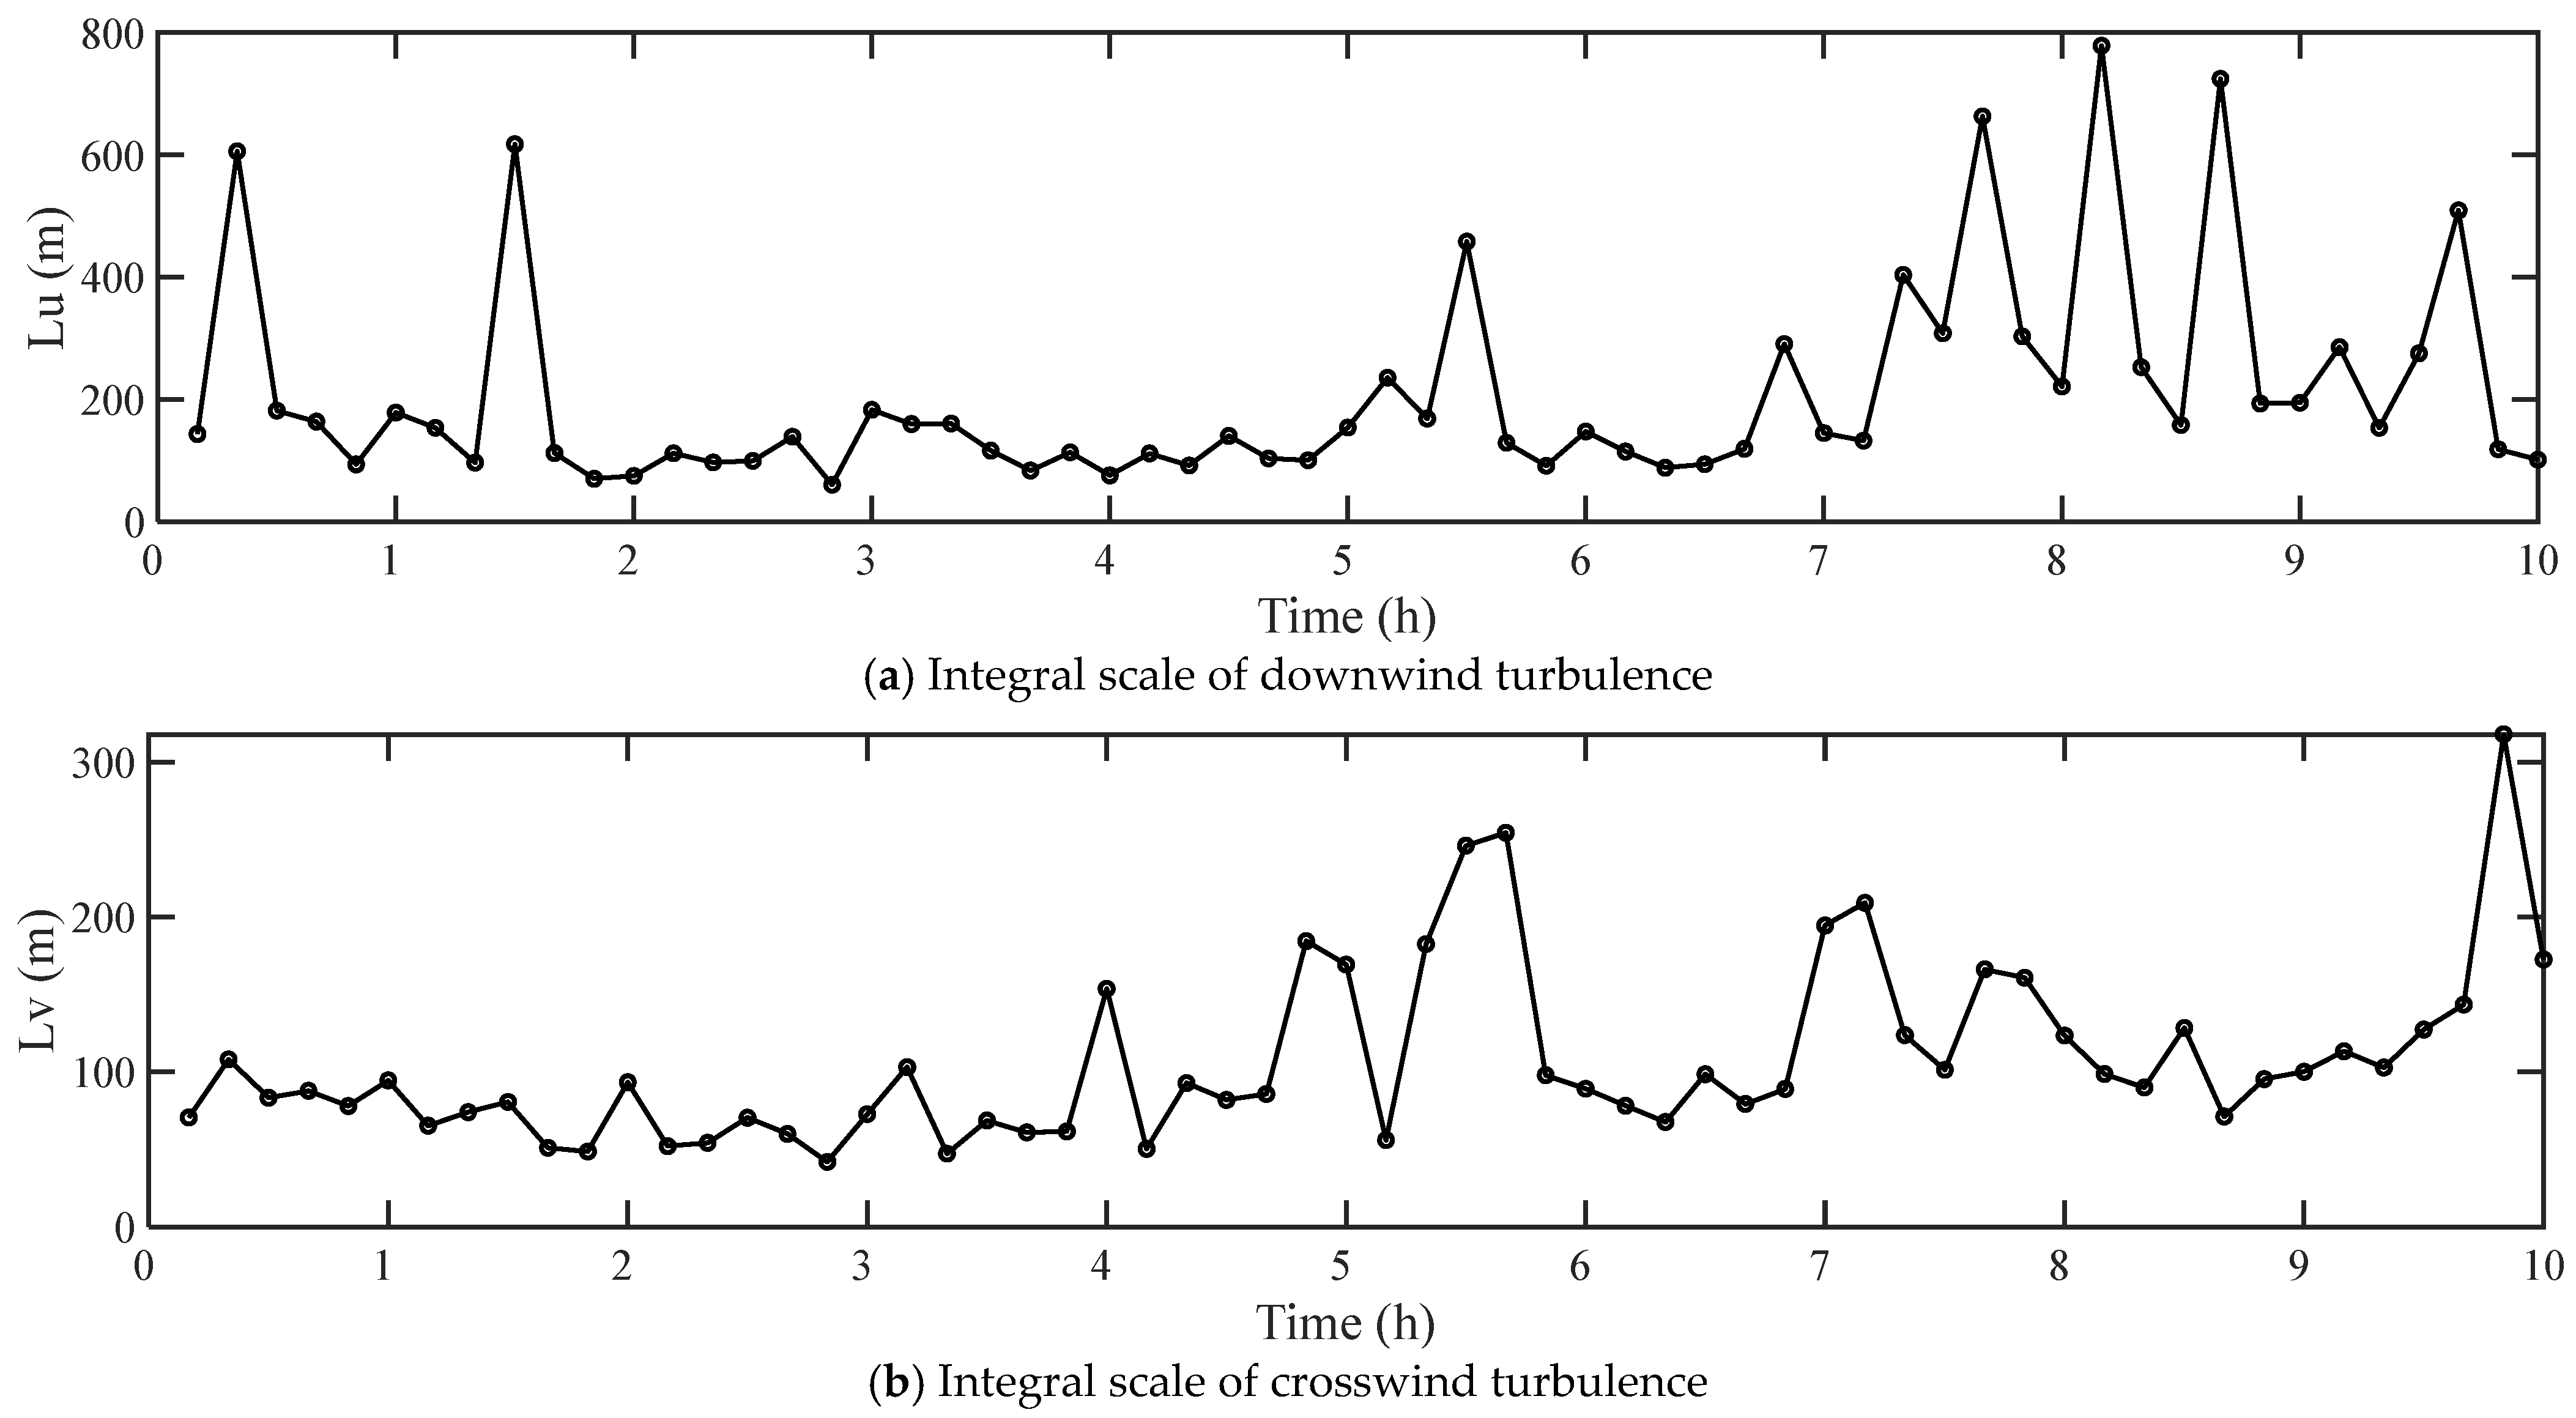
3.2.4. Turbulence Integral Scale

The turbulence integral scale is an important parameter for measuring the average size of vortices in fluctuating winds. The autocorrelation function integration method is utilized to calculate the downwind turbulence integral scale L u and the crosswind turbulence integral scale, L v , as follows
L i = U T ¯ σ i 2 0 R i ( τ ) d τ i = u , v
where σ i 2 and R i ( τ ) are the variance and autocorrelation functions of fluctuating wind speed, and τ is the time interval. To avoid the error caused by the small size of R i ( τ ) , the upper limit of integration in Equation (20) is usually taken as τ , corresponding to R i ( τ ) = 0.05 σ i 2 . The downwind turbulence integral scale of the typhoon is calculated and is shown in Figure 10.

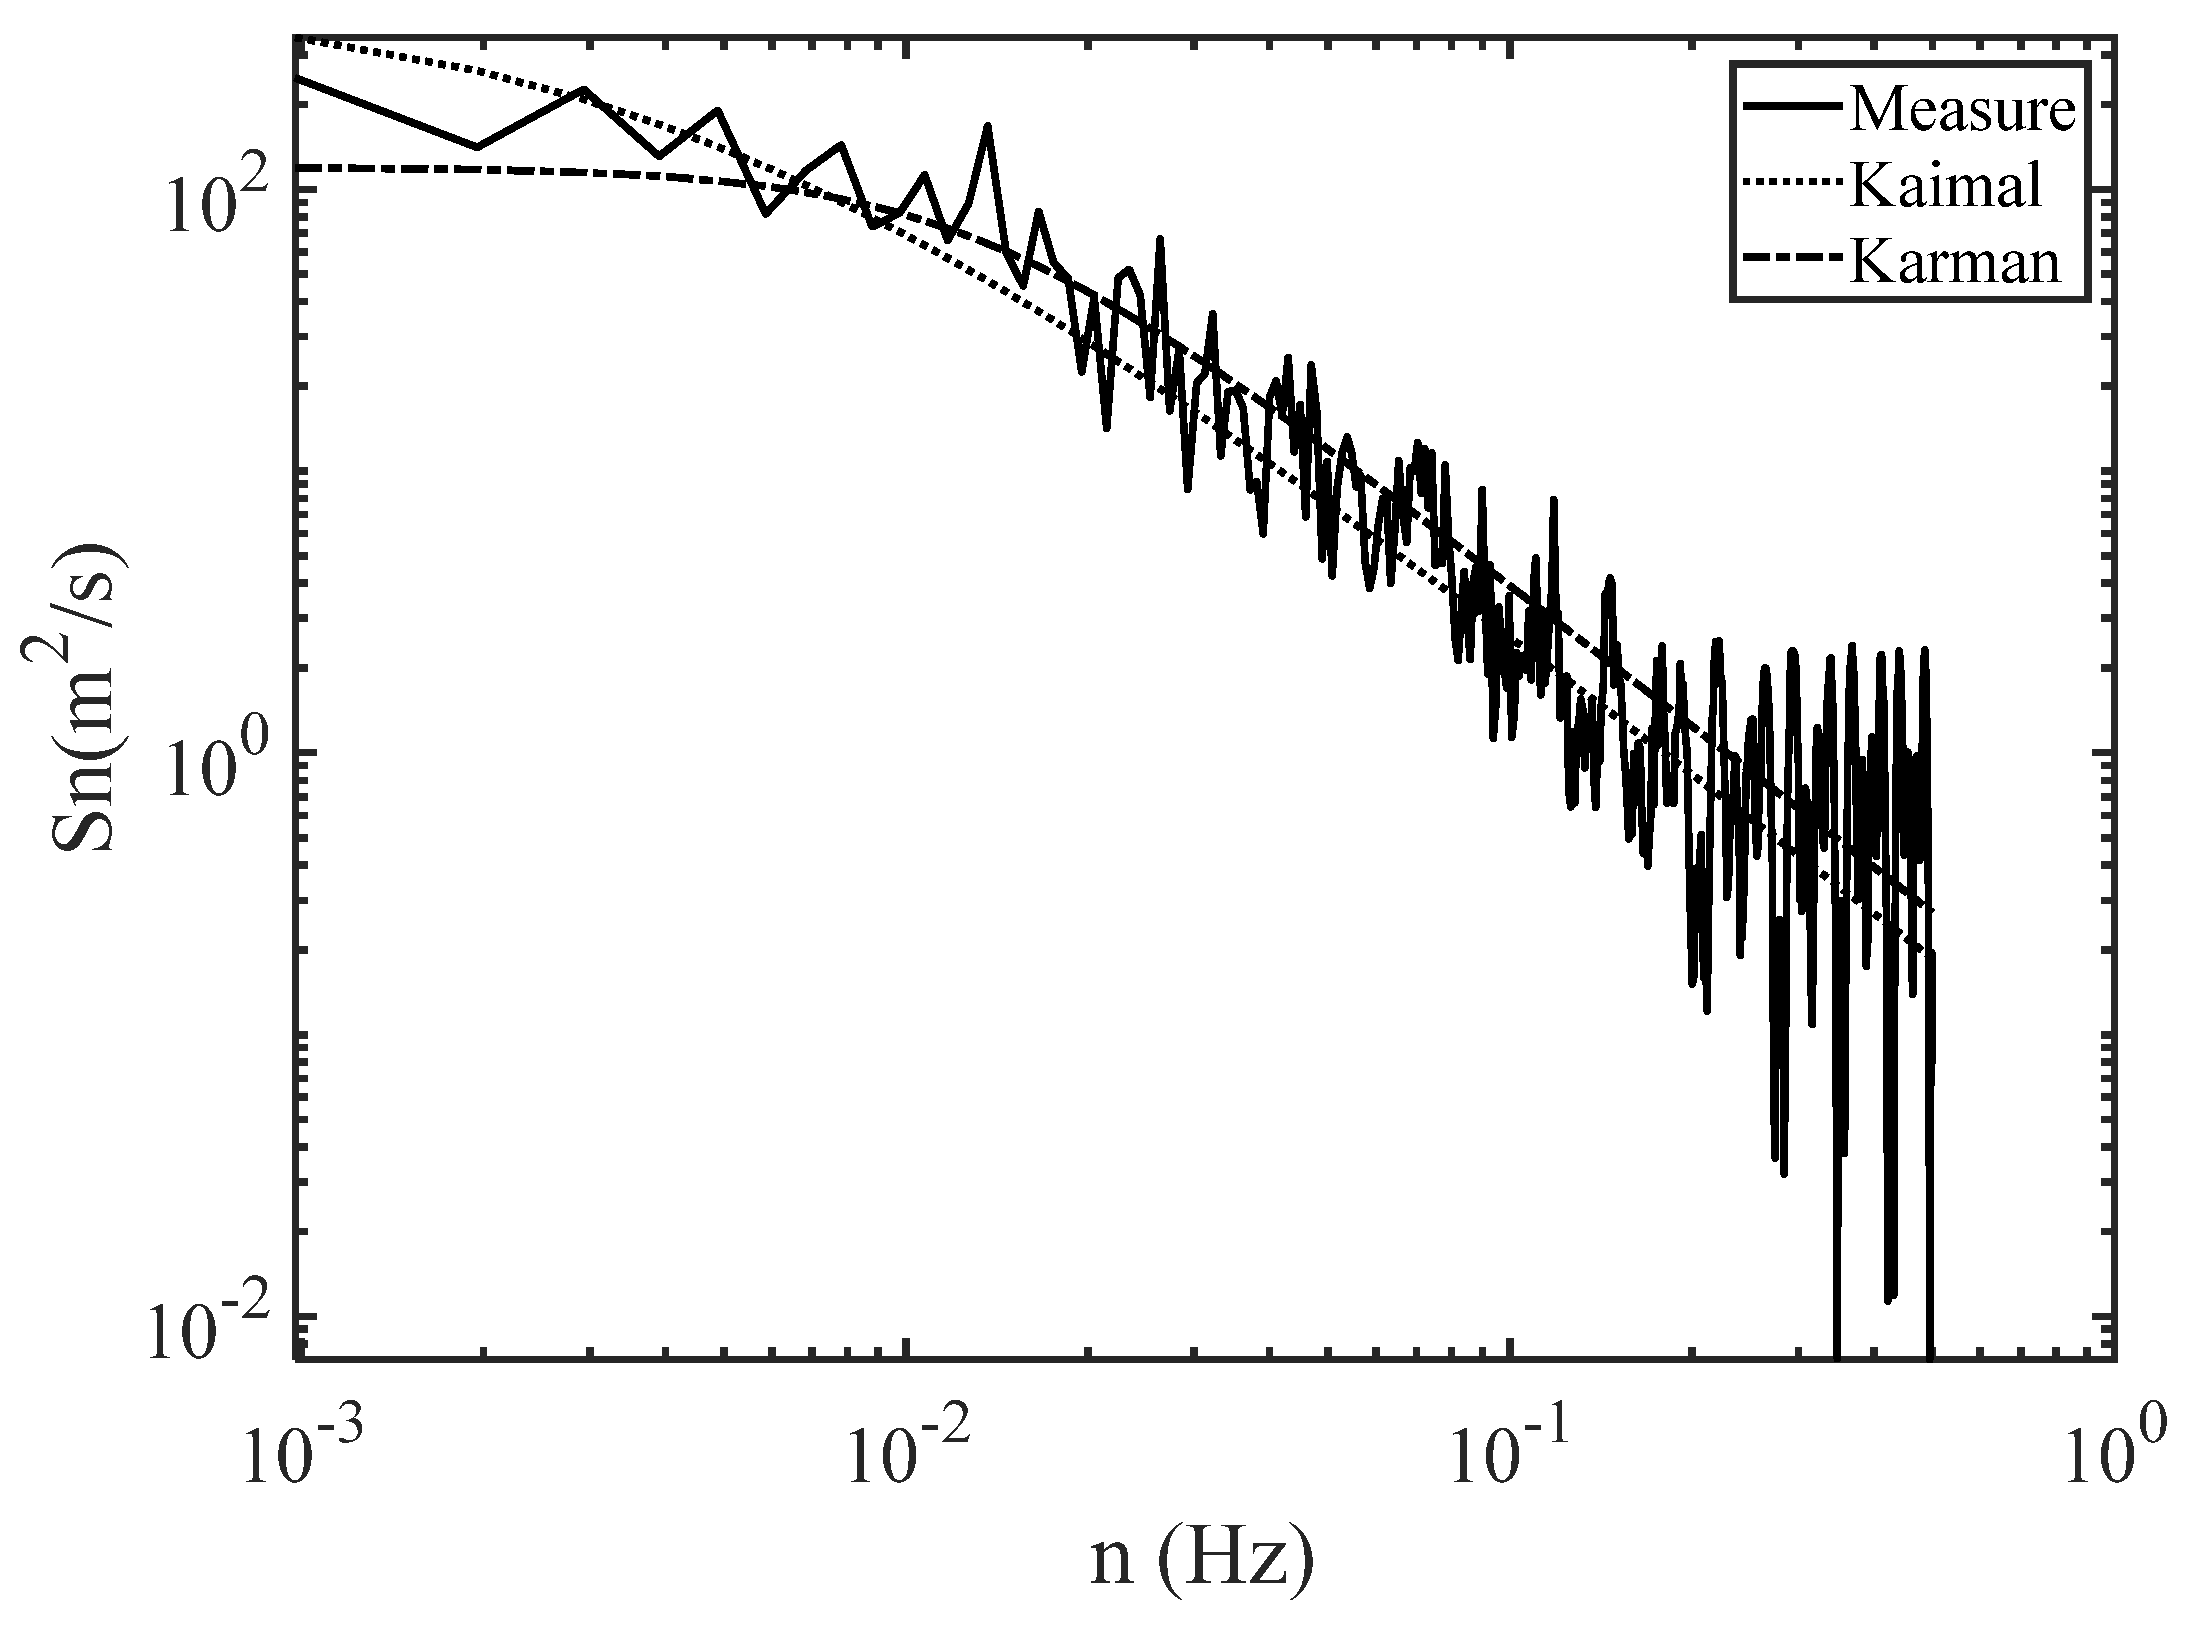
3.2.5. Turbulent Power Spectral Density

The contribution of each motion period component in the fluctuating wind can be represented by the power spectral density. According to the Kolmogorov hypothesis and the Monin–Obukhov similarity theory, the power spectral density function of the steady fluctuating wind can be expressed as follows
n S ( n ) u * 2 = A f γ ( B + C f α ) β
where f = n z / U ¯ is the Monin coordinate; and A, B, C, α , β , γ are the six parameters to be determined and fitted using the least squares method.
The Kaimal spectrum is the horizontal fluctuating wind spectrum model recommended by China’s specification:
S ( n ) = 200 f u * 2 n ( 1 + 50 f ) 5 / 3
where S ( n ) is the density function of the fluctuating wind power spectrum in the horizontal direction, f = n z / U ¯ is the Monin coordinate, u * is the drag velocity of the wind, n is the pulsation frequency of the wind, z is the height above the ground or water surface, and U ¯ is the mean wind speed at z . Using the measured wind speed during the typhoon as a sample, the power spectrum of the measured downwind wind speed is calculated and compared with the empirical spectral model, as shown in Figure 11.

3.3. Model Training and Prediction

3.3.1. Setting of Model-Related Parameters

When building a wind speed prediction model, the number of layers of the BP neural network structure needs to be determined first. A BP neural network with a three-layer structure can approximate any complex nonlinear mapping with arbitrary accuracy [20,21]; thus, a three-layer BP network structure is adopted in this study.
During network training, the input and output of the network need to be set, and a step-by-step incremental approach is used to train the model. The first nth wind speed values are used as inputs for the BP network, and the n + 1th wind speed value is used as the output. When performing wind speed prediction, the number of nodes in the output layer is set as 1. Referring to the results of related research on BP neural networks for wind speed prediction [22,23], it is determined that the number of input nodes for wind speed samples is 15. That is, the first 15 wind speed values are used as inputs to predict the 16th wind speed value.
Determining the number of nodes is relatively difficult in the hidden layer. Currently, it can be determined based on empirical formulas [24] and trial calculations, namely:
q = n + l + a
where n and l represent the number of neurons in the input and output layers, respectively, and a ∈ [0, 10]. Based on the results of the calculation from Equation (23) and the simulation results using Matlab software (Matlab R2020b), it is found that when the number of neuron nodes in the hidden layer is five, the error is relatively small. In this section, the number of nodes in the hidden layer of the neural network is chosen to be five. In addition, when training the neural network structure, it is necessary to determine related parameters such as the learning rate, error precision, and maximum number of training iterations. Detailed values can be seen in Table 1.
GA is adopted for optimization to obtain suitable weights and thresholds, and the length of the individual code is determined from Equation (15): S = 15 × 5 + 5 × 1 + 5 + 1 = 86. The values of the relevant parameters are shown in Table 2.

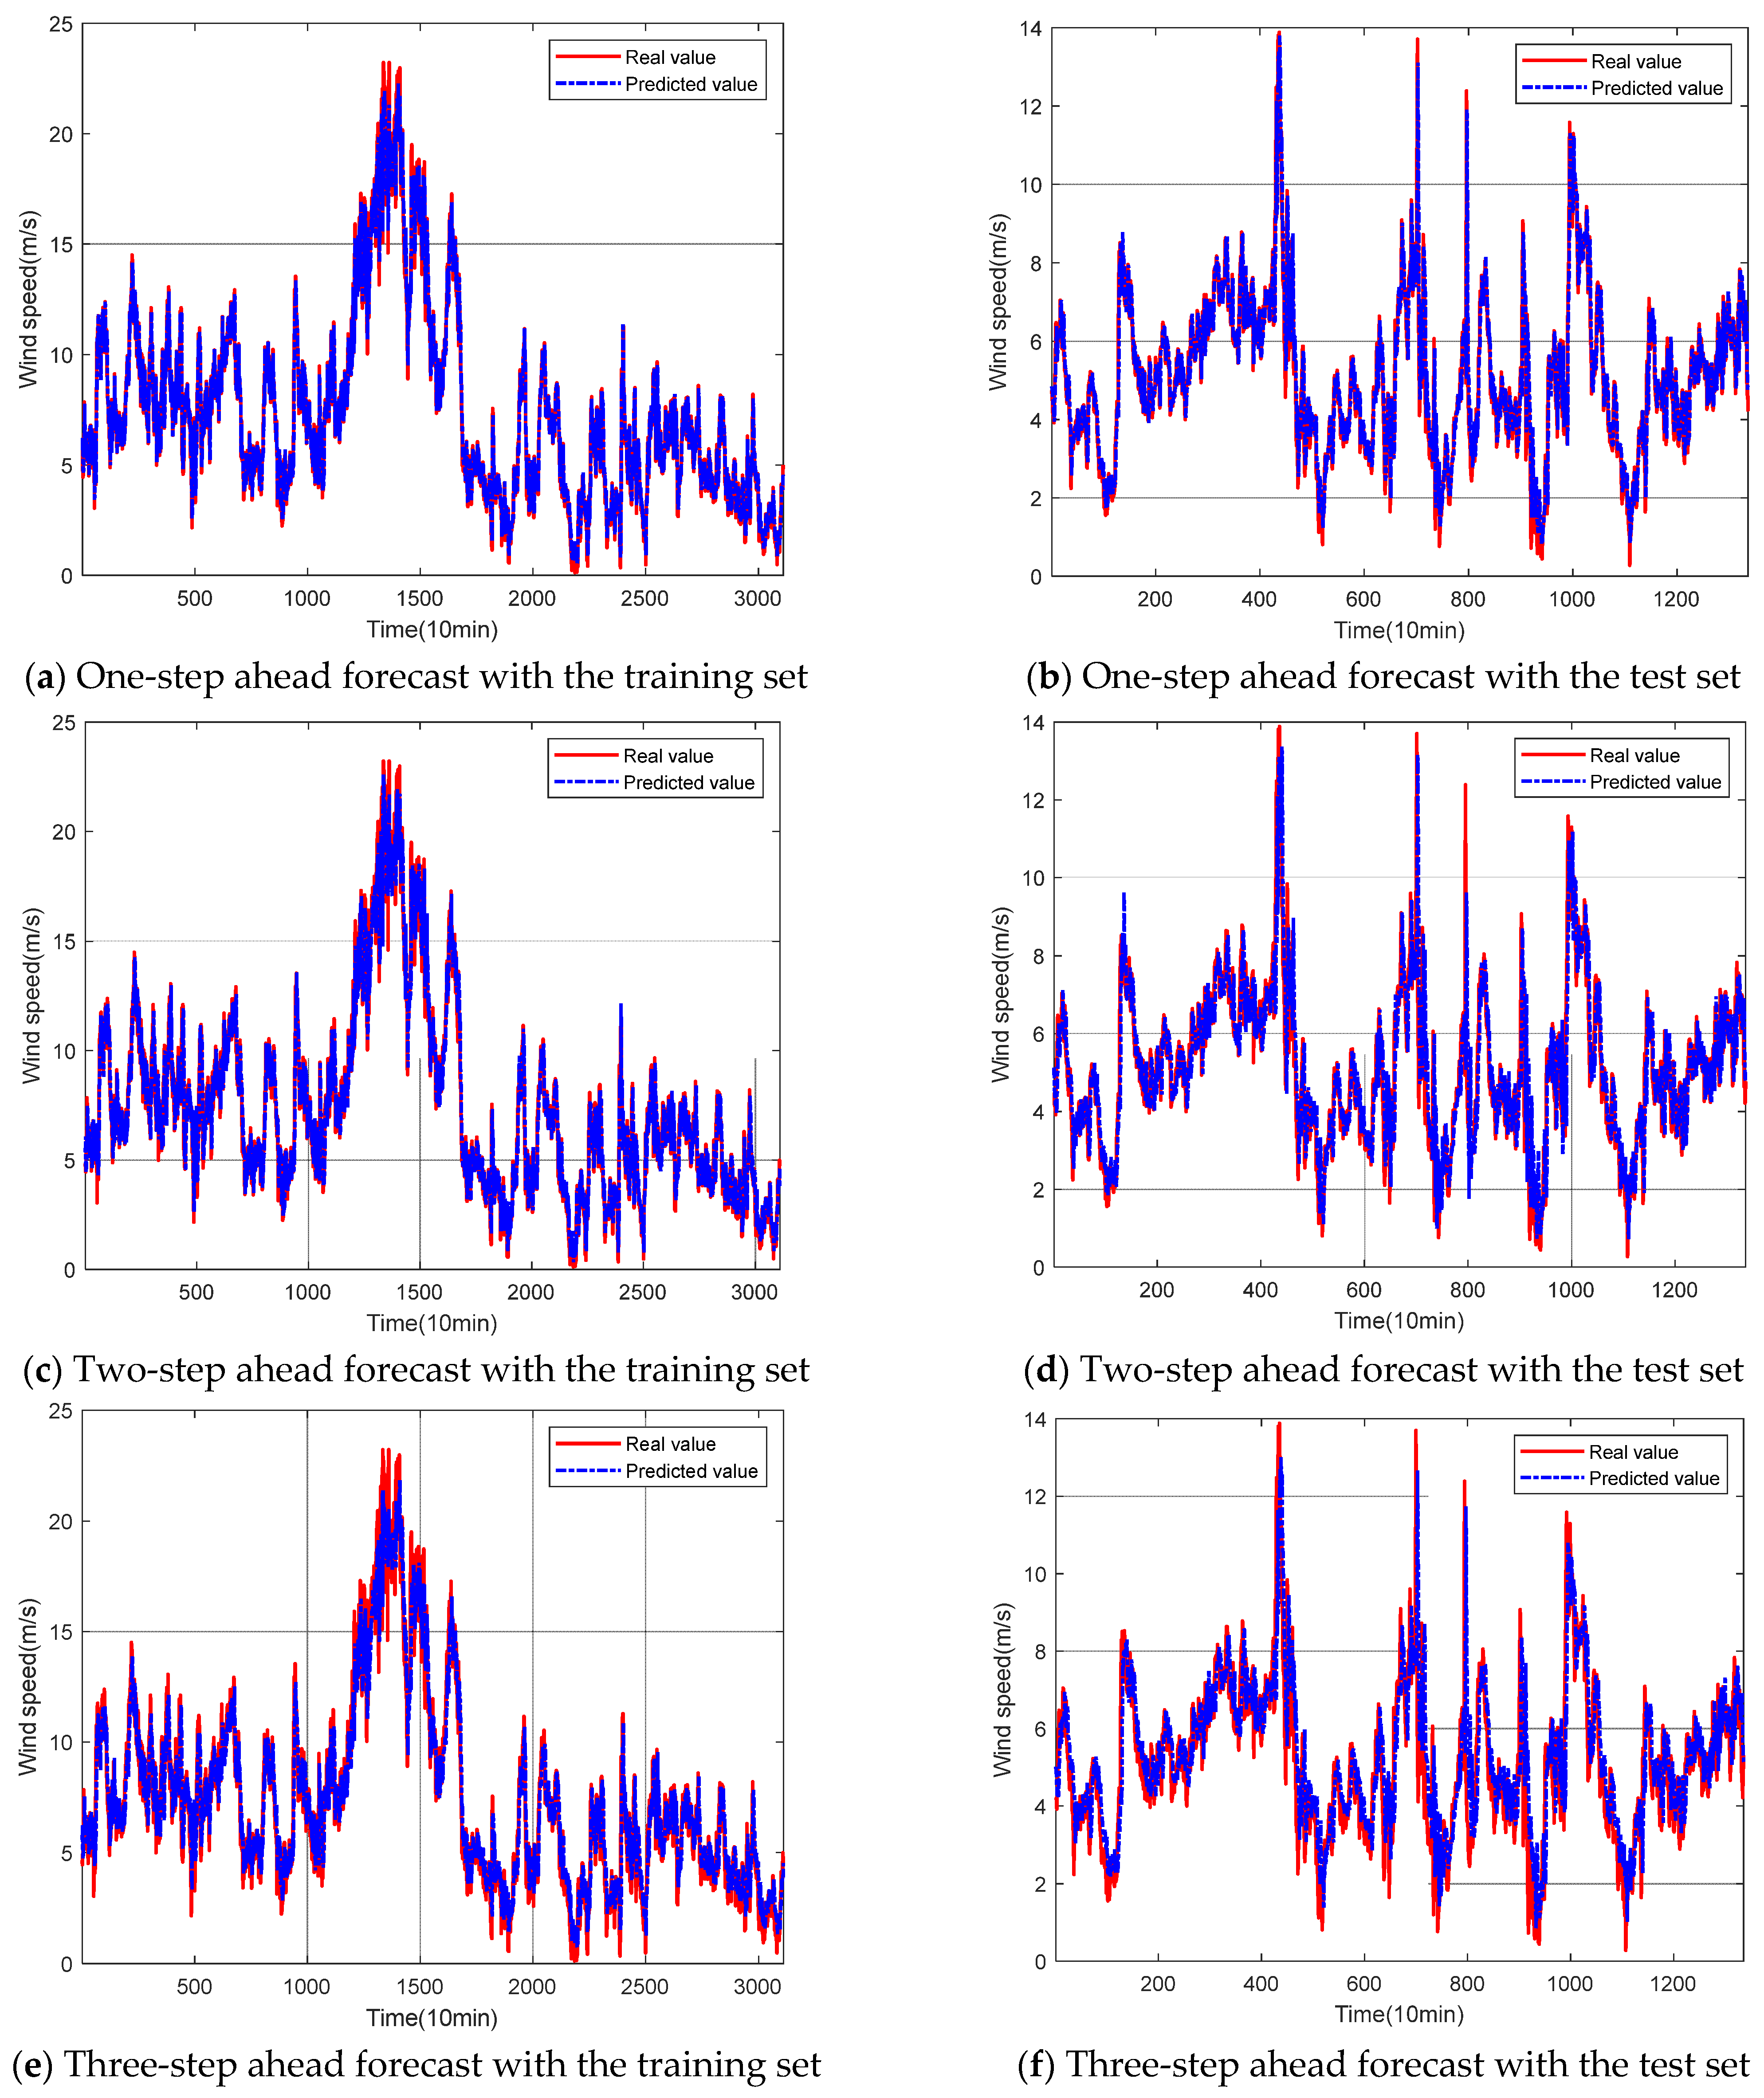
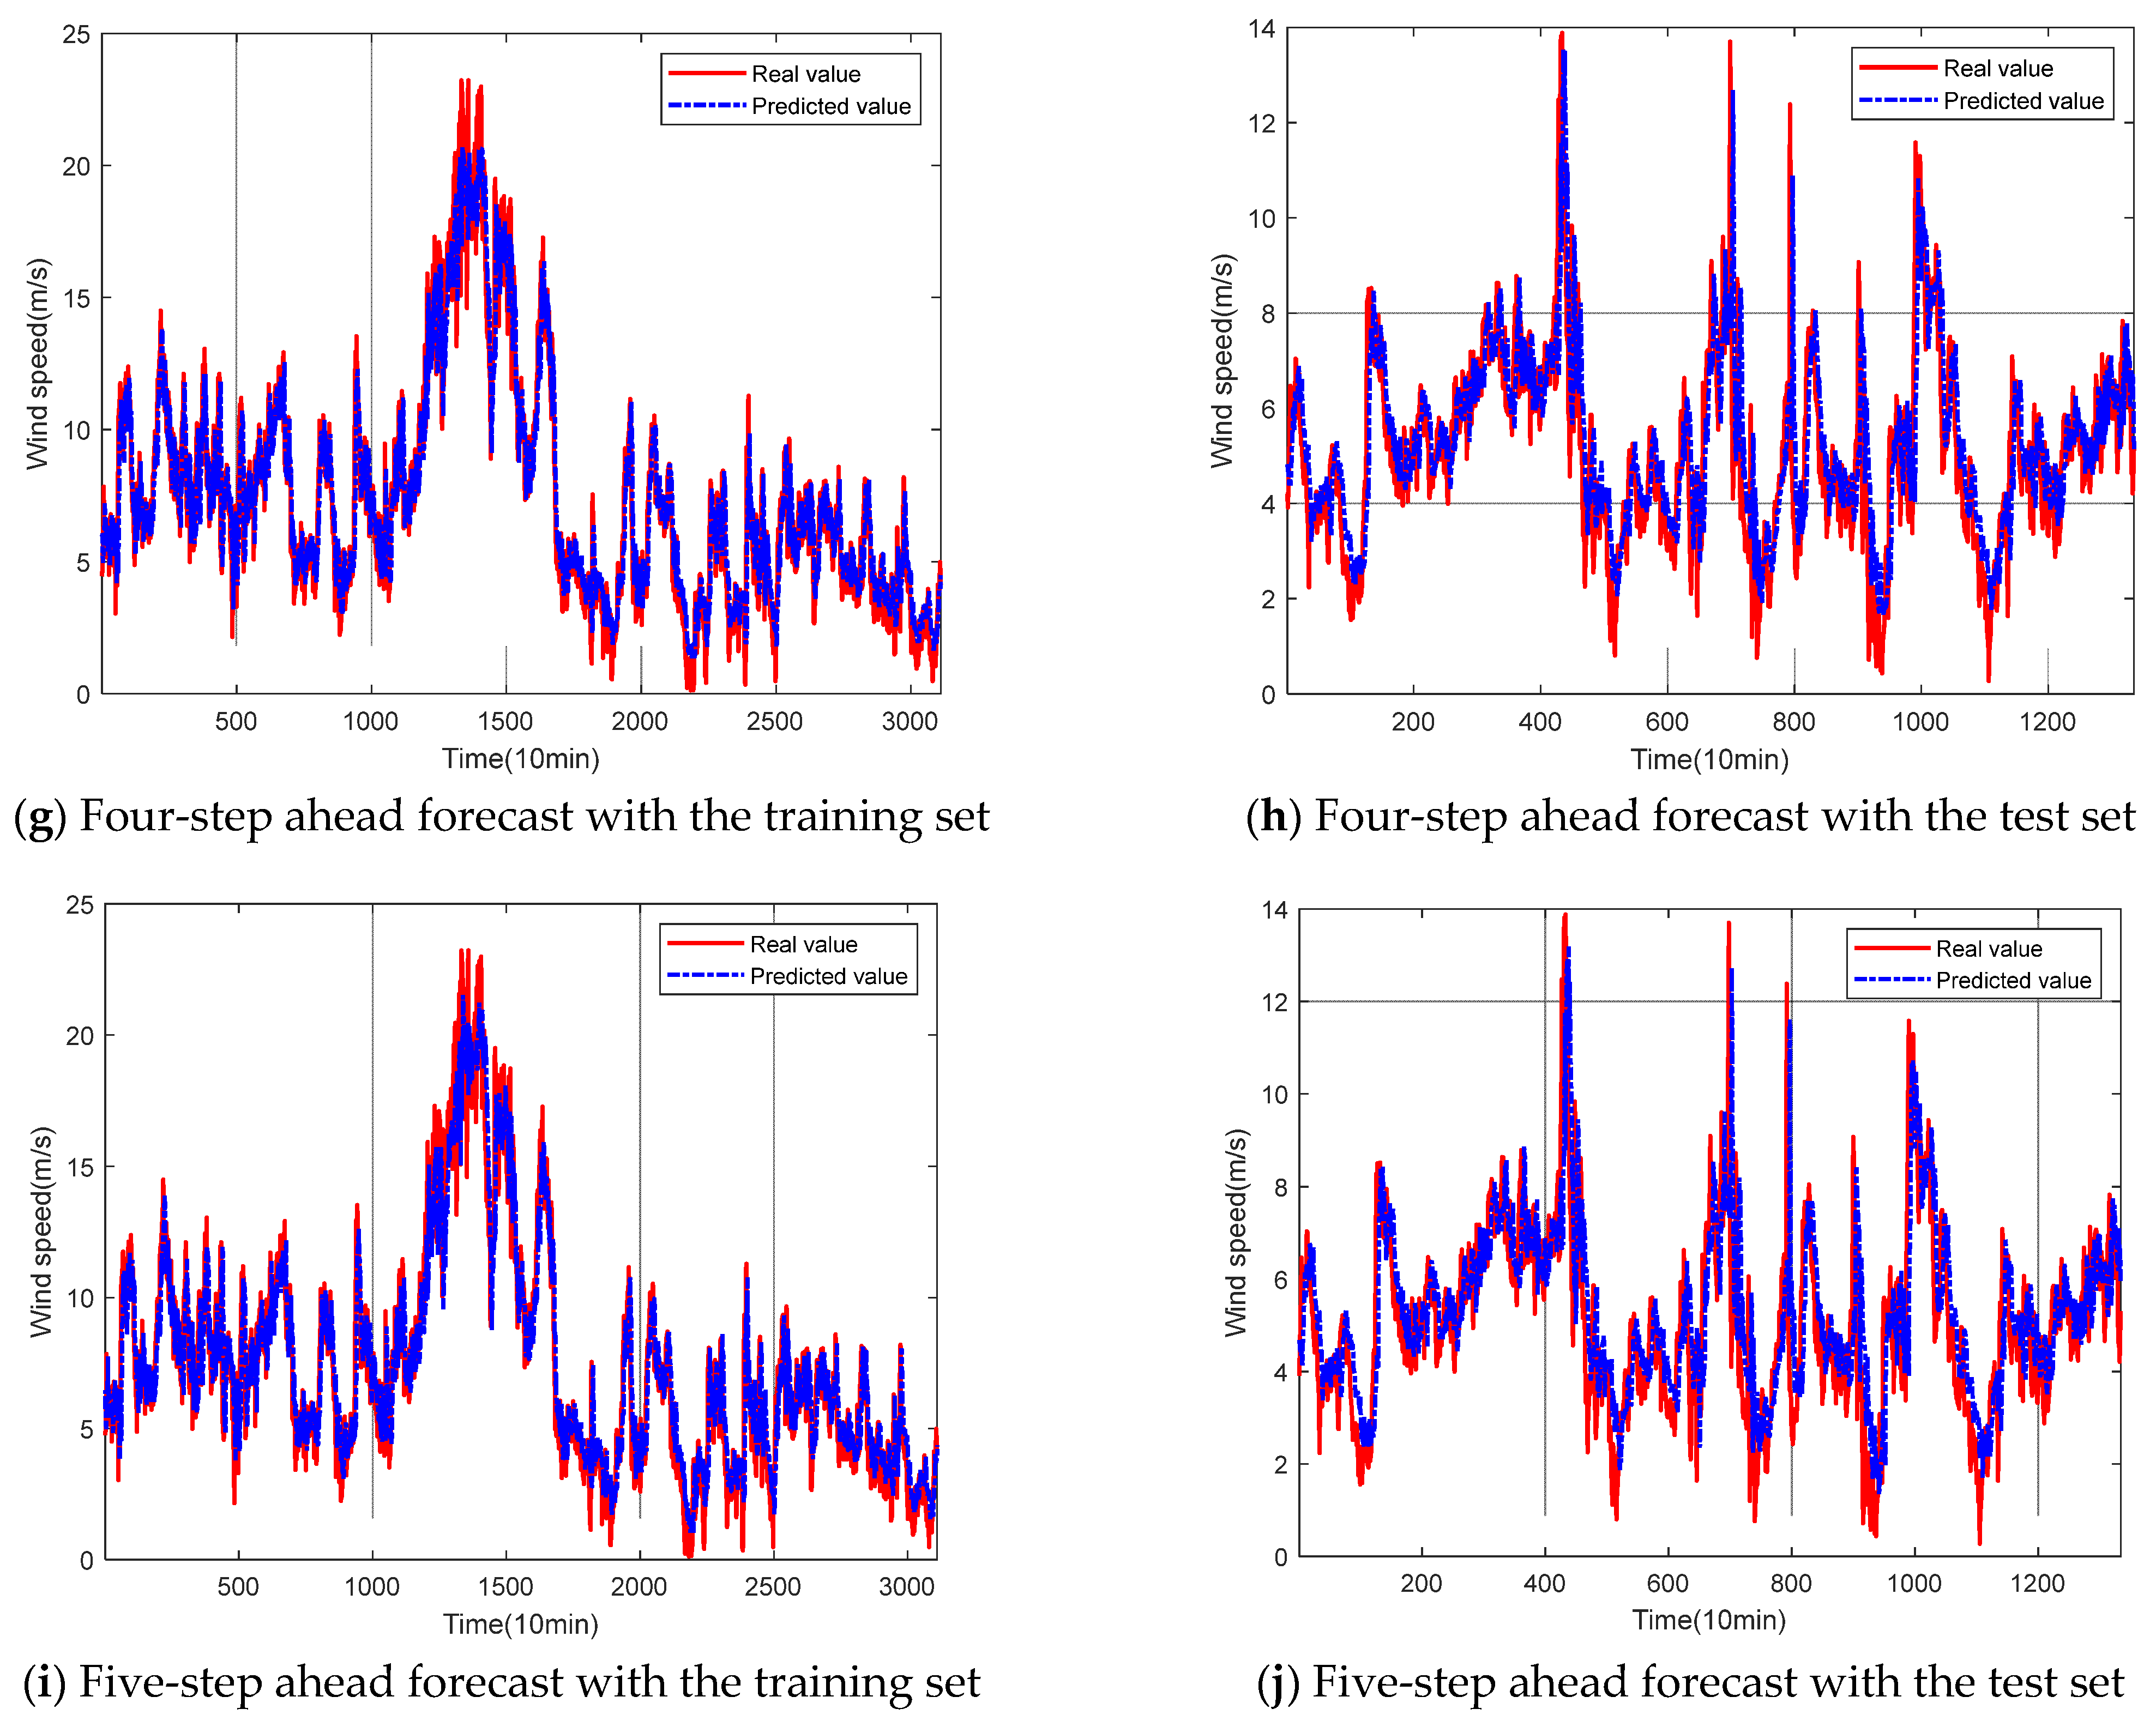
3.3.2. Prediction Results

The data consist of wind speeds from 1 August 2019, 00:00:00 to 31 August 2019, 23:50:00, including wind speed data measured at the bridge site during Typhoon Lekima. There are a total of 4464 wind speed data points, with the first 3125 wind speed data points utilized as training samples and the remaining 1339 as testing samples. The basic prediction time interval is 10 min. A rolling forecast method with a 15-step lead time is used, which means that all the previous 15 wind speed values are used to predict the 16th wind speed value, the 2nd to 16th wind speed values are used to predict the 17th wind speed value, and so on. The structure of the wind speed prediction neural network is shown in Figure 12.
The forecast wind speeds using prediction based on one to five steps ahead are shown in Figure 13. The red solid line is the real wind speed curve, and the blue dashed line is the wind speed prediction curve. It is seen that the predicted curve fits the actual curve, meeting the requirements of prediction accuracy, and that the one-step prediction is the best.

3.3.3. Performance Assessment Guidelines

To verify the stability and accuracy of the model, this section evaluates the prediction performance using three criteria: coefficient of determination (R2), mean absolute error (MAE), and root mean square error (RMSE), which are defined as follows
R 2 = i = 1 n ( y i y i ) 2 i = 1 n ( y i y ¯ ) 2
MAE = i = 1 n | y i y i | N
RMSE = i = 1 n ( y i y i ) 2 N
where y i and y ^ i denote the measured and predicted values of wind speed, and N denotes the number of samples. The larger the coefficient of determination of the model R2, the smaller the values of MAE and RMSE, and the better the prediction performance of the model. The results of R2, MAE and RMSE for gust wind speed prediction are shown in Table 3.
As shown in Table 3, by comparing the prediction errors for one to five steps ahead, it is evident that as the number of prediction steps increases, the prediction error also becomes larger. The prediction error is smallest for a one-step forecast, where the training dataset’s R2, MAE, and RMSE values are 0.967, 0.561, and 0.787, respectively. For the test set, the R2, MAE, and RMSE values are 0.864, 0.489, and 0.734, respectively. The advantage of five-step ahead prediction is that it can directly predict five steps, while single-step prediction cannot. If single-step prediction is used to directly predict five steps ahead, a time paradox results. One-step ahead prediction can perform superposition training prediction and achieve the purpose of five-step ahead prediction with a much smaller error because the input is the most recent data.

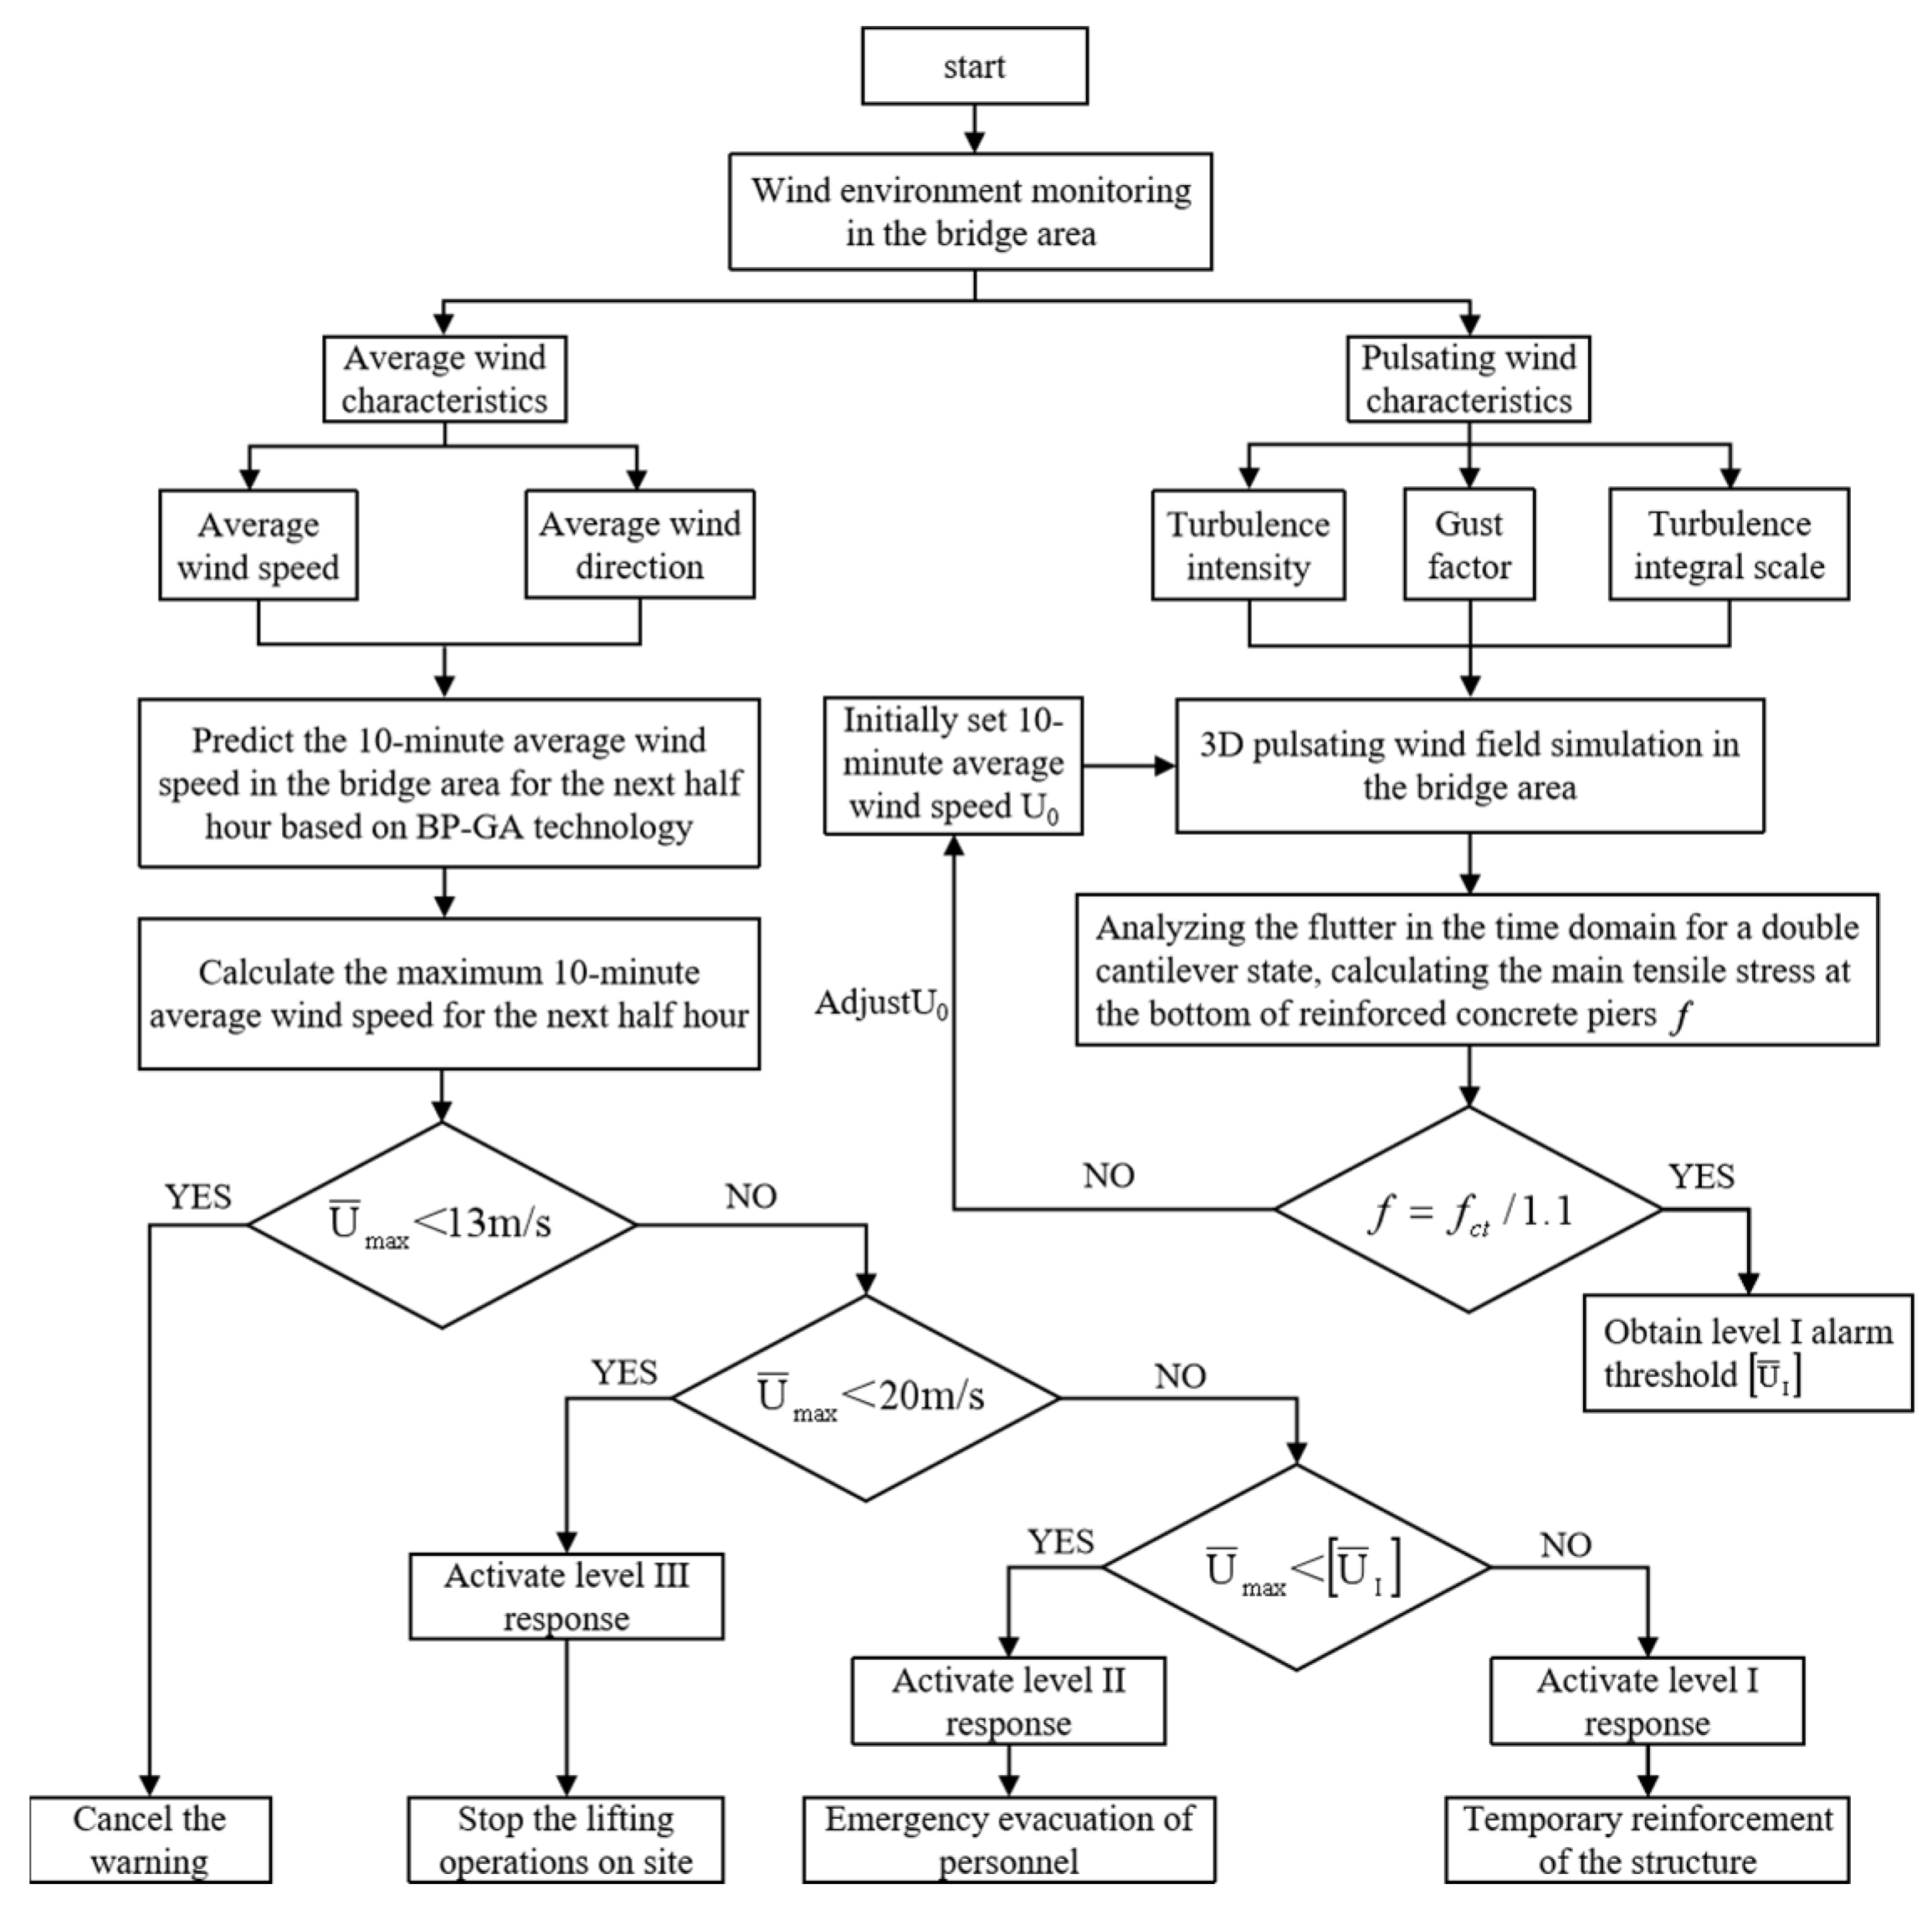
3.4. Wind Speed Warning and Hierarchical Control

For long-span HSR bridges, wind load has a significant impact during the cantilever construction stage. As the wind load increases, site management will progressively implement control measures, including halting hoisting operations, evacuating construction personnel, and temporarily reinforcing the structure. Thus, it is essential to incorporate wind speed prediction techniques to forecast wind speeds at the construction site and implement proactive countermeasures to ensure on-site construction safety.
Based on Wind Resistance Design Specification for Highway Bridges [24], a wind level, wind speed, and terrestrial surface phenomena contrast table describes that under the action of a level 6 strong wind, large tree branches sway, electrical wires make a humming sound, and walking is difficult, with a wind speed range of 10.8–13.8 m/s. Under a level 8 gale, “people feel significant resistance while walking”, with a wind speed range of 17.2–20.7 m/s. Furthermore, the Technical Specification for Construction Safety of Railway Bridges and Culverts [25] states that crane lifting operations are not allowed under adverse weather conditions or wind forces of level 6 or higher. The Technical Specification for Safety of Installation, Use and Disassembly of Building Hoist in Construction [26] specifies that tower crane and elevator installation construction are prohibited when wind speeds exceed 13 m/s, and the use of construction elevators is forbidden when wind speeds at the top exceed 20 m/s. In summary, when wind speeds exceed 13 m/s, lifting operations should be suspended on-site, and when wind speeds exceed 20 m/s, on-site workers should evacuate to a safe location as soon as possible.
To avoid cracks at the base of reinforced concrete piers under the influence of strong typhoons, it is necessary to calculate the stress at the base of the reinforced concrete piers under typhoon conditions. Furthermore, implementing temporary reinforcement measures in advance ensures that the stress at the pier base meets crack-resistance requirements. According to the Code for Design of Railway Bridges and Culverts [27], the crack-resistance safety factor during the construction period of the bridge pier is taken as 1.1, and the limit tensile strength of the pier concrete is denoted as fct. The controlling tensile stress at the base of the pier during construction is fct/1.1. By performing time-domain analysis on large-span high-speed rail continuous beam bridges in the maximum dual-cantilever state during construction, the controlling tensile stress f at the base of the pier can be back-calculated when it reaches the controlling stress. The maximum 10 min mean gust wind speed at the bridge deck level can then be determined, and this can serve as the threshold for Level I wind speed alarms [ U ¯ I ] . When the maximum gust wind speed at the bridge deck level within the next half hour, as predicted by wind speed forecasting methods, exceeds the aforementioned wind speed alarm value, temporary reinforcement measures should be applied to the bridge piers to ensure their crack-resistance safety.
Based on the on-site measured typhoon data, a wind speed prediction method is proposed to forecast the maximum gust wind speed at the bridge deck for the next half hour during construction. With the gust wind speed predictions and the results of bridge vibration analysis, we implemented graded warnings and control measures for on-site construction.
(1)
When the predicted maximum gust average wind speed U ¯ max is greater than 13 m/s for the next half hour, which is equivalent to a Class 6 wind speed, a Class III response is initiated and on-site lifting operations are halted.
(2)
When the predicted maximum gust average wind speed U ¯ max exceeds 20 m/s for the next half hour, which is equivalent to a Class 8 wind speed, a Class II response is activated and all on-site construction personnel are evacuated.
(3)
When the predicted maximum gust average wind speed U ¯ max for the next half hour surpasses the Level I response threshold, a Level I response is initiated and temporary reinforcement measures, such as wind cables on the bridge abutment, are taken to ensure the structure’s safety against wind loads. For the background engineering cases, the calculated bridge deck location Level I wind speed response threshold is 52 m/s. The grading and early-warning and control system is illustrated in Figure 14.

4. Conclusions

The safe construction of the long-span bridges can ensure the timely opening traffic arteries in a locality and improve the speed of economic development. The wind environment in the construction process of long-span bridges affects the construction efficiency and safety; thus, it is vital to predict the wind environment effectively. This study proposes an early-warning framework for bridge construction under severe weather conditions based on machine learning. A long-span HSR continuous girder bridge in the southeast coastal region is used to demonstrate this framework. Firstly, commonly used wind characteristic parameters for characterizing the wind environment in the bridge site area are calculated, including the fluctuating wind turbulence intensity and gust factors. Simultaneously, a prediction of gust wind speed during bridge construction was made based on the hybrid BP-GA. The typhoon grading early-warning and control system for the construction site can then be implemented based on the prediction results. The main conclusions are as follows:
(1)
With the increase in the number of prediction steps, the prediction error became larger and larger. The error of the one-step prediction was the smallest, with the training set values of R2, MAE and RMSE being 0.967, 0.561 and 0.787, respectively. The test set values of R2, MAE and RMSE were 0.864, 0.489 and 0.734, respectively.
(2)
Using the hybrid BP-GA, a multi-step ahead prediction of gust wind speed during the construction period of a large-span bridge was conducted. The prediction results show that the prediction curve is close to the actual curve and meets the prediction accuracy requirements, with the one-step prediction having the best performance.
(3)
Based on the measured wind data of the bridge site area during the construction period, the gust wind speed prediction method based on BP-GA was used to predict the wind speed trend in the next half hour. Afterward, a graded early-warning and control system were implemented.

Author Contributions

Conceptualization, Y.X., J.M. and H.W.; methodology, Y.X.; software, Y.X.; validation, Y.X.; formal analysis, Y.X.; investigation, Y.X.; resources, Y.X., J.M., H.W., X.C. and Y.N.; data curation, Y.X.; writing—original draft preparation, Y.X.; writing—review and editing, J.M. and H.W.; visualization, Y.X.; supervision, J.M. and H.W.; project administration, J.M. and H.W.; funding acquisition, J.M. and H.W. All authors have read and agreed to the published version of the manuscript.

Funding

This research was funded by the National Natural Science Foundation of China (grant number: 52108274, 51978155), and the Open Foundation of National Engineering Laboratory for High-Speed Railway Construction (grant number: HSR202003).

Institutional Review Board Statement

Not applicable.

Informed Consent Statement

Not applicable.

Data Availability Statement

The data presented in this study are available on request from the corresponding author.

Acknowledgments

The authors also would like to thank Nanjing Highway Development (Group) Co., Ltd. for the bridge data. Contributions by the anonymous reviewers are also highly appreciated.

Conflicts of Interest

The authors declare no conflict of interest.

References

  1. Par Gomes, L.; Vickery, B. On the prediction of extreme wind speeds from the parent distribution. J. Wind. Eng. Ind. Aerodyn. 1977, 2, 21–36. [Google Scholar] [CrossRef]
  2. Deng, Y.; Ding, Y.-L.; Li, A.-Q.; Zhou, G.-D. Prediction of extreme wind velocity at the site of the Runyang Suspension Bridge. J. Zhejiang Univ. Sci. A 2011, 12, 605–615. [Google Scholar] [CrossRef]
  3. Wang, H.; Zhang, Y.-M.; Mao, J.-X.; Wan, H.-P. A probabilistic approach for short-term prediction of wind gust speed using ensemble learning. J. Wind. Eng. Ind. Aerodyn. 2020, 202, 104198. [Google Scholar] [CrossRef]
  4. Lee, S.-L.; Kim, S.-W. Estimation of basic wind speed at bridge construction site based on short-term measurements. KSCE J. Civ. Environ. Eng. Res. 2013, 33, 1271–1279. [Google Scholar]
  5. Cochran, L.; Derickson, R. A physical modeler’s view of computational wind engineering. J. Wind. Eng. Ind. Aerodyn. 2011, 99, 139–153. [Google Scholar] [CrossRef]
  6. Erdem, E.; Shi, J. ARMA based approaches for forecasting the tuple of wind speed and direction. Appl. Energy. 2011, 88, 1405–1414. [Google Scholar] [CrossRef]
  7. Wang, H.; Mao, J.-X.; Spencer, B.F., Jr. A monitoring-based approach for evaluating dynamic responses of riding vehicle on long-span bridge under strong winds. Eng. Struct. 2019, 189, 35–47. [Google Scholar] [CrossRef]
  8. Liu, H.; Liu, C.; He, S.; Chen, J. Short-term strong wind risk prediction for high-speed railway. IEEE Trans. Intell. Transp. Syst. 2021, 22, 4243–4255. [Google Scholar] [CrossRef]
  9. Shao, X.D. Bridge Engineering (Fourth Version); China Communications Press: Beijing, China, 2016. [Google Scholar]
  10. Boonyapinyo, V.; Lauhatanon, Y.; Lukkunaprasit, P. Nonlinear aerostatic stability analysis of suspension bridges. Eng. Struct. 2006, 28, 793–803. [Google Scholar] [CrossRef]
  11. Jin, C.; Jianjing, J. Influence of Wind on Stability of Bridges and Its Countermeasures. J. Nat. Disasters 2002, 11, 81–84. [Google Scholar]
  12. Hu, N.; Dai, G.-L.; Yan, B.; Liu, K. Recent development of design and construction of medium and long span high-speed railway bridges in China. Eng. Struct. 2014, 74, 233–241. [Google Scholar] [CrossRef]
  13. Chen, Z.; Yu, X.; Yang, G.; Spencer, B., Jr. Wind-induced self-excited loads on bridges. J. Struct. Eng. 2005, 131, 1783–1793. [Google Scholar] [CrossRef]
  14. JTG/T 3360-01-2018; Wind-Resistant Design Specification for Highway Bridges. China Communications Press: Beijing, China, 2018.
  15. Hoppmann, U.; Koenig, S.; Tielkes, T.; Matschke, G. A short-term strong wind prediction model for railway application: Design and verification. J. Wind. Eng. Ind. Aerodyn. 2002, 90, 1127–1134. [Google Scholar] [CrossRef]
  16. Wang, D.-M.; Wang, L.; Zhang, G.-M. Short-term wind speed forecast model for wind farms based on genetic BP neural network. J. Zhejiang Univ. Eng. Sci. 2012, 46, 837–841. [Google Scholar]
  17. Wu, Y.M. The Comparison of Different Chromosome Coding Method Based on Genetic Algorithm. Adv. Mat. Res. 2012, 546, 666–669. [Google Scholar] [CrossRef]
  18. Wu, J.; Zhang, B.; Wang, K. Application of adaboost-based bp neural network for short-term wind speed forecast. Power Syst. Technol. 2012, 36, 221–225. [Google Scholar]
  19. Kusiak, A.; Zheng, H.; Song, Z. Short-term prediction of wind farm power: A data mining approach. IEEE Trans. Energy Convers. 2009, 24, 125–136. [Google Scholar] [CrossRef]
  20. Li, L.J.; Huang, W. A short-term power load forecasting method based on BP neural network. Appl. Mech. Mater. 2014, 494, 1647–1650. [Google Scholar] [CrossRef]
  21. Jin, H.; Wu, S.; Peng, Y. Prediction of contact fatigue life of alloy cast steel rolls using back-propagation neural network. J. Mater. Eng. Perform. 2013, 22, 3631–3638. [Google Scholar] [CrossRef]
  22. Yu, L.; Hu-Quan, G. Wind Speed Prediction Based on AdaBoost and BP Neural Networks. J. Mod. Power Syst. Clean Energy. 2012, 2, 80–83. [Google Scholar]
  23. Zheng, X.; Jia, D.; Lv, Z.; Luo, C.; Zhao, J.; Ye, Z. Short-time wind speed prediction based on Legendre multi-wavelet neural network. Trans. Intell. Technol. 2023, 22, 46–52. [Google Scholar] [CrossRef]
  24. Karsoliya, S. Approximating number of hidden layer neurons in multiple hidden layer BPNN architecture. Int. J. Eng. Trends Technol. 2012, 3, 714–717. [Google Scholar]
  25. TB 10303-2020; Technical Specification for Construction Safety of Railway Bridge and Culvert. China Railway Publishing House: Beijing, China, 2020.
  26. JGJ 215-2010; Technical Specification for Safety of Installation, Use and Disassembly of Building Hoist in Construction. China Building Industry Press: Beijing, China, 2010.
  27. TB 10002-2017; Code for Design of Railway Bridges and Culverts. China Railway Publishing House: Beijing, China, 2017.
Figure 1. Structure of the BP neural network.
Sustainability 15 16921 g001
Figure 2. Flow chart of wind speed prediction based on the BP-GA algorithm.
Sustainability 15 16921 g002
Figure 3. Elevation arrangement of the long-span HSR bridge (unit: m).
Sustainability 15 16921 g003
Figure 4. Schematic diagram of anemometer arrangement.
Sustainability 15 16921 g004
Figure 5. Sample of measured wind speed and direction during the typhoon.
Sustainability 15 16921 g005
Figure 6. Measured average wind speed during the typhoon.
Sustainability 15 16921 g006
Figure 7. Fluctuating wind speed during the typhoon.
Sustainability 15 16921 g007
Figure 8. Measured turbulence intensity during the typhoon.
Sustainability 15 16921 g008aSustainability 15 16921 g008b
Figure 9. Measured gust factor during typhoons.
Sustainability 15 16921 g009
Figure 10. Measured turbulence integral scales during the typhoon.
Sustainability 15 16921 g010
Figure 11. Measured power spectral density during the typhoon.
Sustainability 15 16921 g011
Figure 12. Structure of wind speed prediction neural network.
Sustainability 15 16921 g012
Figure 13. Gust wind speed prediction results.
Sustainability 15 16921 g013aSustainability 15 16921 g013b
Figure 14. Schematic diagram of hierarchical warning and prevention and control during bridge construction.
Sustainability 15 16921 g014
Table 1. Relevant parameters for training BP neural networks.
Parameter NameParameter Value
Learning rate0.01
Tolerance accuracy1 × 10−6
Maximum number of training sessions1000
Table 2. Relevant parameters of GA.
Parameter NameParameter Value
Initial population size5
Length of individual encoding86
Number of optimization generations50
Probability of crossover operation0.08
Probability of mutation operation0.09
Table 3. R2, MAE, and RMSE results for gust wind speeds.
Predicted Step SizeTraining Set/Test SetR2MAERMSE
1training set0.9670.5610.787
test set0.8640.4890.734
2training set0.9400.7821.071
test set0.7430.7001.015
3training set0.9170.9261.240
test set0.6760.7901.154
4training set0.9011.0191.357
test set0.6100.8861.246
5training set0.8821.1051.479
test set0.5730.9291.304
Disclaimer/Publisher’s Note: The statements, opinions and data contained in all publications are solely those of the individual author(s) and contributor(s) and not of MDPI and/or the editor(s). MDPI and/or the editor(s) disclaim responsibility for any injury to people or property resulting from any ideas, methods, instructions or products referred to in the content.

