
Flood Risk Assessment Focusing on Exposed Social Characteristics in Central Java, Indonesia


Abstract
:1. Introduction
2. Materials and Methods
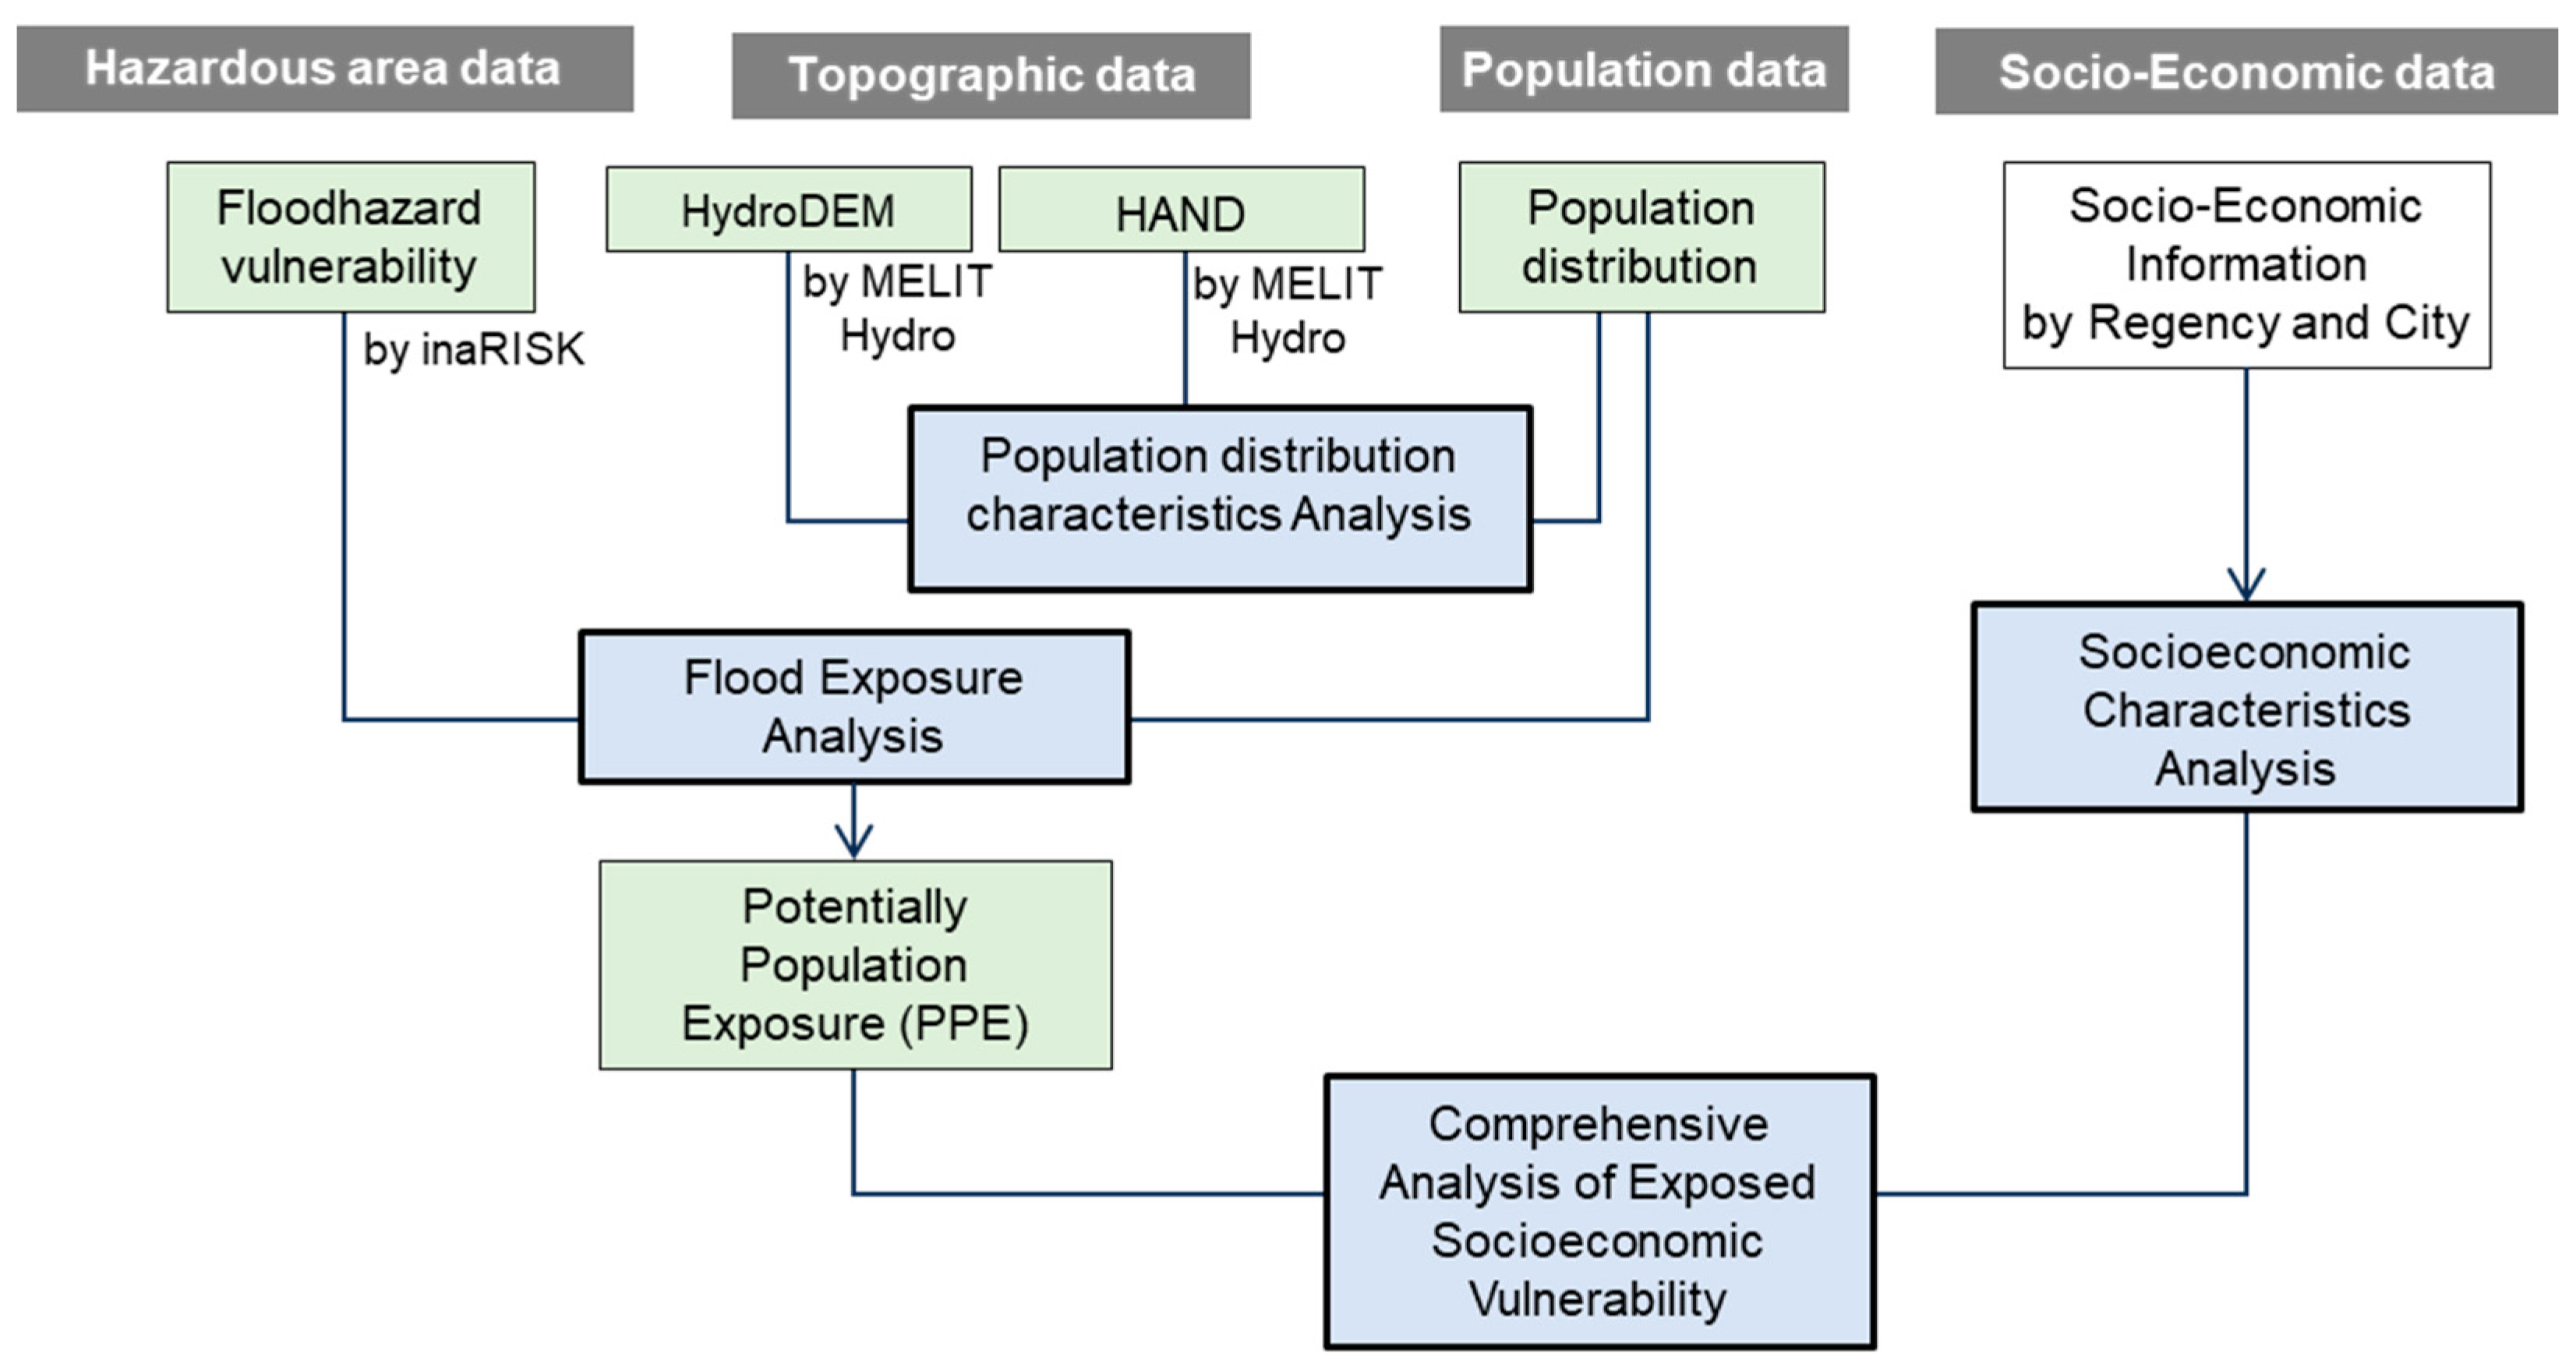
2.1. Method Framework and Materials
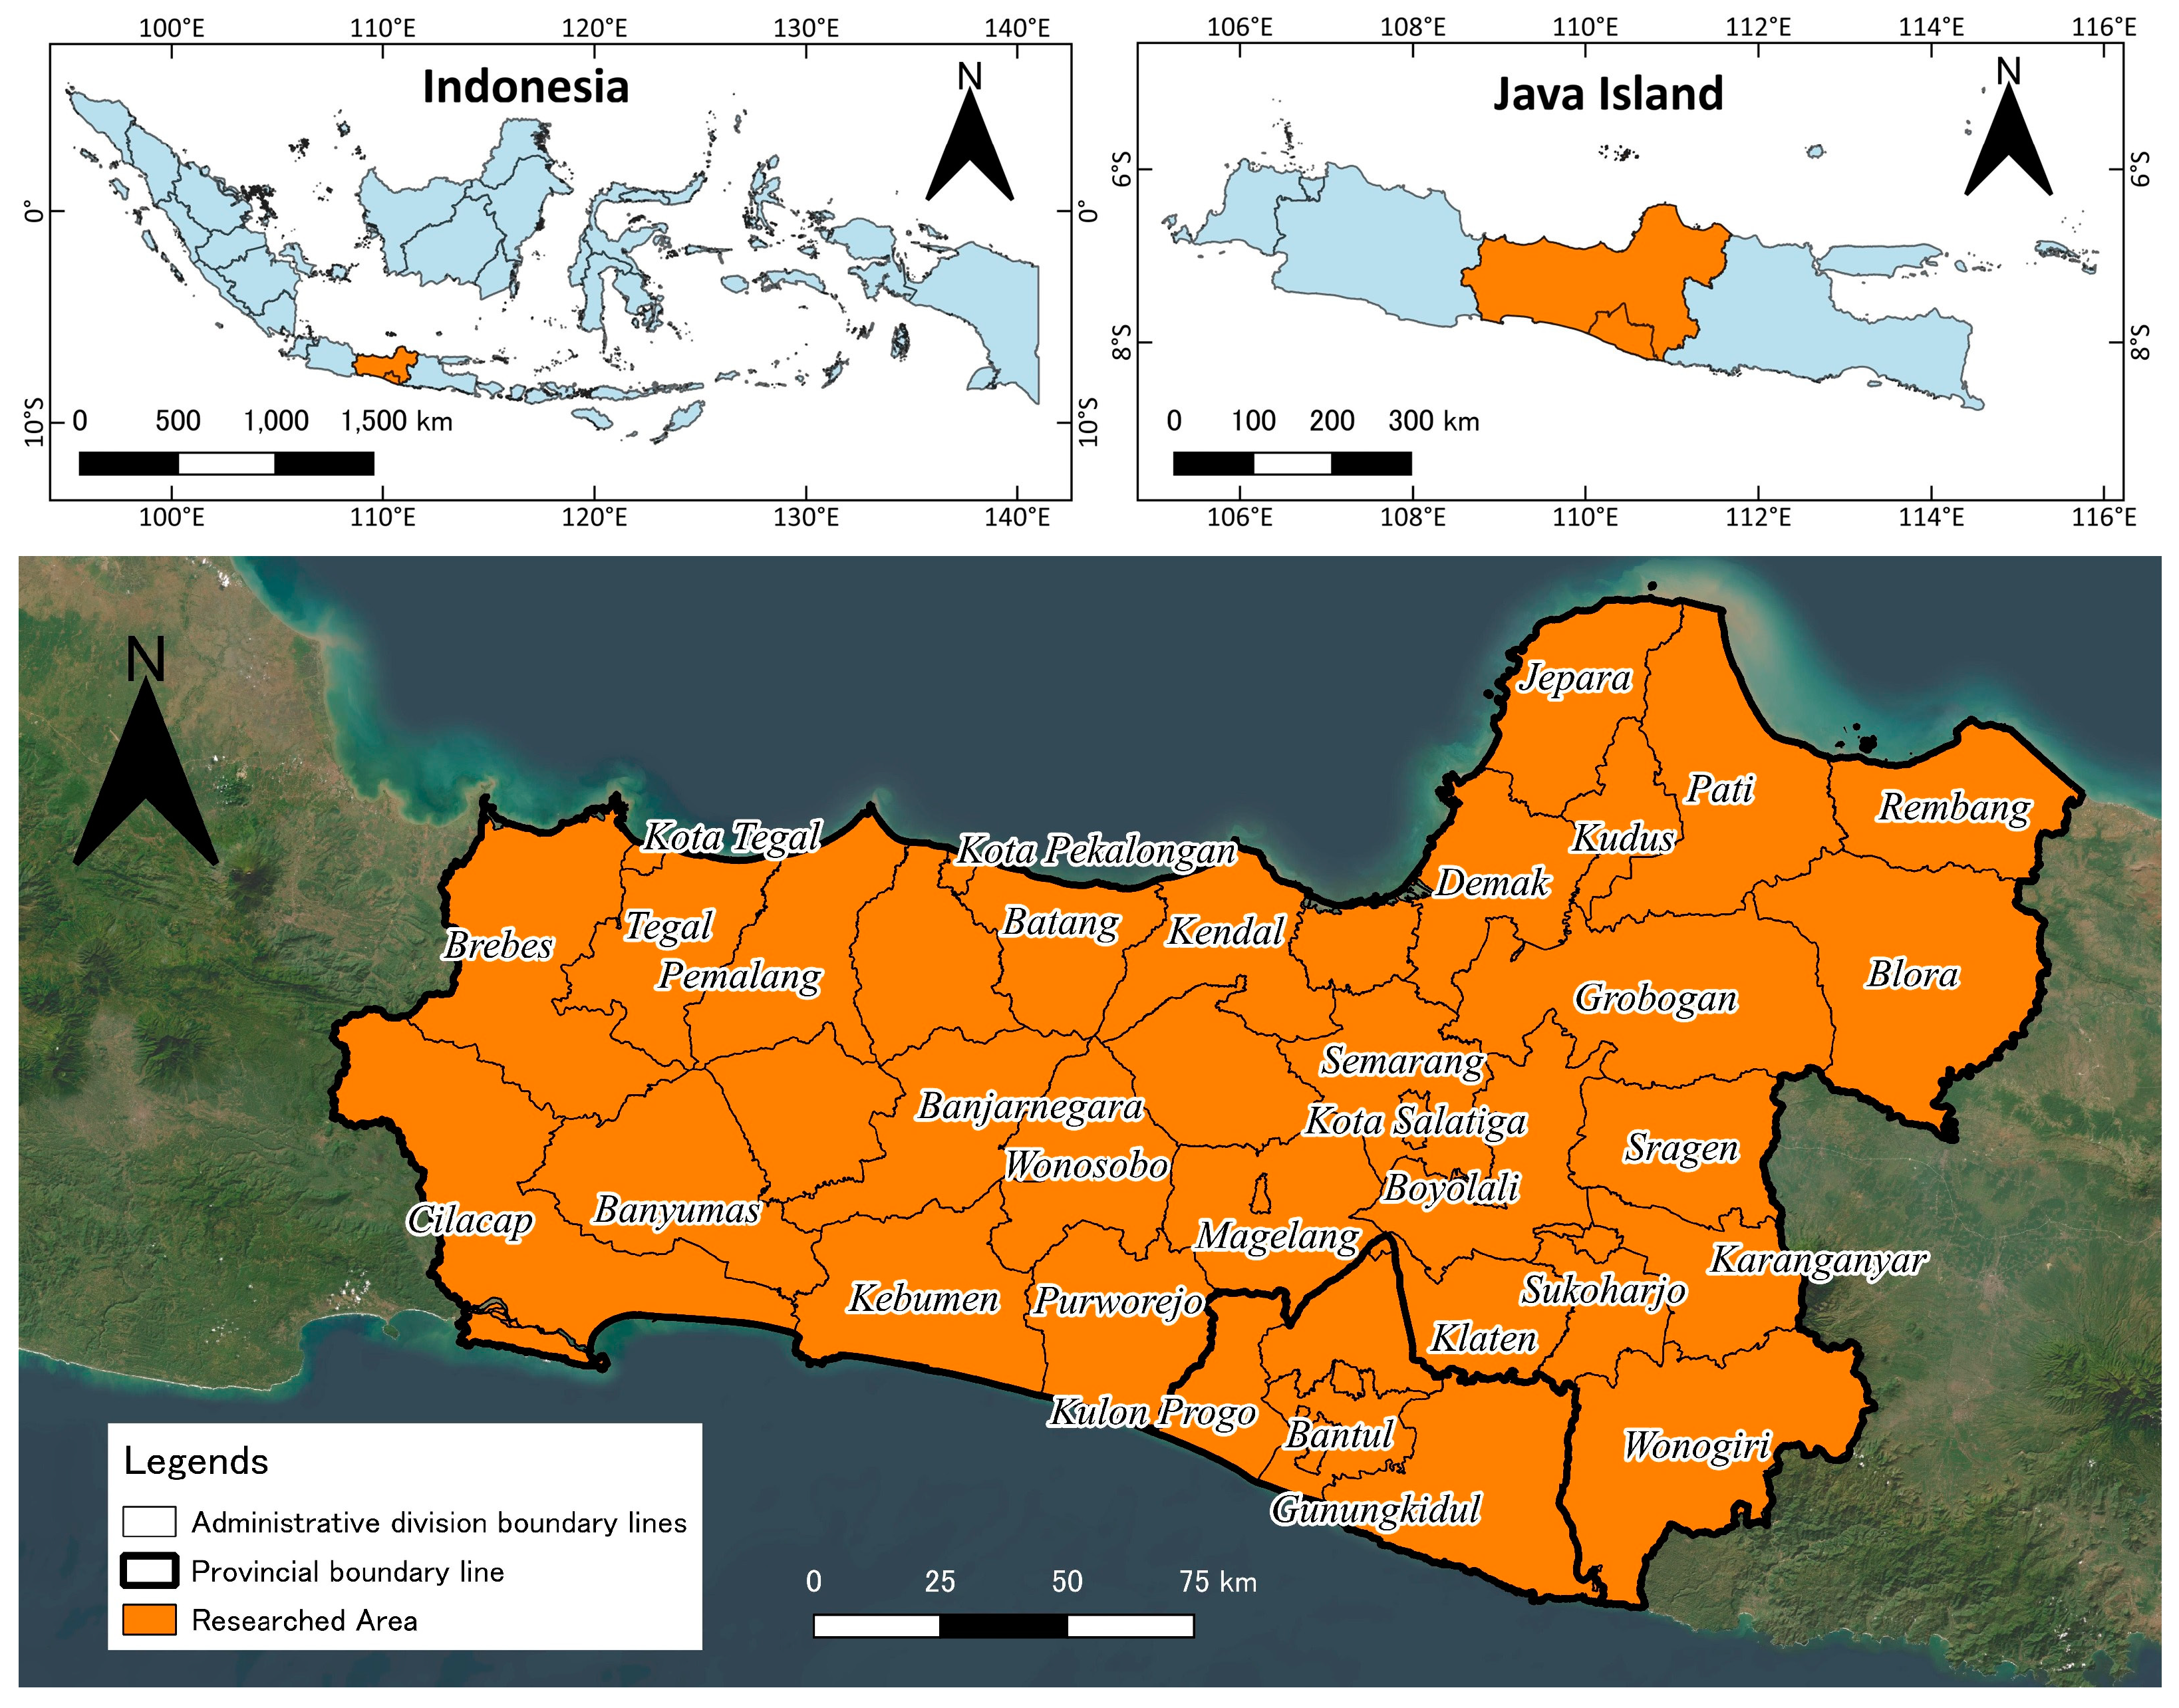
2.2. Study Area
2.3. Analysis
2.3.1. Population Distribution Characteristics
2.3.2. Flood Exposure Analysis
2.3.3. Socioeconomic Characteristics
2.3.4. Comprehensive Analysis of Exposed Socioeconomic Vulnerability
3. Results
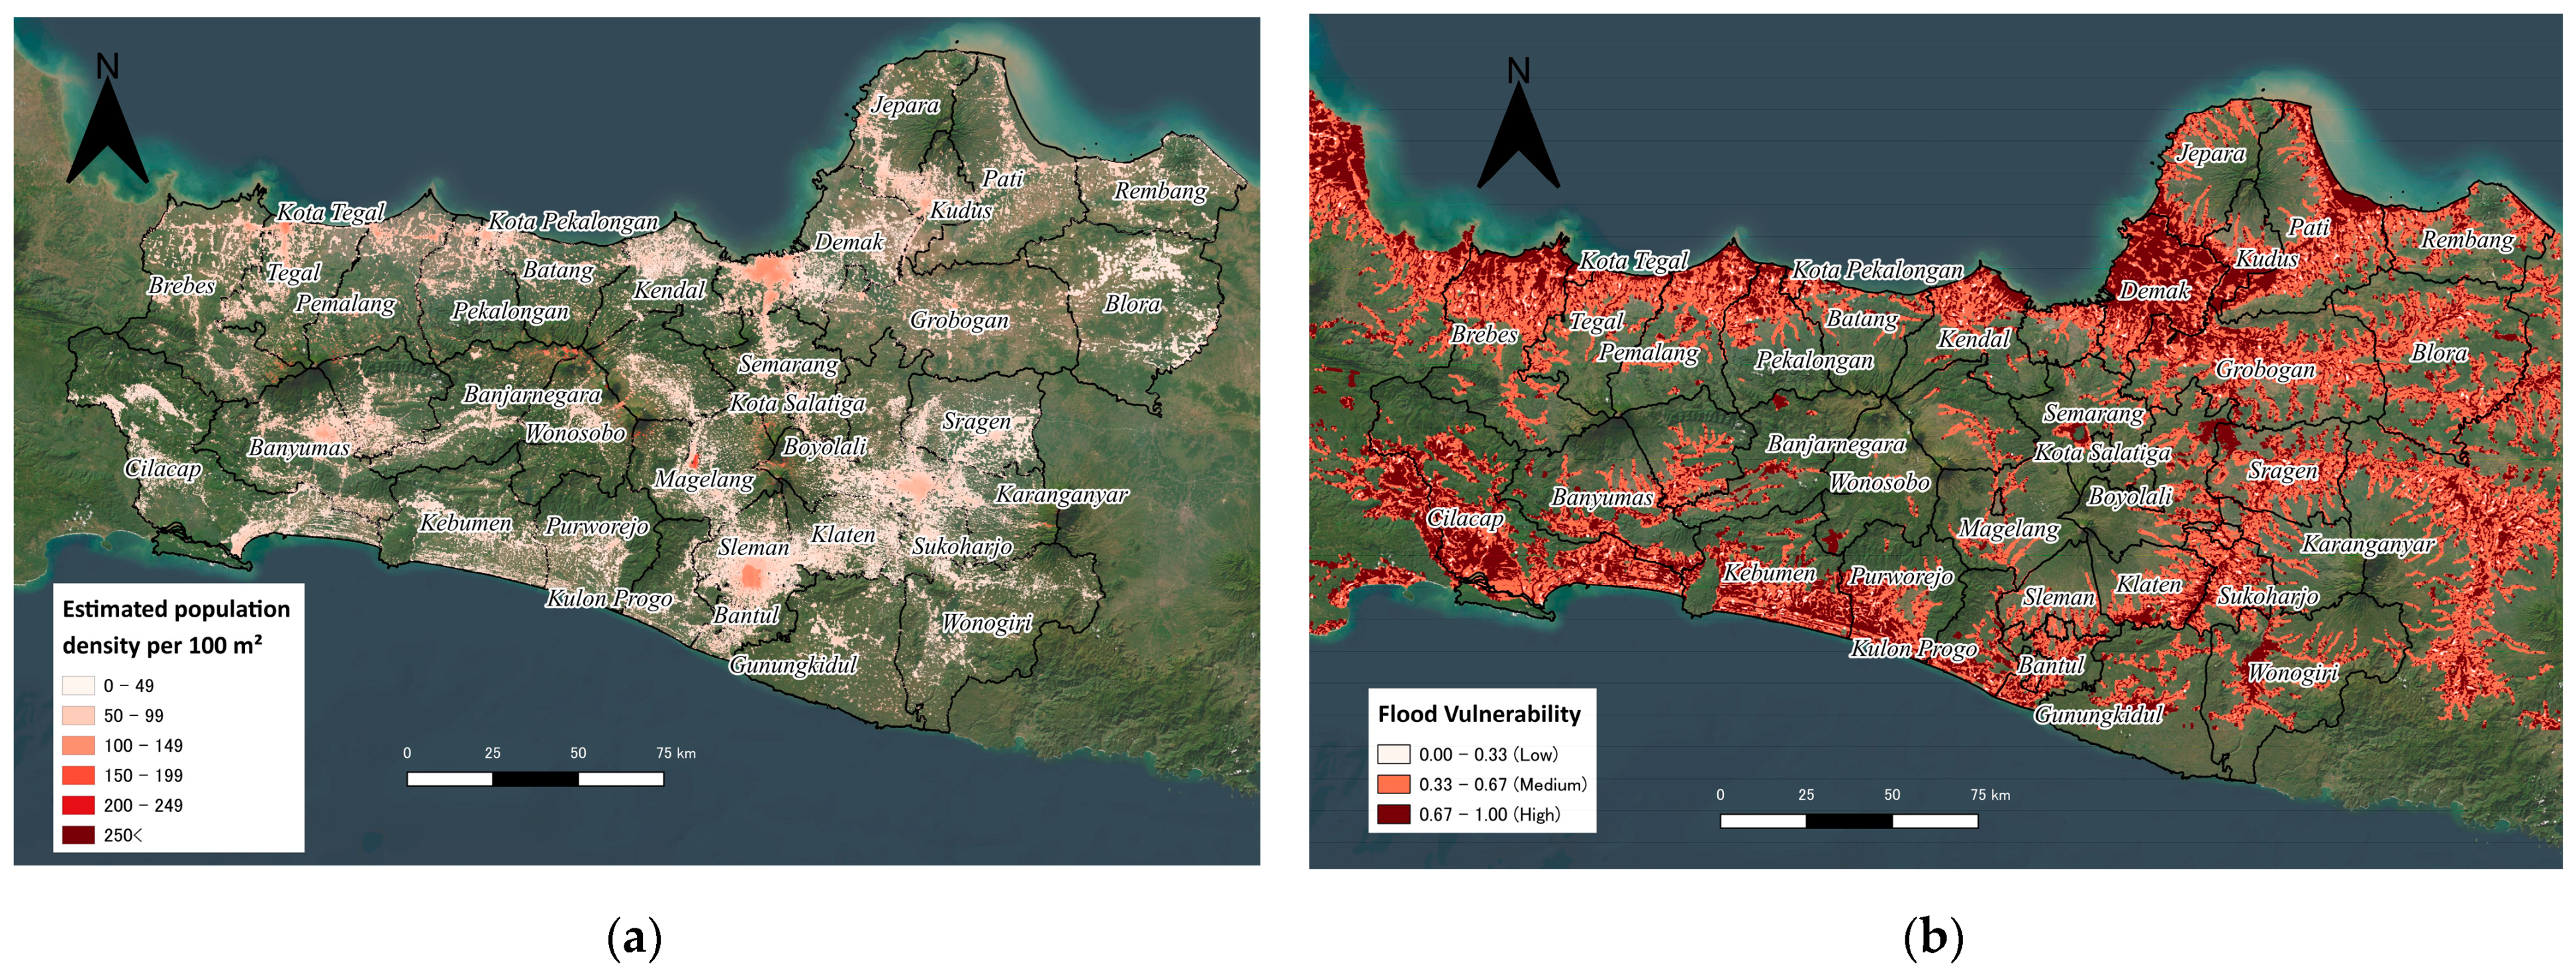
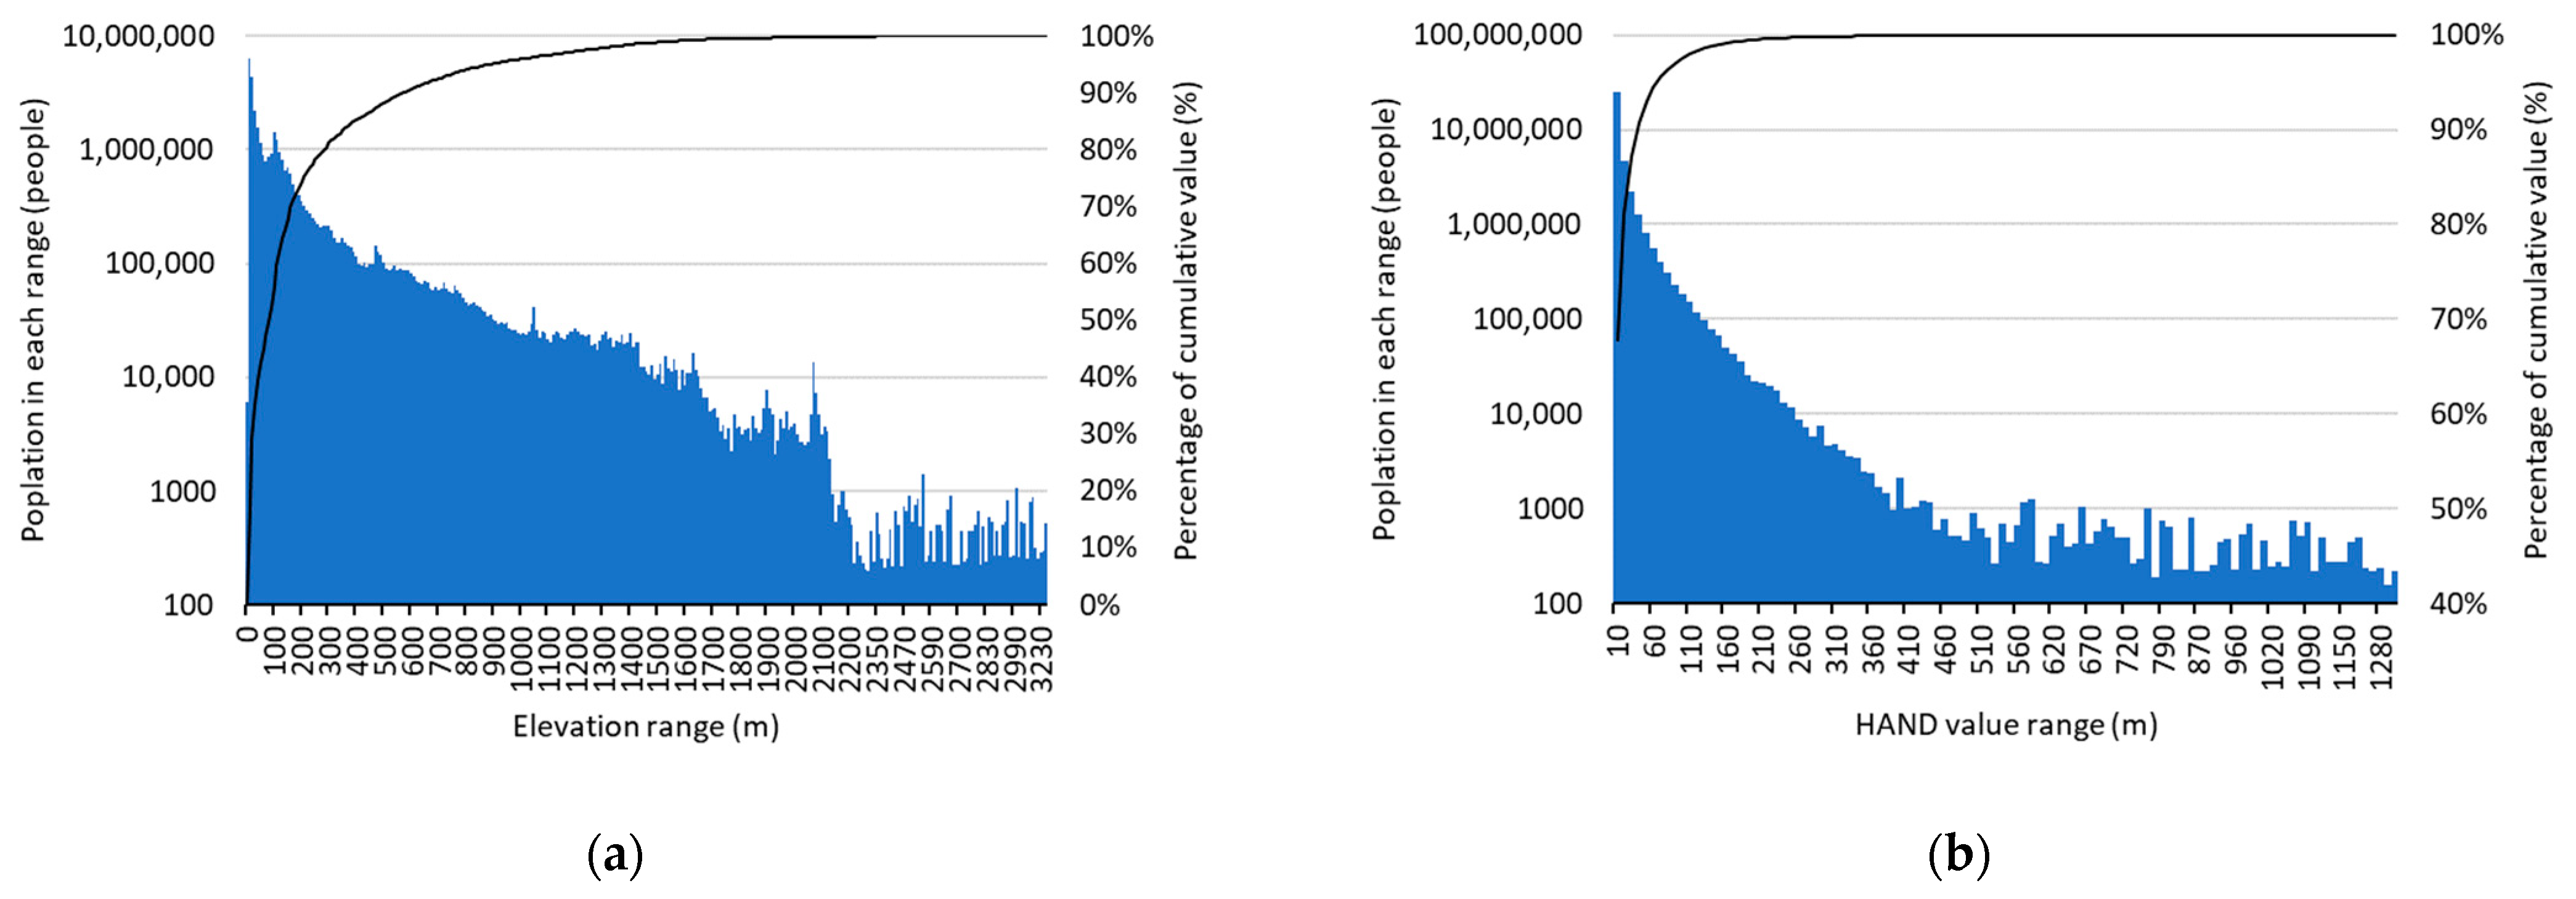
3.1. Relationship between Topography and Population Distribution
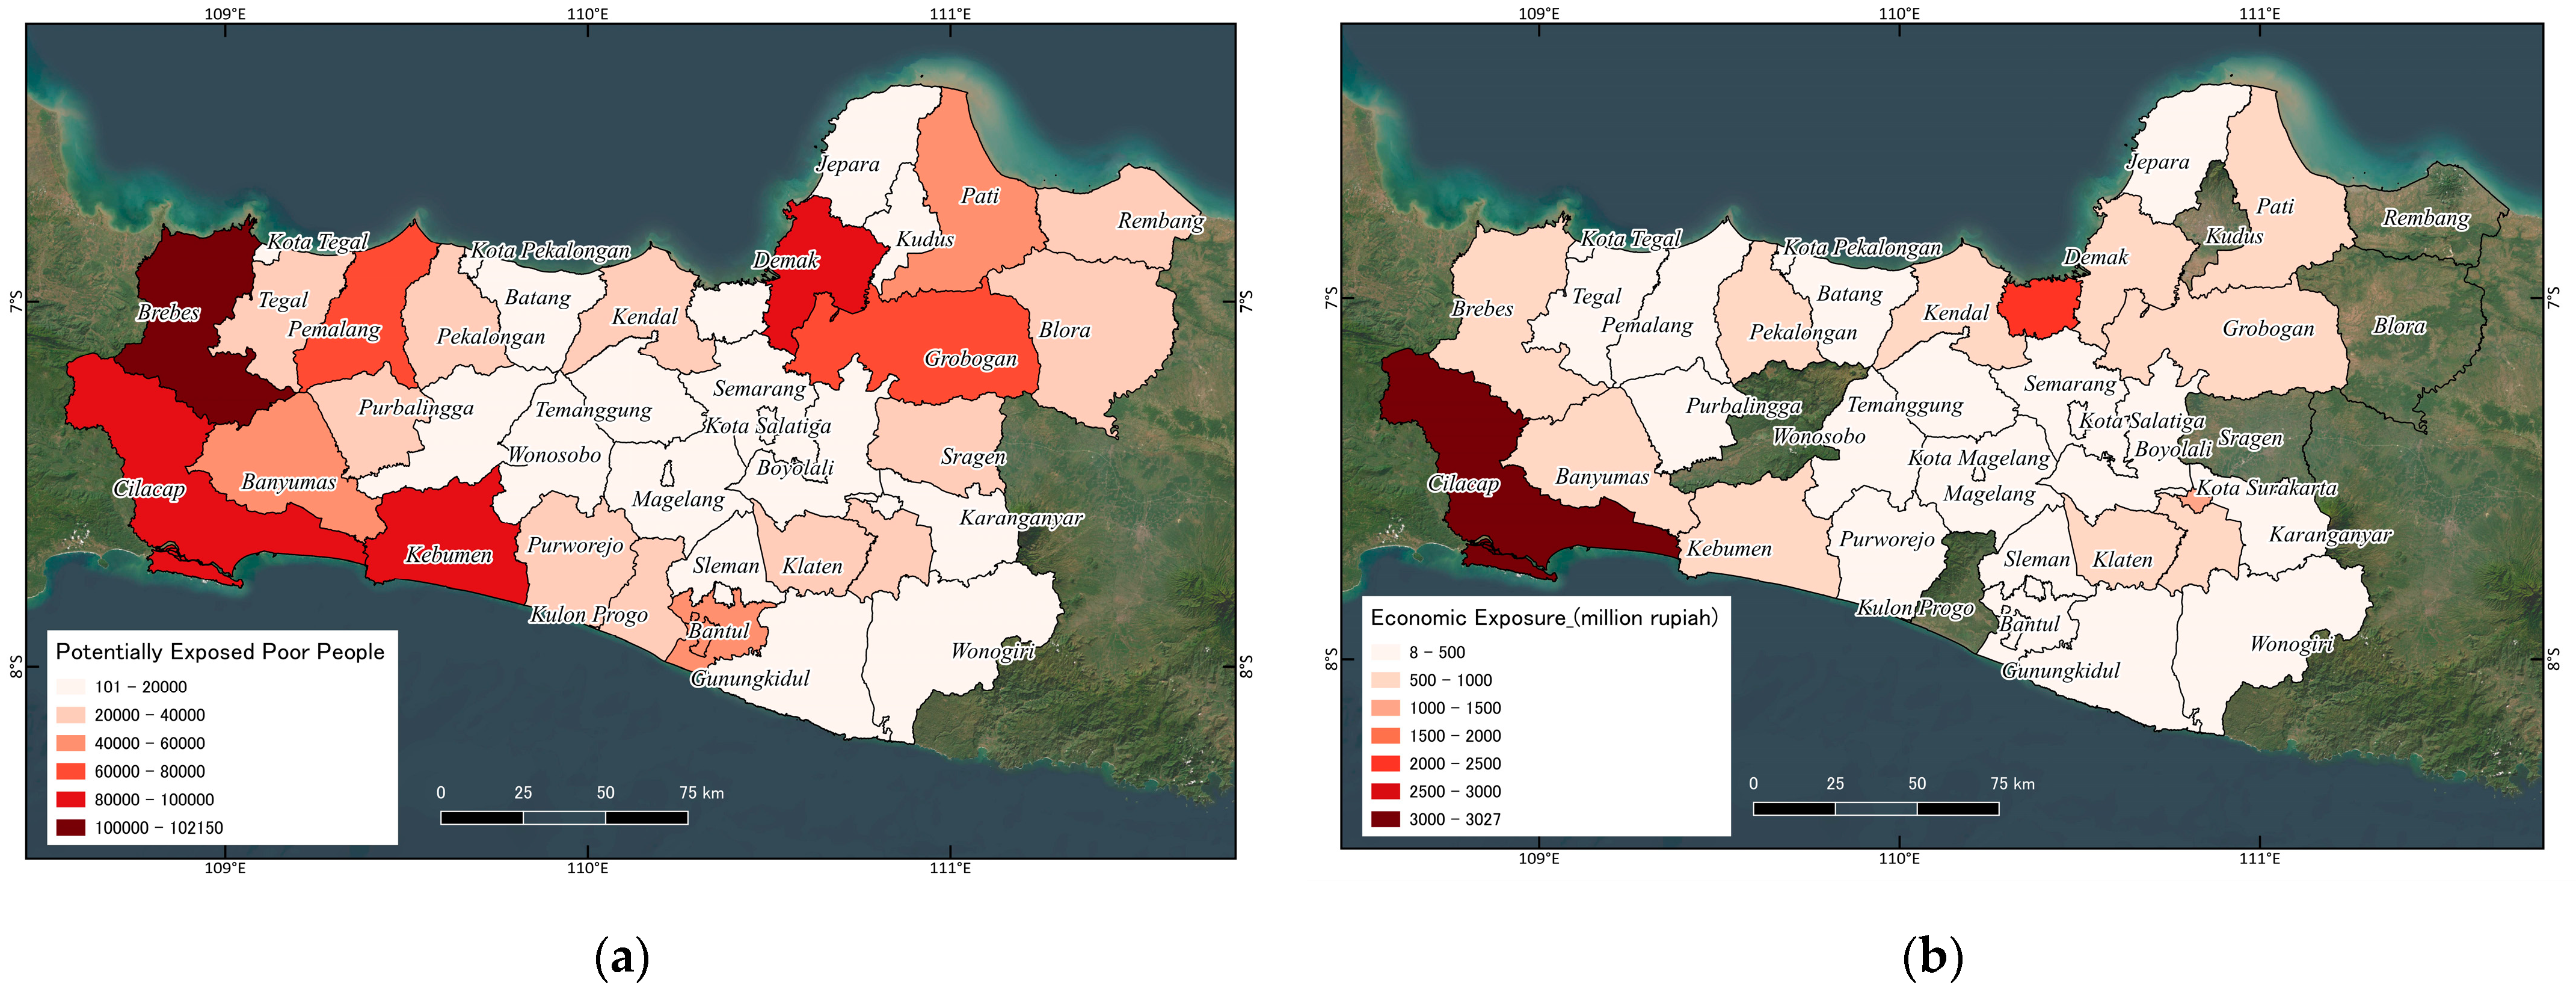
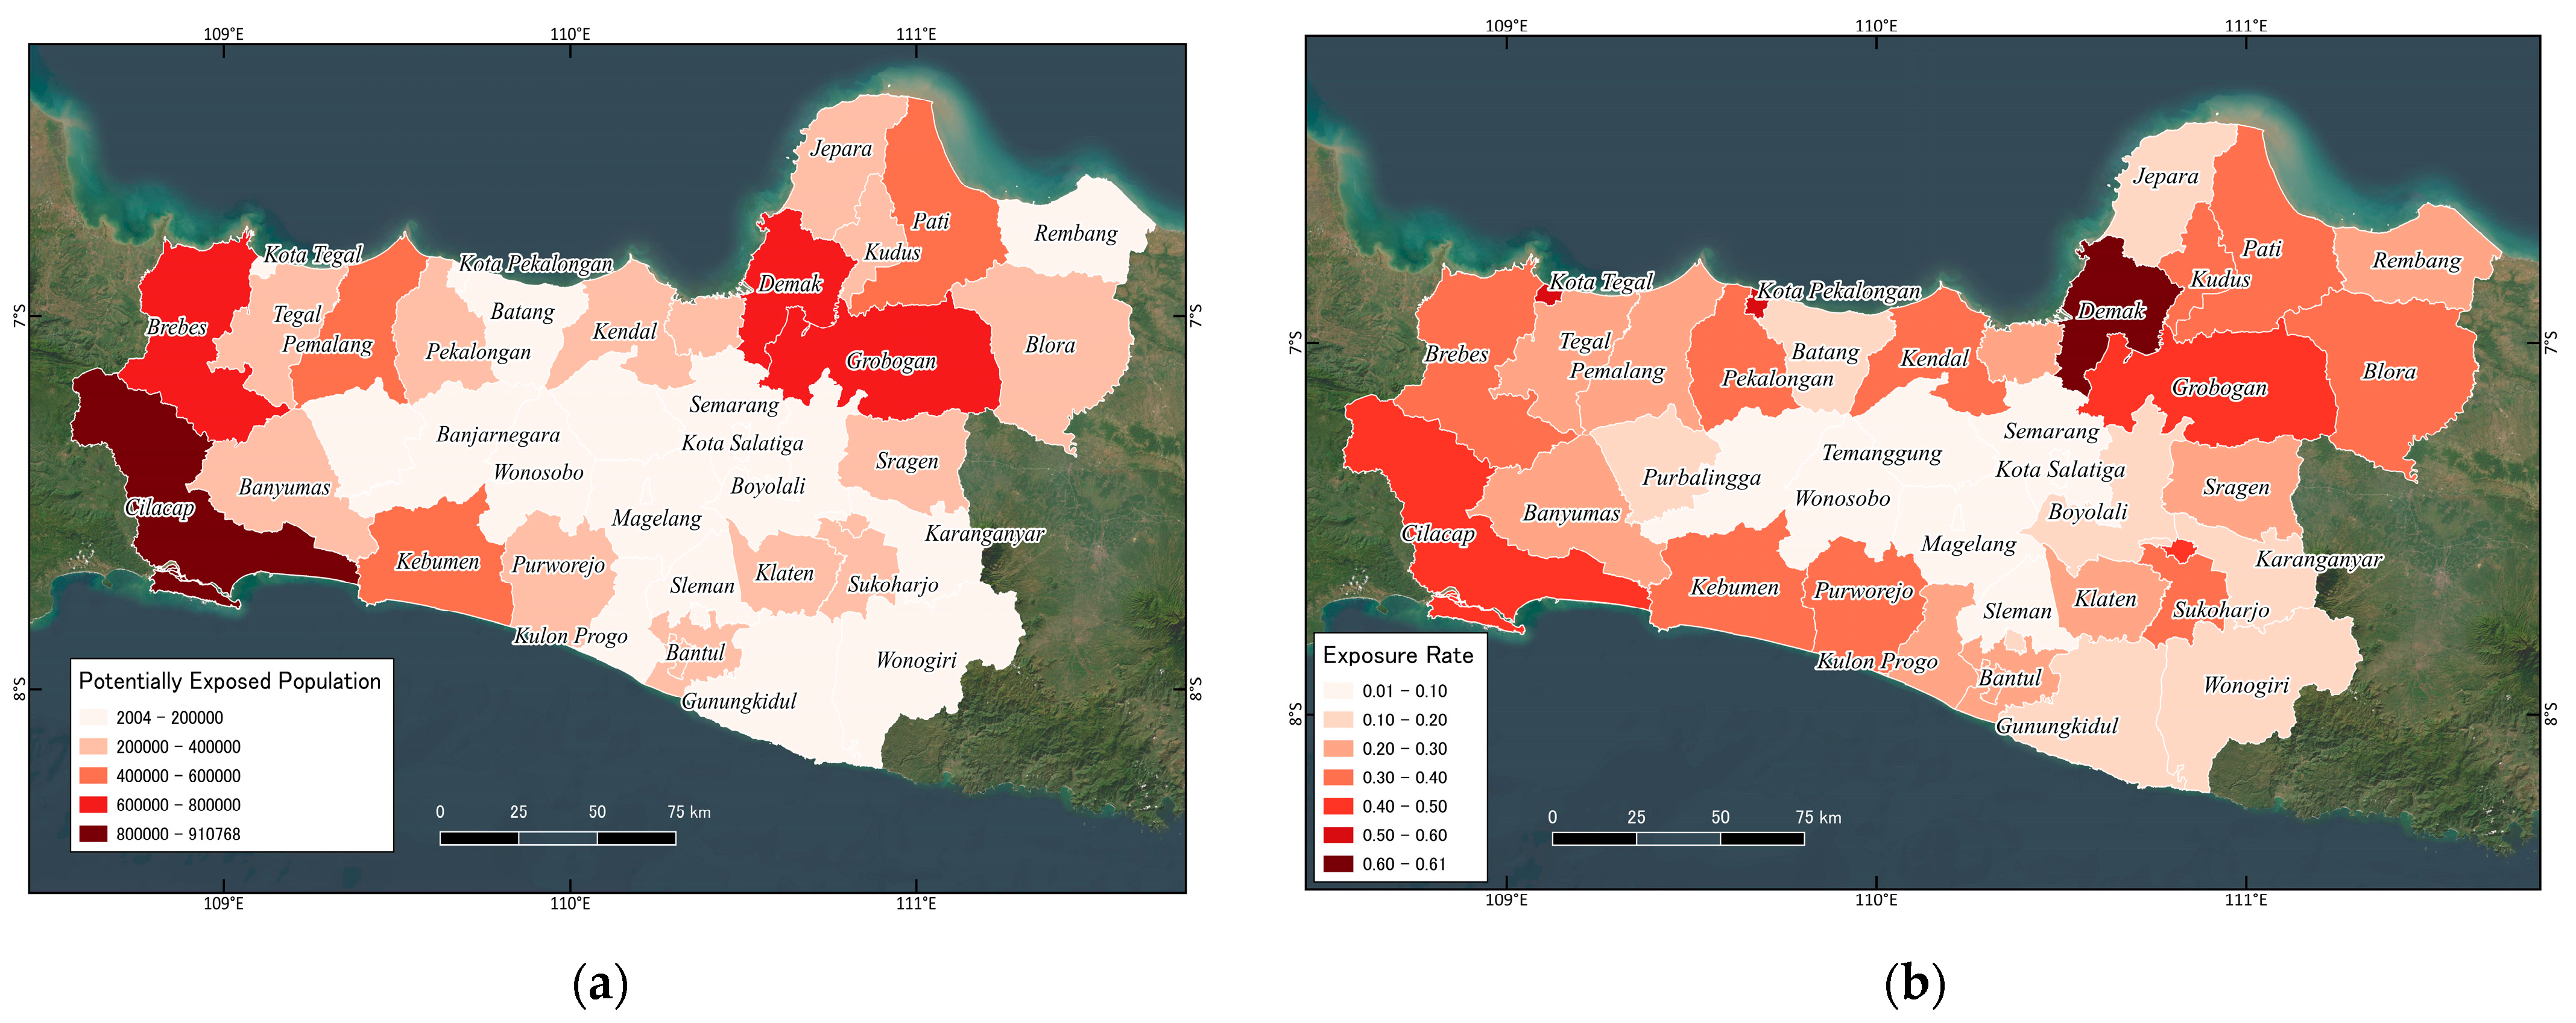
3.2. Flood Exposure Rate and Potentially Exposed Population
3.3. Results of Analysis of Socioeconomic Indicators
- The larger the population, the higher the number of residents with lower education level (Pop.LowEdu vs Pop.All);
- The high educated population ratio is strongly positively correlated with the ratio of the middle-educated population and strongly negative correlated with the ratio of the low educated population (HighEdu.Ratio vs MidEdu.Ratio and LowEdu.Ratio);
- The number of poor people is strongly correlated with the low-educated population and with the total population (Pop.PoorPeople vs Pop.LowEdu and Pop.All);
- It is not surprising that the poverty rate is highly correlated with the number of poor people, but a high positive correlation is observed for the population with low levels of education and for the percentage of the population with low levels of education (Poor.Ratio);
- The percentage of the population with a high level of education has the highest positive correlation with average income, and the percentage of the population with a medium level of education also shows a positive correlation (Average Income).
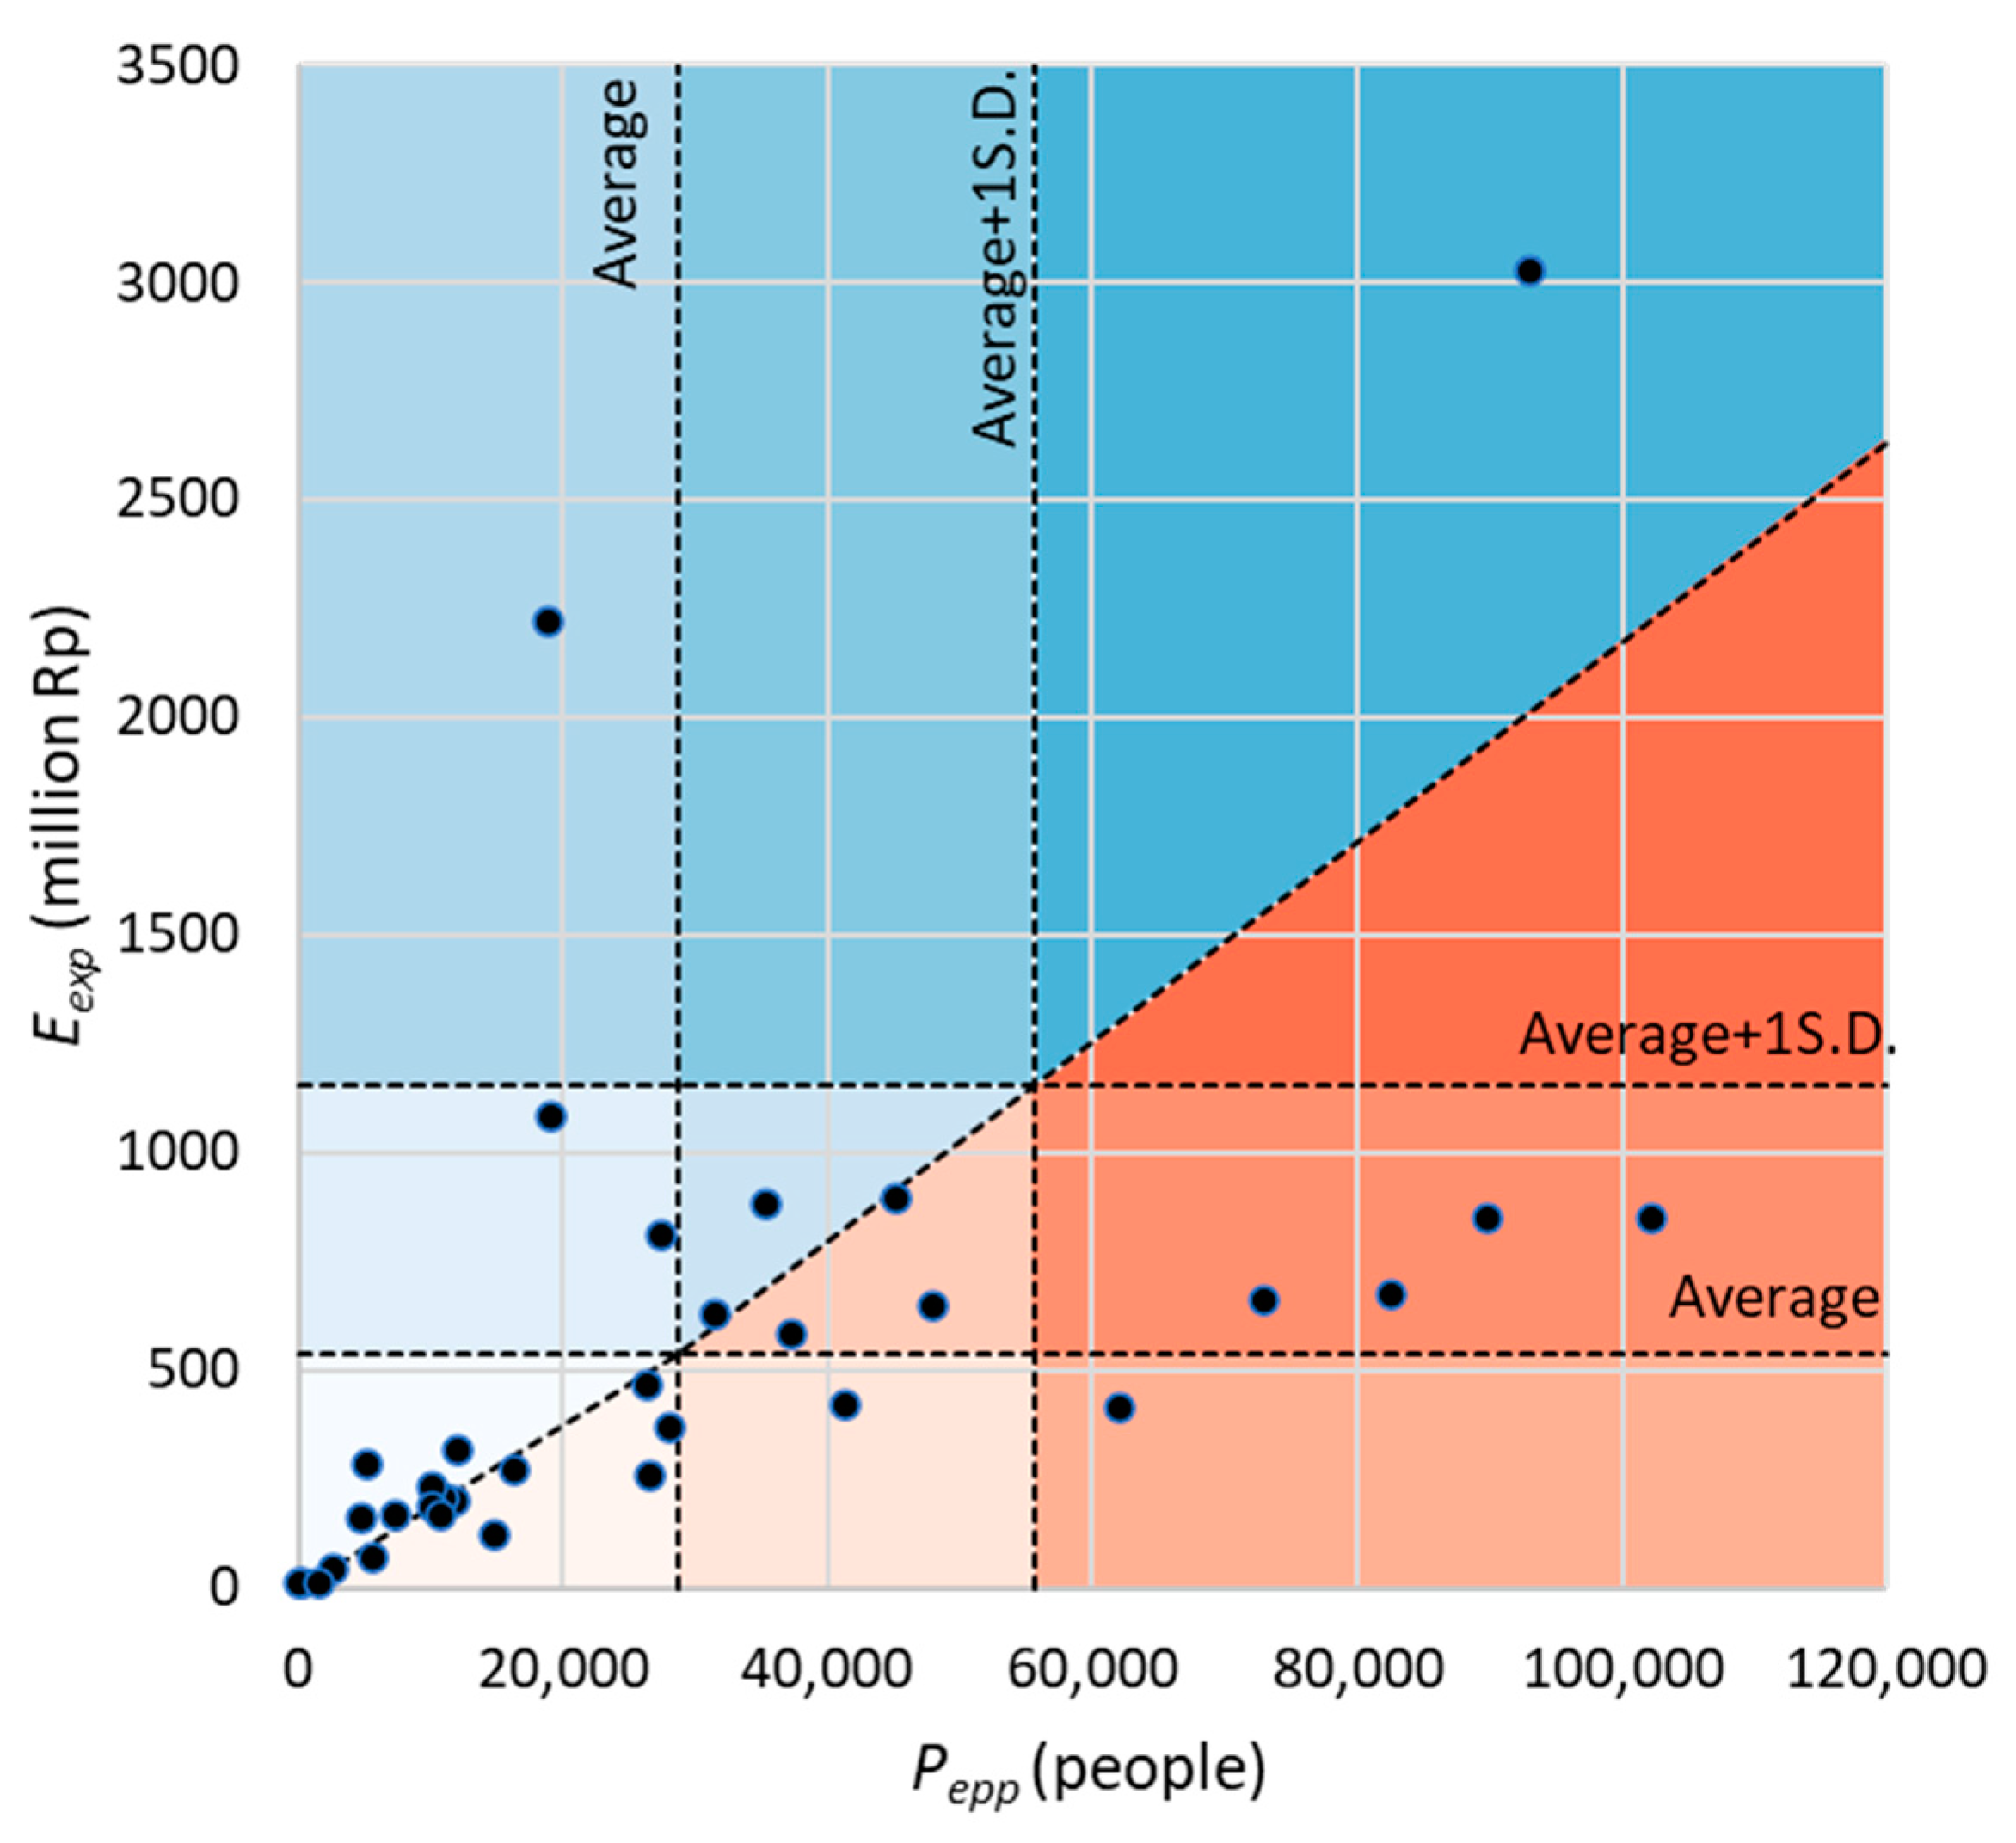
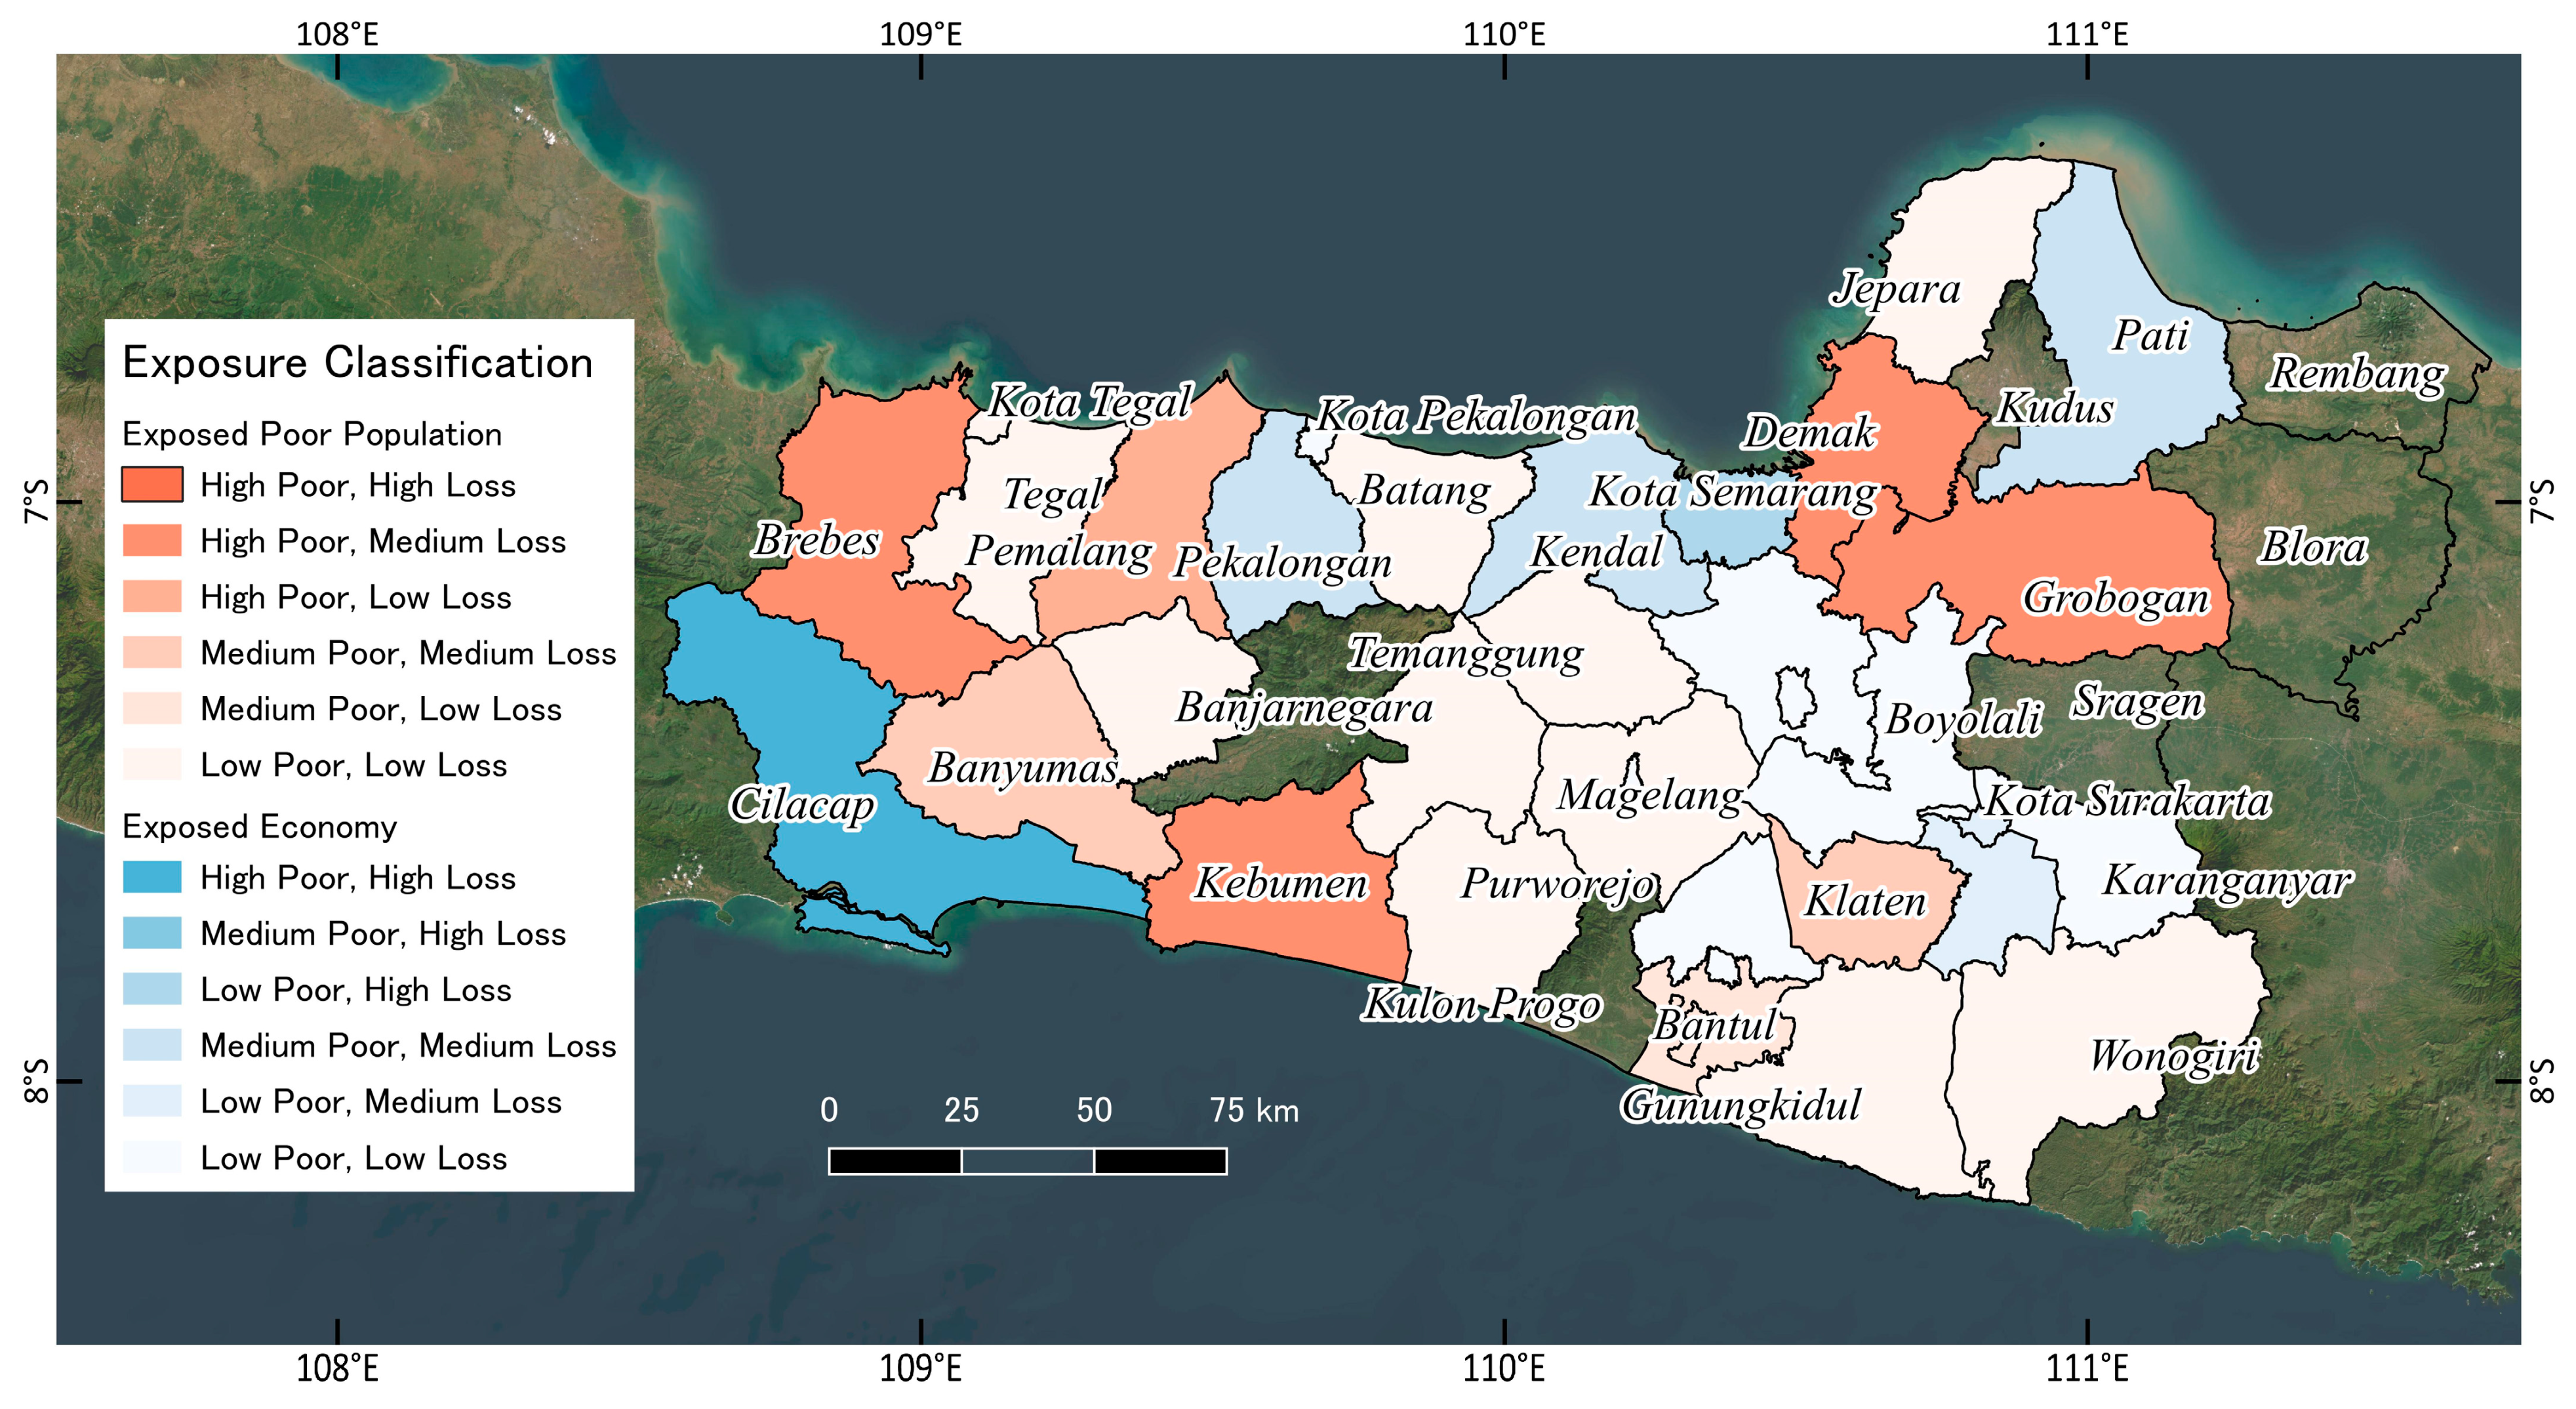
3.4. Comprehensive Analysis of Exposed Socioeconomic Vulnerability
4. Discussion
5. Conclusions
Author Contributions
Funding
Institutional Review Board Statement
Informed Consent Statement
Data Availability Statement
Acknowledgments
Conflicts of Interest
References
- Eckstein, D.; Künzel, V.; Schäfer, L. The Global Climate Risk Index 2021; Germanwatch: Bonn, Germany, 2021; ISBN 978-3-943704-84-6. [Google Scholar]
- IPCC. Global Warming of 1.5 °C. An IPCC Special Report on the Impacts of Global Warming of 1.5 °C above Pre-Industrial Levels and Related Global Greenhouse Gas Emission Pathways, in the Context of Strengthening the Global Response to the Threat of Climate Change, Sustainable Development, and Efforts to Eradicate Poverty; Masson-Delmotte, V.P., Zhai, H.-O., Pörtner, D., Roberts, J., Skea, P.R., Shukla, A., Pirani, W., Moufouma-Okia, C., Péan, R., Pidcock, S., et al., Eds.; Cambridge University Press: Cambridge, UK; New York, NY, USA, 2018; 616p. [Google Scholar] [CrossRef]
- OECD. Financial Management of Flood Risk; OECD Publishing: Paris, France, 2016. [Google Scholar] [CrossRef]
- Tezuka, S.; Takiguchi, H.; Kazama, S.; Sato, A.; Kawagoe, S.; Sarukkalige, R. Estimation of the Effects of Climate Change on Flood-Triggered Economic Losses in Japan. Int. J. Disaster Risk Reduct. 2014, 9, 58–67. [Google Scholar] [CrossRef]
- Muis, S.; Güneralp, B.; Jongman, B.; Aerts, J.C.J.H.; Ward, P.J. Flood Risk and Adaptation Strategies Under Climate Change and Urban Expansion: A Probabilistic Analysis Using Global Data. Sci. Total Environ. 2015, 538, 445–457. [Google Scholar] [CrossRef] [PubMed]
- Grady, A.; Gersonius, B.; Makarigakis, A. Taking Stock of Decentralized Disaster Risk Reduction in Indonesia. Nat. Hazards Earth Syst. Sci. 2016, 16, 2145–2157. [Google Scholar] [CrossRef]
- Nugroho, A.; Iqbal, R.M.; Fadhiela, K.; Apriyani, D.; Ginting, L.N.; Nurdin, S. Impacts of Village Fund on Post Disaster Economic Recovery in Rural Aceh Indonesia. Int. J. Disaster Risk Reduct. 2022, 70, 102768. [Google Scholar] [CrossRef]
- Kovacs, Y.; Doussin, N.; Gaussens, M. Flood Risk and Cities in Developing Countries—Technical Reports; Agence Française de Développement (AFD): Paris, France, 2017; ISSN 2492-2838. Available online: https://www.afd.fr/en/ressources/flood-risk-and-cities-developing-countries (accessed on 30 September 2023).
- ArcGIS REST Services Directory, Folder: inaRISK. Available online: https://inarisk1.bnpb.go.id:6443/arcgis/rest/services/inaRISK (accessed on 30 September 2023).
- MERIT Hydro: Global Hydrography Datasets. Available online: http://hydro.iis.u-tokyo.ac.jp/~yamadai/MERIT_Hydro/index.html (accessed on 30 September 2023).
- World Pop Hub, Population Counts/Individual Countries/Indonesia 100 m Population. Available online: https://hub.worldpop.org/geodata/summary?id=49726 (accessed on 30 September 2023).
- Statistics Indonesia Publication in Figures. Available online: https://www.bps.go.id/indikator/indikator/list_/pub_01/ (accessed on 30 September 2023).
- Head of the National Disaster Management Agency (BNPB) of Indonesia. Perka BNPB No. 2 of 2012. Available online: https://bnpb.go.id/storage/app/media/uploads/24/peraturan-kepala/2012/perka-2-tahun-2012-tentang-pedoman-umum-pengkajian-resiko-bencana.pdf (accessed on 30 September 2023).
- About InaRISK. Available online: https://inarisk.bnpb.go.id/about (accessed on 30 September 2023).
- Nobre, A.D.; Cuartas, L.A.; Hodnett, M.; Rennó, C.D.; Rodrigues, G.; Silveira, A.; Waterloo, M.; Saleska, S. Height Above the Nearest Drainage—A Hydrologically Relevant New Terrain Model. J. Hydrol. 2011, 404, 13–29. [Google Scholar] [CrossRef]
- Nobre, A.D.; Cuartas, L.A.; Momo, M.R.; Severo, D.L.; Pinheiro, A.; Nobre, C.A. HAND Contour: A New Proxy Predictor of Inundation Extent. Hydrol. Process. 2016, 30, 320–333. [Google Scholar] [CrossRef]
- Yamazaki, D.; Ikeshima, D.; Sosa, J.; Bates, P.D.; Allen, G.H.; Pavelsky, T.M. MERIT Hydro: A High-Resolution Global Hydrography Map Based on Latest Topography Dataset. Water Resour. Res. 2019, 55, 5053–5073. [Google Scholar] [CrossRef]
- United Nations, Department of Economic and Social Affairs Population Division. Available online: https://population.un.org/wpp/ (accessed on 30 September 2023).
- Nugraha, A.T.; Prayitno, G.; Nandhiko, L.; Nasution, A.R. Socioeconomic Conditions on Poverty Levels A Case Study: Central Java Province and Yogyakarta in 2016. Rev. Econ. Sociol. Rural. 2022, 60, e233206. [Google Scholar] [CrossRef]
- Hidayat, F. CRBOM Small Publication Series No. 10: Floods and Climate Change—Observations from Java. Crbom.org San Francisco, California. 2009. Available online: https://www.academia.edu/3459801/Floods_and_climate_change_observations_from_Java (accessed on 30 September 2023).
- Mihai, M.; Ţiţan, E.; Manea, D. Education and Poverty. Procedia Econ. Financ. 2015, 32, 855–860. [Google Scholar] [CrossRef]
- Fothergill, A.; Peek, L.A. Poverty and Disasters in the United States: A Review of Recent Sociological Findings. Nat. Hazards 2004, 32, 89–110. [Google Scholar] [CrossRef]
- Kreibich, H.; Seifert, I.; Merz, B.; Thieken, A.H. Development of FLEMOcs—A New Model for the Estimation of Flood Losses in the Commercial Sector. Hydrol. Sci. J. 2010, 55, 1302–1314. [Google Scholar] [CrossRef]
- Tate, E.; Muñoz, C.; Suchan, J. Uncertainty and Sensitivity Analysis of the HAZUS-MH Flood Model. Nat. Hazards Rev. 2015, 16, 04014030. [Google Scholar] [CrossRef]
- Parent, O.; Hofe, R.; Oh, S.; Ervin, P.; Khalid, A.; Yeghiazarian, L. Estimating the Socioeconomic Impacts of Flooding on Regional Economies with a Computable General Equilibrium Model. Water Resour. Res. 2023, 59, e2022WR033474. [Google Scholar] [CrossRef]
- Bronfman, N.C.; Cisternas, P.C.; Vázquez, E.L.; Cifuentes, L.A. Trust and Risk Perception of Natural Hazards: Implications for Risk Preparedness in Chile. Nat. Hazards 2016, 81, 307–327. [Google Scholar] [CrossRef]
- Indrianingrum, L.; Azman, M.N.A.; Downing, K.J. Layout Tambaklorok Fisherman Village of Low-Income Housing: A Case Study of the Central Java, Indonesia. Int. J. Innov. Creat. Chang. 2019, 7, 162–178. [Google Scholar]
- Marfai, M.A.; King, L. Coastal Flood Management in Semarang, Indonesia. Environ. Geol. 2008, 55, 1507–1518. [Google Scholar] [CrossRef]
- Dekens, J. Local Knowledge for Disaster Preparedness: A Literature Review; International Centre for Integrated Mountain Development (ICIMOD): Lalitpur, Nepal, 2007; ISBN 978-92-9115-042-7. [Google Scholar]
- PCI. Local Wisdom: Indigenous Practices for Mitigating Disaster Loss. In Program for Strengthening Household Access to Resources (PROSHAR); United States Agency for International Development (USAID): Washington, DC, USA, 2014. Available online: https://www.preventionweb.net/publication/local-wisdom-indigenous-practices-mitigating-disaster-loss (accessed on 30 September 2023).
- De Silva, M.M.G.T.; Kawasaki, A. Socioeconomic Vulnerability to Disaster Risk: A Case Study of Flood and Drought Impact in a Rural Sri Lankan Community. Ecol. Econ. 2018, 152, 131–140. [Google Scholar] [CrossRef]
- Rufat, S.; Tate, E.; Burton, C.G.; Maroof, A.S. Social Vulnerability to Floods: Review of Case Studies and Implications for Measurement. Int. J. Disaster Risk Reduct. 2015, 14, 470–486. [Google Scholar] [CrossRef]
- Rentschler, J.E. Why Resilience Matters—The Poverty Impacts of Disasters (1 November 2013). World Bank Policy Research Working Paper No. 6699. Available online: https://ssrn.com/abstract=2353658 (accessed on 30 September 2023).
- Cutter, S.L.; Emrich, C.T.; Morath, D.P.; Dunning, C.M. Integrating Social Vulnerability into Federal Flood Risk Management Planning. J. Flood Risk Management 2013, 6, 332–344. [Google Scholar] [CrossRef]
- Zhou, Y.; Li, N.; Wu, W.; Wu, J.; Shi, P. Local Spatial and Temporal Factors Influencing Population and Societal Vulnerability to Natural Disasters. Risk Anal. 2014, 34, 614–639. [Google Scholar] [CrossRef]
- Koks, E.E.; Jongman, B.; Husby, T.G.; Botzen, W.J.W. Combining Hazard, Exposure and Social Vulnerability to Provide Lessons for Flood Risk Management. Environ. Sci. Policy 2015, 47, 42–52. [Google Scholar] [CrossRef]


| Group | Name | Data Type | Source |
|---|---|---|---|
| Hazardous area data | inaRISK floodhazard vulnerability (layer_bahaya_banjir_bandang) 1 | Raster data set resolution: 3 arc-second | [9] |
| Topographic data | HydroDEM 2 | Raster data set resolution: 3 arc-second | [10] |
| HAND (Height Above Nearest Drainage) 2 | Raster data set resolution: 3 arc-second | [10] | |
| Population data | Indonesia 100m Population 3 | Raster data set resolution: 3 arc-second | [11] |
| Socioeconomic data | Number of people per age group | Table on website | [12] |
| Number of people per educational rank 4 | PDFs | [12] | |
| Number of poor people 5 | Table on website | [12] | |
| Average income | PDFs | [12] |
| Data Source | Variable (Abbreviation) | Definition |
|---|---|---|
| Number of people per age group | Total population (Pop.All) | - |
| Working age population (Pop.Work) | Aged 15–64 years | |
| Old age population (Pop.Old) | Aged 65 years and older | |
| Children population (Pop.Child) | Aged under 14 years | |
| Working age population ratio (Work.Ratio) | Pop.Work/Pop.All | |
| Old age population ratio (Old.Ratio) | Pop.Old/Pop.All | |
| Children population ratio (Child.Ratio) | Pop.Child/Pop.All | |
| Number of people per educational rank | Low educated population (Pop.LowEdu) | No education or finish elementary school (rank 1–2 in original database) |
| Middle educated population (Pop.MidEdu) | Finish junior to senior high school (rank 3–5 in original database) | |
| High educated population (Pop.HighEdu) | Diploma to up (rank 6–7 in original database) | |
| Low educated population ratio (LowEdu.Ratio) | Pop.LowEdu/(Pop.Work + Pop.Old) | |
| Middle educated population ratio (MidEdu.Ratio) | Pop.MidEdu/(Pop.Work + Pop.Old) | |
| High educated population ratio (HighEdu.Ratio) | Pop.HighEdu/(Pop.Work + Pop.Old) | |
| Number of poor people | Poor population (Pop.PoorPeople) | - |
| Poor population ratio (PoorRatio) | Pop.PoorPeople/Pop.All | |
| Average income | Average Income | - |
| Variable | Average | Max | Min | Standard Deviation | Range (Max/Min) |
|---|---|---|---|---|---|
| Total population (Pop.All) | 1,004,619 | 1,978,759 | 121,526 | 444,769 | 16.3 |
| Working age population (Pop.Work) | 697,902 | 1,395,454 | 86,145 | 311,493 | 16.2 |
| Old age population (Pop.Old) | 80,568 | 153,672 | 11,008 | 35,248 | 14.0 |
| Children population (Pop.Child) | 226,150 | 449,726 | 24,373 | 104,478 | 18.5 |
| Working age population ratio (Work.Ratio) | 0.70 | 0.71 | 0.61 | 0.02 | 1.2 |
| Old age population ratio (Old.Ratio) | 0.08 | 0.15 | 0.05 | 0.02 | 2.7 |
| Children population ratio (Child.Ratio) | 0.22 | 0.28 | 0.19 | 0.02 | 1.5 |
| Low educated population (Pop.LowEdu) | 373,014 | 905,799 | 20,636 | 195,665 | 43.9 |
| Middle educated population (Pop.MidEdu) | 377,045 | 755,050 | 61,965 | 158,207 | 12.2 |
| High educated population (Pop.HighEdu) | 56,193 | 240,963 | 14,554 | 39,573 | 16.6 |
| Low educated population ratio (LowEdu.Ratio) | 0.44 | 0.63 | 0.21 | 0.11 | 2.9 |
| Middle educated population ratio (MidEdu.Ratio) | 0.48 | 0.64 | 0.34 | 0.07 | 1.9 |
| High educated population ratio (HighEdu.Ratio) | 0.08 | 0.19 | 0.03 | 0.04 | 5.7 |
| Poor population (Pop.PoorPeople) | 111,416 | 308,780 | 9270 | 61,604 | 33.3 |
| Poor population ratio (PoorRatio) | 0.11 | 0.18 | 0.05 | 0.03 | 3.7 |
| Average Income | 2707 | 7258 | 1244 | 1473 | 5.8 |
| Pop. All | Pop. LowEdu | Pop. MidEdu | Pop. HighEdu | LowEdu. Ratio | MidEdu. Ratio | HighEdu Ratio | Pop.Poor People | Poor. Ratio | Average Income | |
|---|---|---|---|---|---|---|---|---|---|---|
| Pop.All | ||||||||||
| Pop.LowEdu | 0.91 | |||||||||
| Pop.MidEdu | 0.94 | 0.72 | ||||||||
| Pop.HighEdu | N.S. | N.S. | 0.70 | |||||||
| LowEdu.Ratio | N.S. | 0.74 | N.S. | N.S. | ||||||
| MidEdu.Ratio | N.S. | −0.74 | N.S. | N.S. | −0.97 | |||||
| HighEdu.Ratio | N.S. | −0.64 | N.S. | N.S. | −0.91 | 0.80 | ||||
| Pop.PoorPeople | 0.85 | 0.93 | 0.68 | N.S. | 0.64 | −0.64 | N.S. | |||
| Poor.Ratio | N.S. | 0.61 | N.S. | N.S. | 0.66 | −0.65 | −0.60 | 0.80 | ||
| Average Income | N.S. | N.S. | N.S. | N.S. | −0.77 | 0.68 | 0.83 | N.S. | N.S. |
| Strategy | Advantage | Weakness |
|---|---|---|
| Early Warning Systems | Timely alerts, Potential for reducing casualties. | Dependence on infrastructure, False alarms. |
| Infrastructure Development | Enhanced resilience, Protection of assets. | High cost, Environmental impact. |
| Community Engagement and Preparedness | Empowering communities, Local knowledge. | Variable community response, Resource constraints. |
| Land Use Planning and Zoning | Mitigation of exposure, Sustainable development. | Implementation challenges, Resistance. |
| Insurance and Risk Transfer Mechanisms | Financial protection, Incentive for risk reduction. | Limited coverage, Affordability. |
| Ecosystem-Based Approaches | Natural flood defenses, Ecological benefits. | Time-intensive, Potential conflicts. |
Disclaimer/Publisher’s Note: The statements, opinions and data contained in all publications are solely those of the individual author(s) and contributor(s) and not of MDPI and/or the editor(s). MDPI and/or the editor(s) disclaim responsibility for any injury to people or property resulting from any ideas, methods, instructions or products referred to in the content. |
© 2023 by the authors. Licensee MDPI, Basel, Switzerland. This article is an open access article distributed under the terms and conditions of the Creative Commons Attribution (CC BY) license (https://creativecommons.org/licenses/by/4.0/).
Share and Cite
Sigit, A.; Koyama, M.; Harada, M. Flood Risk Assessment Focusing on Exposed Social Characteristics in Central Java, Indonesia. Sustainability 2023, 15, 16856. https://doi.org/10.3390/su152416856
Sigit A, Koyama M, Harada M. Flood Risk Assessment Focusing on Exposed Social Characteristics in Central Java, Indonesia. Sustainability. 2023; 15(24):16856. https://doi.org/10.3390/su152416856
Chicago/Turabian StyleSigit, Adityawan, Maki Koyama, and Morihiro Harada. 2023. "Flood Risk Assessment Focusing on Exposed Social Characteristics in Central Java, Indonesia" Sustainability 15, no. 24: 16856. https://doi.org/10.3390/su152416856
APA StyleSigit, A., Koyama, M., & Harada, M. (2023). Flood Risk Assessment Focusing on Exposed Social Characteristics in Central Java, Indonesia. Sustainability, 15(24), 16856. https://doi.org/10.3390/su152416856