Article

Assessment of Post-Installed Anchor Stiffnesses in Uncracked Concrete with Different Types of Coarse Aggregates

1
Fischer Austria GmbH, 2514 Traiskirchen, Austria
2
Fischerwerke GmbH & Co. KG, 72178 Waldachtal, Germany
*
Author to whom correspondence should be addressed.
Sustainability 2023, 15(24), 16855; https://doi.org/10.3390/su152416855
Submission received: 24 July 2023 / Revised: 24 November 2023 / Accepted: 5 December 2023 / Published: 14 December 2023

Abstract

:
This paper investigates the potential influence of different aggregates in the concrete mix design on the concrete cone resistance of different types of anchors as well as the anchor stiffness. In fact, bonded anchors with three different adhesives and mechanical anchors and concrete screws of two types were installed in five different concrete mixes and tested in a standard tensile configuration using pull-out tests with wide support resulting in concrete cone failure. A rigorous analysis of both the initial and secant stiffness values of the different anchor types is carried out in a comparative manner. The results of the experimental program show that the anchor stiffnesses are not influenced by the different aggregates in the concrete mixes, but rather by the type of anchor. Finally, this manuscript provides a narrow range of both initial and secant stiffness values with respect to anchor type only.

1. Introduction

Fastening technology is an essential part of the building and construction industry. Fasteners are widely used in modern construction, particularly in applications involving the connection of different structural members or the attachment of equipment to load-bearing members [1,2,3]. In general, fasteners are divided into different groups according to the load transfer mechanism or their installation time. Fasteners can therefore be classified as (i) mechanical anchors, where the load is transferred either by mechanical interlocking or by friction between the steel and the substrate material, or (ii) adhesive anchors, where the load is transferred by bonding through a thin layer of adhesive [4]. Fasteners are further classified as (i) cast-in-place and (ii) post-installed, depending on the method of installation. This paper focuses only on the different types of post-installed anchors.
In general, fasteners are subject to a rigorous approval process to assess their performance over their intended service life and under a wide range of environmental conditions [5,6,7]. On the other hand, the design of anchorages follows force-based approaches. These are usually semi-empirical methods such as the widely used Concrete Capacity Design (CCD) method [8].
In the CCD approach, the resistance of the anchorage is calculated against various possible failure modes, and the least resistance governs the design. Thus, the design approach effectively follows a resistance-based design concept. However, due to the semi-empirical nature of the problem, several simplifications are made in the design calculations, and the scope of the design is limited to the limits of the test database. Additionally, the design method could be influenced by the mix design of the base material. As a matter of fact, for concrete breakout failure mode, the concrete mix and the aggregate type influence the resistance of the fastener.
Different types of aggregates have been found to influence the concrete properties [9,10,11,12]. Additionally, the effect of different aggregate types on the concrete breakout resistance has been investigated for undercut anchors [13], as well as for headed stud anchors [14]. Both studies concluded that the aggregate influence on the concrete breakout resistance is eliminated if the CCD method is considered, although the latter was found to be rather over-conservative. The effect of recycled aggregate on the tensile resistance of both cast-in-place and post-installed torque-controlled anchors was investigated in [14] and the same conclusions were reached. However, these studies provide no information on the effect of the concrete mix on the anchor stiffness. Furthermore, Hordijk et al. [15] tested anchors installed in concrete with recycled aggregates. However, in all these tests steel failure has been observed. Therefore, an assessment of the effect of the recycled aggregates on both the anchor’s ultimate resistance and anchor stiffness was not possible.
The influence of the different types of aggregates in the concrete mix on the stiffness of the anchor is an important factor that needs to be investigated for a displacement-based design approach [16,17]. A displacement-based approach requires a direct consideration of the fastener stiffness and the stiffness and deformations of the baseplate in the calculation of the anchorages. Following this approach, the anchors can be considered either as linear elastic (constant stiffness) or as non-linear springs (varying stiffness) [17] active in tension, which is beneficial for the realistic calculation of the force distribution among the anchors of an anchor group. Additionally, a displacement-based approach as a more realistic assessment method can calculate more accurately the required thickness of a steel baseplate in a way that an optimal amount of steel is used avoiding unnecessary use and therefore production of steel. However, one of the main open discussion topics concerning the displacement-based approach concerns the stiffness of a specific anchor and namely whether it could be considered in a constant range for different concrete mixes, concrete strength classes and anchor types. Thus, the main objective of the present manuscript is to investigate the potential effect that different aggregate types in concrete mixes could have on the initial as well as on the ultimate resistance’s secant stiffnesses of six different types of fasteners, both mechanical and bonded. The concrete mixes are designed to have approximately the same strength. The selected aggregates are different in terms of hardness, shape, and size. That selection allows the assessment method to cover a broad range of concrete mixes, i.e., different aggregate types and shapes, for a target designed strength class. Furthermore, the selection of steel fibre reinforced concrete (SFRC) checks the robustness and the reliability of the method on higher strength concrete mixes. All anchors are tested in an unconfined configuration, wide supports, that ensure a concrete cone failure. The findings of the present manuscript aim to give an overview about anchor stiffness for the use within displacement-based design approach with linear or non-linear springs. Additionally, this study intends to produce insights on the number of necessary tests needed for the assessment of stiffnesses for different types of anchors installed in concrete of same concrete class with variation of the used aggregates.

2. State of the Art

The current international standards [18,19,20] adopt the CCD method for the anchorage design. Additionally, they impose the requirement of a rigid baseplate ensuring negligible deformations with respect to the anchor displacements. This requirement allows the forces or displacements to be approximated by assuming a linear distribution. Moreover, the baseplate can be assumed to be sufficiently stiff if the design actions do not violate its linear elastic behaviour and as long as its deformations can be neglected when they are compared to anchor displacements. The force-based design methods do not include the calculation of the plate deformations and the anchor displacements. However, the baseplate deformations are linked to the anchor displacements and therefore to anchor stiffnesses. In practice, a baseplate is often considered to be sufficiently stiff even though the plate deformations are no longer linearly distributed [18,21]. As shown in [18], this assumption can often lead to miscalculation of the forces. Therefore, the displacements of the anchors and thus their stiffnesses are relevant for the accurate calculation of the base- plate deformations. As a matter of fact, the anchors could be approximated by linear or non-linear springs. In the first case, the value of the initial secant stiffness is sufficient, while for the case of non-linear springs, additional secant stiffnesses need to be assessed for each anchor [16,19]. Thus, the present manuscript investigates the influence of different concrete mixes on the initial (k1) and secant (k2) stiffness. This is a study of high importance since the results provide insight into the effect of the aggregate type on the performance of different types of fasteners. In addition, the study aims to contribute to the establishment of test and assessment procedures necessary for displacement-based assessment models.

3. Description of Experiments

This section provides all the necessary information regarding the tensile tests of the investigated anchors installed in concretes with different aggregate types in the mix designs. As a matter of fact, all the measuring apparatuses are reported as well as the types and the geometries of the tested post-installed fasteners. Additionally, the detailed information of the different concrete mixes is discussed in this section.

3.1. Test Specimens

All tests refer to anchors installed in concrete slabs. The design of the experiments, i.e., the concrete member dimensions, ensure the formation of the full-size concrete breakout bodies excluding the influence from or on the adjacent fasteners. All fasteners are placed with a spacing > 4hef, where hef, is the embedment depth of the anchor, such that any influence due to close placement is excluded. The concrete member has a thickness of 200 mm which corresponds to a member thickness > 2hef. Additionally, the concrete member is provided with 2*ø8 edge reinforcement ensuring negligible flexural deformations and no splitting of the concrete.
Within the scope of this experimental program, five concrete mixes with different aggregate types are tested, namely I. Gravel 0/16, II. Gravel 0/32, III. Basalt 0/16, IV. Limestone 0/16, and V. Gravel 0/8 with steel fibres with hooked-end and length of L = 35 mm, diameter d = 0.75 mm, and tensile strength 1200 MPa. The concrete mix of the corresponding concrete batches is designed according to EN 206 [22] and is reported in Table 1, along with details of the aggregate types.
The concrete mixes I–IV are designed to be the same in terms of water, cement, and aggregate content. Therefore, the only differences should originate in the different types of aggregates. In the case of mix V, the addition of steel fibres required a different basic mix.
As can be seen in Table 1, all the different mixes have the same or similar water content, w, and thus also the same or similar water to cement ratio, w/c. Note that the assessment of fastening systems requires a concrete class C20/25; therefore, the w/c has a relatively high design value so that the requested concrete class is reached. In addition to the concrete mix V, which contains steel fibres and therefore has a reduced aggregate-to-cement content, a/c, all other four mixes have exactly the same a/c and the same aggregate content. Additionally, the aggregate content for different ranges of aggregate diameter can be considered the same, apart from the concrete mix II, which also has aggregates with a maximum diameter dmax = 32 mm to investigate the influence of aggregate size.
The compressive strength of the concrete batches was measured on standard concrete cubes with a side length of 150 mm according to EN 12390-1 [23]. In addition, the concrete tensile strength was measured with 4-point bending and splitting tests according to EN 12390-5 [24] and EN 12390-6 [25], respectively. The results of the hardened concrete properties are given in Table 2.
The different aggregate mineralogies influence their material properties and thus the concrete material properties [28,29,30,31,32]. Moreover, the different aggregate types influence the concrete modulus of elasticity [26,28]. Therefore, this manuscript aims to investigate the potential effect of the coarse aggregate type on the stiffness of different post-installed fasteners.

3.2. Tested Fasteners and Installation

To investigate the influence of the aggregate type on the axial stiffness of single fasteners, six different post-installed fasteners of different manufacturers were tested. The embedment depth was chosen as 70 mm for all cases, and the fastener size was selected such that the steel cross-sectional area is within a comparable range. This allows the comparison of the stiffness of different fastener types within one concrete batch as well. However, this is not the primary scope of this study. In Table 3, the tested types of post-installed anchors are given.
The fasteners were installed according to the corresponding Manufacturer’s Installation Instructions. Accordingly, the holes were drilled perpendicular to the concrete surface and the bore holes were cleaned. After the drilling and cleaning process, the fasteners were set, and the fixture was positioned on the fasteners, respectively. In the case of the expansion anchor, the prescribed installation torque was applied, which resulted in the expansion and pre-stressing of the fasteners. The torque was set back to 0 Nm after 10 min, and the nuts were only hand-tightened to ensure the same initial conditions for all fasteners during the testing and neglect the influence of pre-stressing on the stiffness values. In the case of bonded anchors, no installation torque was applied, and the nut was only hand-tightened after the prescribed curing time of the two adhesives (epoxy and vinyl-ester). Finally, the concrete screws were installed using an impact screwdriver with no preload applied to the fasteners.

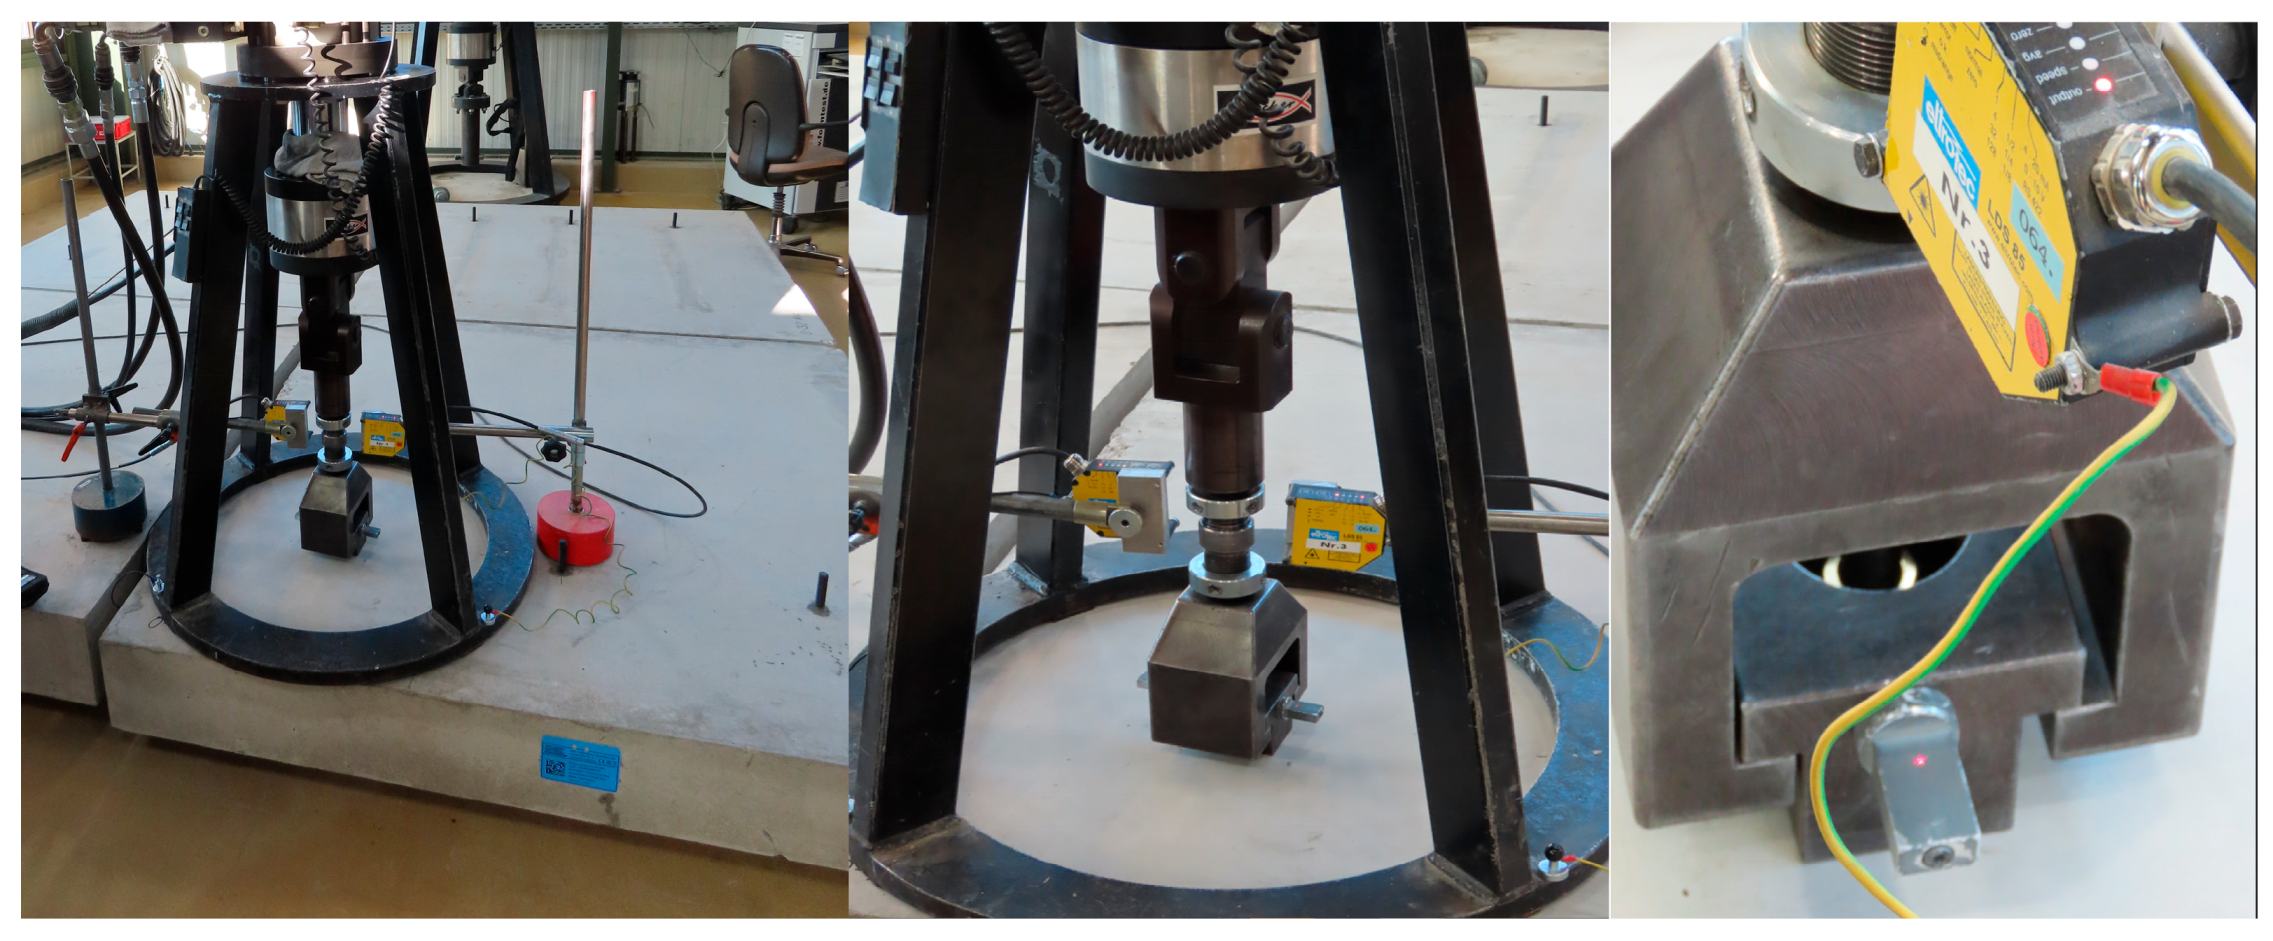
3.3. Test Setup and Test Procedure

The test setup is designed to accurately measure the vertical displacement of the fastener. This is essential for the accurate evaluation of fastener axial stiffness, which is the objective of this study. Correspondingly, the test setup consisted of the following main components (see Figure 1):
  • A tension test rig with adequate support distance to allow the formation of an unrestricted concrete cone;
  • A servo-hydraulic cylinder with an integrated calibrated load cell (0–250 kN) from Instron (Darmstadt, Germany);
  • A rigid loading fixture and high-strength threaded rod for load application;
  • Two laser sensors for measuring the axial anchor displacement (eltrotec Serie LDS 85 with a measuring rate of 1.25 kHz–312.5 kHz);
  • A data acquisition system with computer interface to record the test data with a measurement frequency of 10 Hz.
Figure 1. Test set-up and displacement measurement.
Sustainability 15 16855 g001
The tensile load was applied to the fasteners via the rigid fixture using a servo-hydraulic cylinder in displacement control. The applied tensile load on the fastener was measured using a calibrated load cell with respect to the expected load range. The displacement rate was defined in such a way that the peak load is reached in 60–180 s. This corresponds to ca.1 mm/min for bonded anchors, 2 mm/min for concrete screws and 5 mm/min for expansion anchors. The axial displacements were measured using two triangulation laser displacement sensors of type eltrotec Serie LDS 85. Each laser sensor emits a monochromatic beam with a wavelength of 670 nm. The light is reflected by the measured object, and the reflection beam is captured by a position-sensitive charge-coupled device (CCD) sensor. Once the measuring object changes its distance to the sensor, this causes a shift of the imaged point on the CCD sensor. This shift is evaluated, and the displacement of the object is calculated.
The laser sensors measure opposite sides of the rigid fixture that is directly connected with the fastener in the force flow. Thus, the measured displacements correspond to the fastener’s axial displacement. For the evaluation, the average value of the two laser measurements is considered as the fastener’s axial displacement. The test data recording takes place with a measurement frequency of 10 Hz. Therefore, sufficient measurement points are recorded, providing an accurate description of the load–displacement curve of each single fastener. Moreover, that allows a more accurate calculation of the corresponding initial and secant stiffness values. The tests are performed by the same laboratory. Thus, both the test set-up and the testing personnel are the same. Therefore, the measurement errors are expected to be the same for all different datasets.

4. Results and Discussion
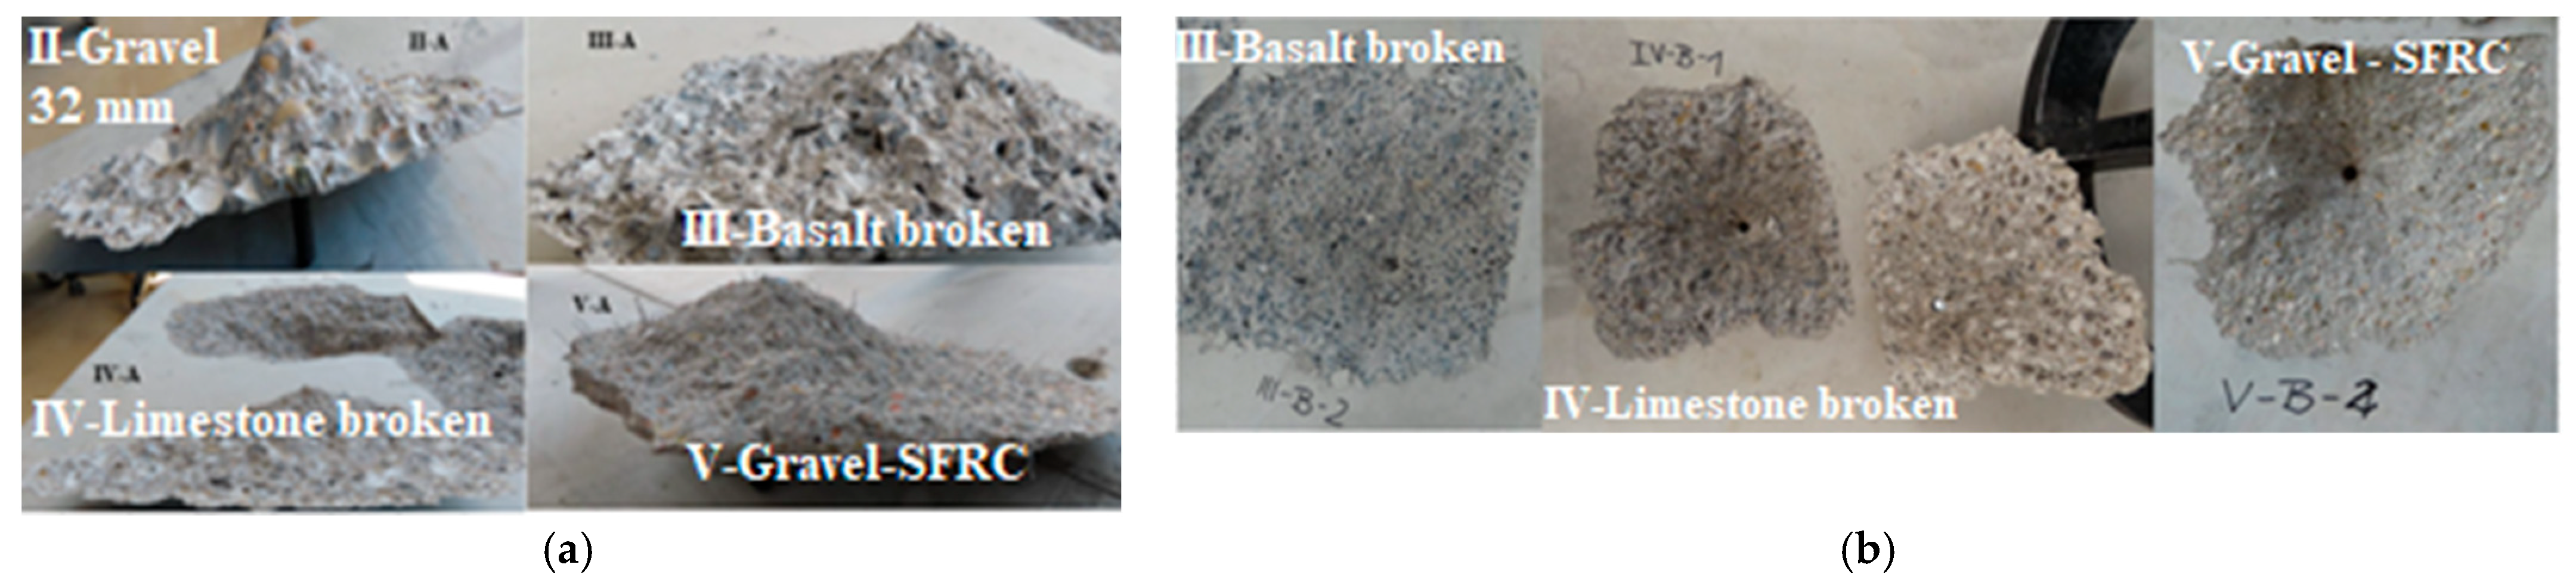
This section presents the test results and the performed analysis for each different dataset. First the failure modes and the load–displacement characteristics of each case are discussed. Then, the behaviour of the stiffness of each different anchor type in relation to the concrete mix design is investigated. Finally, a statistical comparison of the initial and secant stiffnesses for the different fasteners and the different concrete mixes is performed and presented.

4.1. Failure Modes

As mentioned in Section 3.1, in all tests concerning the different anchor types installed in the investigated concrete mixes, the failure mode is observed to be concrete breakout. Figure 2 shows the observed failure modes for all the different anchor types. In all investigated datasets, a full concrete breakout is observed. The concrete cone started at the embedment depth, while the failure occurred on the concrete surface. This allows a direct comparison of the initial and secant stiffness values of each of the different fasteners in the five different concrete batches.

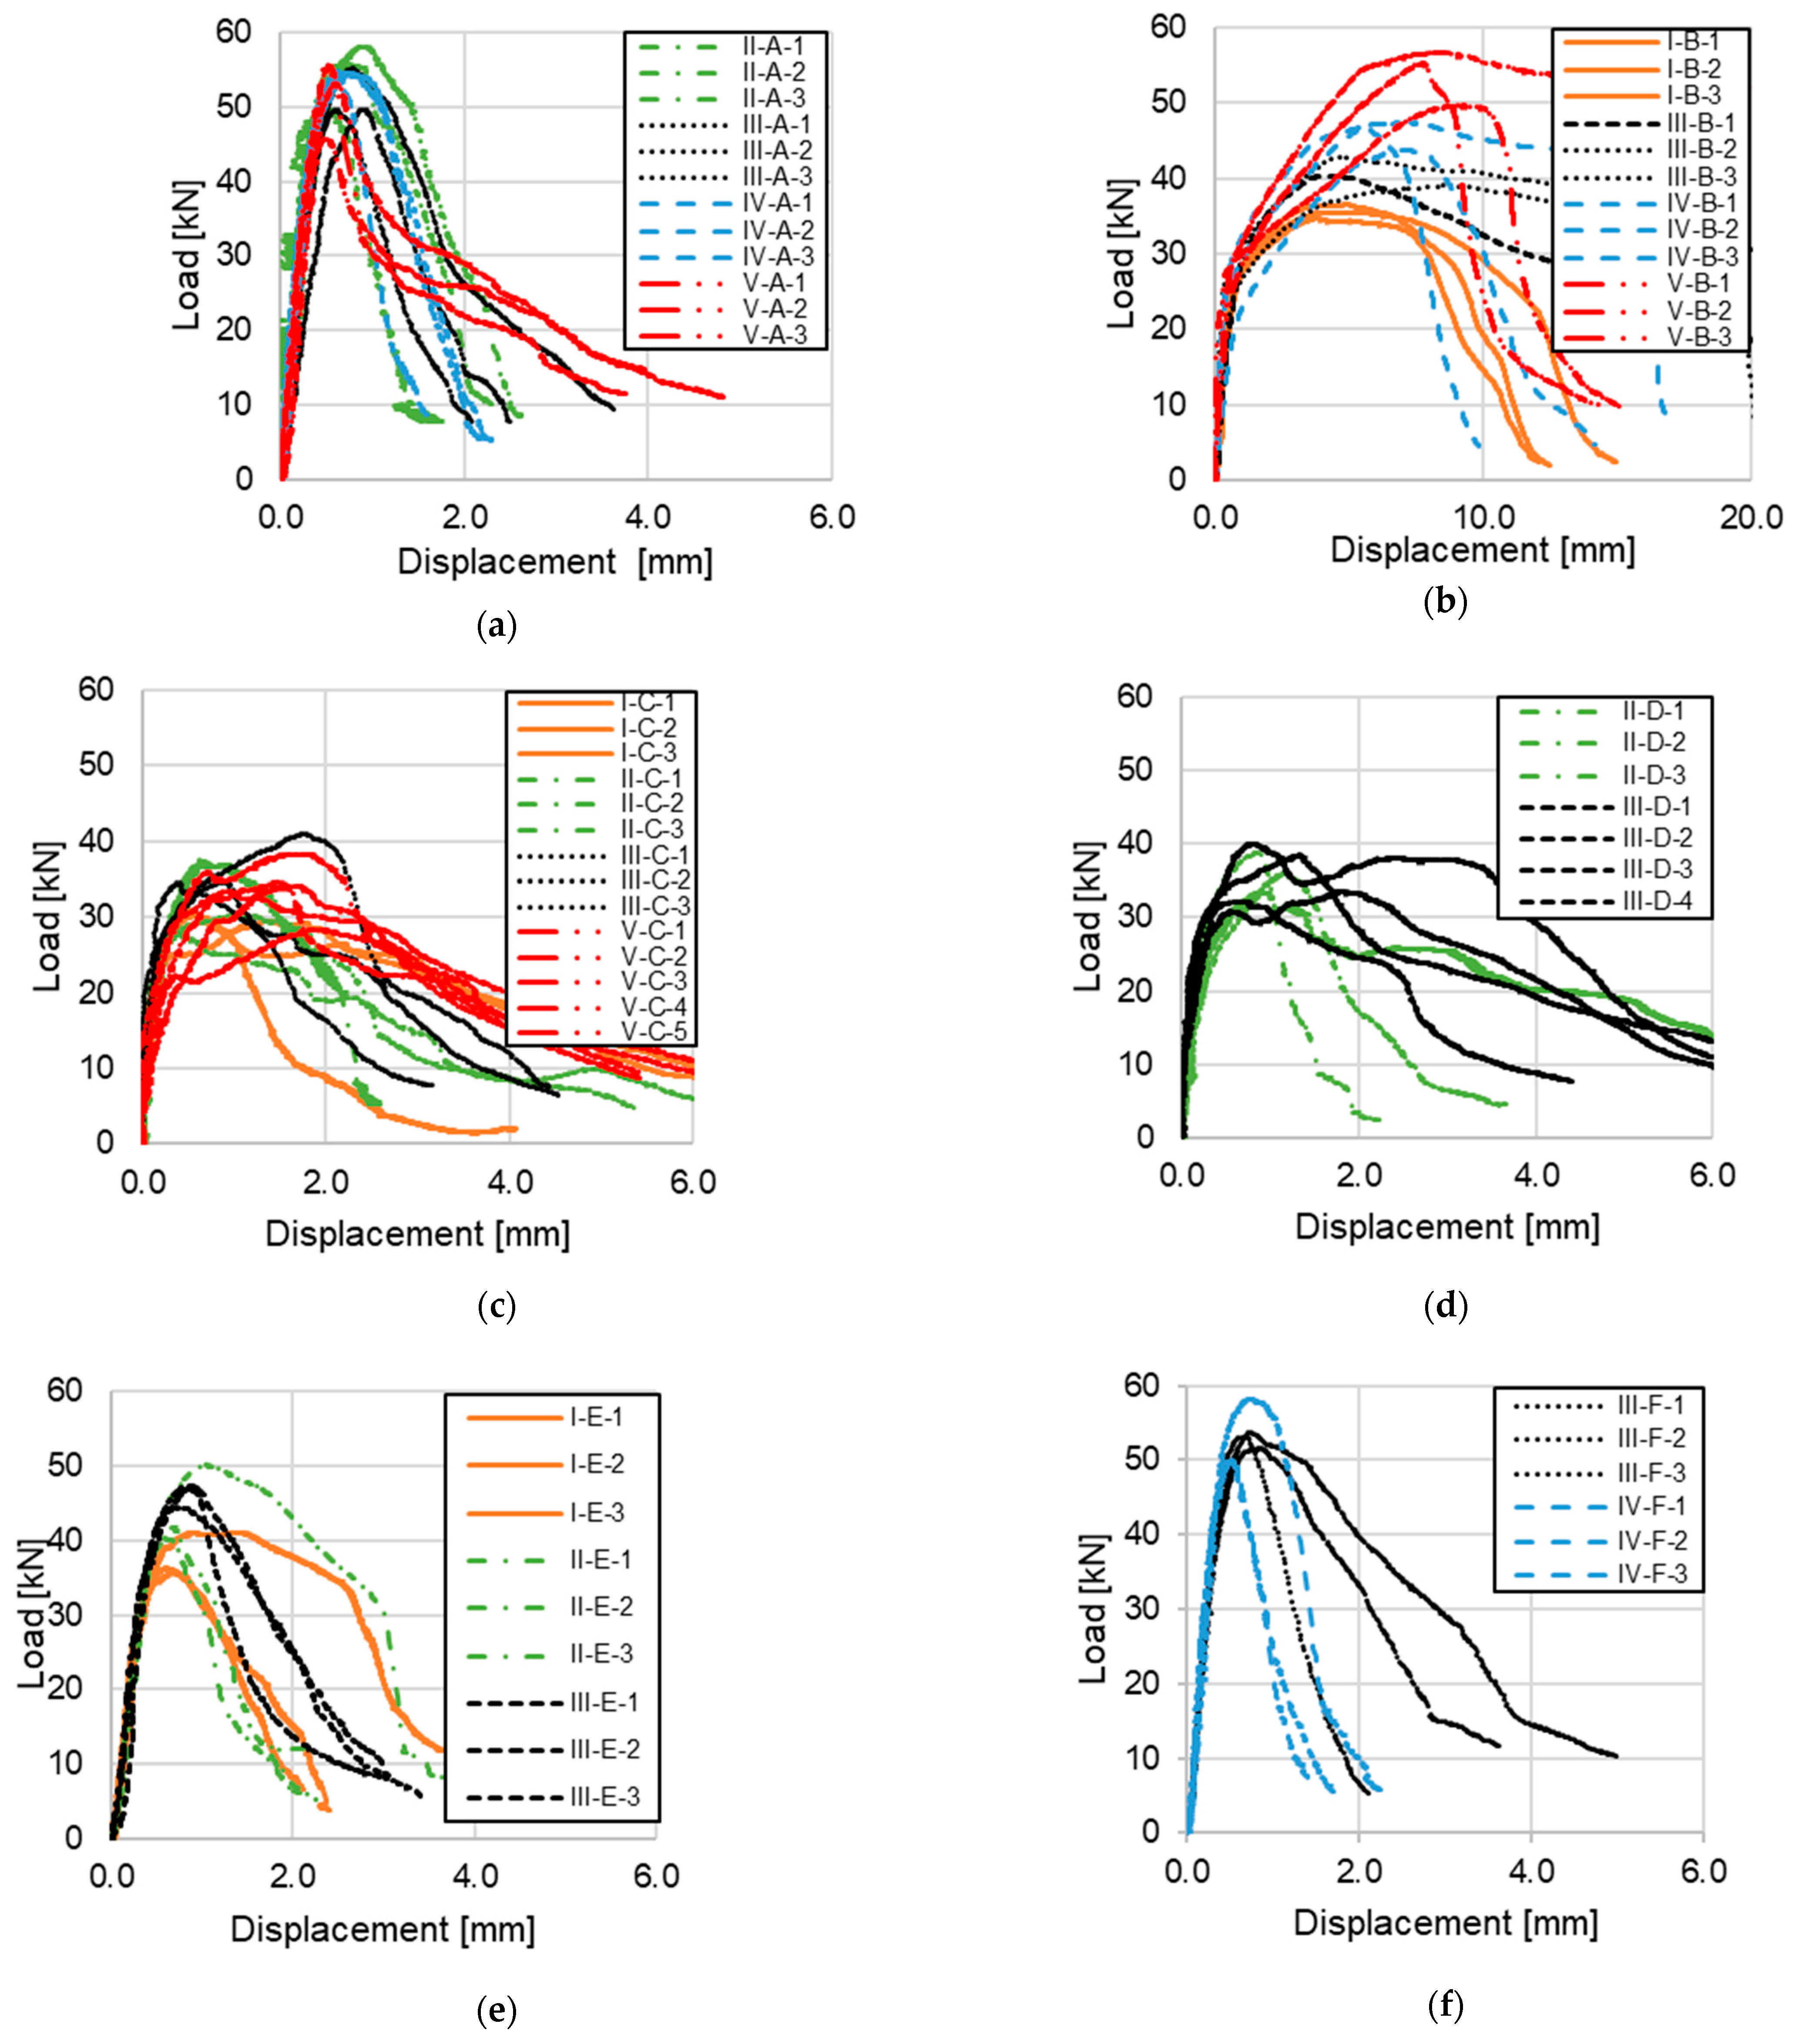
4.2. Load–Displacement Curves

The load–displacement curves of the different anchor types installed and tested in concrete with different mixes are illustrated in Figure 3. The different mix designs have an effect on the ultimate tensile anchor resistance of some of the anchor types. However, these differences are expected to vanish when the ultimate tensile capacity of the anchor is normalised with the expected value obtained from the CCD method. This is in accordance with the findings of previous studies [13,14,33].
Furthermore, regarding the concrete mix V reinforced with steel fibres, an increase in the tensile anchor resistance is expected since the primary role of the fibres is to improve the crack formation and propagation, which results in increased tensile capacity and ductility, while the influence on the compressive strength and modulus of concrete is rather small [34]. Therefore, as expected the presence of steel fibres does not significantly change the initial stiffness k1. On the other hand, it is expected to influence the secant stiffness k2, which is associated with the ultimate load and the increased corresponding displacement. This hypothesis is supported by the existing literature for different types of fasteners installed in SFRC [34,35,36].
A more detailed analysis of the ultimate tensile resistance in regard with the concrete mix design is given in Section 4.3.
Contrary to the tensile resistance, the initial stiffness of each individual test for the same anchor type seems to be unaffected by the different mix design. This is valid for all different anchor types that were tested. However, a more thorough analysis of the effect of the aggregates on the anchor stiffness is required to draw more solid conclusions. Therefore, a more detailed analysis of the anchor stiffness is performed on the experimental data. The analysis compares two secant stiffnesses of each test, the initial secant stiffness k 1 = N 50 % / δ 50 % and the secant stiffness at peak k 2 = N u / δ u , where N u is the ultimate tensile resistance, δ u the displacement at load of N u , N 50 % the load equal to the half of N u , and δ 50 % the displacement at load of N 50 % . Figure 4 shows the calculation of the secant stiffnesses k 1 and k 2 which are used in the analysis. The analysis of the stiffnesses with respect to the concrete mix design is given in Section 4.4.

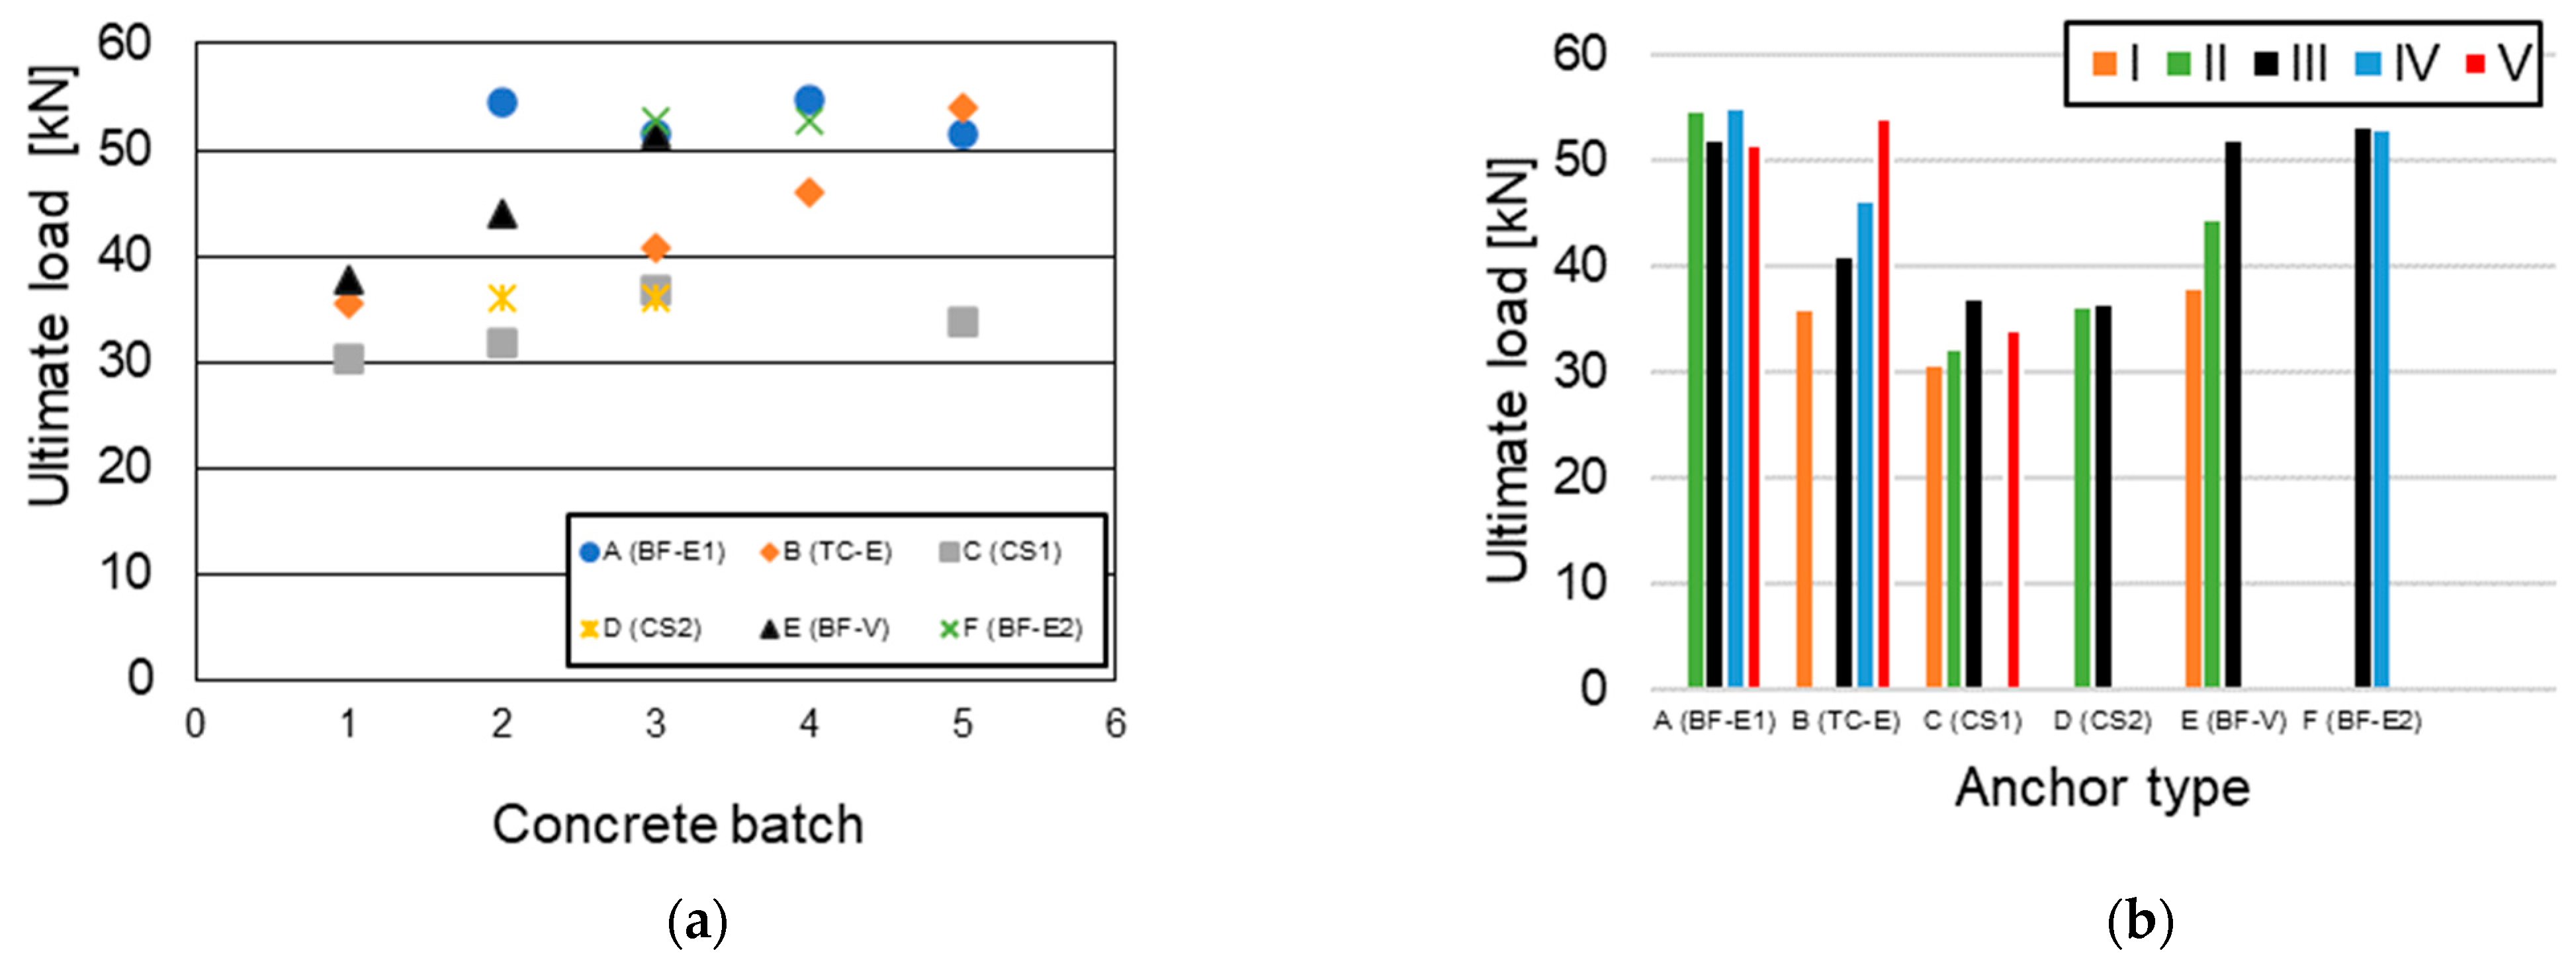
4.3. Ultimate Tensile Resistance vs. Concrete Batch

As mentioned above, the different concrete mixes, i.e., aggregate types, were found to have an influence on the ultimate tensile anchor resistance of some of the tested anchor types. Figure 5 shows the ultimate tensile resistance of the different anchors plotted against the different concrete batches (see Figure 5a) and against the different anchor types (see Figure 5b). Note that the ultimate resistance was not normalised with respect to concrete strength.
Both epoxy-based bonded anchors A and F were found to have no significant influence from the different mix of the base material. Additionally, the concrete screws C and D show no significant sensitivity of their tensile capacity with respect to the different concrete mixes (see Figure 5b).
On the contrary, the higher sensitivity of the anchor’s tensile resistance to the different concrete mix design, i.e., aggregate type, is observed for the anchor type B (Expansion Anchor) and E (Bonded Anchor—Vinylester-based). However, if a normalisation with respect to the concrete strength were to be considered, a more accurate assessment could be performed.

4.4. Stiffness vs. Concrete Mix

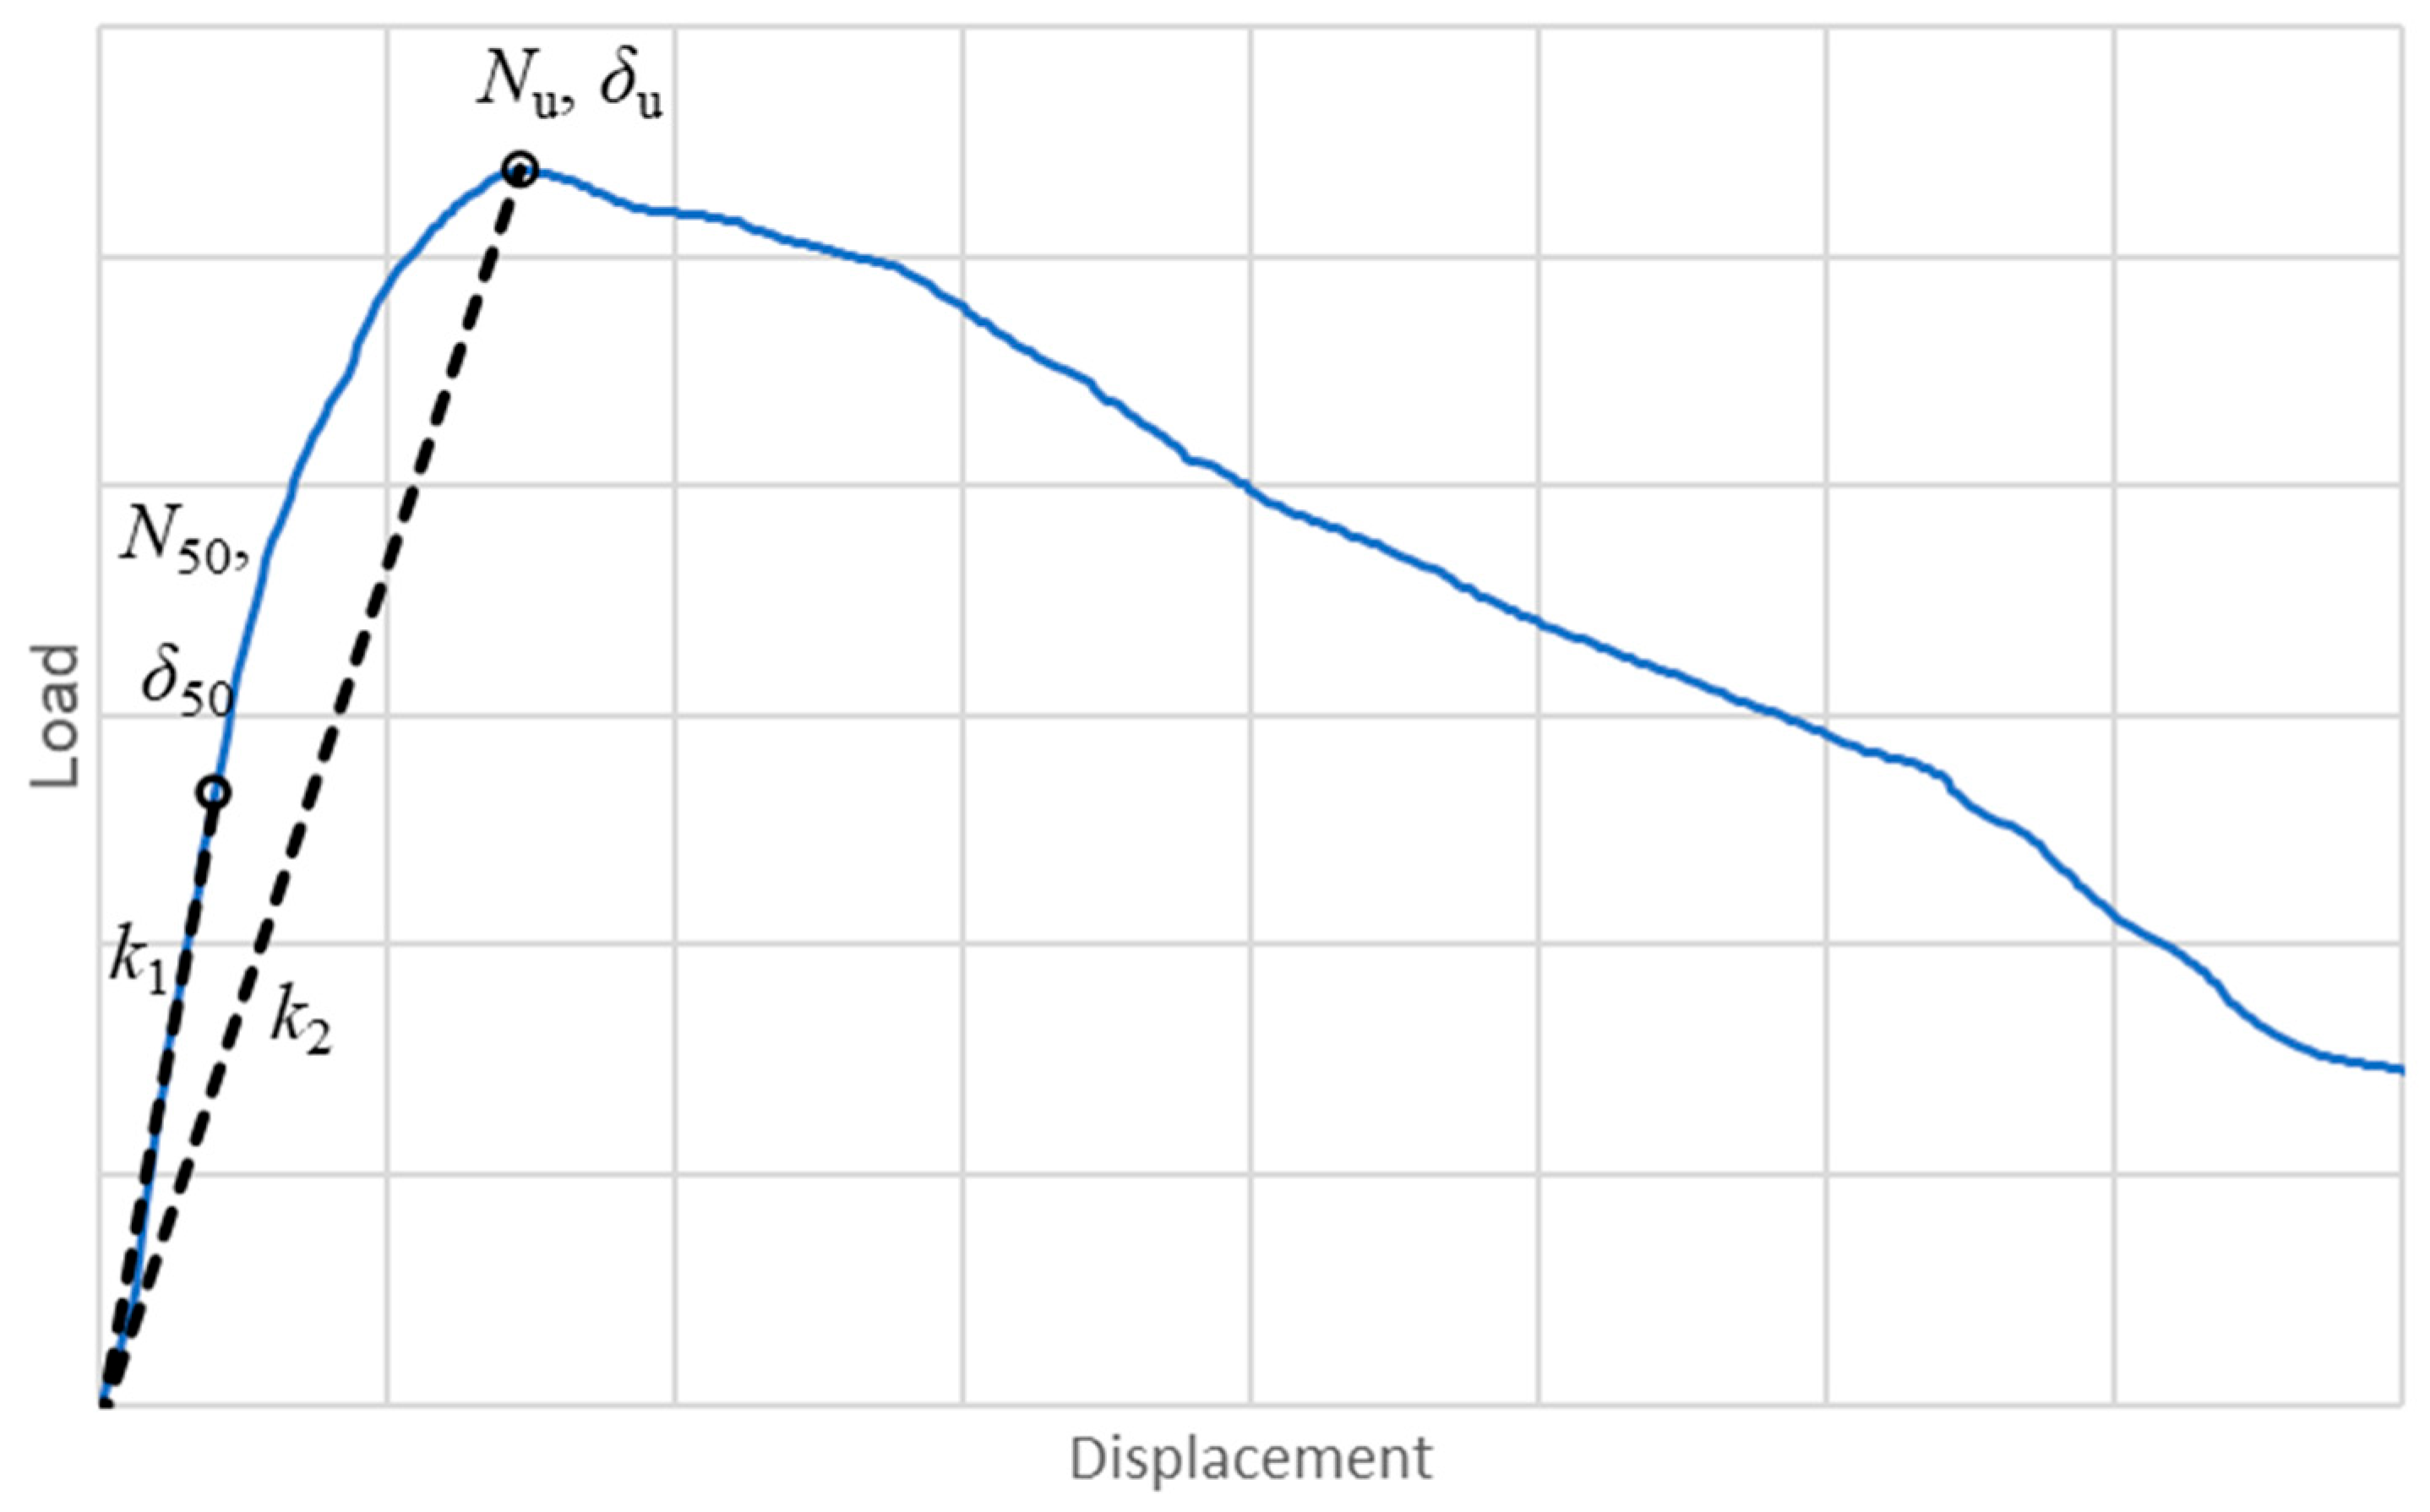
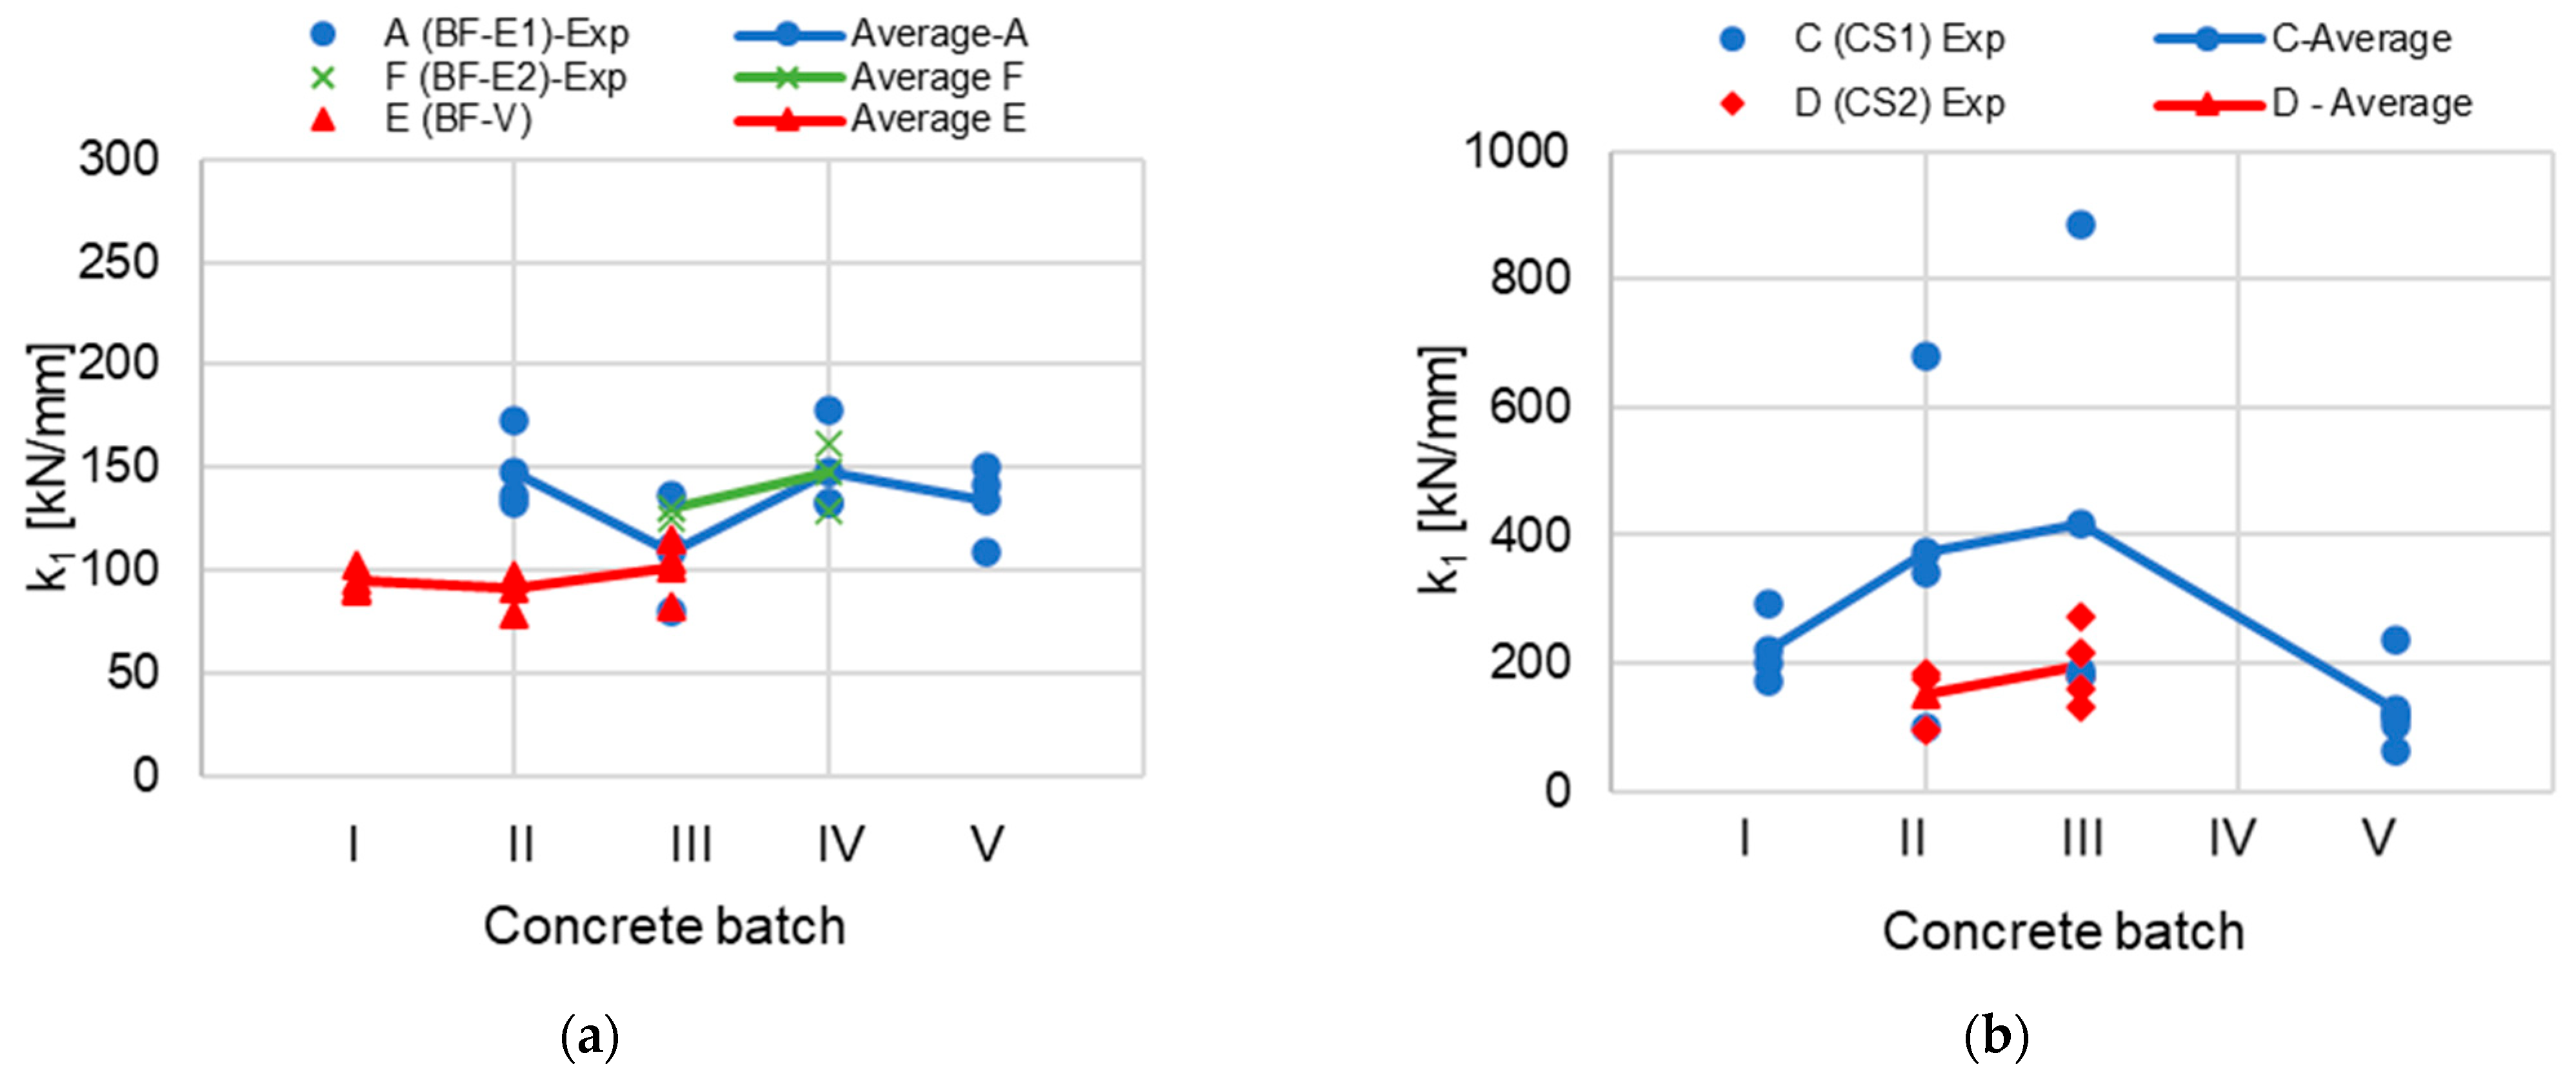
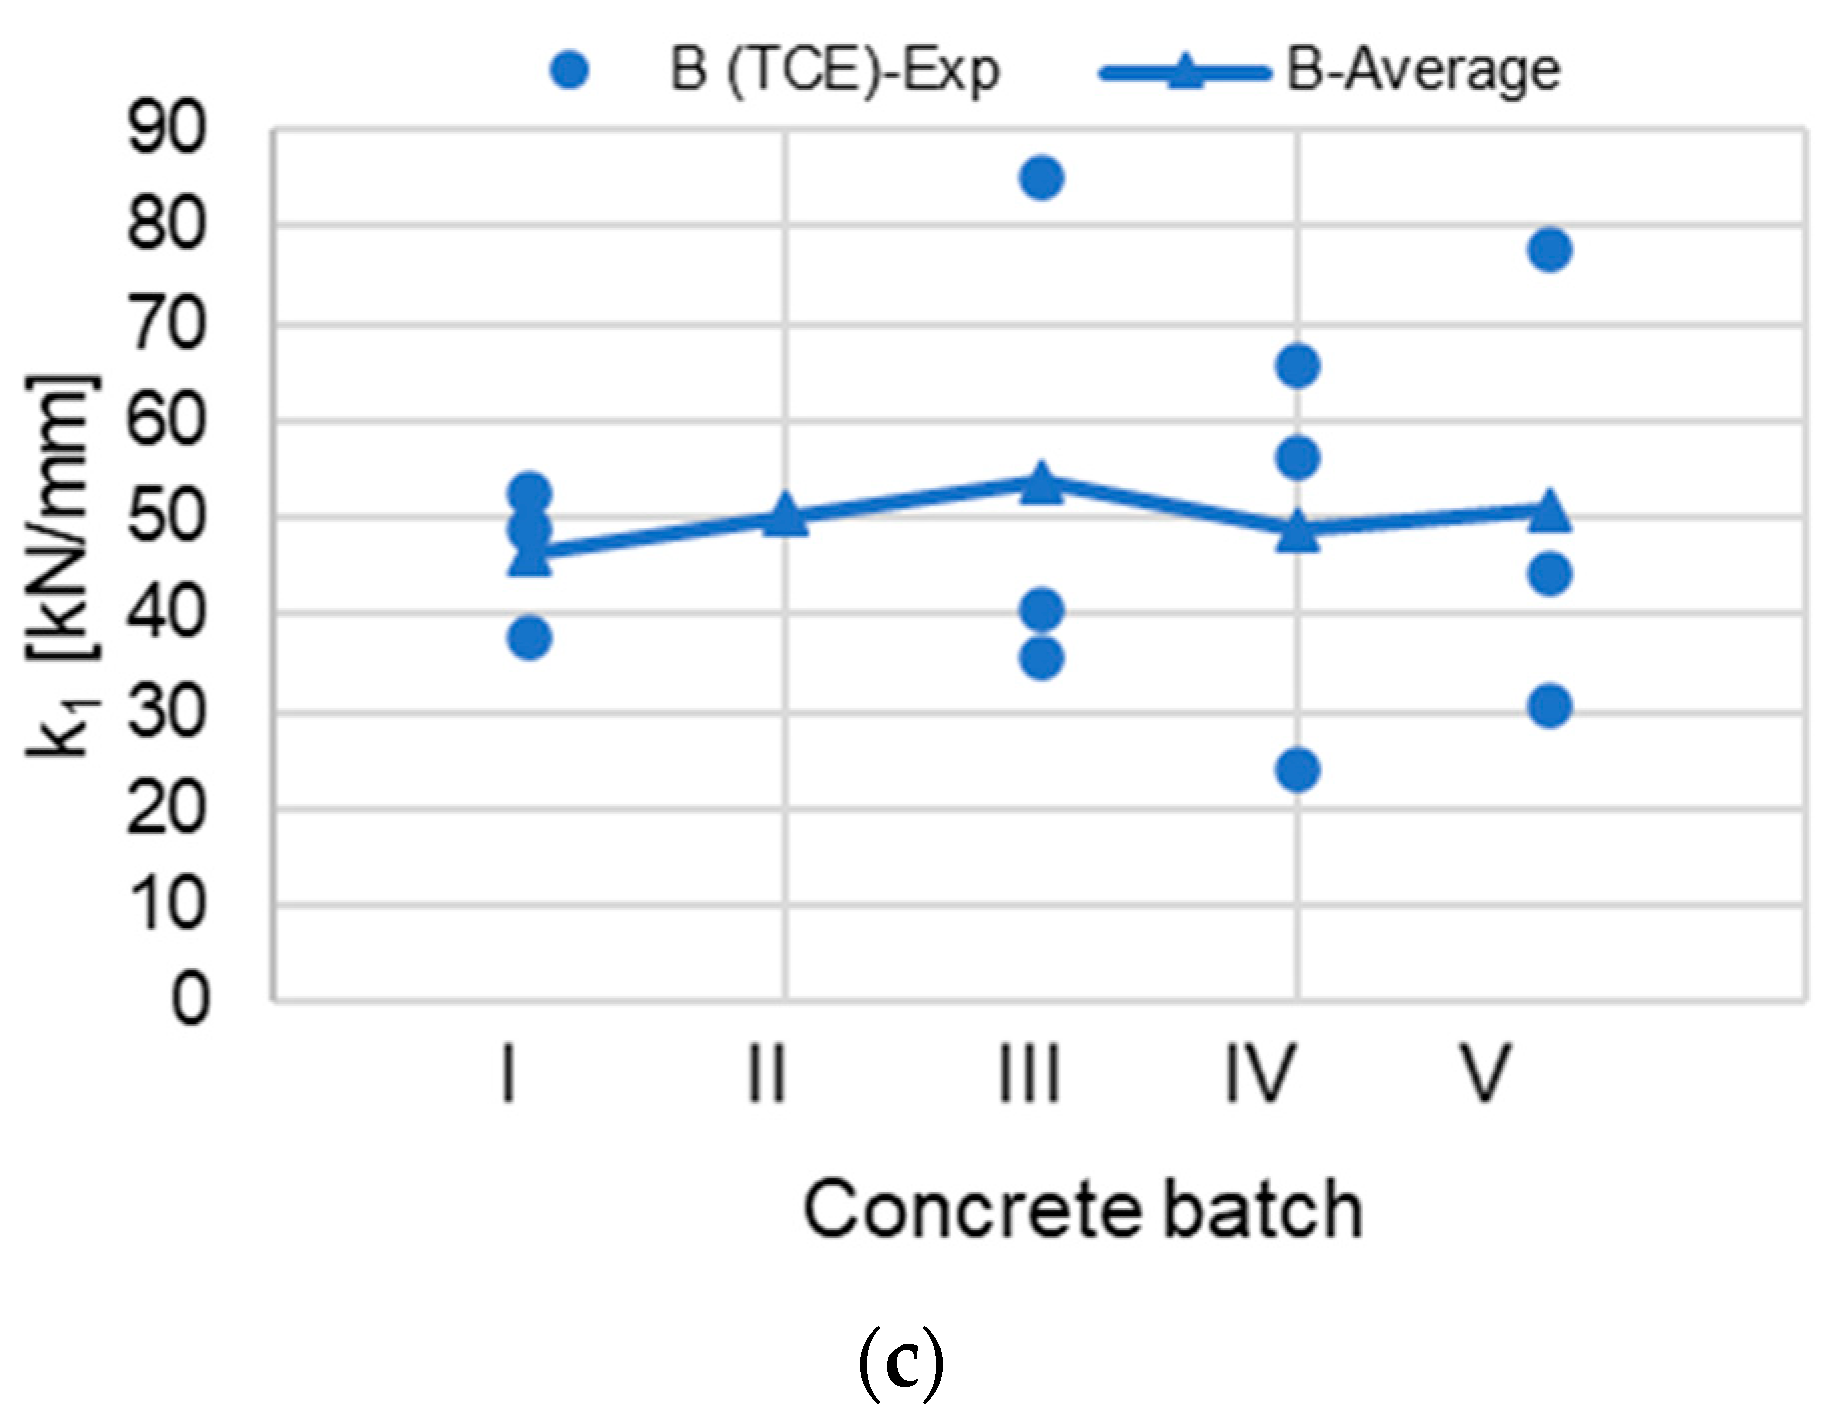
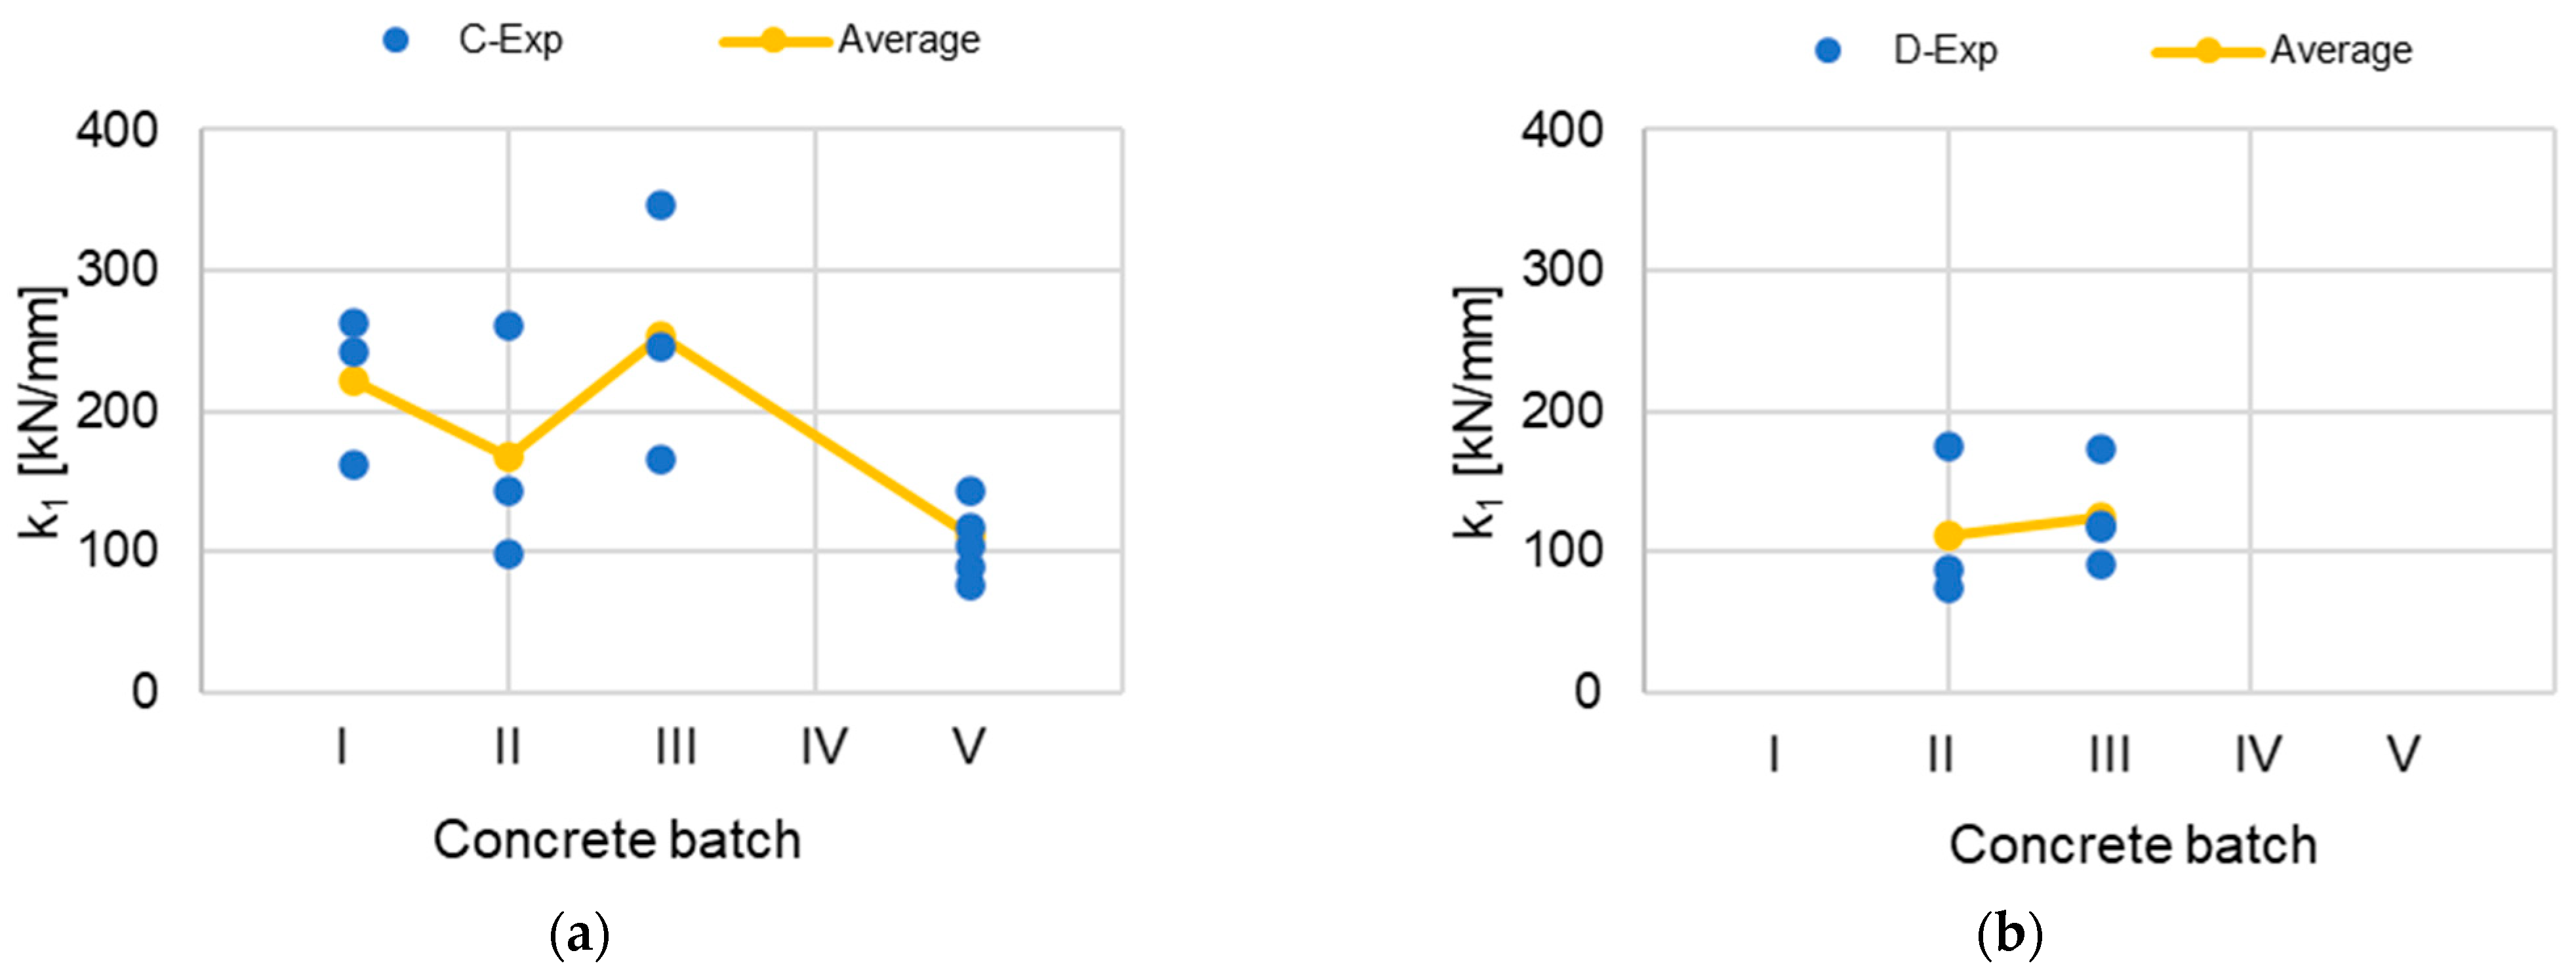
4.4.1. Initial Stiffness

The results of the initial stiffness values k 1 = N 50 δ 50 in relation to the concrete batch are shown in Figure 6. Based on the results, it can be concluded that for the bonded anchors with the three different adhesive agents (A, E, and F) the mean value of the initial stiffness k 1 can be approximated as almost constant (see Figure 6a). The same conclusion can also be made for the expansion anchor B, as shown in Figure 6c.
On the contrary, in the cases where the two different concrete screws have been tested, the initial stiffness seems to change with the concrete mix. However, the scatter of the individual datasets within one test series in one concrete batch is also large: the coefficient of variation (CoV) is always CoV ≥ 30%. This suggests that the change in stiffness might not necessarily correspond to the influence of aggregate type in the concrete mix.
In order to exclude possible errors, an additional way of estimating the initial stiffness k1 is investigated. As a matter of fact, of each individual dataset the datapoints of anchor displacement and axial load until N50 are selected and a line is fitted by the least squared error method (LSE). Then, the scale coefficient of the fit is considered as the initial stiffness, k1. The result of the comparison of the two approaches is shown in Figure 7. In general, for the bonded anchors (A, E, and F) and the expansion anchor (B), no significant differences are observed between the k1 values calculated with the two different methods. However, in the case of the concrete screws the k1 values calculated by the ratio N50/δ50 are significantly higher than the respective values obtained by the LSE method.
Therefore, for the concrete screws (C and D) the initial stiffness is obtained by fitting a line with the LSE on the elastic regime of the load–displacement curve. This method reduces significantly the scatter among the k1 values as shown in Figure 8, and it could be considered as a second option of calculation for the stiffness of an anchor test when the scatter derived by the ratios N 50 δ 50 is high, e.g., >40–50%.
As given in Figure 8a, the sole dataset that shows a reduction trend of the k1 values is the concrete batch V (SFRC). This batch also has the lower scatter among the individual k1 values. However, as shown in the statistical analysis in Section 4.4.3, this deviation cannot be considered as a significant sensitivity.

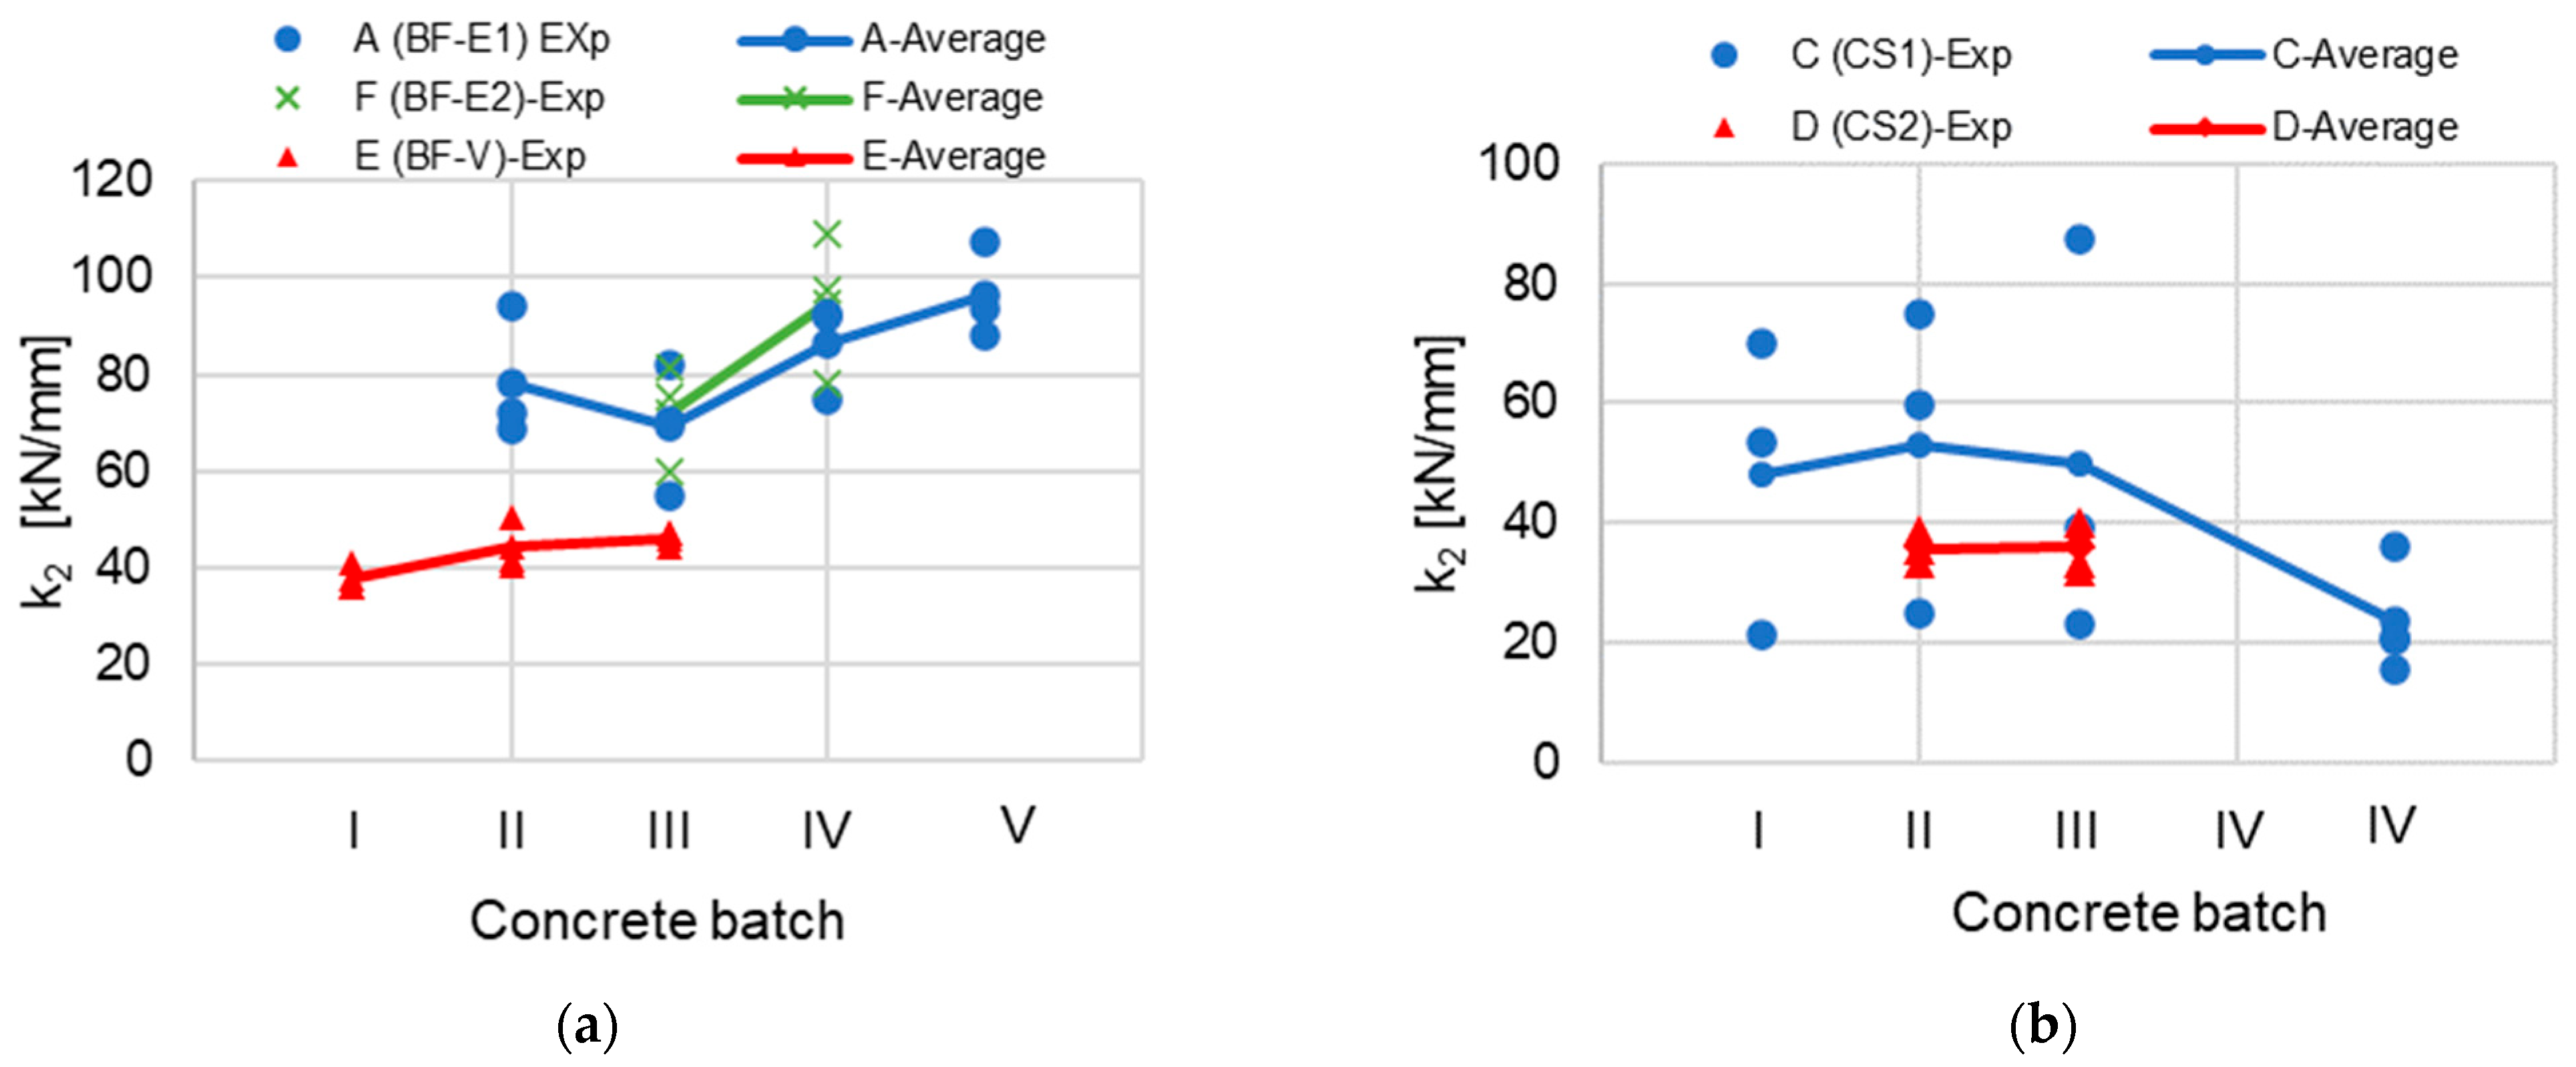
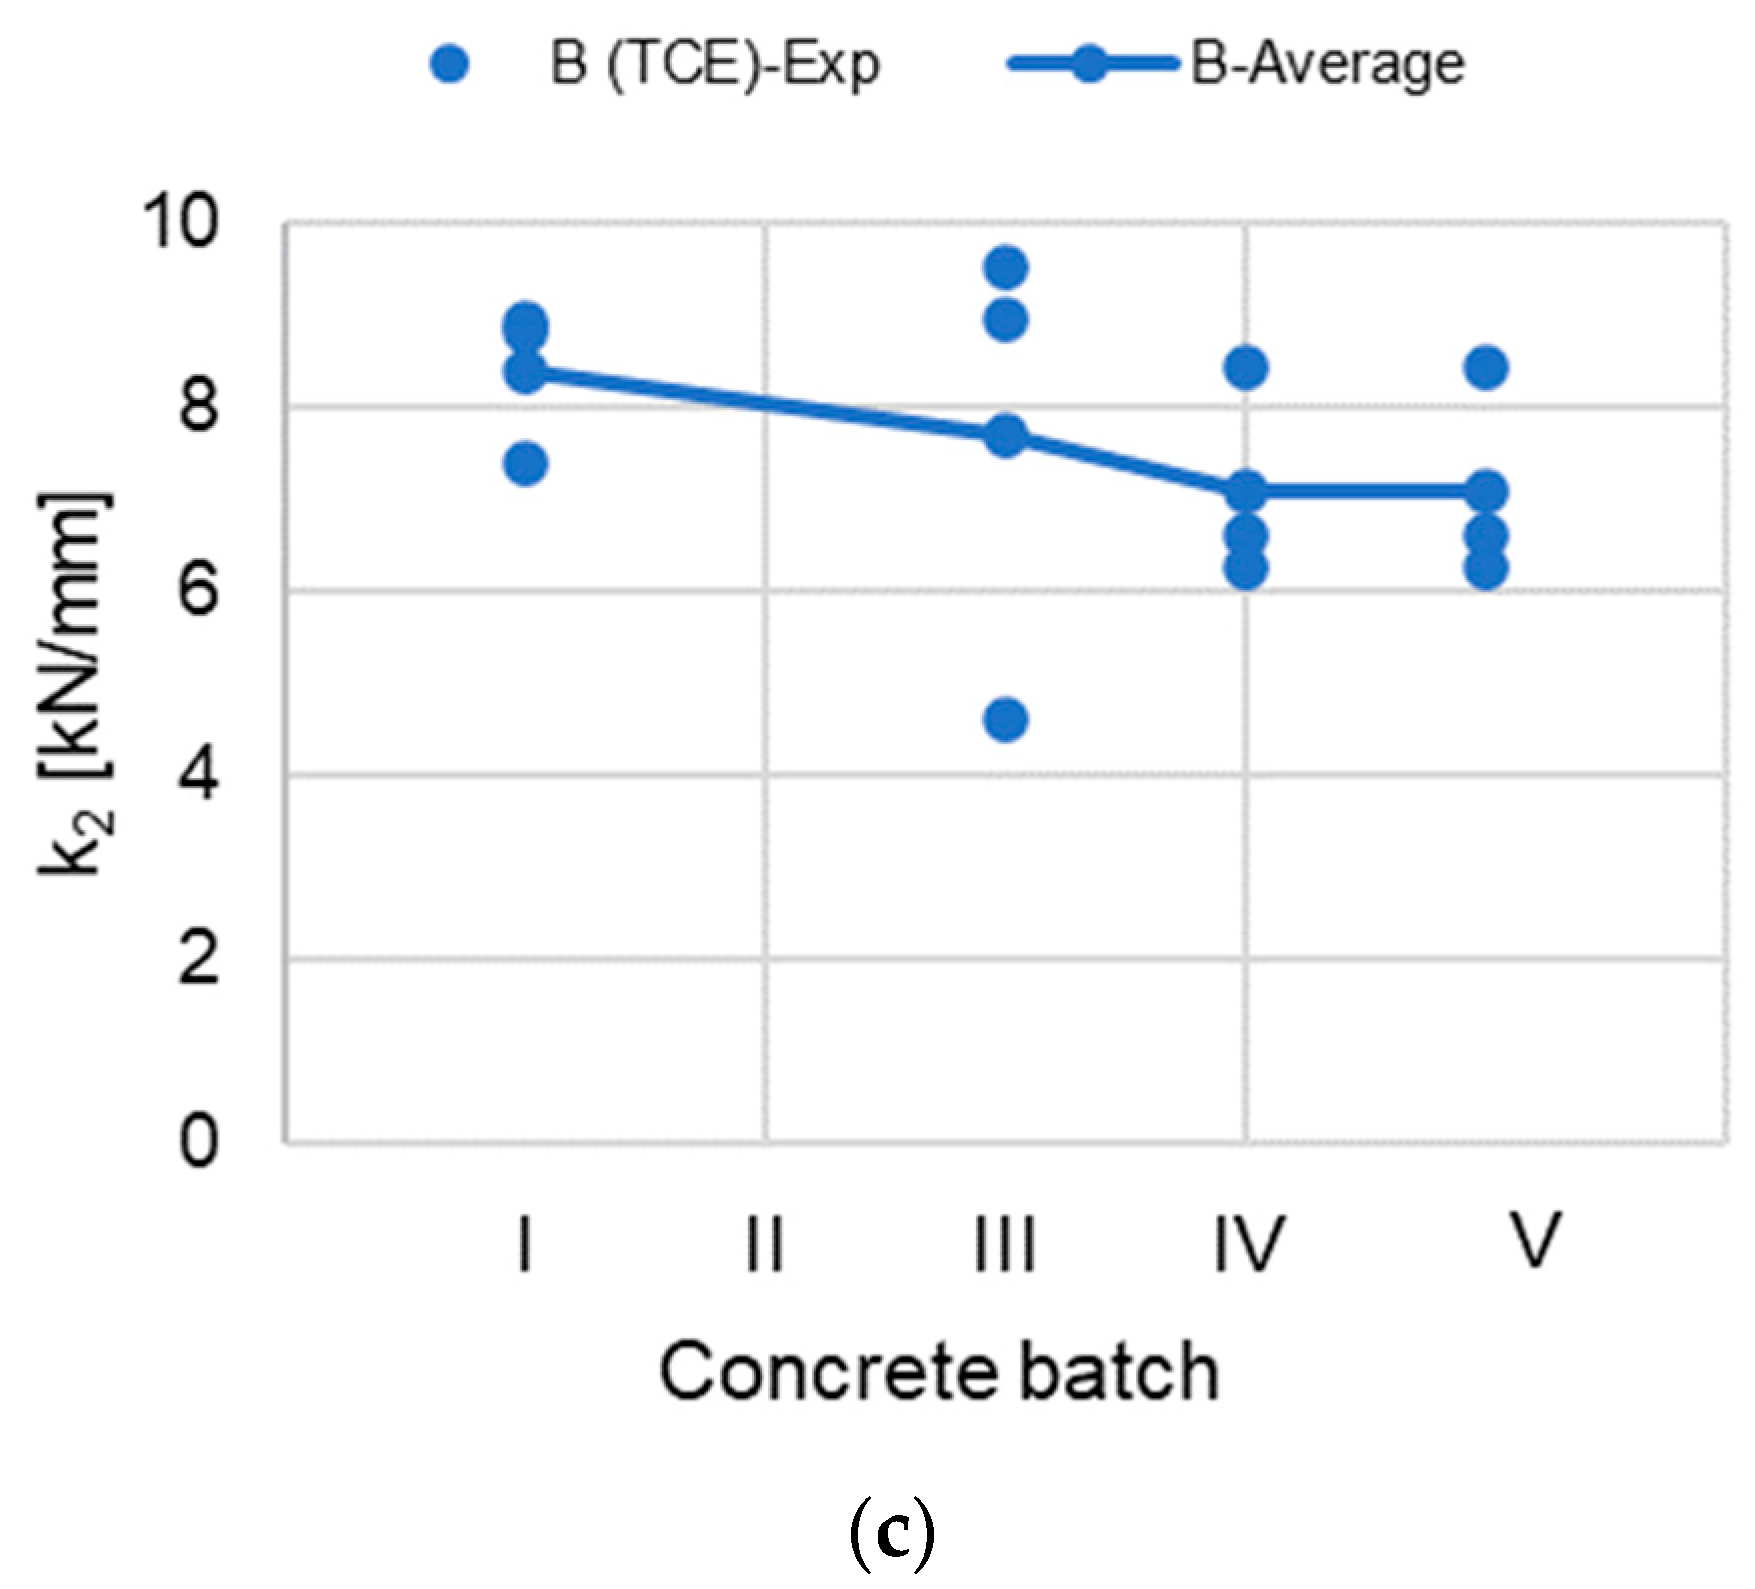
4.4.2. Secant Stiffness

The same analysis is performed for the secant stiffness k2 of each dataset. The results are shown in Figure 9. In general, although differences in the value of the secant stiffness k2 are observed among the different datasets, these could be considered as random variations rather than following a clear trend. This statement is also supported by the further analysis that is presented in Section 4.4.3.

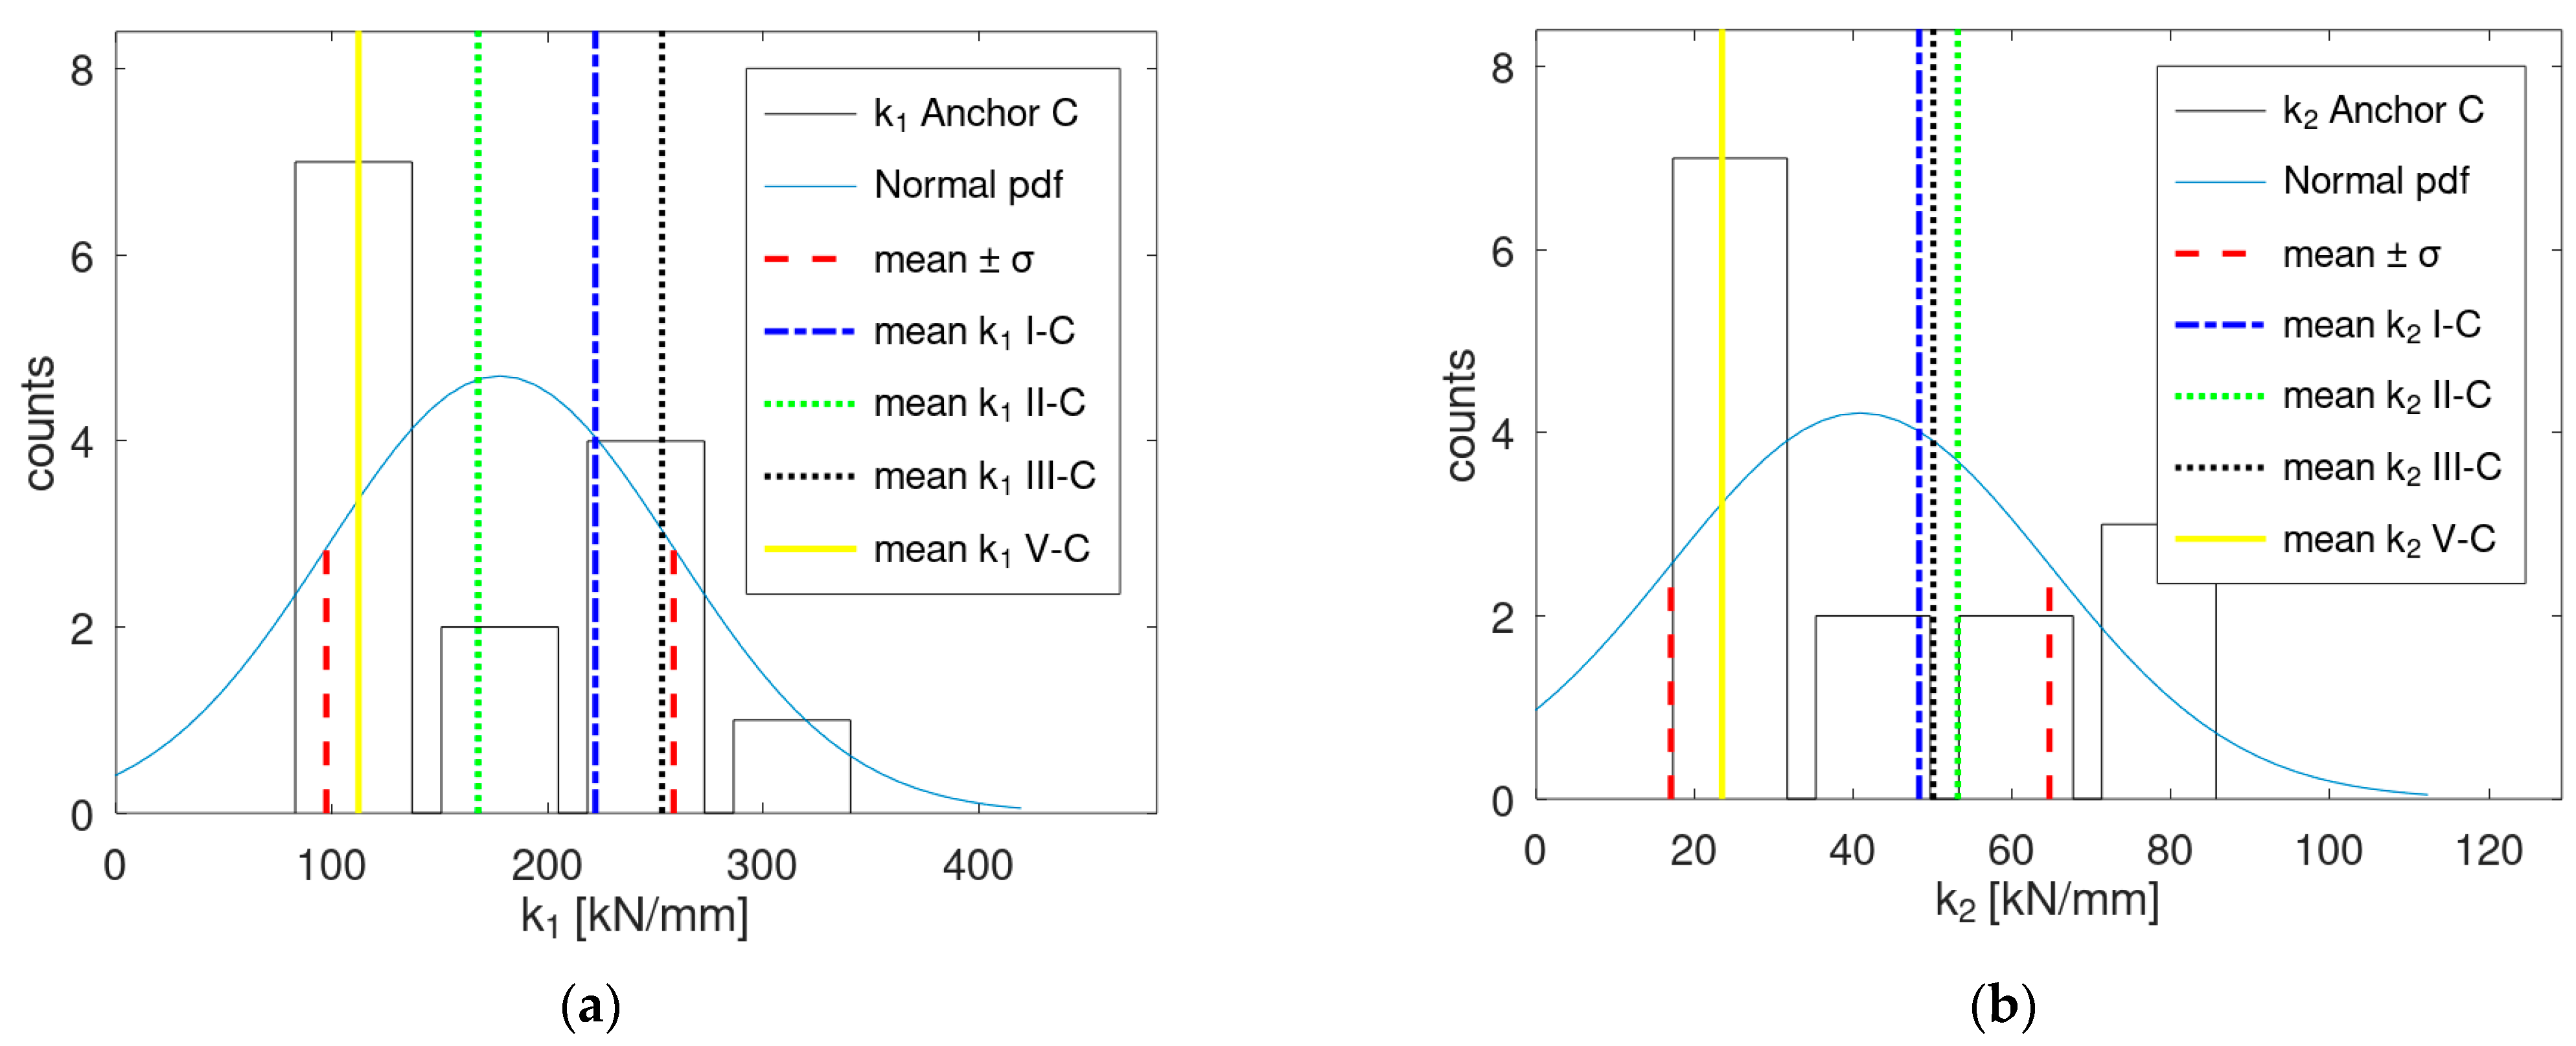
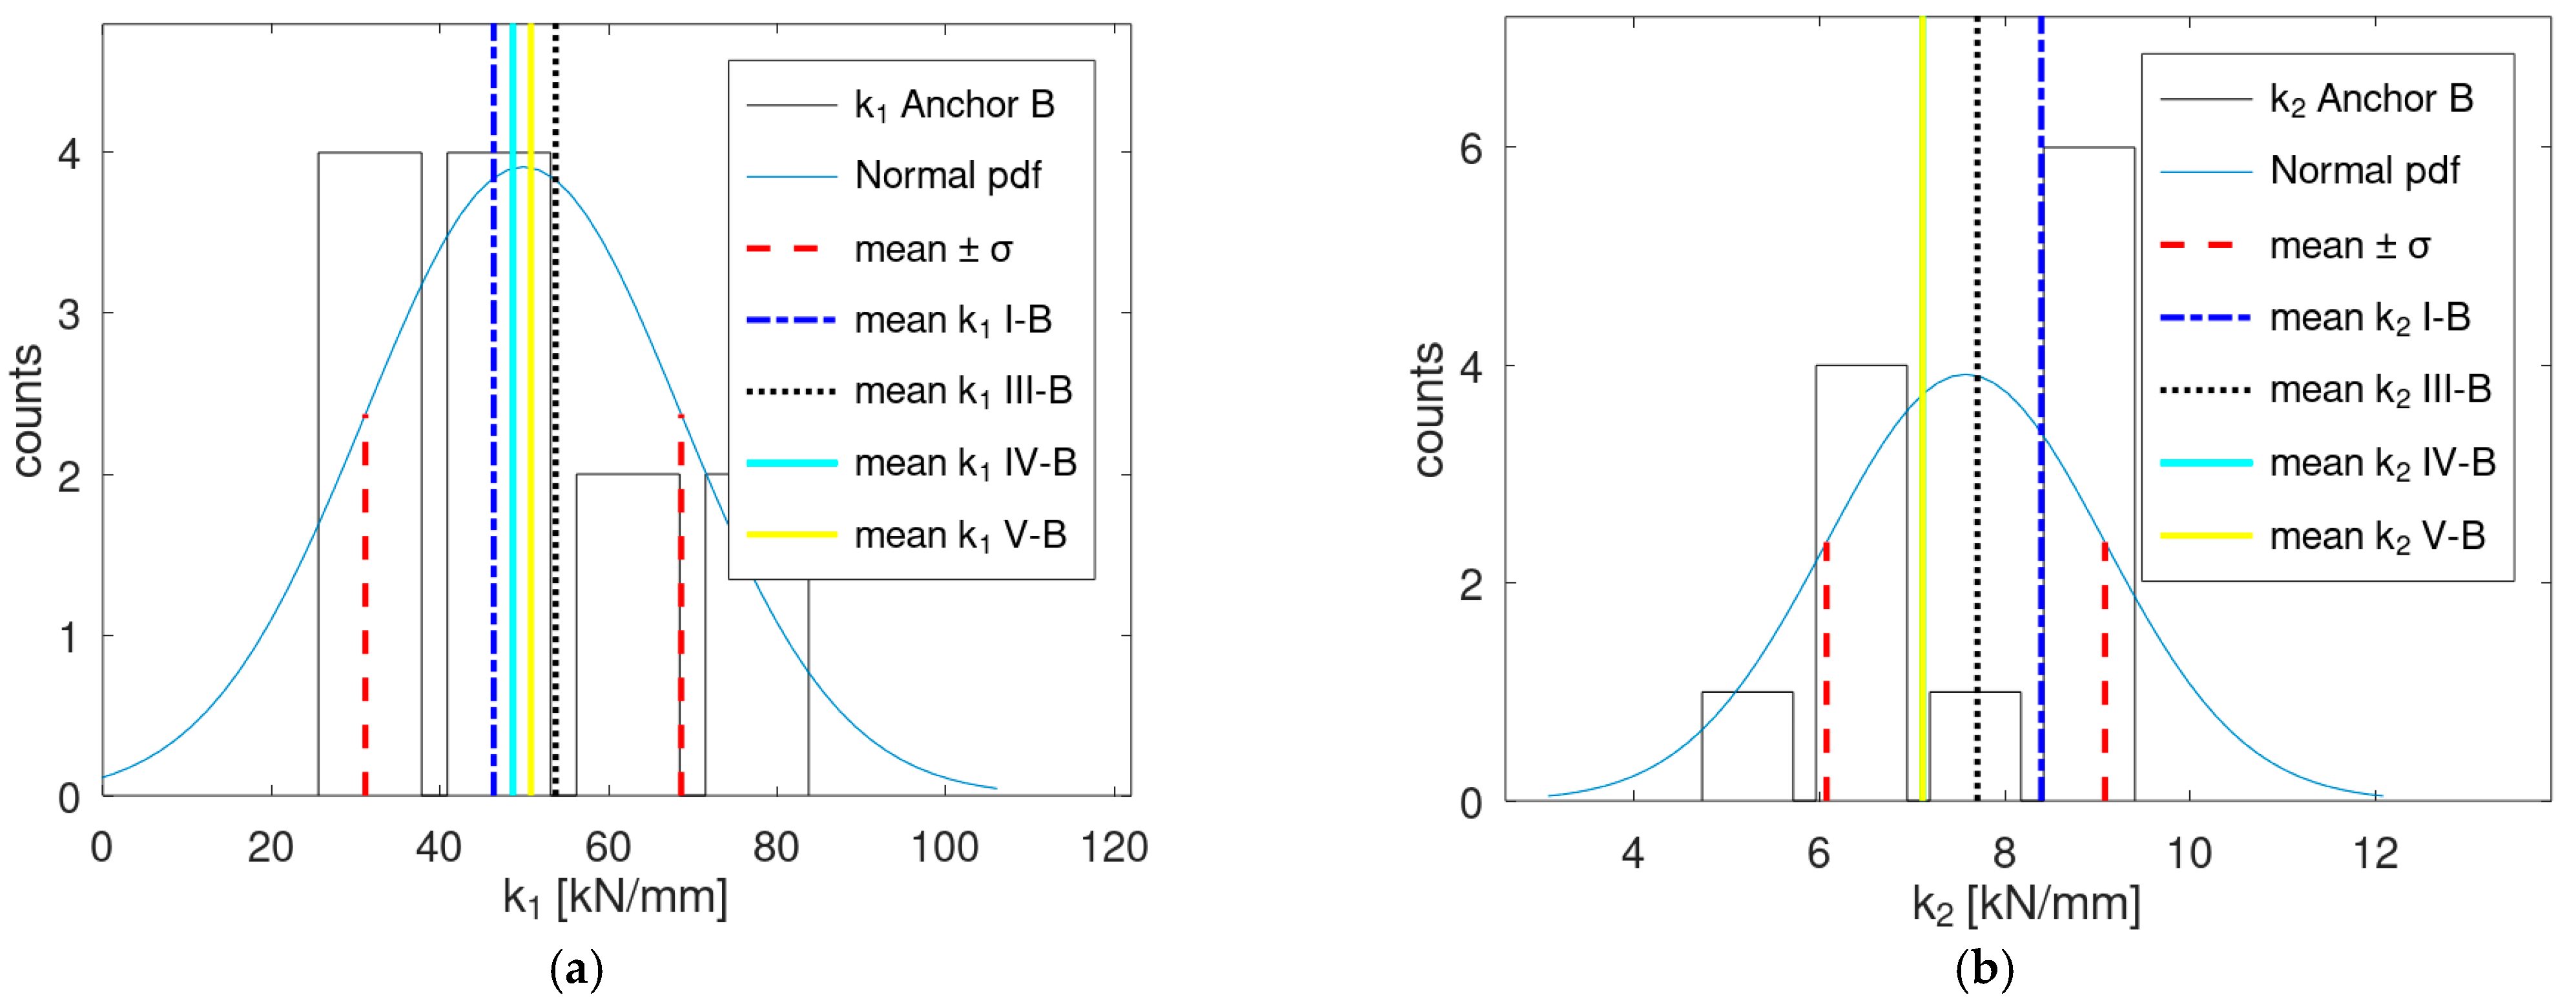
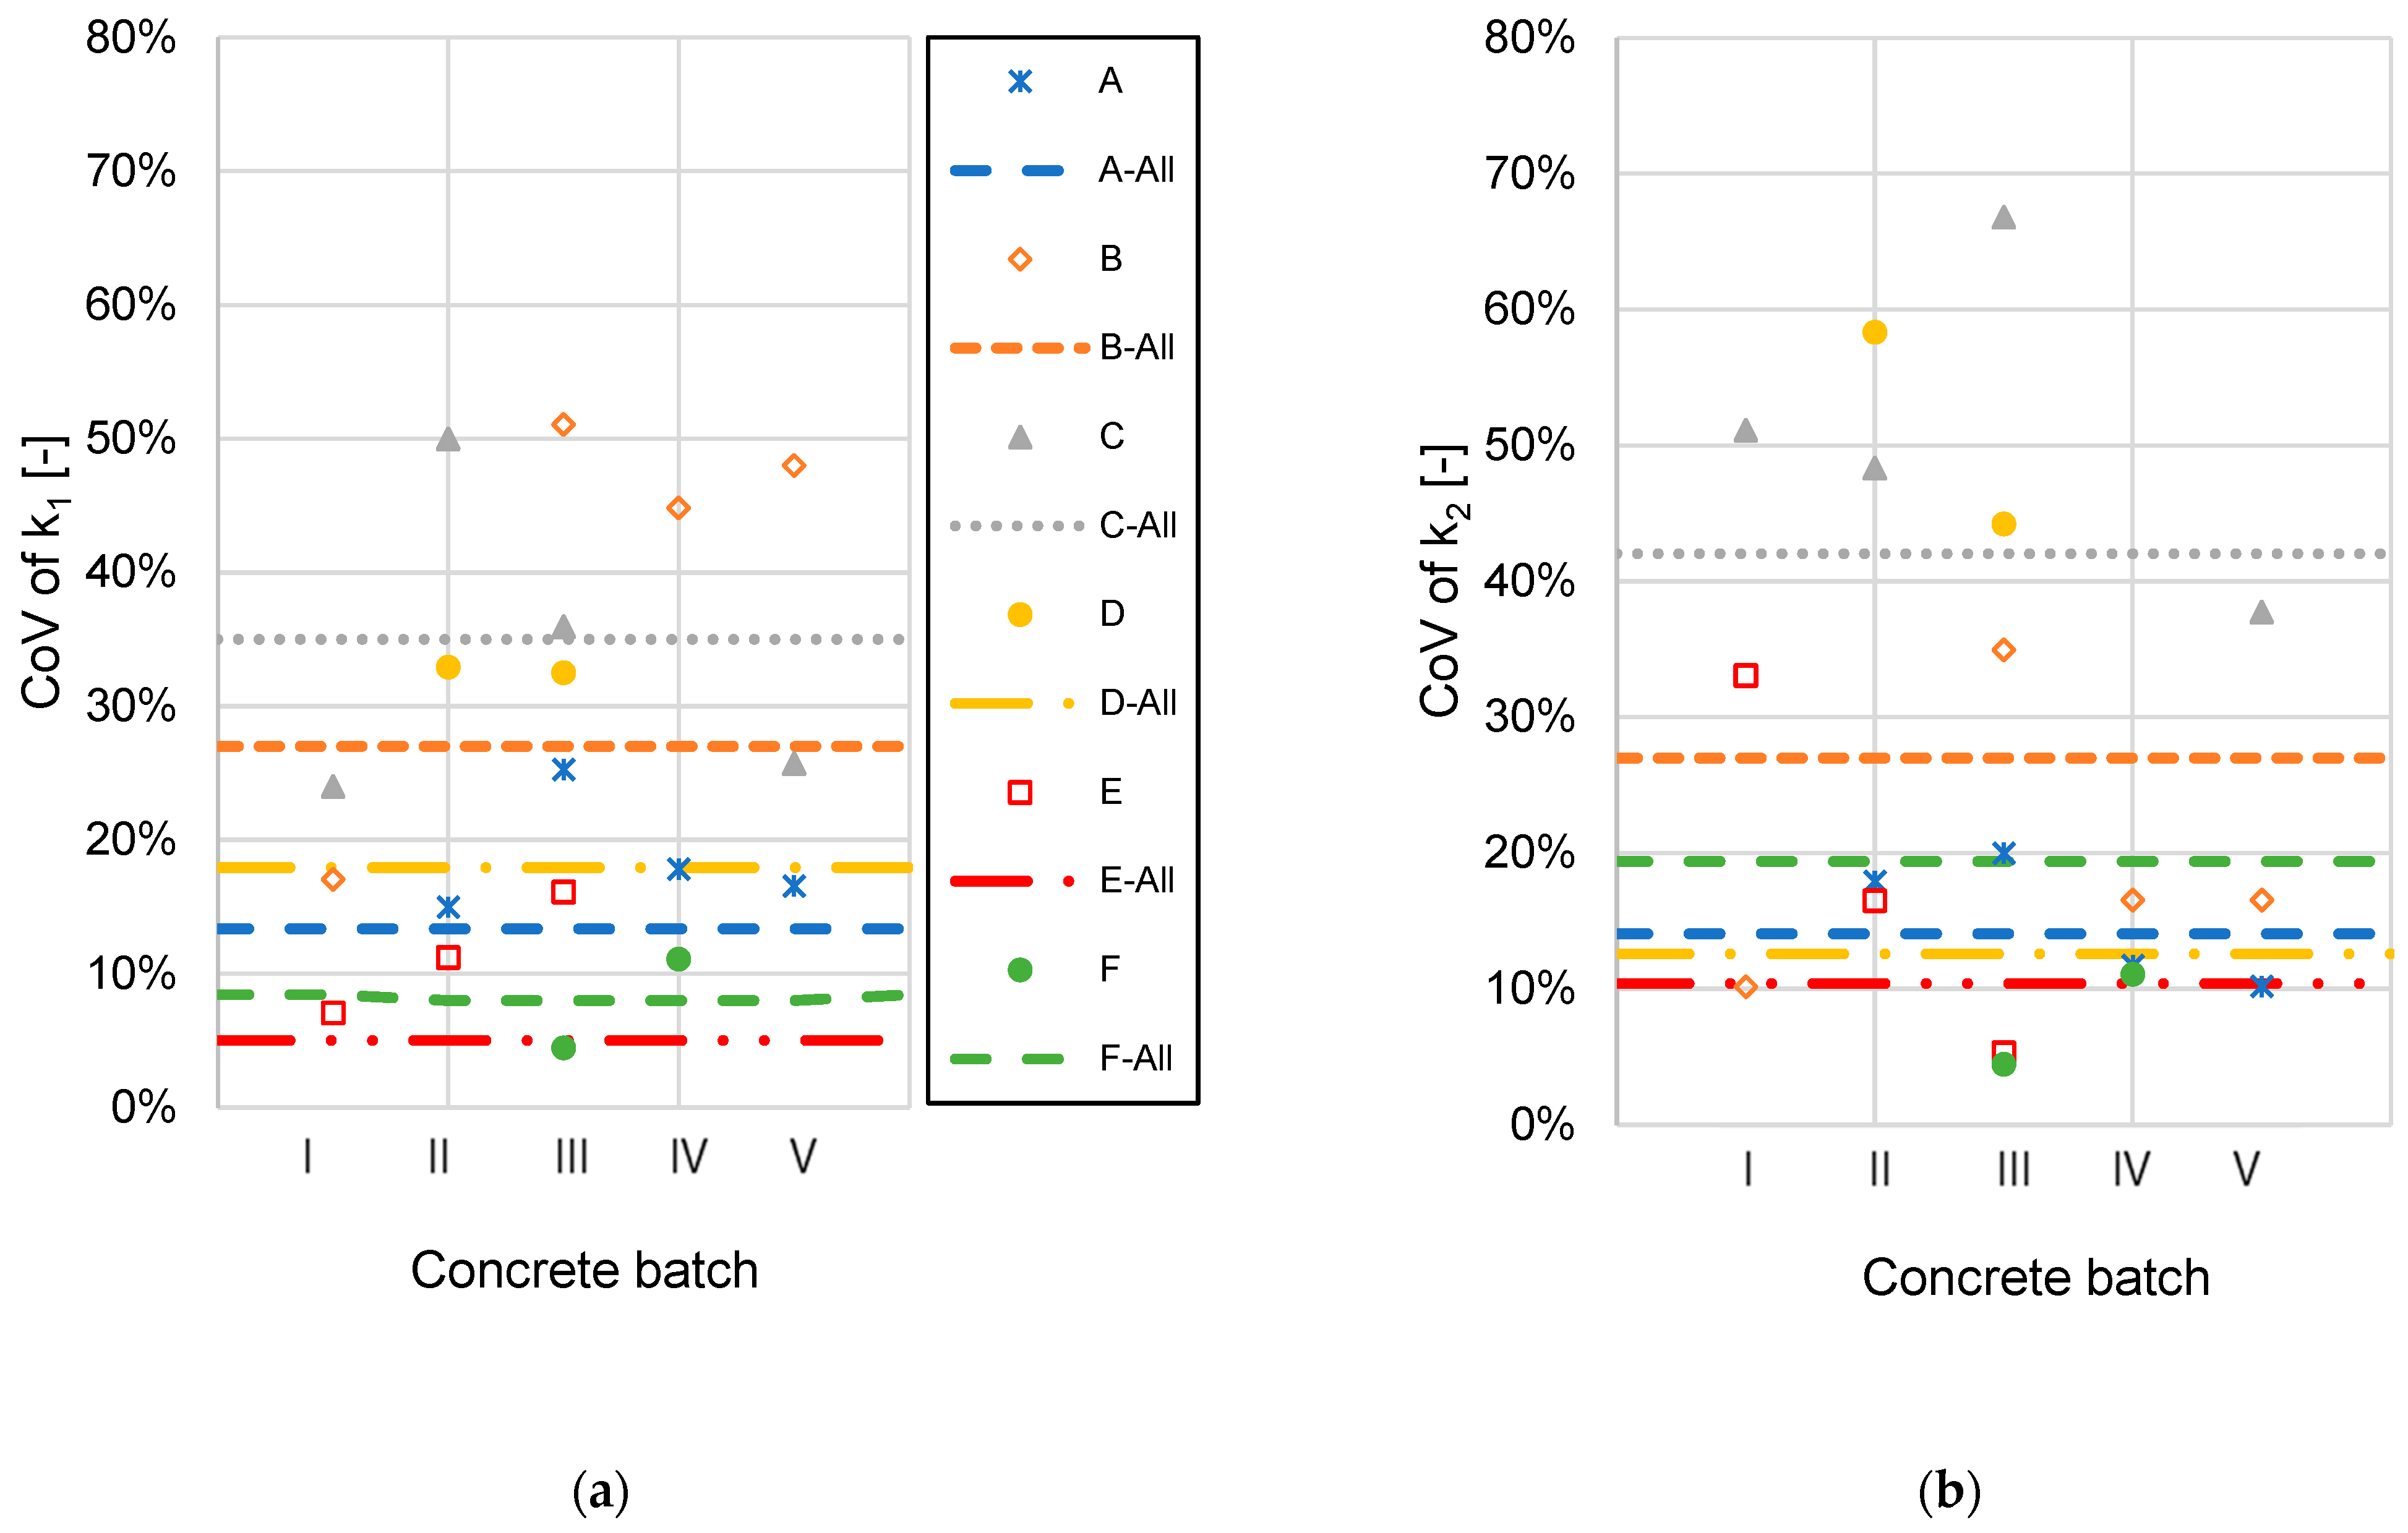
4.4.3. Statistical Comparisons

The sole comparison of both k1 and k2 values shows no significant influence of the concrete mix on the anchor stiffnesses. In this section, a statistical evaluation is performed in order to further support this finding. As a matter of fact, the mean values of k1 and k2 for each different concrete are compared to the distribution of the stiffness values of the extended dataset of each anchor regardless of the concrete mix.
Figure 10, Figure 11 and Figure 12 show the comparison of the individual k mean values for the different bonded anchor types installed in different concrete mixes with the statistics derived from all individual k1 and k2 values for each anchor type regardless of the concrete batch. For all different anchor types, the mean k1,2 values obtained from the tests in different concrete mixes are found to be inside the interval k ^ 1,2 ± σ , where k ^ 1,2   are the mean values of k1 or k2 calculated from all the different tests for each anchor type, and σ the corresponding standard deviation. That is expected since the total dataset comprises the individual datasets. Nevertheless, none of the individual dataset means are found to be outside the interval k ^ 1,2 ± σ , which represents 66% of the observations of a normal distribution. Thus, none of the individual means of both k1 and k2 can be considered as extreme values. Therefore, a constant mean stiffness k1 and k2 can be assumed for the given anchor types and geometries and for the different concrete types. Note that the datasets for each series contained enough points for a statistical analysis. The number of tests per series was between three and four repetitions.
Finally, the coefficient of variation of both k1 and k2 stiffnesses calculated on the individual datasets are compared to those calculated on the entire dataset of each anchor type.
Figure 13 shows the comparison of the coefficient of variation (CoV) of both k1 and k2 obtained from all different tests of each anchor type, illustrated as lines, with the individual coefficient of variation obtained from the test of each anchor in the different studied concretes, illustrated as marker points. For all different anchor types, the CoVs calculated on the entire datasets are comparable and mostly lower than those from the individual tests. Therefore, the mean values of initial and secant stiffness calculated on the entire dataset for each type of anchor can be considered as reliable statistical estimates.
Table 4 summarizes the mean values of k1 and k2 as well as the coefficient of variation (CoV) for the different post-installed anchor types.
The values of k1 and k2 for the bonded anchor with epoxy-based agent are consistent for the two different tested epoxy types. The vinyl ester product shows lower stiffness values compared to the epoxy type. For all tested products the COV is within acceptable range.
The expansion anchor shows the lowest stiffness values of the investigated anchor types.
For the concrete screws only the k2 value is found to be the same for the two different types. In general, both k1 and k2 have distinct ranges for the different anchor types. Note that for concrete screws the measured displacement values are rather small and the installation method and prestressing can have a significant influence on the evaluated stiffness values. Therefore, it is recommended to increase the number of tests per test series to, e.g., 5–10 repetitions. Additionally, the assessment of the initial stiffness for both tested concrete screw types showed that an assessment based on the displacement at 50% of the failure load gives rather high coefficients of variation in the different concrete mixes. If the stiffness values are determined based on a least squared fit, this scatter could be significantly reduced. Therefore, for concrete screws a least squared fit method is proposed to determine the initial stiffness.
The results of Table 4 can be considered as an assessment of the performed test program. It should not be seen as generalized recommendations for anchor types.

5. Conclusions

The present manuscript studies the influence of the different aggregates in the concrete mix design on the initial secant stiffness and the secant stiffness at ultimate load of different types of post-installed anchors for a concrete breakout failure. In general, an accurate displacement measurement is important if stiffness values are derived from load– displacement curves. In the performed tests, the assessed stiffness values were derived from load–displacement curves measured in a displacement-controlled test setup (servo-hydraulic). The displacements were measured with two separated displacement transducers that were fixed with a small distance to the centre of the anchor rods. The used test setup is in accordance with the requirements given in the corresponding European assessment Documents (EAD, [5,6,7]).
The following conclusions can be derived from the analysis:
  • In general, both k1 and k2 stiffness values showed no major sensitivity to the concrete mix.
  • The scatter of both k1 and k2 stiffness values for each type of anchor in the individual test series is similar or larger than the scatter of k1 and k2 values of each type of anchor regardless of the aggregate type in the concrete mix.
  • The mean values of both k1 and k2 stiffness values for each type of anchor in the individual test series is always inside the interval of the mean values plus minus 1 standard deviation.
  • The mean values of both k1 and k2 stiffnesses are in different ranges for the different types of anchors,
  • The initial stiffness calculated from the LSE fit reduces the scatter of the values in comparison to the initial stiffness calculated as a ratio N 50 δ 50 for both types of concrete screws.
Thus, it can be concluded that the influence of aggregate type on initial and secant stiffness in an otherwise comparable concrete mix can be neglected. The insights gained by the present study could serve to the utilization of assessment methods based on tests performed on specific concrete classes regardless the mineralogy of the aggregates. Moreover, that allows the characterization of the anchors in terms of stiffnesses on standard tensile test results. Then, the characterized stiffness can be used for a displacement-based design, which can be considered as a sustainable design approach. Furthermore, it is expected that each anchor type should have a certain range of initial and secant stiffness values. Therefore, a reliable assessment should focus only on the type of the anchor avoiding additional tests on concrete mixes with different aggregates. Thus, the anchor stiffness assessment in combination with a displacement-based anchor design method could be considered as reliable and sustainable approaches. Finally, since the scatter is usually high it is recommended that the stiffnesses are characterized for each individual anchor.

Author Contributions

Conceptualization, T.P. and B.B.; methodology, I.B., B.B. and T.P.; Testing design and performance, B.B.; Analysis, I.B. and B.B; Writing—original draft preparation, I.B.; Writing—review and editing, B.B. and T.P. All authors have read and agreed to the published version of the manuscript.

Funding

This research received no external funding.

Institutional Review Board Statement

Not applicable.

Informed Consent Statement

Not applicable.

Data Availability Statement

Data are contained within the article.

Conflicts of Interest

The authors declare no conflict of interest.

References

  1. Eligehausen, R.; Mallée, R.; Silva, J. Anchorage in Concrete Construction; Ernst & Sohn: Berlin, Germany, 2006. [Google Scholar]
  2. Cook, R.A.; Kunz, J.; Fuchs, W.; Konz, R. Behavior and design of adhesive bonded anchors. ACI Struct. J. 2006, 103, 822–831. [Google Scholar]
  3. Retrofitting of Concrete Structures by Externally Bonded FRPS, with Emphasis on Seismic Applications; Fib Bulletin no. 70; Fédération Internationale du Béton: Lausanne, Switzerland, 2006.
  4. Cook, R.; Doerr, G.; Klingner, R. Bond stress model for design of adhesive anchors. ACI Struct. J. 1993, 90, 514–524. [Google Scholar]
  5. EAD 330232-01-0601; Mechanical Fasteners for Use in Concrete. EOTA: Brussels, Belgium,, 2019.
  6. EAD 330232-01-0601-v01; Torque-Controlled Expansion Fasteners for Use in Concrete with Variable Working Life up to 50 Years. EOTA: Brussels, Belgium, 2021.
  7. EAD 330499-01-601; Bonded Fasteners for Use in Concrete. EOTA: Brussels, Belgium, 2018.
  8. Fuchs, W.; Eligenhausen, R.; Breen, J. Concrete Capacity Design (CCD) Approach for Fastening to Concrete. ACI Struct. J. 1995, 92, 73–94. [Google Scholar]
  9. Bloem, D.L.; Gaynor, R.D. Effects of Aggregate Properties on Strength of Concrete. J. Proc. 1963, 60, 1429–1456. [Google Scholar]
  10. Vilane, B.; Sabelo, N. The Effect of Aggregate Size on the Compressive Strength of Concrete. J. Agric. Sci. Eng. 2016, 6, 66–69. [Google Scholar]
  11. Özturan, T.; Cengizhan, Ç. Effect of coarse aggregate type on mechanical properties of concretes with different strengths. Cem. Concr. Res. 1997, 27, 165–170. [Google Scholar] [CrossRef]
  12. Naderi, M.; Kaboudan, A. Experimental study of the effect of aggregate type on concrete strength and permeability. J. Build. Eng. 2021, 37, 101928. [Google Scholar] [CrossRef]
  13. Marcon, M.; Ninčević, K.; Boumakis, I.; Czernuschka, L.-M.; Wan-Wendner, R. Aggregate effect on the concrete cone capacity of an undercut anchor under quasi-static tensile load. Materials 2018, 11, 711. [Google Scholar] [CrossRef]
  14. Ninčević, K.; Boumakis, I.; Marcon, M.; Wan-Wendner, R. Aggregate effect on concrete cone capacity. Eng. Struct. 2019, 191, 358–369. [Google Scholar] [CrossRef]
  15. Hordijk, D.; Van der Pluijm, R. Behaviour of fasteners in concrete with coarse recycled concrete and masonry aggregates. In Proceedings of the PRO 21: International RILEM Symposium on Connections between Steel and Concrete, Stuttgart, Germany, 10–12 September 2001. [Google Scholar]
  16. Bokor, B.; Sharma, A.; Hofmann, J. Spring Modelling Approach for Evaluation and Design of Tension Loaded Anchor Groups in case of Concrete Cone Failure. Eng. Struct. 2019, 197, 109414. [Google Scholar] [CrossRef]
  17. Bokor, B. Nonlinear Spring Modeling Approach for the Evaluation of Anchor Groups. Ph.D. Thesis, Institute of Construction Materials, Univeristy of Stuttgart, Stuttgart, Germany, 2021. [Google Scholar]
  18. EN 1992-4:2018; Eurocode 2—Design of Concrete Structures—Part 4: Design of Fastenings for Use in Concrete. European Committee for Standardization: Brussels, Belgium, 2018.
  19. Design of Anchorages in Concrete: Part I–V; Fib Bulletin no. 58; Fédération Internationale du Béton: Lausanne, Switzerland, 2011.
  20. ACI Committee 318; Building Code Requirements for Structural Concrete (ACI 318-19) and Commentary (ACI 318R-19). American Concrete Institute: Farmington Hills, MI, USA, 2019.
  21. Sharma, A. Urgent Need for a Performance-Based Approach for Seismic Assessment and Design of fastenings used in Structural Applications. Adv. Civ. Eng. Technol. 2019, 3, 285–287. [Google Scholar] [CrossRef]
  22. EN 206:2021-06; Concrete—Specification, Performance, Production and Conformity. European Committee for Standardization: Brussels, Belgium, 2021.
  23. EN 12390-1:2012-12; Testing Hardened Concrete—Part 1: Shape, Dimensions and Other Requirements for Specimens and Moulds. European Committee for Standardization: Brussels, Belgium, 2019.
  24. EN 12390-5:2019-10; Testing Hardened Concrete—Part 5: Flexural Strength of Test Specimens. European Committee for Standardization: Brussels, Belgium, 2019.
  25. EN 12390-6:2010-09; Testing Hardened Concrete—Part 6: Tensile Splitting Strength of Test Specimens. European Committee for Standardization: Brussels, Belgium, 2010.
  26. EN-1992-1-1; Eurocode 2: Design of concrete structures—Part 1–1: General rules and rules for buildings. European Committee for Standardization: Brussels, Belgium, 2009.
  27. Karihaloo, B.L. Fracture Mechanics and Structural Concrete; Pearson Education Limited: Harlow, UK, 1995. [Google Scholar]
  28. Piasta, W.; Góra, J.; Budzynski, W. Stress-strain relationships and modulus of elasticity of rocks and of ordinary and high performance concretes. Constr. Build. Mater. 2017, 153, 728–739. [Google Scholar] [CrossRef]
  29. Aitcin, P.C.; Mehta, P.K. Effect of Coarse Aggregate Characteristics on Mechanical Properties of High-Strength Concrete. ACI Mater. J. 1990, 87, 103–107. [Google Scholar]
  30. NIST. Influence of Aggregate Characteristics on Concrete Performance; NIST Technical Note 1963; National Institute of Standards and Technology: Gaithersburg, MD, USA, 2017.
  31. Dehghan, A.; Maher, M.; Navarra, M. The Effects of Aggregate Properties on Concrete Mix Design and Behaviour. In Proceedings of the Canadian Society of Civil Engineering Annual Conference 2021, CSCE 2021, Lecture Notes in Civil Engineering, Singapore, 26–29 May 2021. [Google Scholar]
  32. Kılıç, A.; Atiş, C.; Teymen, A.; Karahan, O.; Özcan, F.; Bilim, C.; Özdemir, M. The influence of aggregate type on the strength and abrasion resistance of high strength concrete. Cem. Concr. Compos. 2008, 30, 290–296. [Google Scholar] [CrossRef]
  33. Karmokar, T.; Mohyeddin, A.; Paraskeva, J.L.U.T. Concrete cone failure of single cast-in anchors under tensile loading—A literature review. Eng. Struct. 2021, 243, 112615. [Google Scholar] [CrossRef]
  34. Spyridis, P.; Mellios, N. Tensile Performance of Headed Anchors in Steel Fiber Reinforced and Conventional Concrete in Uncracked and Cracked State. Materials 2022, 15, 1886. [Google Scholar] [CrossRef]
  35. Cattaneo; Muciaccia, G. Adhesive anchors in high performance concrete. Mater. Struct. 2016, 49, 2689–2700. [Google Scholar] [CrossRef]
  36. Zhang, Y.; Chen, Z.; Jiang, R. Tensile behavior and failure modes of expansion anchors in High-Performance Steel Fiber Reinforced Concrete (HPSFRC). Constr. Build. Mater. 2023, 408, 133693. [Google Scholar] [CrossRef]
Figure 2. Concrete break-out of the different post-installed fasteners (a) BFE-1, (b) TCE, (c) CS1, (d) CS2, (e) BFV, and (f) BFE-2, installed in different concretes.
Sustainability 15 16855 g002aSustainability 15 16855 g002b
Figure 3. Load–displacement curves of the different types of anchors and concrete batches: (a) Bonded Anchor—Epoxy-based type 1, (b) Expansion Anchor, (c) Concrete Screw—type 1, (d) Concrete Screw—type 2, (e) Bonded Anchor—Vinylester-based, and (f) Bonded Anchor—Epoxy-based type 2.
Sustainability 15 16855 g003
Figure 4. Calculation of secant stiffnesses considered in the analysis.
Sustainability 15 16855 g004
Figure 5. Influence of concrete mix on the ultimate load vs. (a) concrete batch and (b) anchor type.
Sustainability 15 16855 g005
Figure 6. Initial stiffness k1 vs different concrete mixes for (a) bonded anchors, (b) concrete screws, and (c) torque-controlled expansion anchors.
Sustainability 15 16855 g006aSustainability 15 16855 g006b
Figure 7. Initial stiffness comparison with the two different methods of calculation for all different anchor types.
Sustainability 15 16855 g007
Figure 8. Initial stiffness k1 calculated with the LSE method for the two different types of concrete screws: (a) C—type 1 and (b) D—type 2 vs. the different concrete mixes.
Sustainability 15 16855 g008
Figure 9. Secant stiffness k2 vs different concrete mixes for (a) bonded anchors, (b) concrete screws, and (c) torque-controlled expansion anchors.
Sustainability 15 16855 g009aSustainability 15 16855 g009b
Figure 10. Comparison of the individual k1 and k2 means for each concrete batch with the distribution of all k1 and k2 values for the bonded fasteners: (a,b) Bonded Epoxy type 1, (c,d) Bonded Epoxy type 2, and (e,f) Bonded Vinylester.
Sustainability 15 16855 g010aSustainability 15 16855 g010b
Figure 11. Comparison of the individual k1 and k2 means for each concrete batch with the distribution of all k1 and k2 values for the concrete screws: (a,b) concrete screw type 1 and (c,d) concrete screw type 2.
Sustainability 15 16855 g011aSustainability 15 16855 g011b
Figure 12. Comparison of the individual k1 and k2 means for each concrete batch with the distribution of all k1 and k2 values for the torque control expansion anchor: (a) the comparison of k1 and (b) the comparison of k2.
Sustainability 15 16855 g012
Figure 13. Comparison of the total CoV for each anchor type with the individual CoVs from the different concrete mixes for (a) initial stiffness k1 and (b) secant stiffness k2.
Sustainability 15 16855 g013
Table 1. Concrete mix designs.
BatchUnitI.
GR Max16
II.
GR Max 32
III.
BA
IV.
LS
V.
SFRC
wkg/m3185185185185197.6
Cement type-32.5R32.5R32.5R32.5R32.5R
Cement contentkg/m3265265265265318
Aggregate type-GravelGravelBasaltLimestoneGravel
Aggregate shape-RoundRoundBrokenBrokenRound
Steel fibre contentkg/m3----20
a 0–2 mmkg/m3724609724724844
a 2–8 mmkg/m3471377471471993
a 8–16 mmkg/m3701436701701-
a 16–32 048400-
dmaxmm163216168
akg/m319121938191219121837
w/c-0.700.700.700.700.62
a/c-7.27.37.27.25.8
Table 2. Concrete material properties.
BatchUnitI.II.III.IV.V.
Measured mean concrete cube compressive strength, fc,cubeN/mm228.439.434.236.253.8
Mean concrete cylinder compressive strength, fc,cylinder (converted EN 1992-1-1 [26])N/mm222.731.527.429.043.0
Measured mean tensile strength, 4-point bending, fct,flN/mm23.23.53.43.3-
Measured mean tensile strength, cylinder splitting, fctN/mm22.73.22.43.1-
Tensile strength of concrete (calculated based on fc, EN 1992-1-1 [26])N/mm22.43.02.82.93.7
Modulus of elasticity (calculated based on fc, ACI 318-14 [20])GPa22.5526.5624.7425.4531.03
Fracture energy
(calculated based on fc, [27])
Nmm/mm262.378.471.073.997.5
Table 3. Overview of the tested fasteners.
Anchor IdAnchor TypeNominal Diameter [mm]Embedment Depth [mm]
A (BF-E1)Bonded-epoxy-based type 11670
B (TC-E)Torque-controlled expansion1670
C (CS1)Concrete screw type 11470
D (CS2)Concrete screw type 21470
E (BF-V)Bonded-vinyl ester-based1670
F (BF-E2)Bonded-epoxy-based type 21670
Table 4. Stiffness values based on the analysis for the different post-installed anchors.
AnchorDiameter
[mm]
Concrete Statek1
[kN/mm]
CoV
[%]
k2
[kN/mm]
CoV
[%]
Bonded—Epoxy
type 1
16uncracked135208218
Bonded—Epoxy
type 2
16uncracked139108321
Bonded—Vinyl Ester16uncracked96125420
Concrete screws
type 1 *
14uncracked178454158
Concrete screws
type 2 *
14uncracked120344148
Expansion16uncracked5038820
*: Evaluation based on LSE.
Disclaimer/Publisher’s Note: The statements, opinions and data contained in all publications are solely those of the individual author(s) and contributor(s) and not of MDPI and/or the editor(s). MDPI and/or the editor(s) disclaim responsibility for any injury to people or property resulting from any ideas, methods, instructions or products referred to in the content.

