
Carbon Storage Patterns and Landscape Sustainability in Northeast Portugal: A Digital Mapping Approach
 ,
,  ,
,  ,
,
Abstract
:1. Introduction
2. Materials and Methods
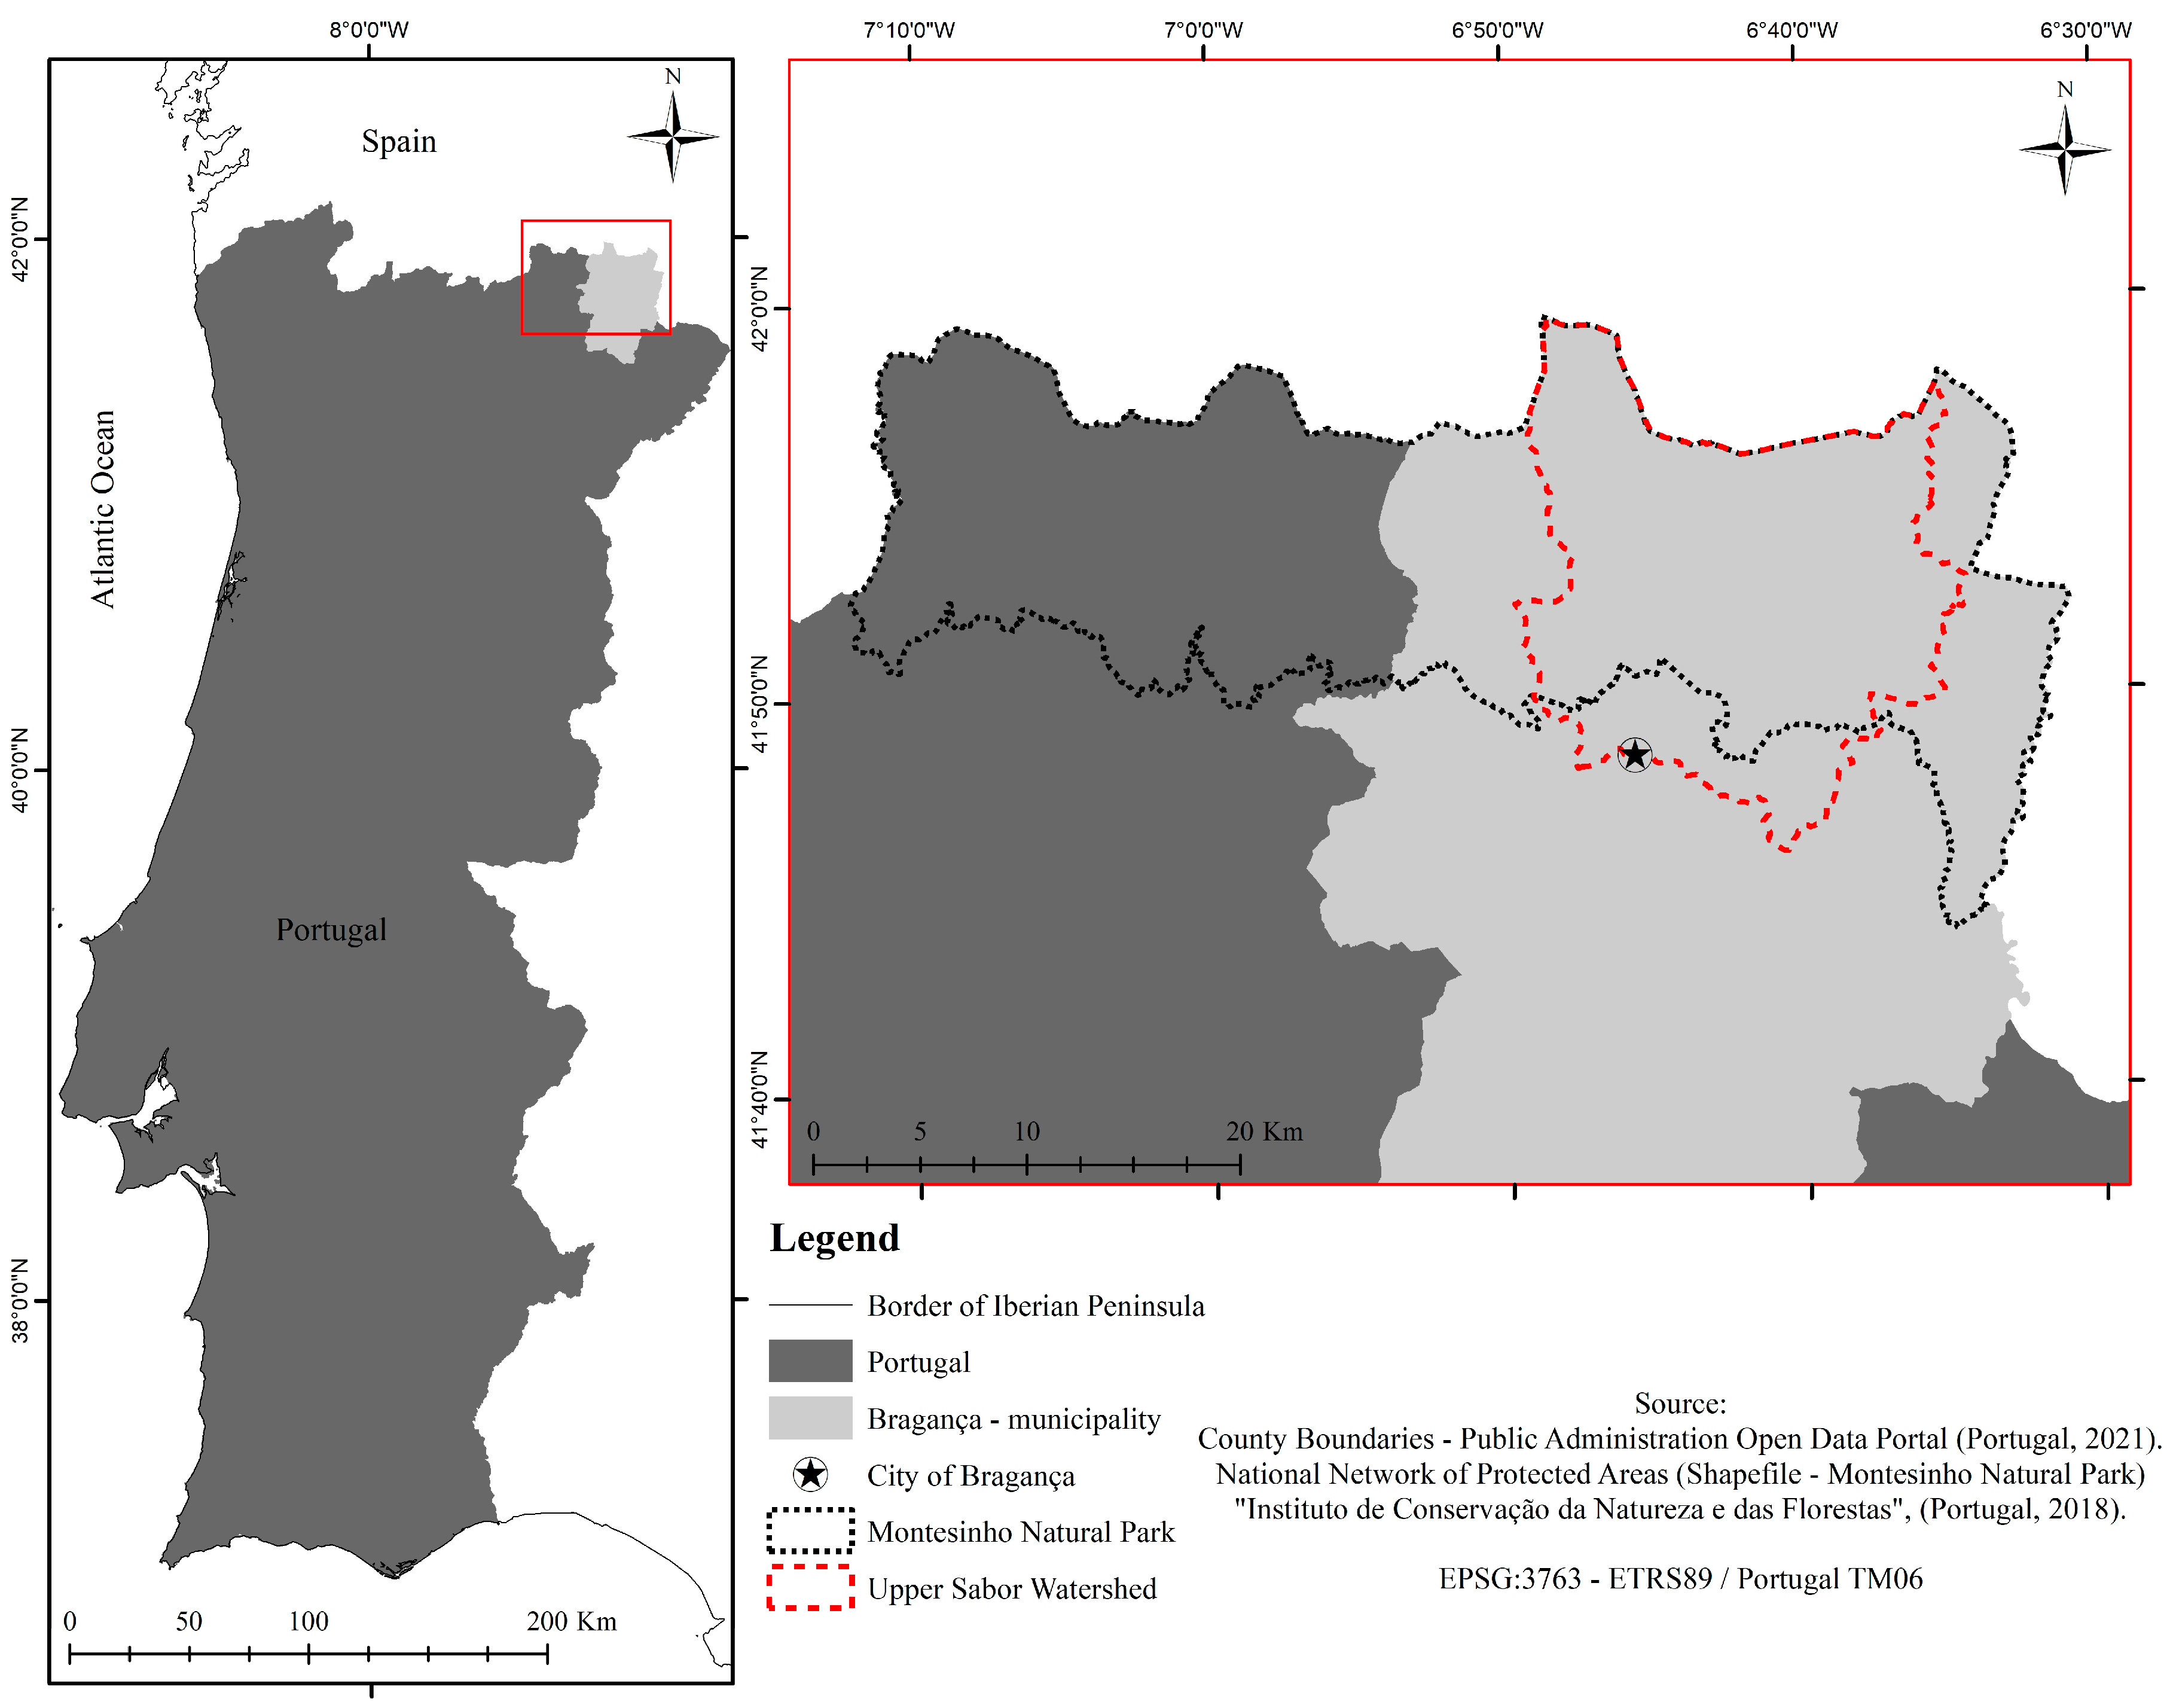
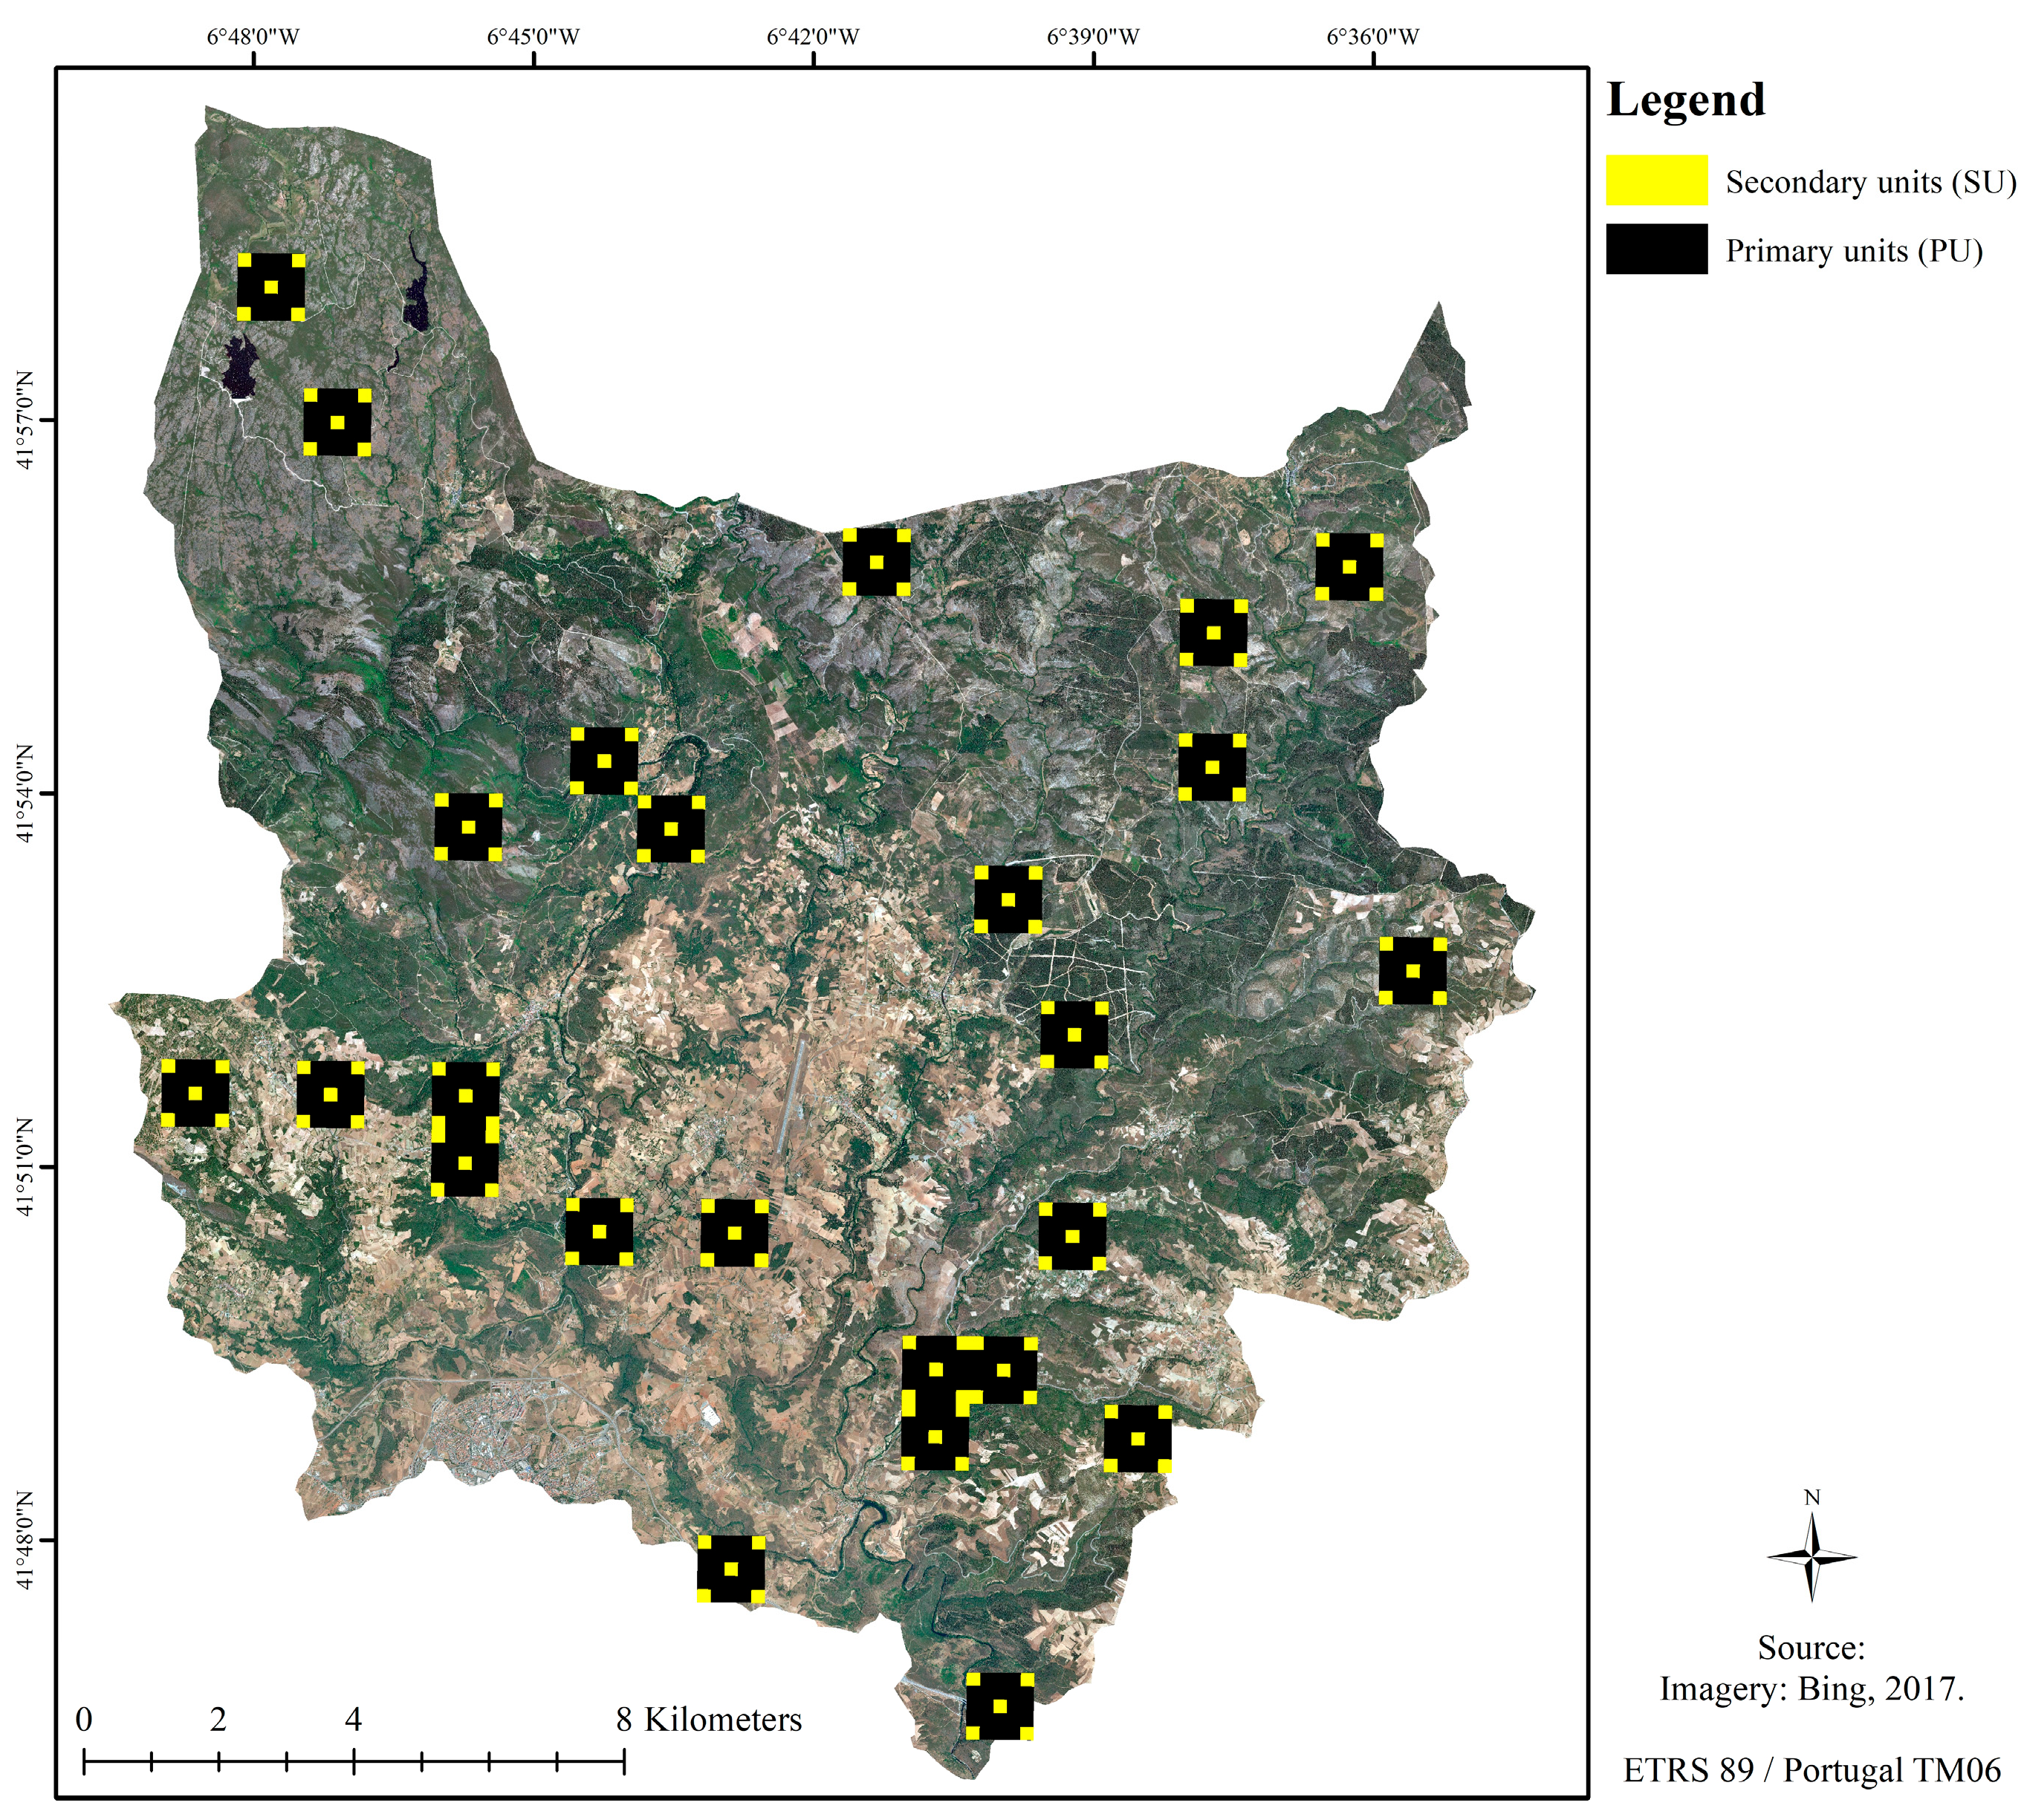
2.1. Study Area
2.2. Soil Sampling
2.3. Soil Carbon Quantification
2.4. Statistical Analysis
2.4.1. Basic Statistics
2.4.2. Regression Analysis
Independent Variables
Regression Models and Validation
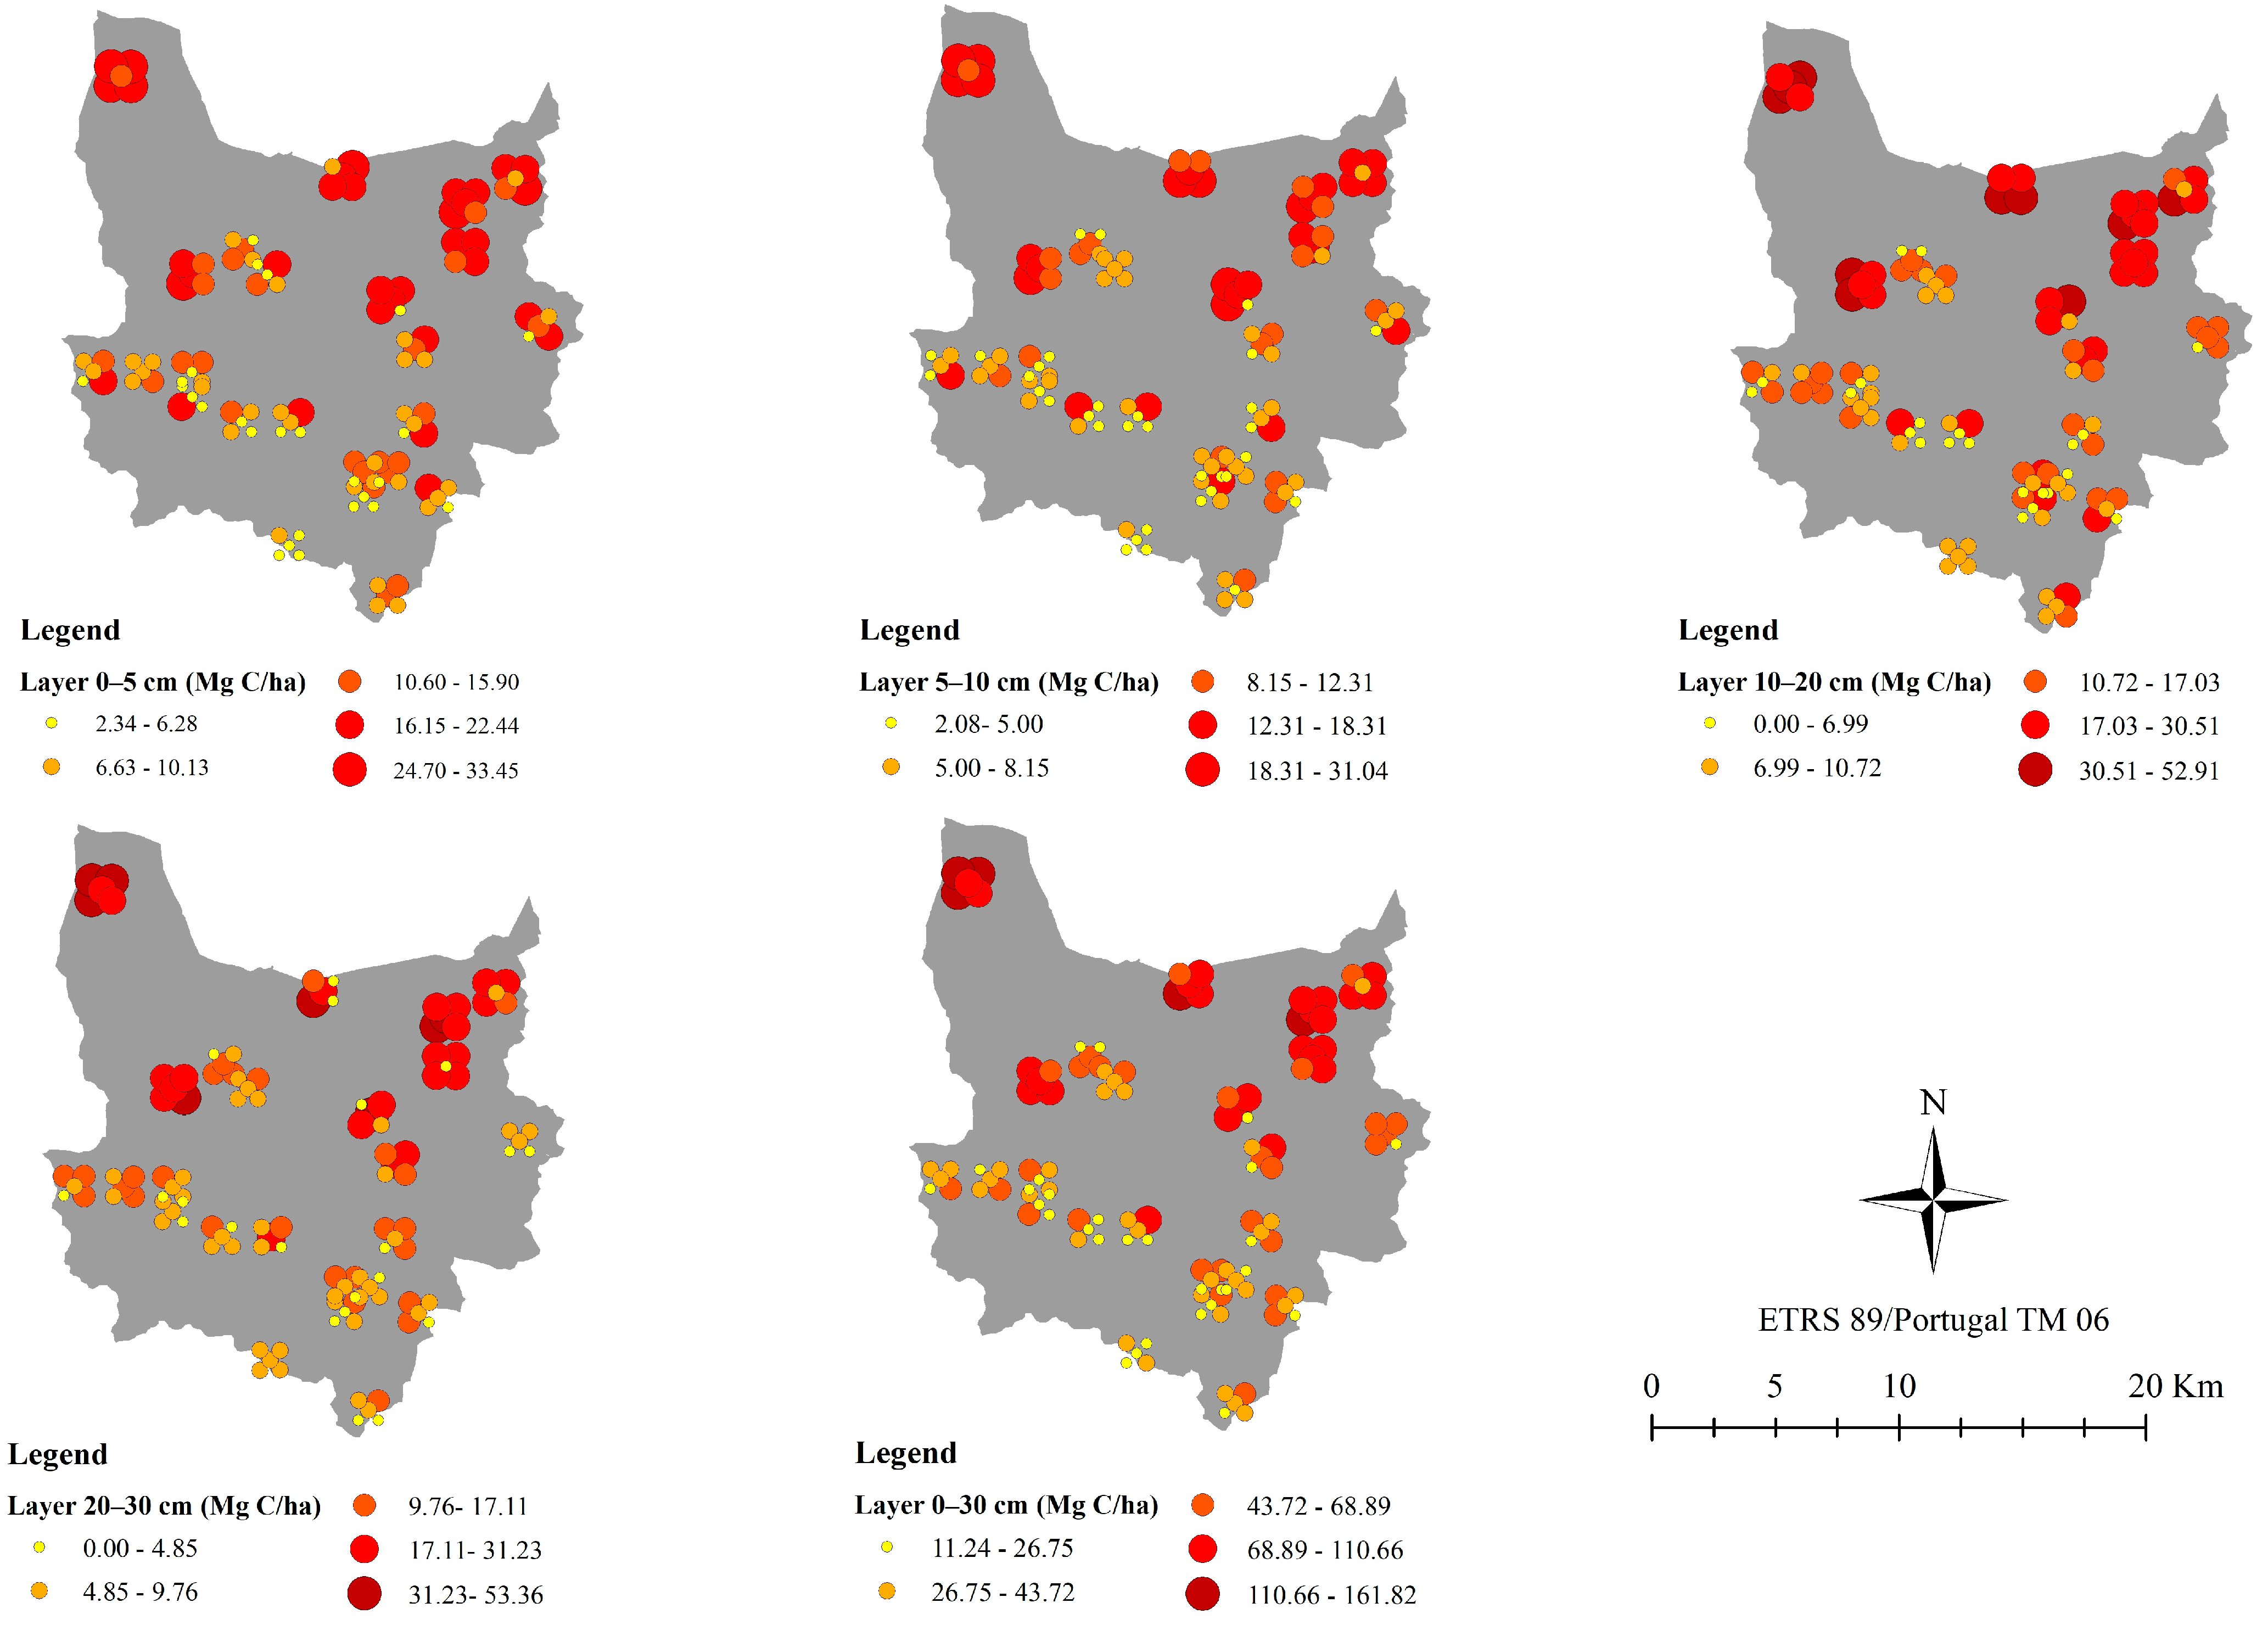
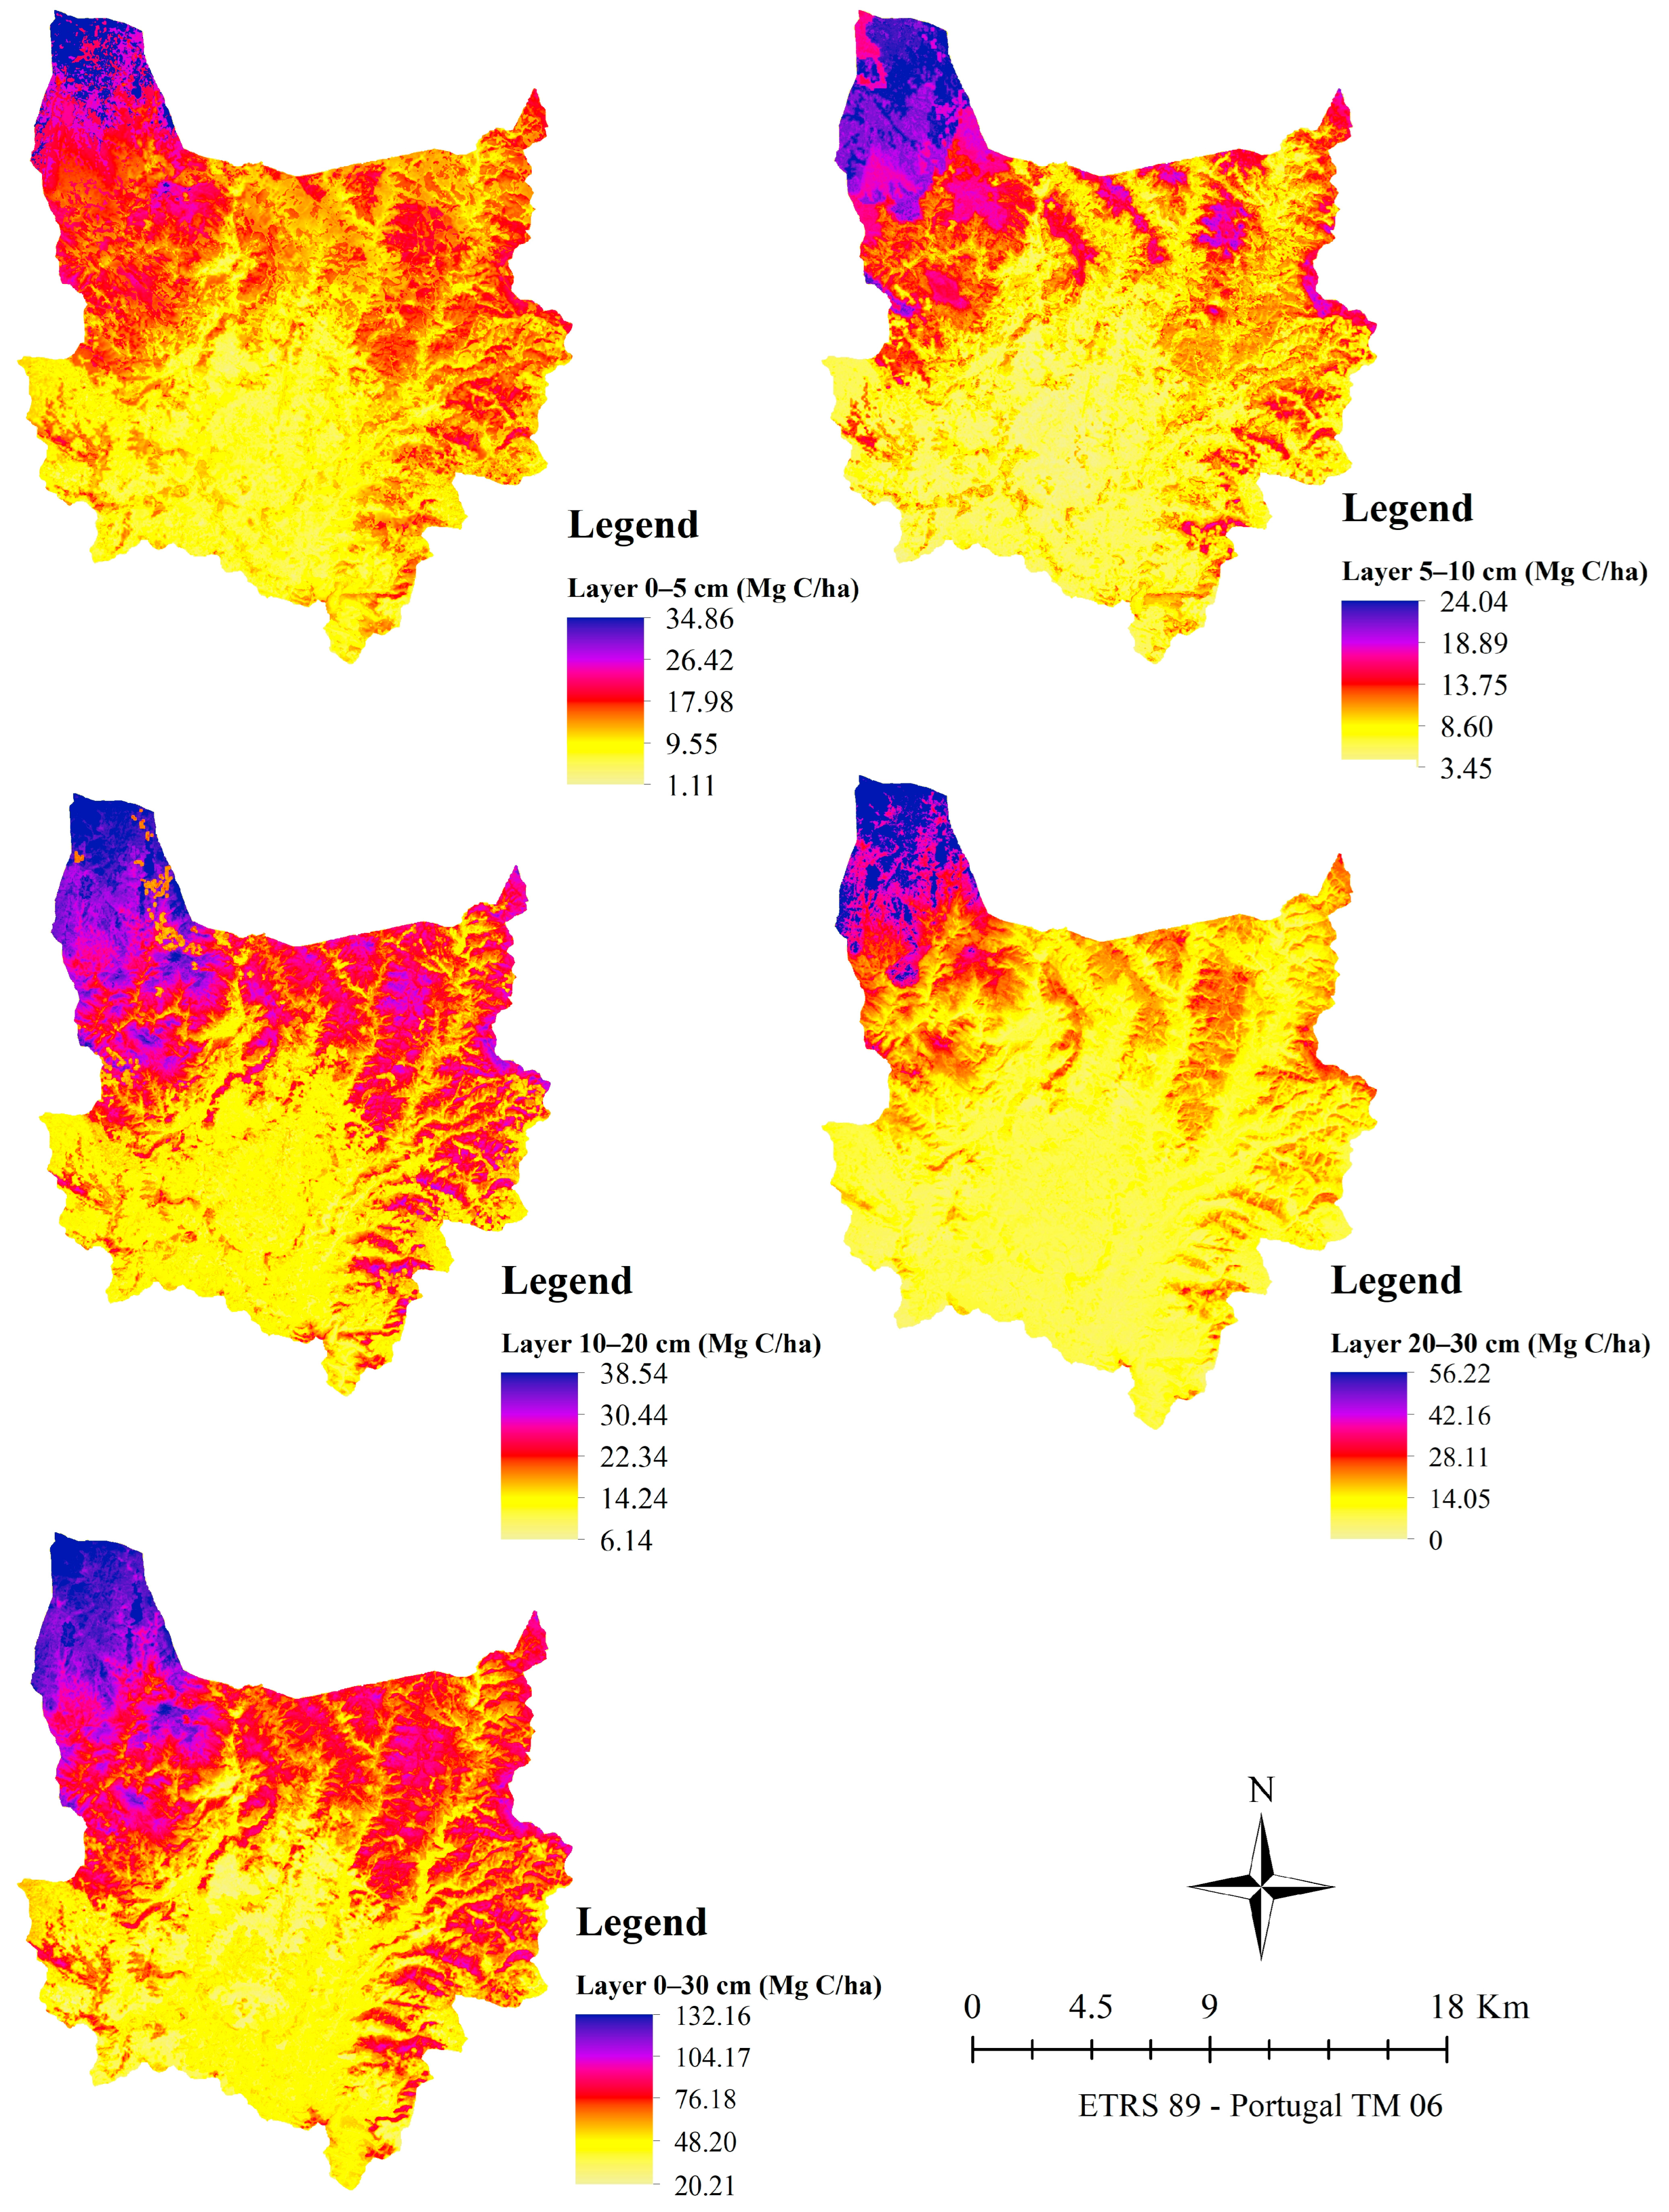
Soil Carbon Mapping
3. Results and Discussion
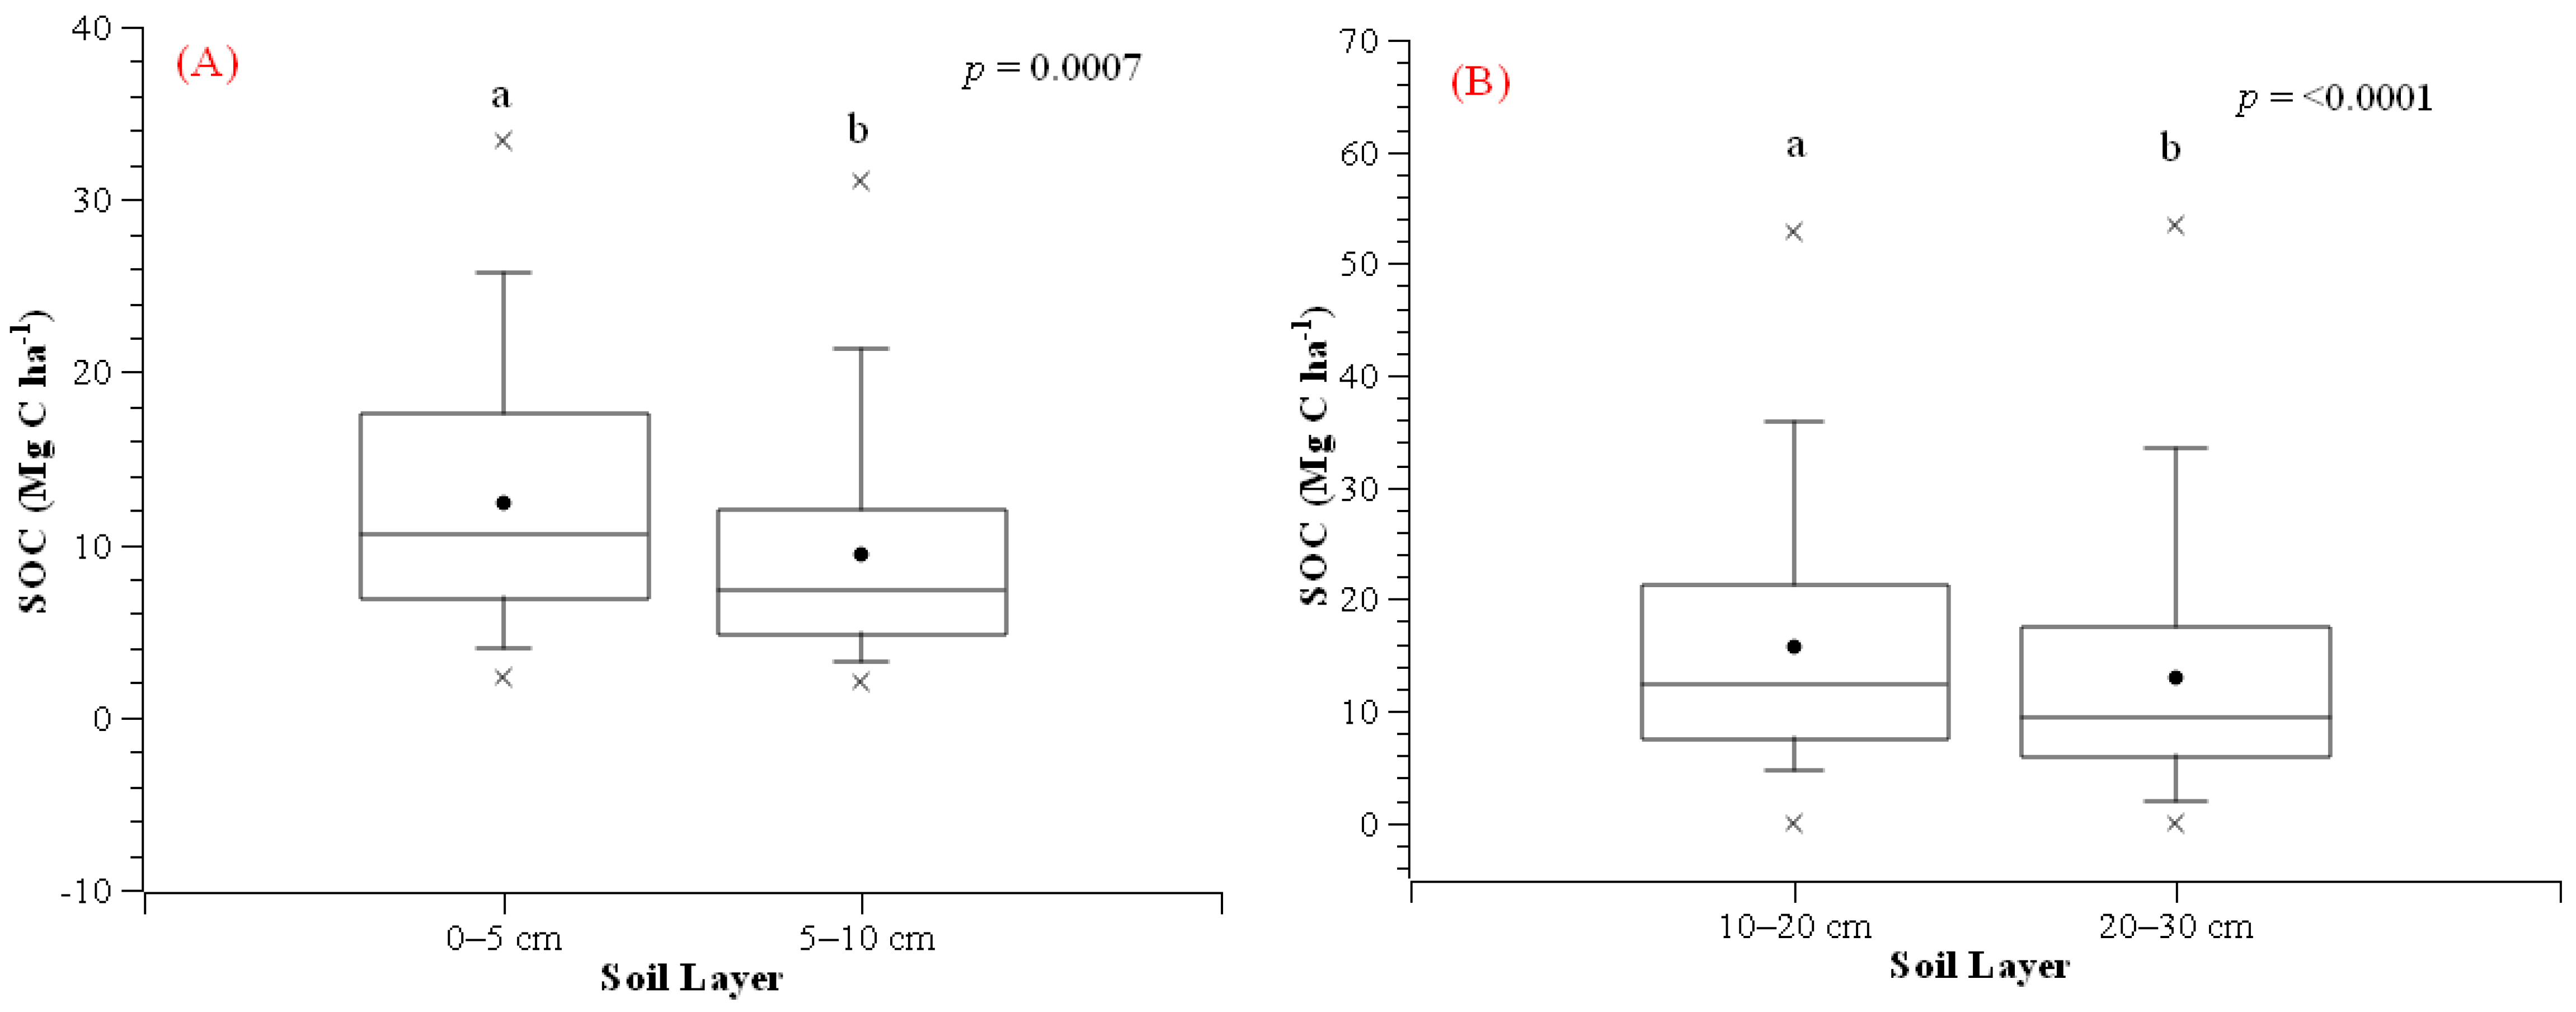
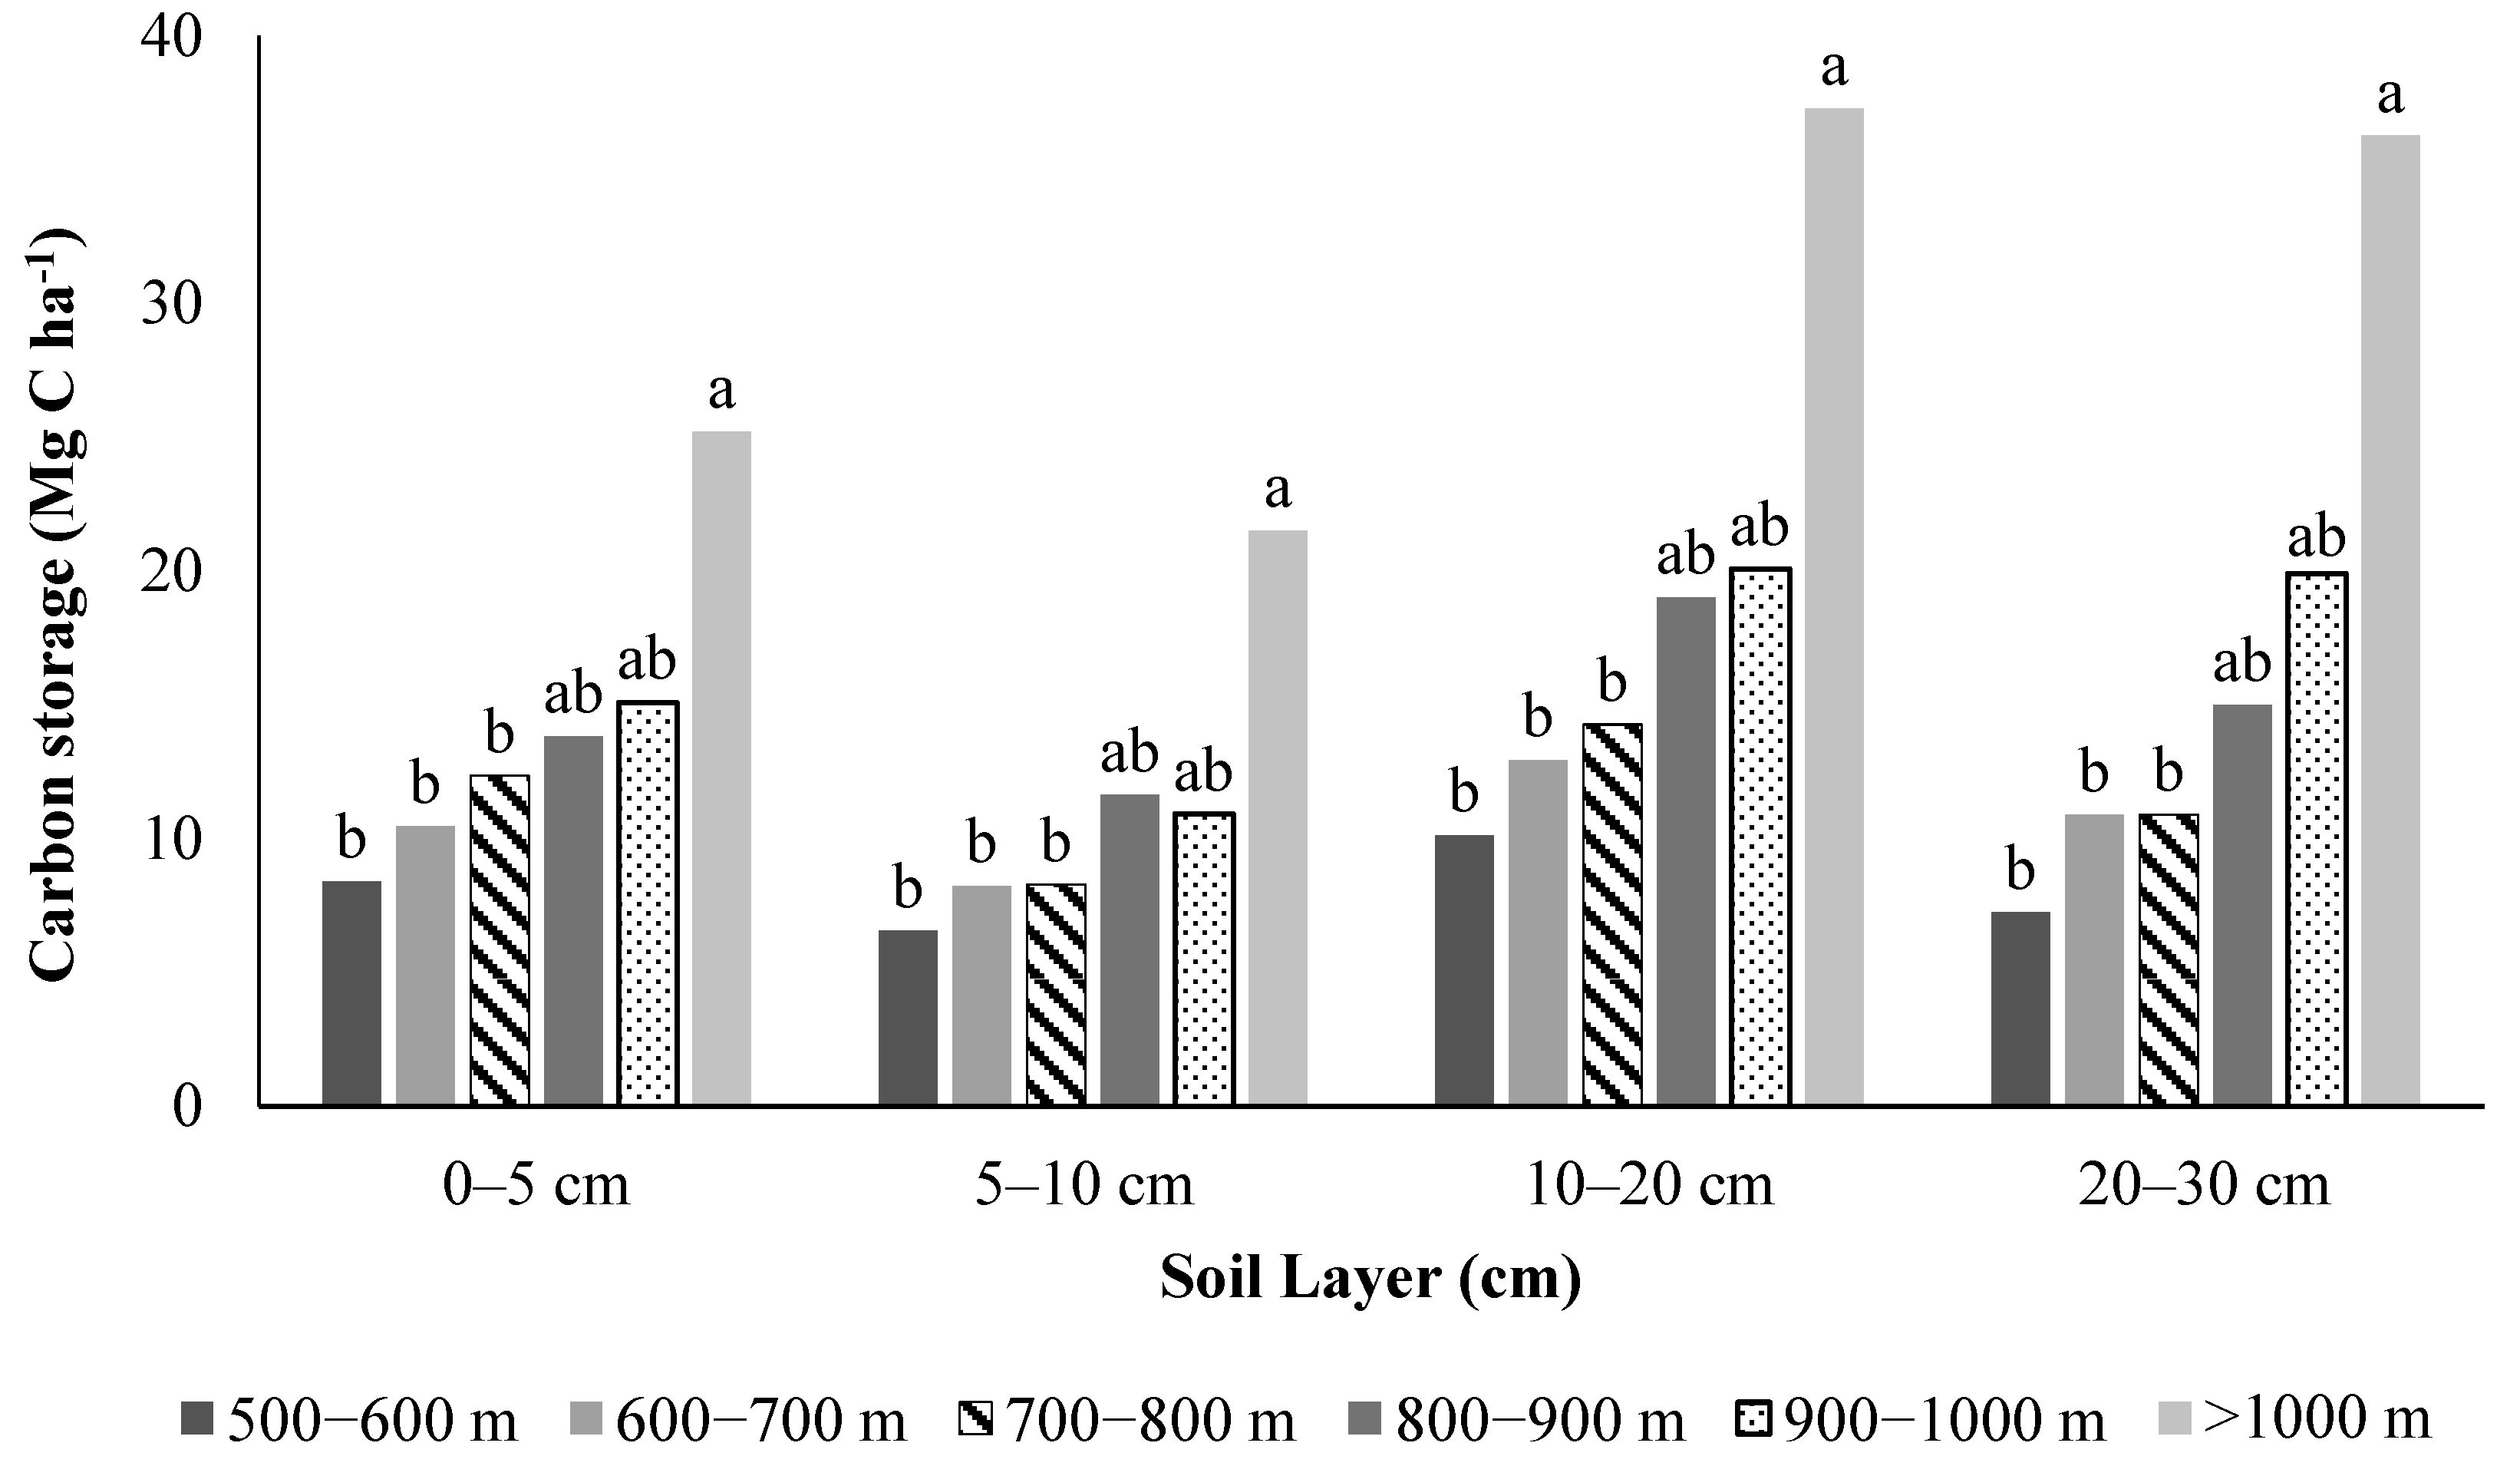
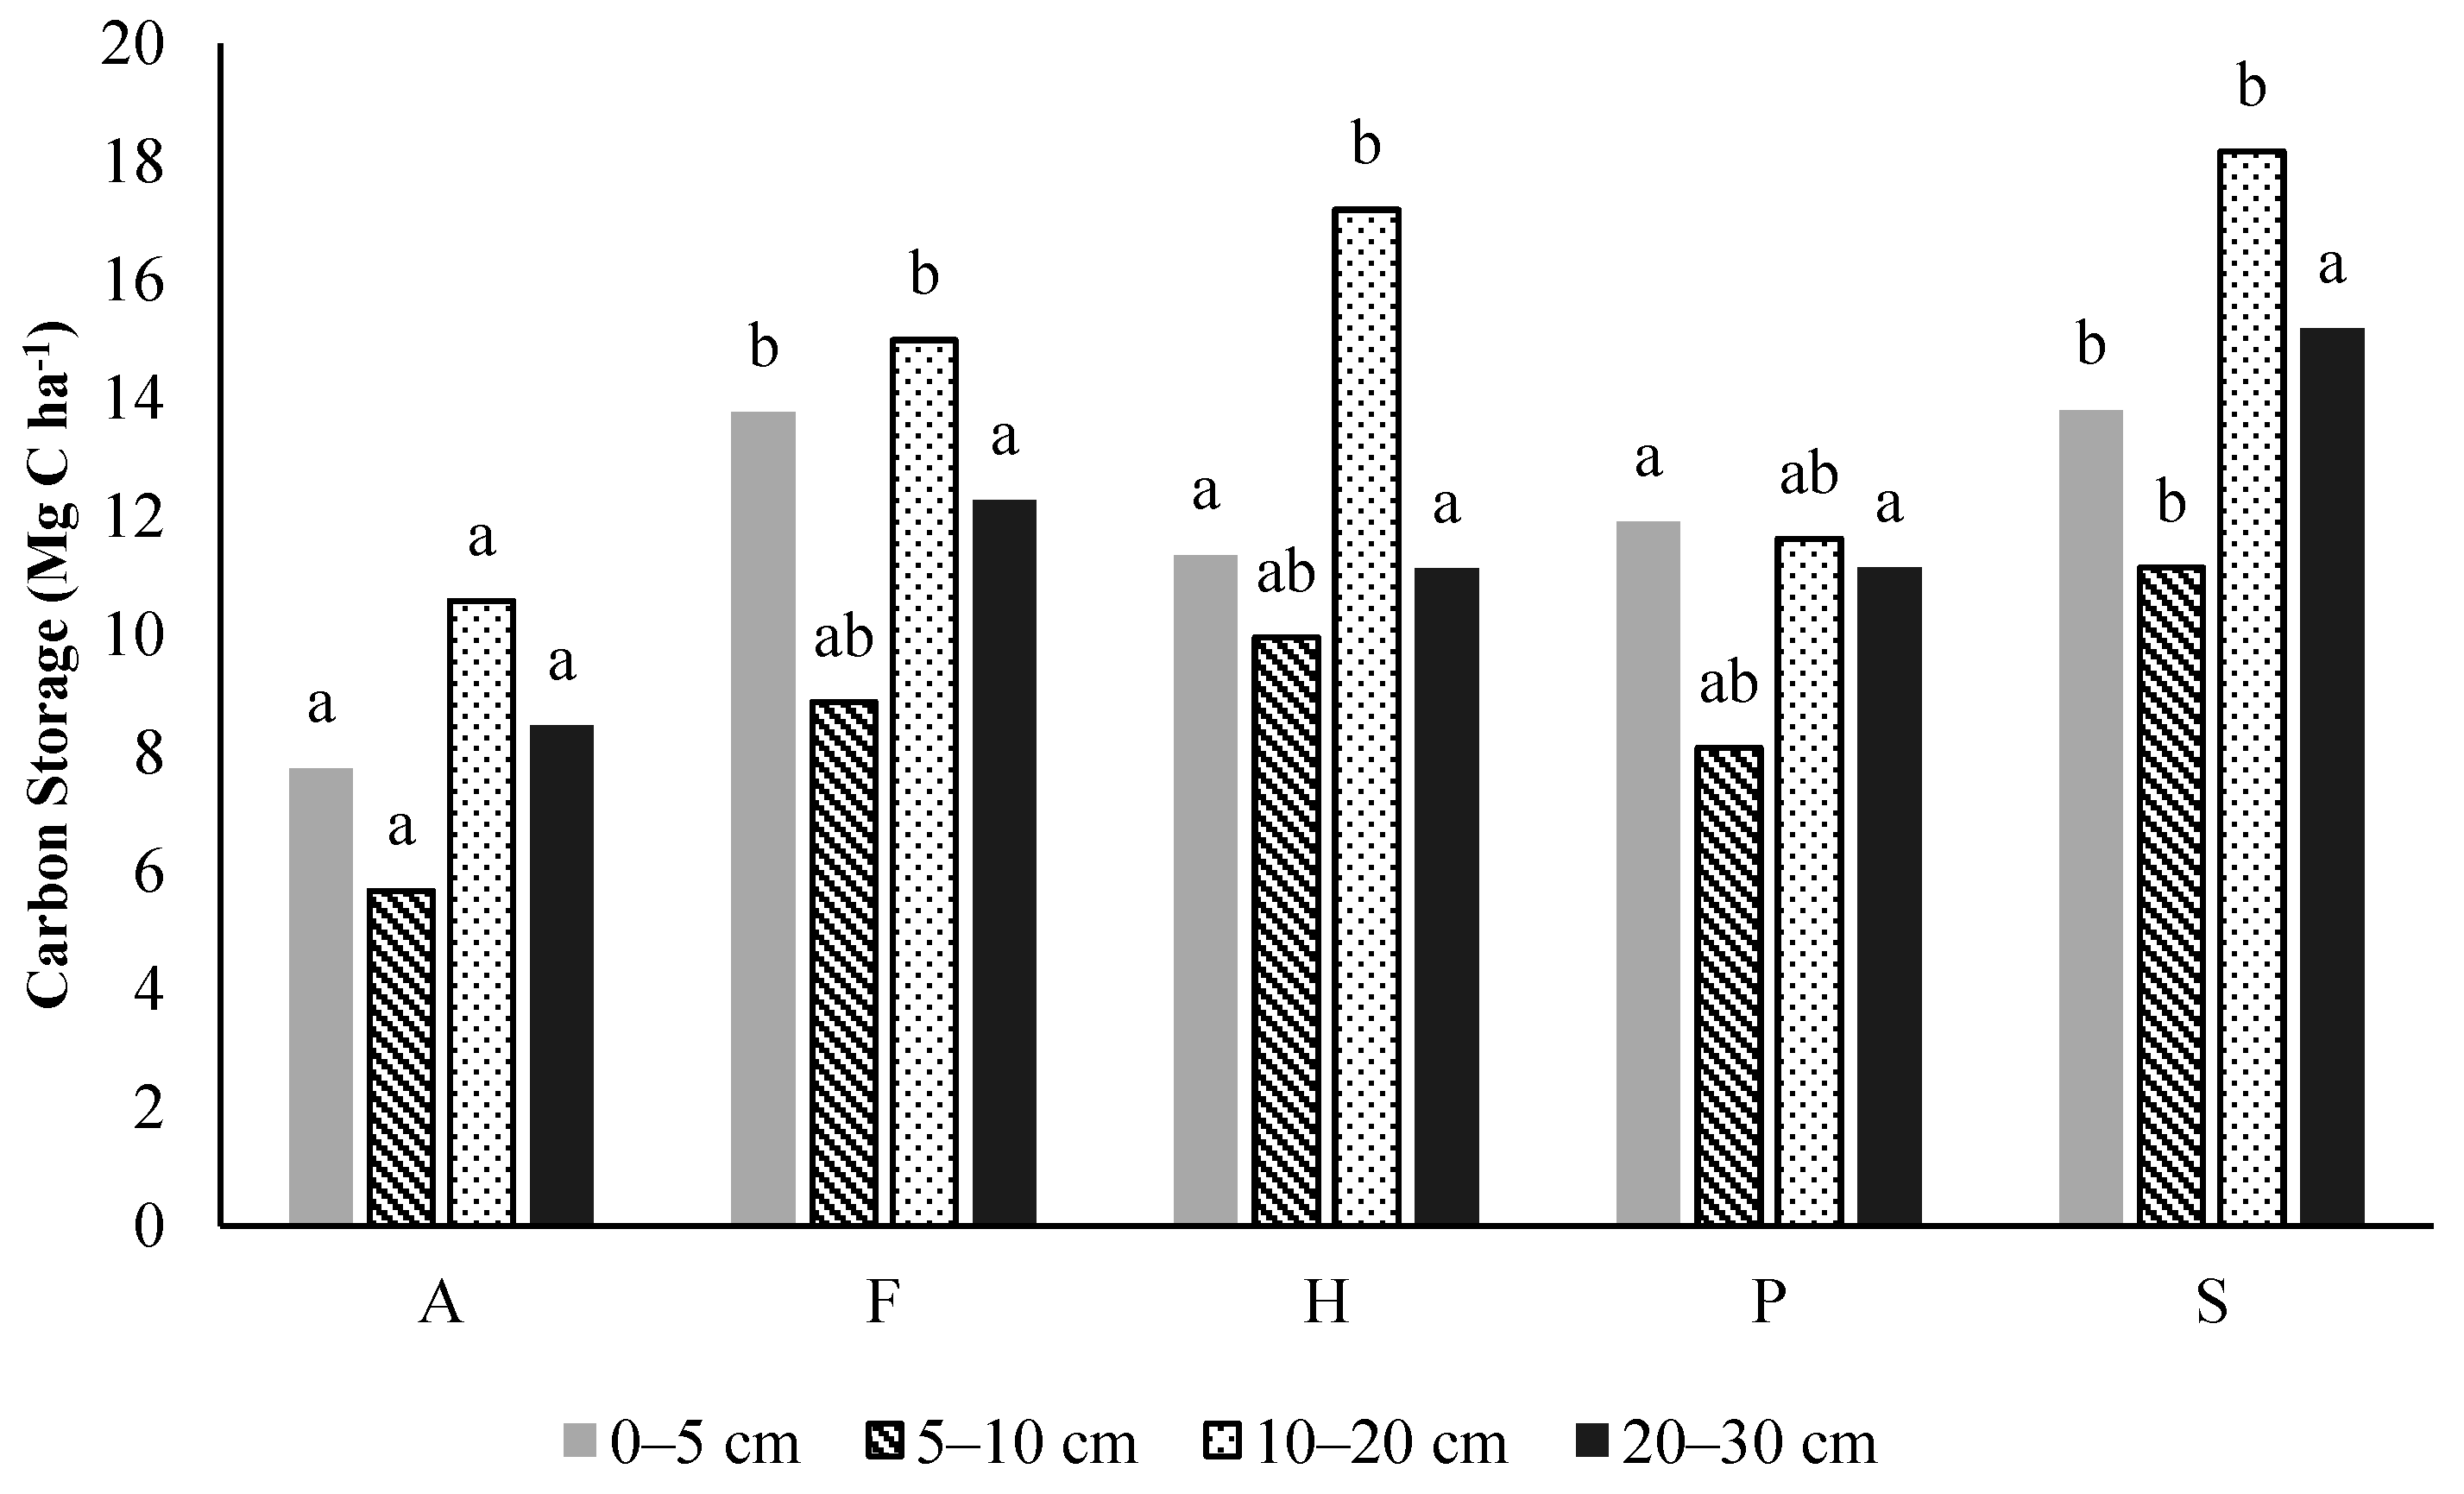
3.1. Environmental Factors Related to Soil Carbon Storage
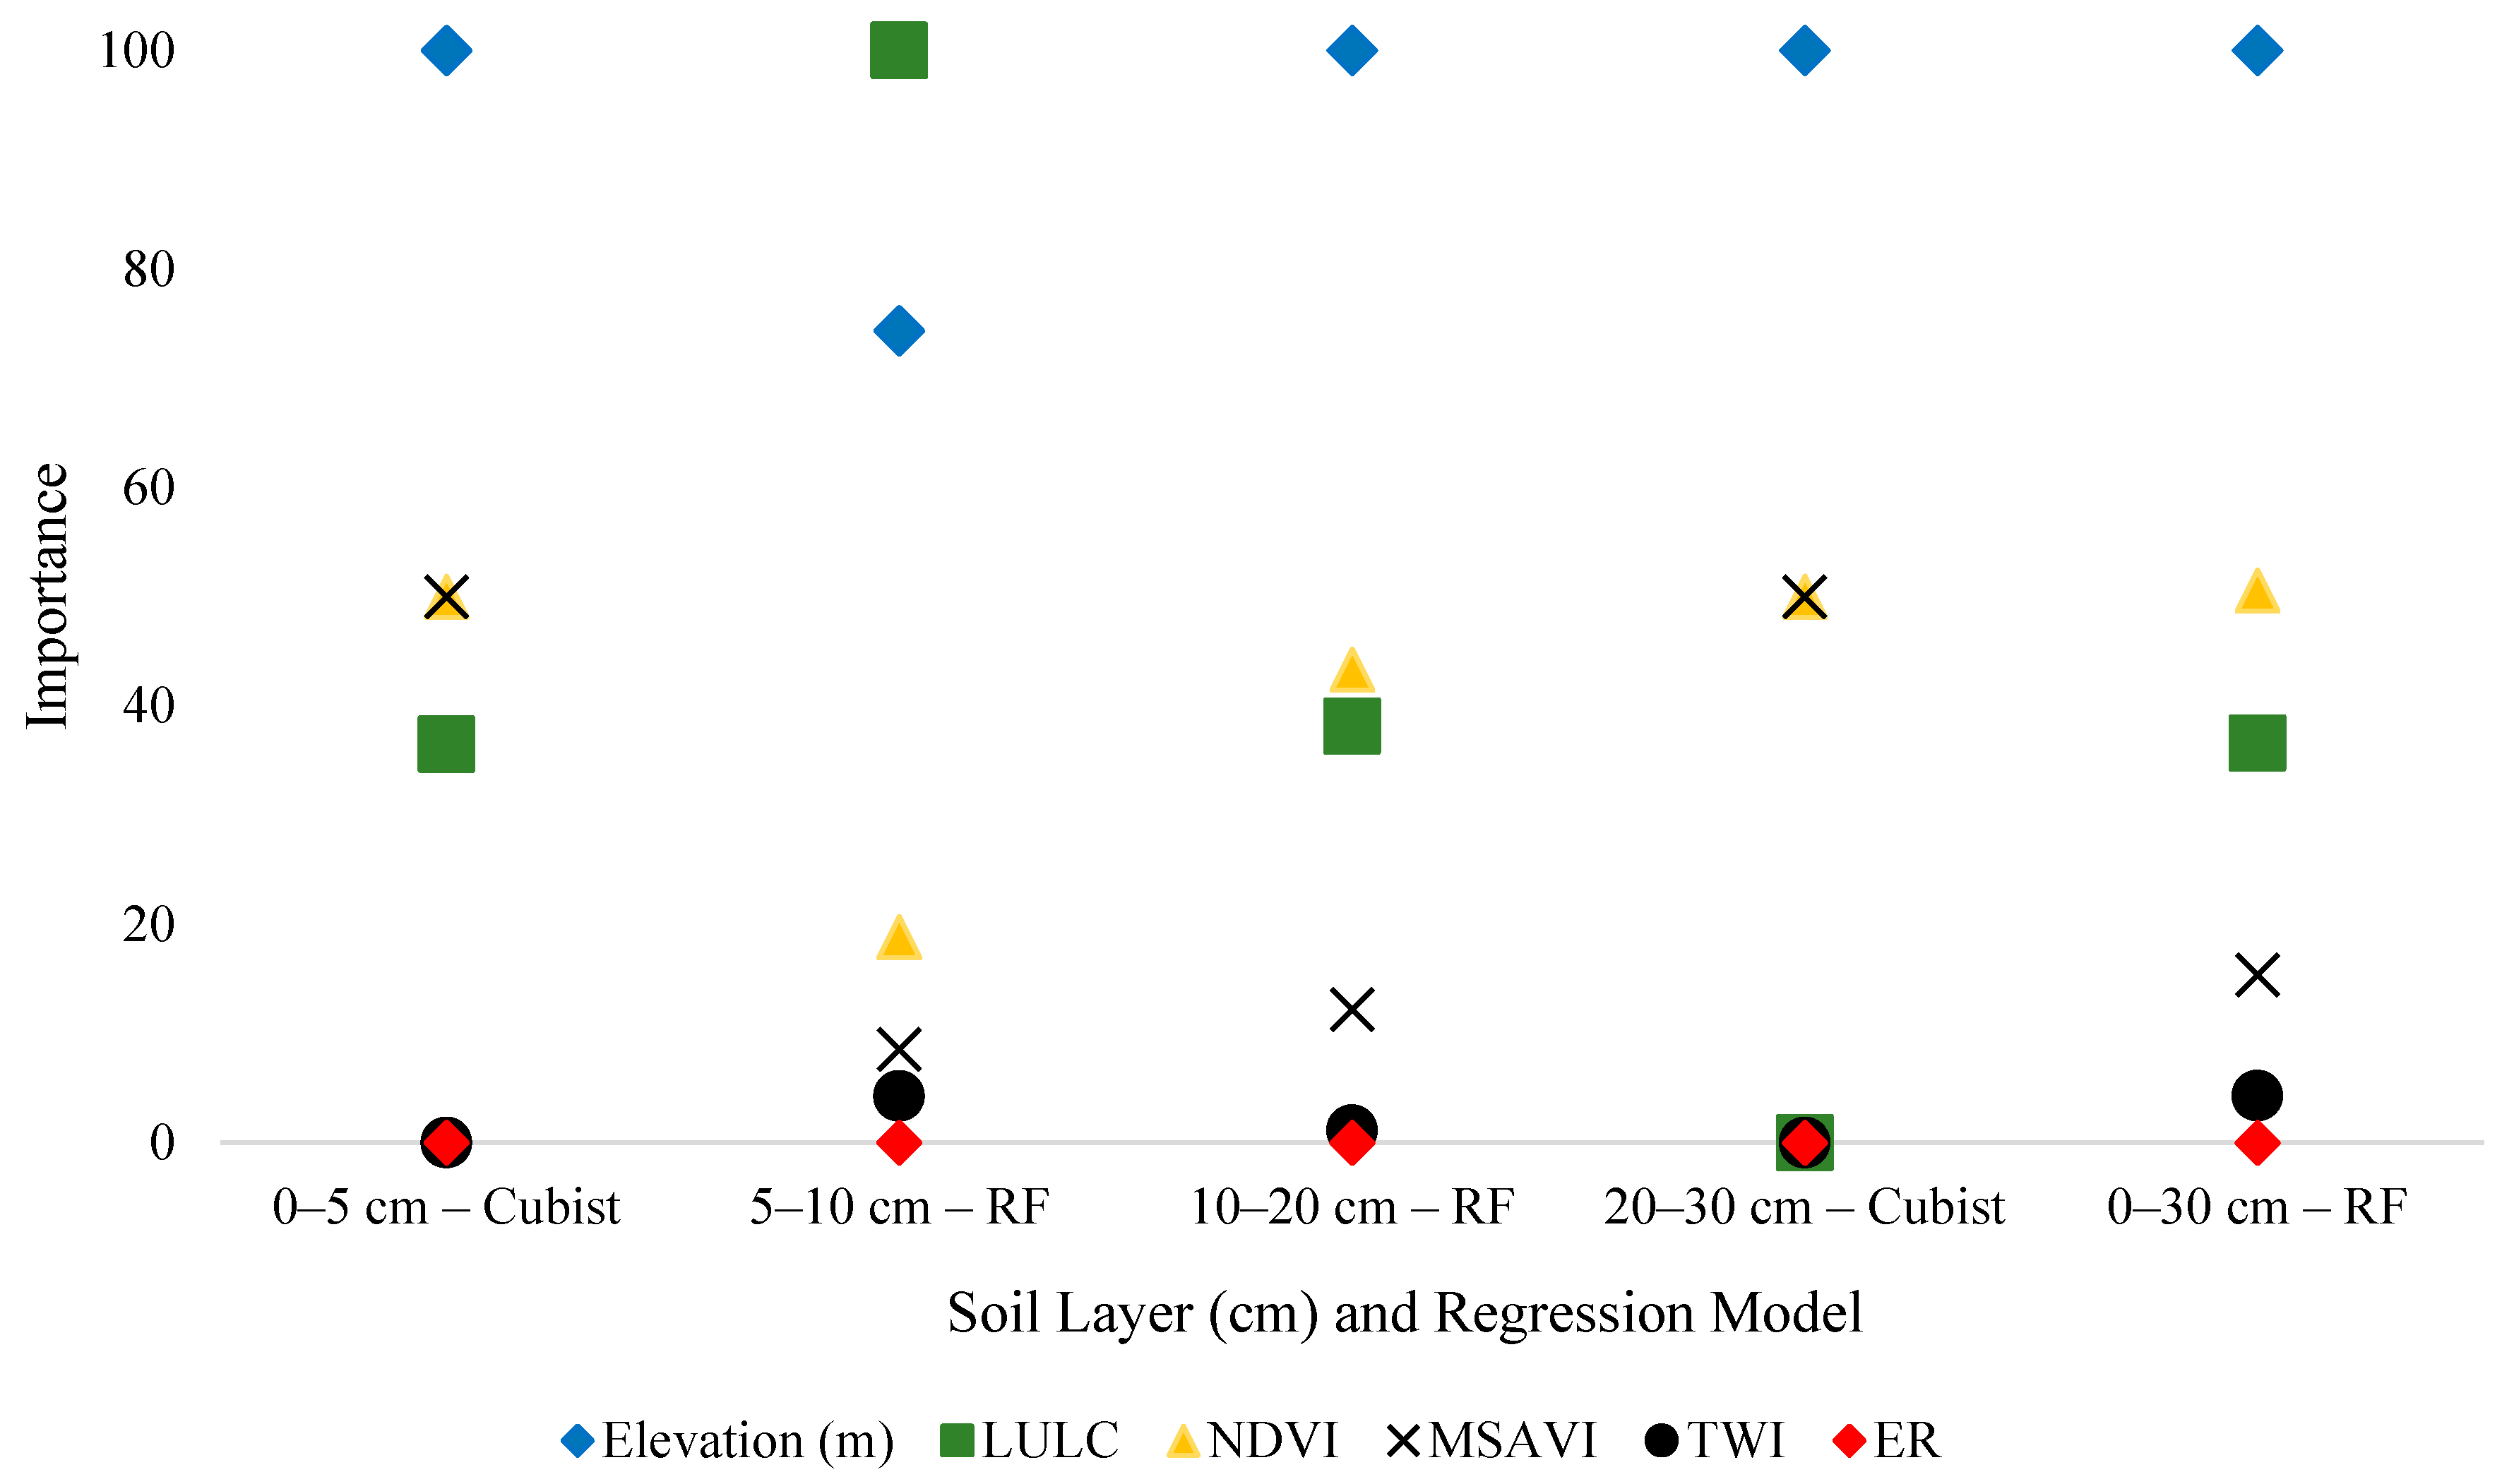
3.2. Regression Models
Predict Soil Carbon Storage
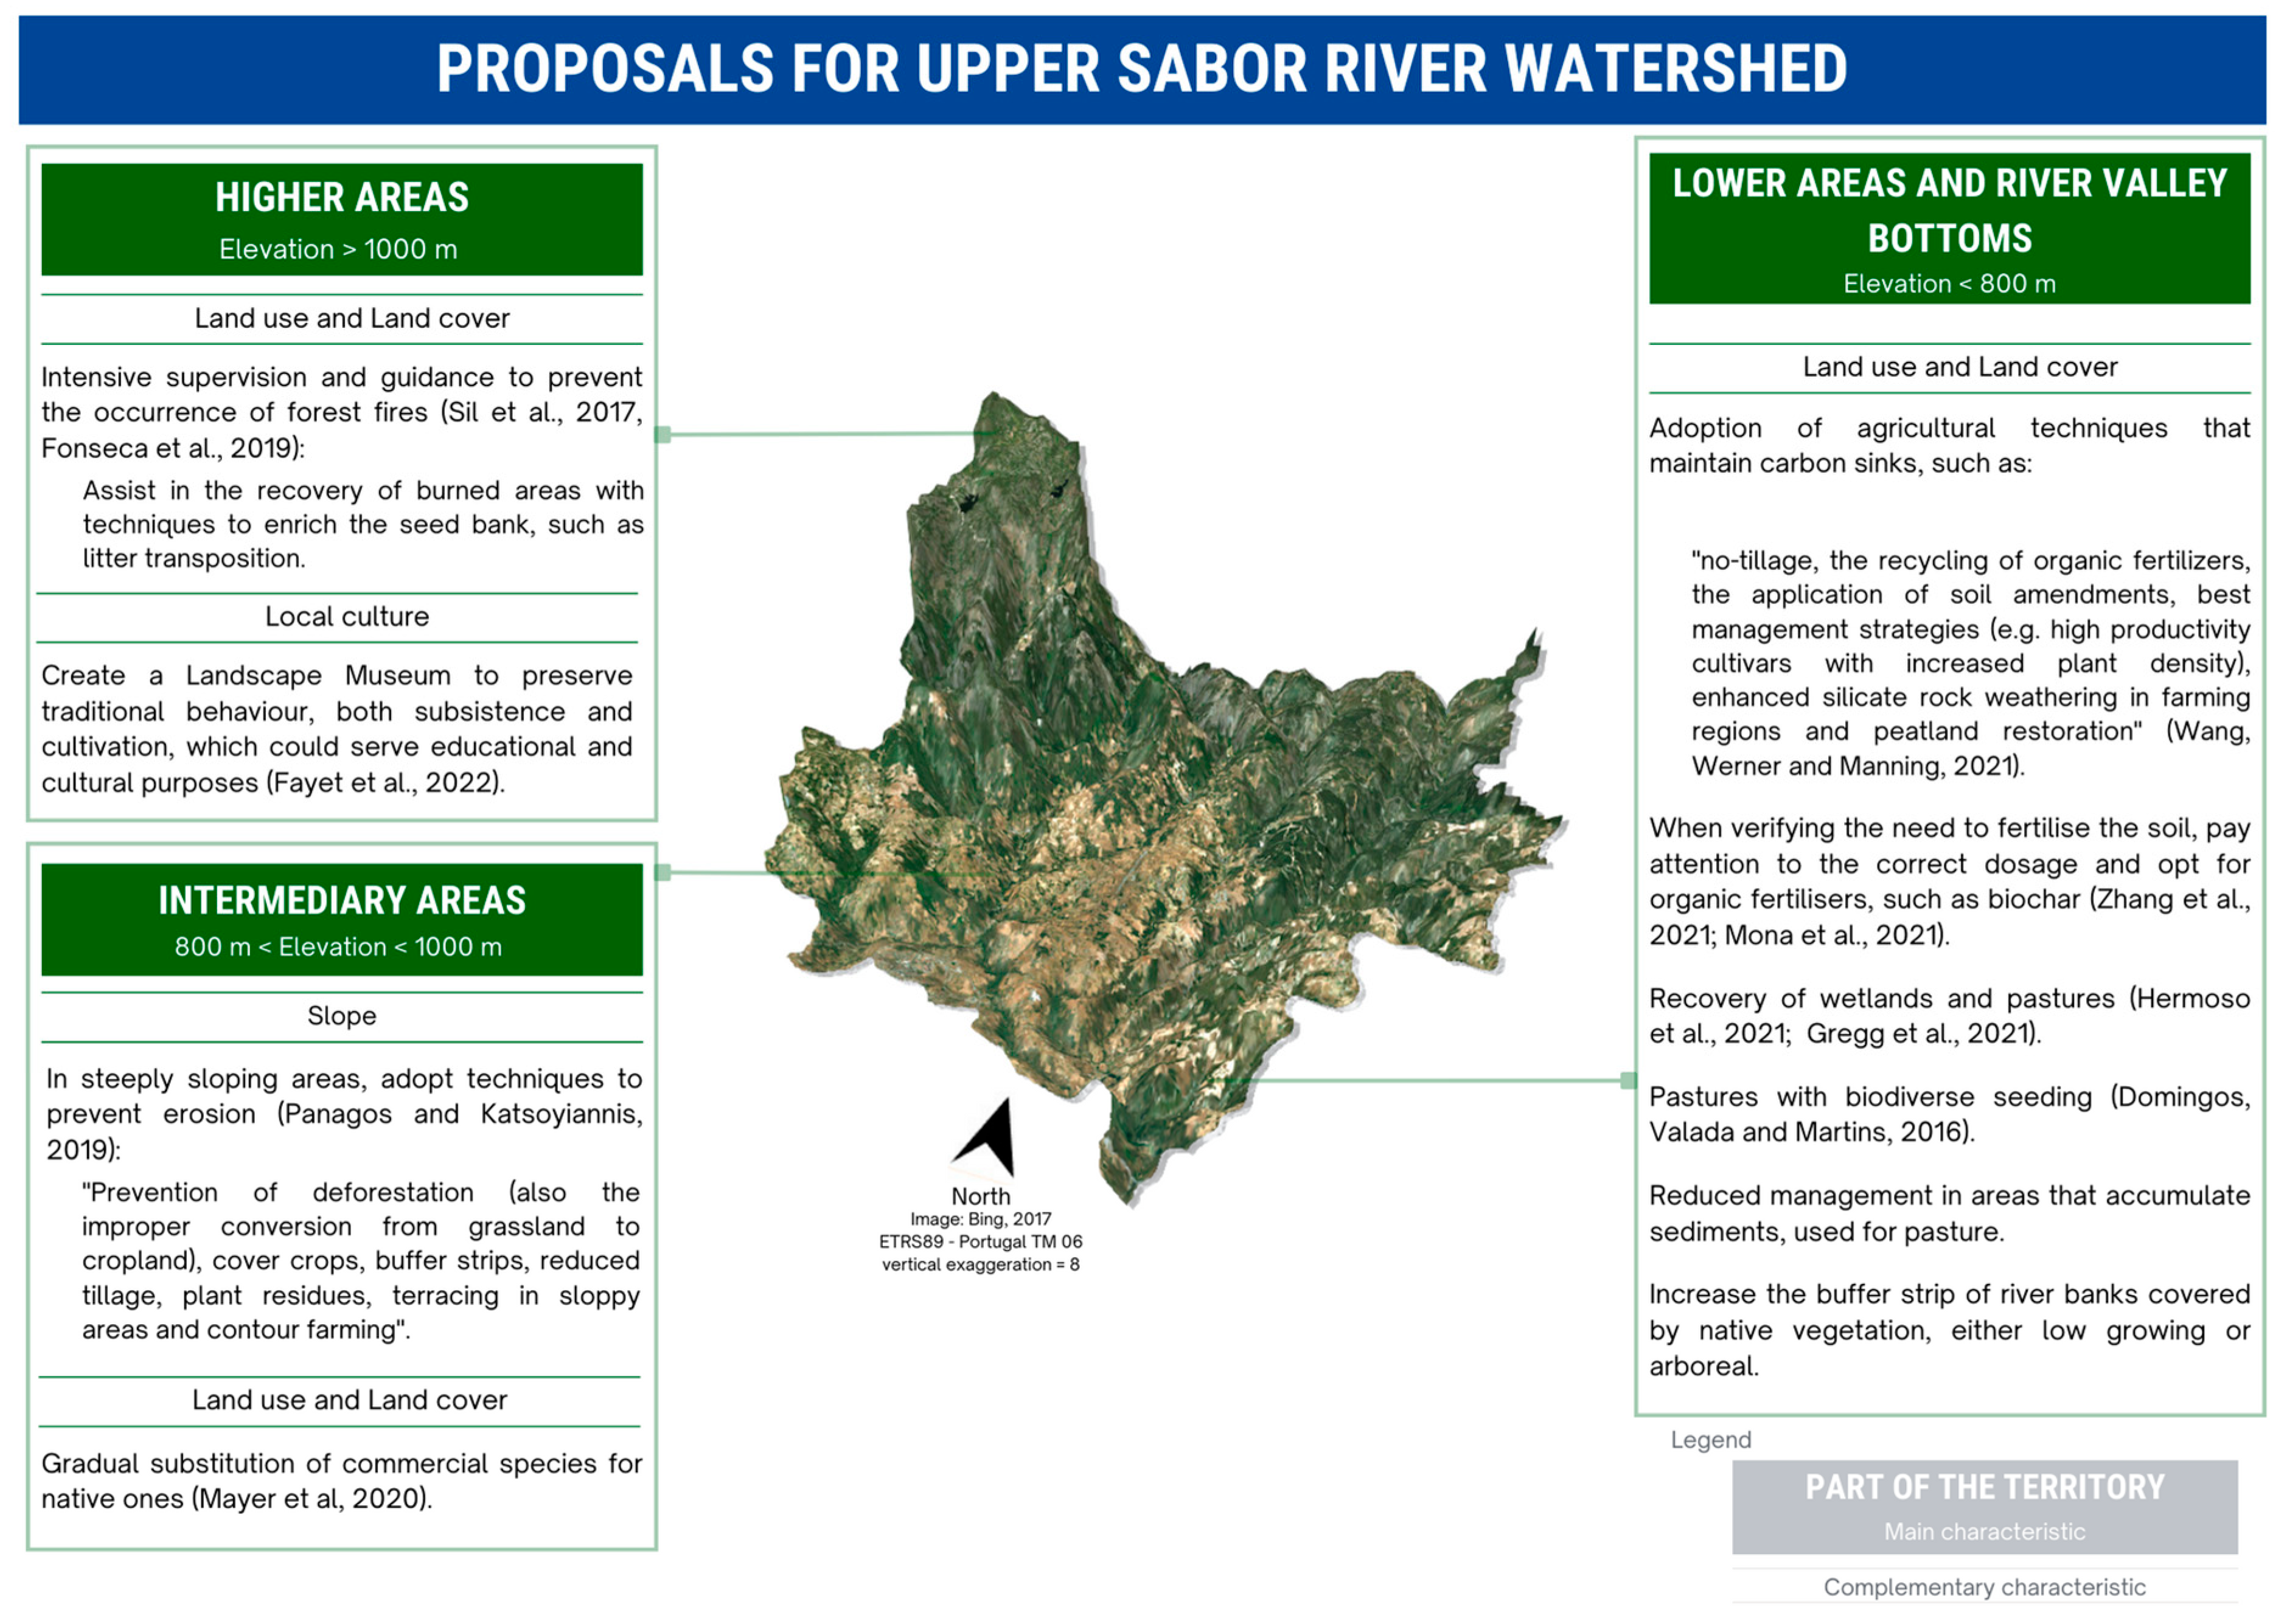
3.3. Proposals for Upper Sabor River Watershed Planning
4. Conclusions
Author Contributions
Funding
Institutional Review Board Statement
Informed Consent Statement
Data Availability Statement
Conflicts of Interest
References
- Adger, W.N.; Brown, K.; Nelson, D.R.; Berkes, F.; Eakin, H.; Folke, C.; Galvin, K.; Gunderson, L.; Goulden, M.; O’Brien, K.; et al. Resilience implications of policy responses to climate change. Wiley Interdiscip. Rev. Clim. Chang. 2011, 2, 757–766. [Google Scholar] [CrossRef]
- Letcher, T.M. (Ed.) Introduction with a Focus on Atmospheric Carbon Dioxide and Climate Change. In Future Energy: Chapter 1; Elservier: Amsterdam, The Netherlands, 2020; pp. 3–17. [Google Scholar] [CrossRef]
- Jakučionytė-Skodienė, M.; Liobikienė, G. Climate change concern, personal responsibility and actions related to climate change mitigation in EU countries: Cross-cultural analysis. J. Clean. Prod. 2021, 281, 125189. [Google Scholar] [CrossRef]
- Miller, M.A.; Tonoto, P.; Taylor, D. Sustainable development of carbon sinks? Lessons from three types of peatland partnerships in Indonesia. Sustain. Dev. 2022, 30, 241–255. [Google Scholar] [CrossRef]
- Löbmann, M.T.; Maring, L.; Prokop, G.; Brils, J.; Bender, J.; Bispo, A.; Helming, K. Systems knowledge for sustainable soil and land management. Sci. Total Environ. 2022, 822, 153389. [Google Scholar] [CrossRef] [PubMed]
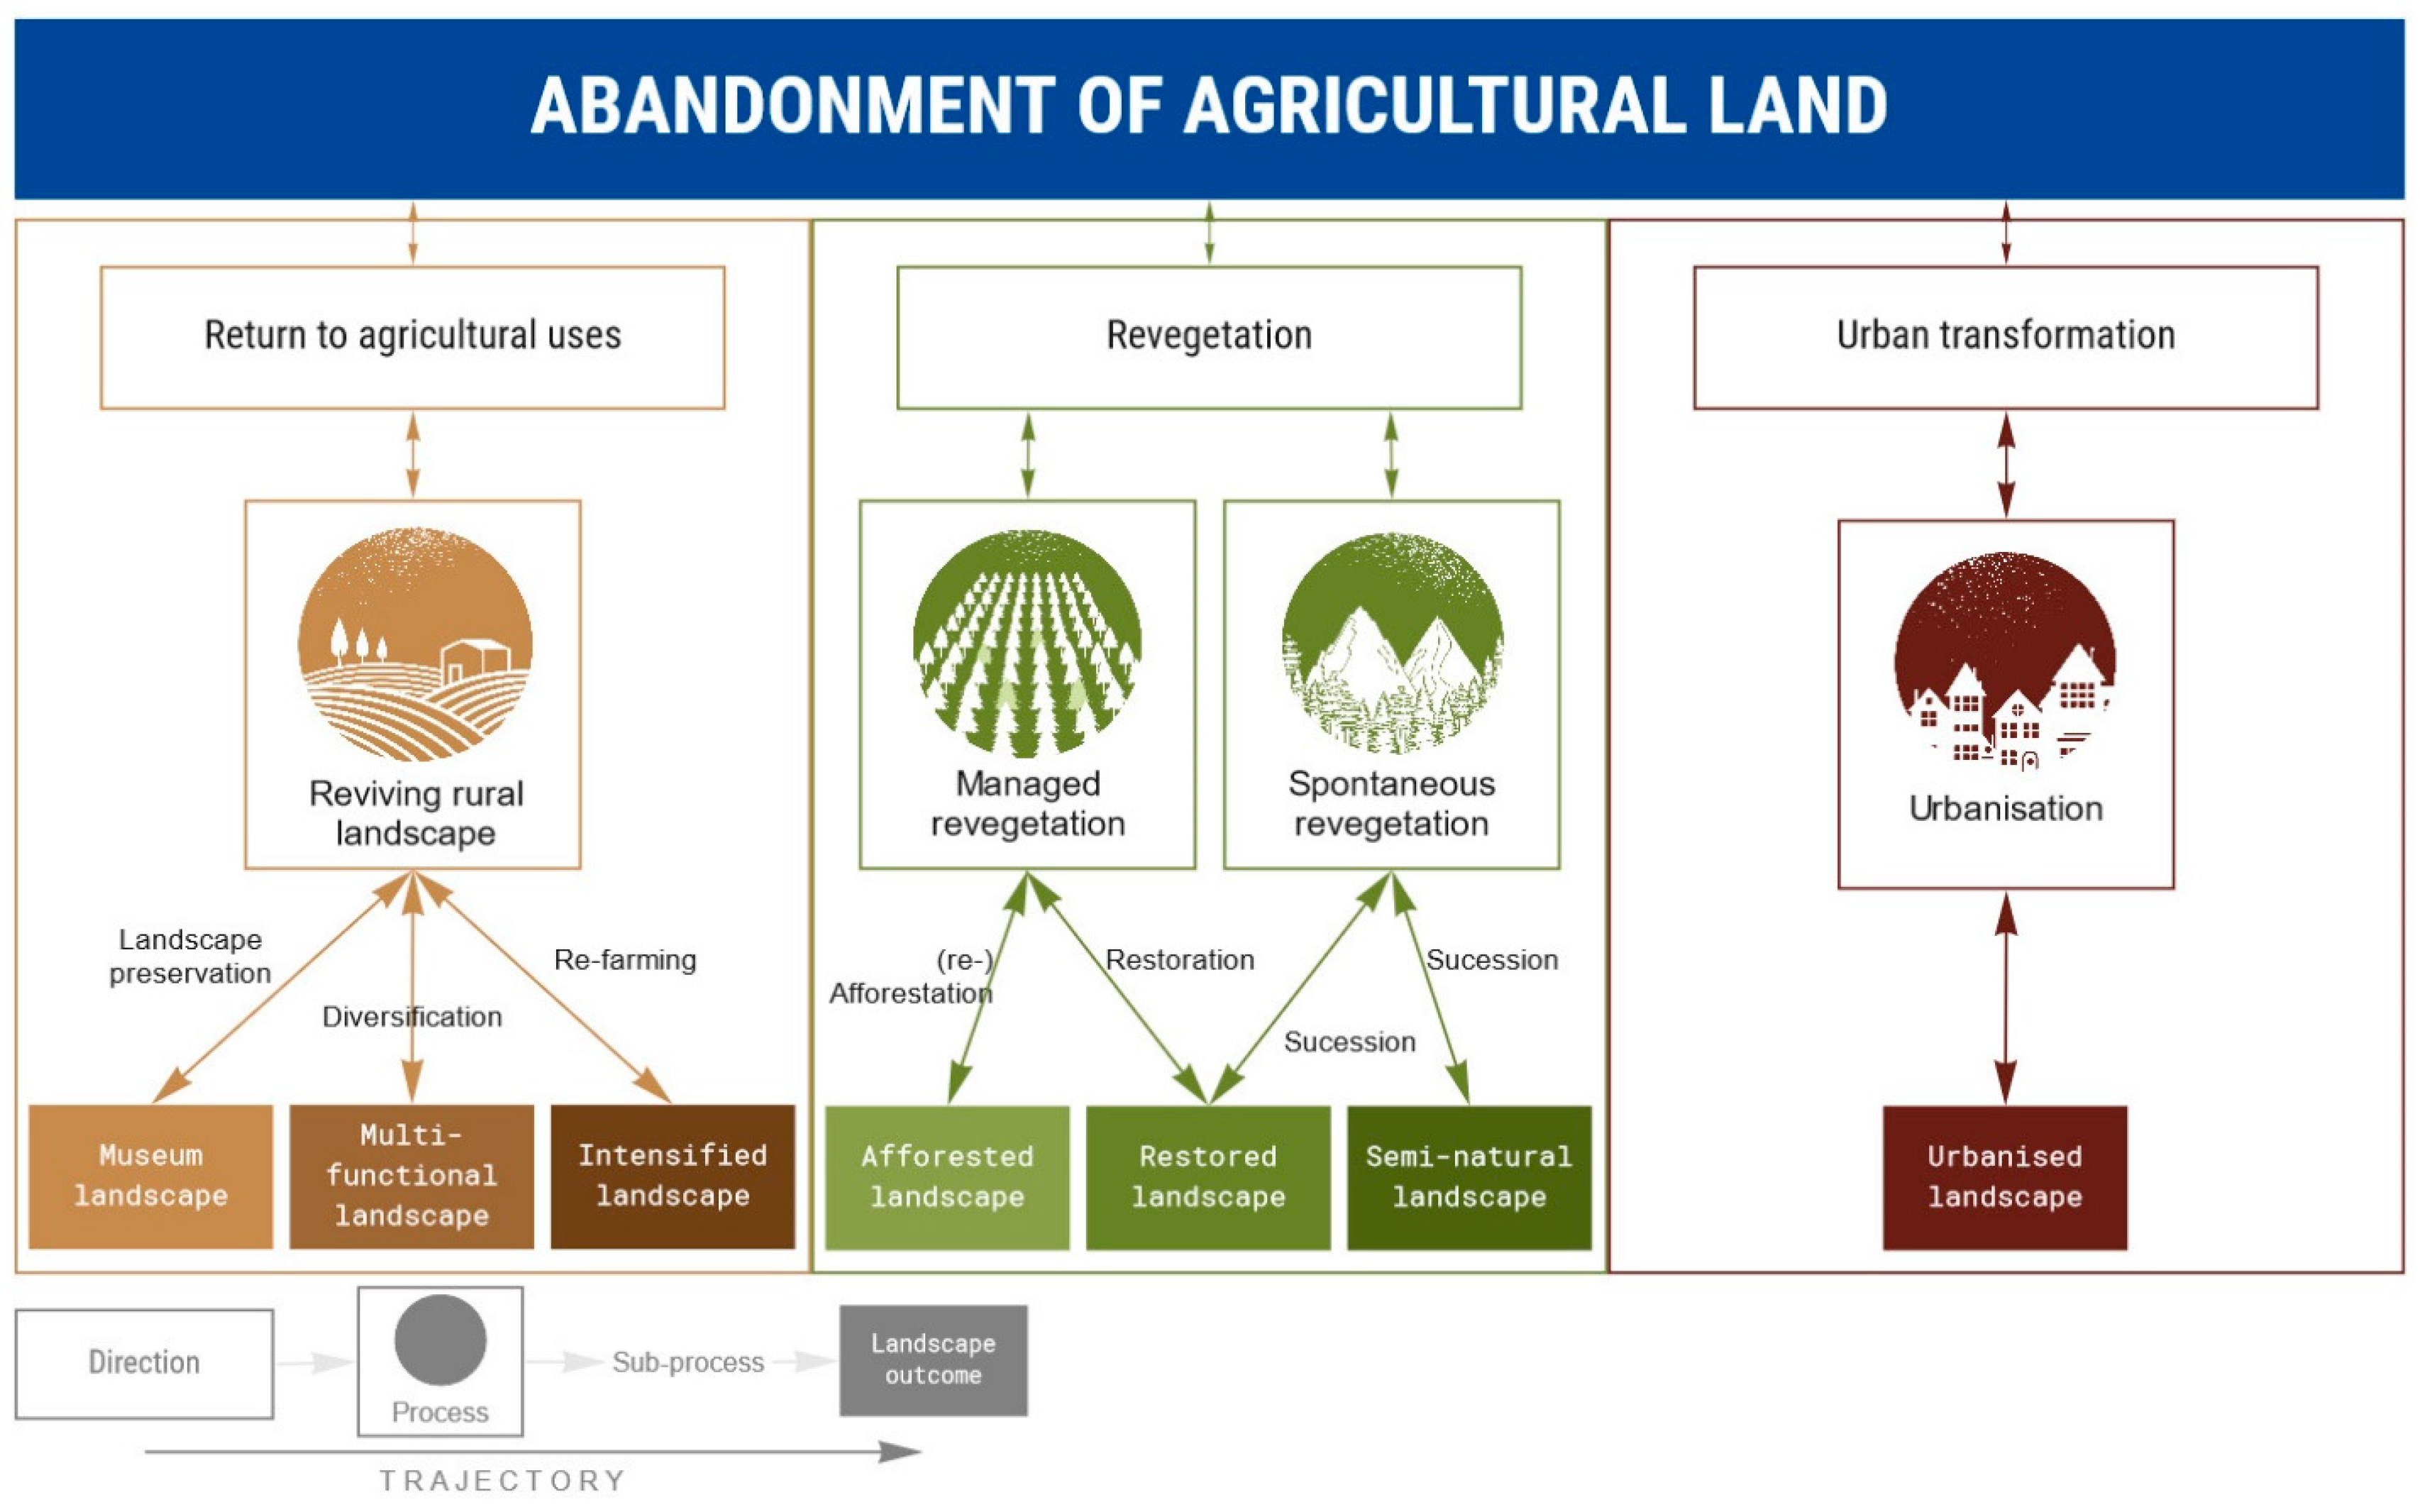
- Fayet, C.M.J.; Reilly, K.H.; Van Ham, C.; Verburg, P.H. What is the future of abandoned agricultural lands? A systematic review of alternative trajectories in Europe. Land Use Policy 2022, 112, 105833. [Google Scholar] [CrossRef]
- Sommer, R.; Bossio, D. Dynamics and climate change mitigation potential of soil organic carbon sequestration. J. Environ. Manag. 2014, 144, 83–87. [Google Scholar] [CrossRef] [PubMed]
- Rodrigues, C.I.D.; Brito, L.M.; Nunes, L.J. Soil carbon sequestration in the context of climate change mitigation: A review. Soil Syst. 2023, 7, 64. [Google Scholar] [CrossRef]
- Lal, R.; Bouma, J.; Brevik, E.; Dawson, L.; Field, D.J.; Glaser, B.; Hatano, R.; Hartemink, A.E.; Kosaki, T.; Lascelles, B.; et al. Soils, and sustainable development goals of the United Nations: An International Union of Soil Sciences perspective. Geoderma Reg. 2021, 25, e00398. [Google Scholar] [CrossRef]
- Reichstein, M.; Bahn, M.; Ciais, P.; Frank, D.; Mahecha, M.D.; Seneviratne, S.I.; Zscheischler, J.; Beer, C.; Buchmann, N.; Frank, D.C.; et al. Climate extremes and the carbon cycle. Nature 2013, 500, 287–295. [Google Scholar] [CrossRef]
- Cardoso, M.A.; Brito, R.S.; Almeida, M.C. Approach to develop a climate change resilience assessment framework. H2Open J. 2020, 3, 77–88. [Google Scholar] [CrossRef]
- Masson, V.; Lemonsu, A.; Hidalgo, J.; Voogt, J. Urban climates and climate change. Annu. Rev. Environ. Resour. 2020, 45, 411–444. [Google Scholar] [CrossRef]
- Gabric, A.J. The Climate Change Crisis: A Review of Its Causes and Possible Responses. Atmosphere 2023, 14, 1081. [Google Scholar] [CrossRef]
- Amelung, W.; Bossio, D.; de Vries, W.; Kögel-Knabner, I.; Lehmann, J.; Amundson, R.; Bol, R.; Collins, C.; Lal, R.; Leifeld, J.; et al. Towards a global-scale soil climate mitigation strategy. Nat. Commun. 2020, 11, 5427. [Google Scholar] [CrossRef] [PubMed]
- Wang, X.; Sun, Y.; Jia, W.; Wang, H.; Zhu, W. Coupling of Forest Carbon Densities with Landscape Patterns and Climate Change in the Lesser Khingan Mountains, Northeast China. Sustainability 2023, 15, 14981. [Google Scholar] [CrossRef]
- Lewandowski, A. Organic Matter Management; Retrieved from the University of Minnesota Digital Conservancy; University of Minnesota Extension: St. Paul, MN, USA, 2020; Available online: https://hdl.handle.net/11299/51896 (accessed on 8 October 2023).
- Aguiar, C.; Azevedo, J. A floresta e a restituição da fertilidade do solo nos sistemas de agricultura orgânicos tradicionais do NE de Portugal no início do séc. XX. In Florestas do Norte de Portugal: História, Ecologia e Desafios de Gestão; Tereso, J.P., Honrado, J.P., Pinto, A.T., Rego, F.C., Eds.; InBio: Porto, Portugal, 2011; pp. 100–117. [Google Scholar]
- Sil, A.; Fonseca, F.; Gonçalves, J.; Honrado, J.; Marta-Pedroso, C.; Azevedo, J.C. Analyzing carbon sequestration and storage dynamics in a changing mountain landscape in Portugal: Insights for management and planning. Int. J. Biodivers. Sci. Ecosyst. Serv. Manag. 2017, 13, 82–104. [Google Scholar] [CrossRef]
- Minasny, B.; Malone, B.P.; McBratney, A.B.; Angers, D.A.; Arrouays, D.; Chambers, A.; Chaplot, V.; Chen, Z.-S.; Cheng, K.; Das, B.S.; et al. Soil carbon 4 per mille. Geoderma 2017, 292, 59–86. [Google Scholar] [CrossRef]
- Araújo, Y.R.V.; Moreira, Z.C.G.; Neves, A.I.d. Estoque de carbono e de biomassa em vegetação com diferentes estágios de regeneração e alterações antrópicas em área urbana. Revista Brasileira de Meio Ambiente 2020, 8, 46–61. Available online: https://revistabrasileirademeioambiente.com/index.php/RVBMA/article/view/353 (accessed on 8 October 2023).
- Aguiar, C.; Vila-Viçosa, C. A flora e a vegetação das montanhas de Portugal continental. In Sustentabilidade da Montanha Portuguesa: Realidades e Desafios; Instituto Politécnico: Bragança, Portugal, 2016; pp. 59–90. ISBN 978-972-745-220-0. [Google Scholar]
- Canedoli, C.; Ferrè, C.; El Khair, D.A.; Comoli, R.; Liga, C.; Mazzucchelli, F.; Proietto, A.; Rota, N.; Colombo, G.; Bassano, B.; et al. Evaluation of ecosystem services in a protected mountain area: Soil organiccarbon stock and biodiversity in alpine forests and grasslands. Ecosyst. Serv. 2020, 44, 101135. [Google Scholar] [CrossRef]
- IPB/ICN. Plano de Ordenamento do Parque Natural de Montesinho—Estudo e Relatório de Caracterização; IPB/ICN: Bragança, Portugal, 2007. [Google Scholar]
- Gonçalves, D.A.; Figueiredo, T.; Ribeiro, A.C.; Leite, S.M. A geografia e o clima das montanhas ibéricas. In Sustentabilidade da Montanha Portuguesa: Realidade e Desafios; Azevedo, J.C., Cadavez, V., Arrobas, M., Pires, J.M., Eds.; Instituto Politécnico de Bragança: Bragança, Portugal, 2016; pp. 39–57. [Google Scholar]
- Portugal. Municipality (Distritos). Agência para a Modernização Administrativa, Shapefile. 2021. Available online: https://dados.gov.pt/en/reuses/distritos-concelhos-freguesias-e-heraldica-de-portugal/ (accessed on 15 July 2022).
- Portugal. Rede Nacional de Áreas Protegidas (RNAP). Instituto da Conservação da Natureza e das Florestas. 2018. Available online: https://geocatalogo.icnf.pt/metadados/rnap.html (accessed on 15 July 2022).
- Koe, T.D. Flora e Vegetação da Bacia Superior do Rio Sabor no Parque Natural de Montesinho; Depósito Legal No. 190048/1987; Serviços Gráficos do I.P.B.: Bragança, Portugal, 1988; 47p. [Google Scholar]
- Santos, M.; Fonseca, A.; Fragoso, M.; Santos, J.A. Evolução Recente e Futura de Índices de Extremos de Precipitação em Portugal Continental. Água e Território; Água e Território: Um tributo a Catarina, Ramos; Ramos-Pereira, A., Leal, M., Bergonse, R., Trindade, J., Reis, E., Eds.; Centro de Estudos Geográficos, IGOT, Universidade de Lisboa: Lisboa, Portugal, 2019; pp. 279–294. ISBN 978-972-636-280-1. [Google Scholar]
- USGS (United States Geological Survey). Shuttle Radar Topography Mission (SRTM) 1 Arc-Second Global—Portugal; USGS (United States Geological Survey): Reston, VA, USA, 2000. [CrossRef]
- Open Street Maps. Rivers. 2022. Available online: https://wiki.openstreetmap.org/wiki/Rivers (accessed on 8 August 2022).
- ICNF. Índice de Aridez 1980/2010 (Aridity Index). Portugal, May 2012. Available online: https://geocatalogo.icnf.pt/metadados/aridez_1980_2010.html (accessed on 8 October 2023).
- Royer, A.C.; de Figueiredo, T.; Fonseca, F.; de Araújo Schütz, F.C.; Hernández, Z. Tendências de mudança na precipitação e na susceptibilidade à seca avaliada pelo Índice de Precipitação Normalizada (SPI) no nordeste de Portugal. Territorium 2021, 18, 13–26. [Google Scholar] [CrossRef]
- Agroconsultores and Coba. Carta dos Solos do Nordeste de Portugal (Soil Map of Northeast Portugal); UTAD: Vila Real, Portugal, 1991. [Google Scholar]
- Figueiredo, T.D. Aplicação da Equação Universal de Perda de Solo na Estimativa da Erosão Potencial: O caso do Parque Natural de Montesinho; Instituto Politécnico de Bragança: Bragança, Portugal, 1990; p. 87. [Google Scholar]
- Direção-Geral de Território. Land Use and Land Occupancy Cartography; Direção-Geral de Território: Lisboa, Portugal, 2007. [Google Scholar]
- Anderson, J.R.; Hardy, E.E.; Roach, J.T.; Witmer, R.E. A Land Use and Land Cover Classification System for Use with Remote Sensor Data; USGS Professional Paper Vol. 964; USA Government Printing Office: Washington, DC, USA, 1976.
- Fonseca, F.; Figueiredo, T. Carbon in soils of Montesinho Natural Park, Northeast Portugal: Preliminary map-based estimate of its storage and stability. Span. J. Rural. Dev. 2012, 3, 71–78. [Google Scholar] [CrossRef]
- Bing. Satellite image provided by Bing Maps, accessed via OpenLayers Plugin in QGIS 3.24, z. 19. 2017. Available online: www.bing.com/maps (accessed on 8 October 2023).
- International Standard ISO 10694; ISO Soil Quality—Determination of Organic and Total Carbon after Dry Combustion (Elementary Analysis). International Organization for Standardization: Geneva, Switzerland, 1995.
- Tate, K.R.; Giltrap, D.J.; Claydon, J.J.; Newsome, P.F.; Atkinson, I.A.E.; Taylor, M.D.; Lee, R. Organic carbon stocks in New Zealand’s terrestrial ecosystems. J. R. Soc. N. Z. 1997, 27, 315–335. [Google Scholar] [CrossRef]
- Fonseca, F.; Figueiredo, F.; Vilela, A.; Santos, R.; Carvalho, A.L.; Eliane, A.; Nunes, L. Impact of tree species replacement on carbon stocks in a Mediterranean mountain area, NE Portugal. For. Ecol. Manag. 2019, 439, 181–188. [Google Scholar] [CrossRef]
- Ayres, M.; Ayres Júnior, M.; Ayres, D.L.; Santos, A.A. Bioestat 5.0: Aplicações Estatísticas nas Áreas das Ciências Bio-Médicas; ONG Mamiraua: Belém, Brazil, 2007; Available online: https://www.mamiraua.org.br/ (accessed on 8 October 2023).
- Gibson, A.; Hancock, G.; Bretreger, D.; Cox, T.; Hughes, J.; Kunkel, V. Assessing digital elevation model resolution for soil organic carbon prediction. Geoderma 2021, 398, 115106. [Google Scholar] [CrossRef]
- Li, Y.; Liu, X.; Xu, W.; Bongers, F.J.; Bao, W.; Chen, B.; Chen, G.; Guo, K.; Lai, J.; Lin, D.; et al. Effects of diversity, climate and litter on soil organic carbon storage in subtropical forests. For. Ecol. Manag. 2020, 476, 118479. [Google Scholar] [CrossRef]
- Moura-Bueno, J.M.; Dalmolin, R.S.D.; Horst-Heinen, T.Z.; Grunwald, S.; Caten, A. Environmental covariates improve the spectral predictions of organic carbon in subtropical soils in southern Brazil. Geoderma 2021, 393, 114981. [Google Scholar] [CrossRef]
- Feng, Y.; Chen, S.; Tong, X.; Lei, Z.; Gao, C.; Wang, J. Modeling changes in China’s 2000–2030 carbon stock caused by land use change. J. Clean. Prod. 2020, 252, 119659. [Google Scholar] [CrossRef]
- Soleimani, A.; Hosseini, S.M.; Massah Bavani, A.R.; Jafari, M.; Francaviglia, R. Simulating soil organic carbon stock as affected by land cover change and climate change, Hyrcanian forests (northern Iran). Sci. Total Environ. 2017, 599–600, 1646–1657. [Google Scholar] [CrossRef]
- Fryer, J.; Williams, I.D. Regional carbon stock assessment and the potential effects of land cover change. Sci. Total Environ. 2021, 775, 145815. [Google Scholar] [CrossRef]
- Bell, J.L. Type reducing correspondences and well-orderings: Frege’s and Zermelo’s constructions re-examined. J. Symb. Log. 1995, 60, 209–221. [Google Scholar] [CrossRef]
- Mohseni, N.; Salar, Y.S. Terrain indices control the quality of soil total carbon stock within water erosion-prone environments. Ecohydrol. Hydrobiol. 2021, 21, 46–54. [Google Scholar] [CrossRef]
- Dharumarajan, S.; Kalaiselvi, B.; Suputhra, A.; Lalitha, M.; Vasundhara, R.; Kumar, K.A.; Nair, K.; Hegde, R.; Singh, S.; Lagacherie, P. Digital soil mapping of soil organic carbon stocks in Western Ghats, South India. Geoderma Reg. 2021, 25, e00387. [Google Scholar] [CrossRef]
- Conrad, O.; Bechtel, B.; Bock, M.; Dietrich, H.; Fischer, E.; Gerlitz, L.; Wehberg, J.; Wichmann, V.; Böhner, J. System for Automated Geoscientific Analyses (SAGA) v. 2.3.2. Geosci. Model Dev. 2015, 8. [Google Scholar] [CrossRef]
- Bhunia, G.S.; Shit, P.K.; Pourghasemi, H.R.; Edalat, M. Prediction of Soil Organic Carbon and its Mapping Using Regression Analyses and Remote Sensing Data in GIS and R. Spat. Model. GIS R Earth Environ. Sci. 2019, 429–450. [Google Scholar] [CrossRef]
- Khare, S.; Latifi, H.; Rossi, S. A 15-year spatio-temporal analysis of plant β-diversity using Landsat time series derived Rao’s Q index. Ecol. Indic. 2021, 121, 107105. [Google Scholar] [CrossRef]
- USGS. Landsat 8–9 Surface Reflectance, ID: LC08_L1TP_203031_20190222_20190308_01_T1; USGS (United States Geological Survey): Reston, VA, USA, 2019.
- Pena, S.B.; Abreu, M.M.; Magalhães, M.R.; Cortez, N. Water erosion aspects of land degradation neutrality to landscape planning tools at national scale. Geoderma 2020, 363, 114093. [Google Scholar] [CrossRef]
- Martinez-Mena, M.; Lopez, J.; Almagro, M.; Boix-Fayos, C.; Albaladejo, J. Effect of water erosion and cultivation on the soil carbon stock in a semiarid area of South-East Spain. Soil Tillage Res. 2008, 99, 119–129. [Google Scholar] [CrossRef]
- Guimarães, D.V.; Silva, M.L.N.; Beniaich, A.; Pio, R.; Gonzaga, M.I.S.; Avanzi, J.C.; Bispo, D.F.A.; Curi, N. Dynamics and losses of soil organic matter and nutrients by water erosion in cover crop management systems in olive groves, in tropical regions. Soil Tillage Res. 2021, 209, 104863. [Google Scholar] [CrossRef]
- Abbas, F.; Hammad, H.M.; Ishaq, W.; Farooque, A.A.; Bakhat, H.F.; Zia, Z.; Fahad, S.; Farhad, W.; Cerdà, A. A review of soil carbon dynamics resulting from agricultural practices. J. Environ. Manag. 2020, 268, 110319. [Google Scholar] [CrossRef]
- Li, T.; Zhang, H.; Wang, X.; Cheng, S.; Fang, H.; Liu, G.; Yuan, W. Soil erosion affects variations of soil organic carbon and soil respiration along a slope in Northeast China. Ecol. Process. 2019, 8, 28. [Google Scholar] [CrossRef]
- Pourali, S.H.; Arrowsmith, C.; Chrisman, N.; Matkan, A.A.; Mitchell, D. Topography Wetness Index Application in Flood-Risk-Based Land Use Planning. Appl. Spat. Anal. Policy 2014, 9, 39–54. [Google Scholar] [CrossRef]
- Wu, Z.; Lei, S.; Bian, Z.; Huang, J.; Zhang, Y. Study of the desertification index based on the albedo-MSAVI feature space for semi-arid steppe region. Environ. Earth Sci. 2019, 78, 232. [Google Scholar] [CrossRef]
- Qi, J.; Chehbouni, A.; Huete, A.R.; Kerr, Y.H.; Sorooshian, S. A modified soil adjusted vegetation index. Remote Sens. Environ. 1994, 48, 119–126. [Google Scholar] [CrossRef]
- Hijmans, R.J. raster: Geographic Data Analysis and Modeling. R Package Version 3.3-13. 2020. Available online: https://CRAN.R-project.org/package=raster (accessed on 8 October 2023).
- R Core Team. R: A Language and Environment for Statistical Computing; R Foundation for Statistical Computing: Vienna, Austria, 2020; Available online: http://www.R-project.org (accessed on 8 October 2023).
- Kuhn, M. cCaret: Classification and Regression Training. R Package Version 6.0-86. 2020. Available online: https://CRAN.R-project.org/package=caret (accessed on 8 October 2023).
- Richardson, H.J.; Hill, D.J.; Denesiuk, D.R.; Fraser, L.H. A comparison of geographic datasets and field measurements to model soil carbon using random forests and stepwise regressions (British Columbia, Canada). GISci. Remote Sens. 2017, 54, 573–591. [Google Scholar] [CrossRef]
- Duarte-Guardia, S.; Peri, P.L.; Amelung, W.; Sheil, D.; Laffan, S.W.; Borchard, N.; Bird, M.I.; Dieleman, W.; Pepper, D.A.; Zutta, B.; et al. Better estimates of soil carbon from geographical data: A revised global approach. Mitig. Adapt. Strateg. Glob. Chang. 2018, 24, 355–372. [Google Scholar] [CrossRef]
- Somarathna, P.D.S.N.; Minasny, B.; Malone, B.P. More Data or a Better Model? Figuring Out What Matters Most for the Spatial Prediction of Soil Carbon. Soil Sci. Soc. Am. J. 2017, 81, 1413–1426. [Google Scholar] [CrossRef]
- Malone, B.P.; Minasny, B.; McBratney, A.B. Using R for Digital Soil Mapping; Springer: Berlin/Heidelberg, Germany, 2017. [Google Scholar] [CrossRef]
- Vestergaard, R.J.; Vasava, H.B.B.; Aspinall, D.; Chen, S.; Gillespie, A.; Adamchuk, V.; Biswas, A. Evaluation of Optimized Preprocessing and Modeling Algorithms for Prediction of Soil Properties Using VIS-NIR Spectroscopy. Sensors 2021, 21, 6745. [Google Scholar] [CrossRef] [PubMed]
- Zhang, D. A coefficient of determination for generalized linear models. Am. Stat. 2017, 71, 310–316. [Google Scholar] [CrossRef]
- Chai, T.; Draxler, R.R. Root mean square error (RMSE) or mean absolute error (MAE). Geosci. Model Dev. Discuss. 2014, 7, 1525–1534. [Google Scholar] [CrossRef]
- Neill, S.P.; Hashemi, M.R. Ocean modelling for resource characterization. In Fundamentals of Ocean Renewable Energy; Neill, S.P., Hashemi, M.R., Eds.; Academic Press: Cambridge, MA, USA, 2018; pp. 193–235. [Google Scholar] [CrossRef]
- Fonseca, F.; de Figueiredo, T.; Ramos, M.A.B. Carbon storage in the Mediterranean upland shrub communities of Montesinho Natural Park, northeast of Portugal. Agrofor. Syst. 2012, 86, 463–475. [Google Scholar] [CrossRef]
- Novara, A.; Rühl, J.; La Mantia, T.; Gristina, L.; La Bella, S.; Tuttolomondo, T. Litter contribution to soil organic carbon in the processes of agriculture abandon. Solid Earth 2015, 6, 425–432. [Google Scholar] [CrossRef]
- Dou, X.; Hu, T.; Köster, K.; Sun, A.; Li, G.; Yue, Y.; Sun, L.; Ding, Y.; Hu, T. Temporal dynamics of soil dissolved organic carbon in temperate forest managed by prescribed burning in Northeast China. Environ. Res. 2023, 237, 117065. [Google Scholar] [CrossRef] [PubMed]
- Leifeld, J.; Bassin, S.; Fuhrer, J. Carbon stocks in Swiss agricultural soils predicted by land-use, soil characteristics, and altitude. Agric. Ecosyst. Environ. 2005, 105, 255–266. [Google Scholar] [CrossRef]
- Cai, Q.; Ji, C.; Zhou, X.; Bruelheide, H.; Frang, W.; Fang, J. Changes in carbon storages of Fagus forest ecosystems along an elevational gradient on Mt. Fanjingshan Southwest China J. Plant Ecol. 2020, 13, 139–149. [Google Scholar] [CrossRef]
- Shaheen, H.; Saeed, Y.; Abbasi, M.K.; Khaliq, A. Soil Carbon Stocks Along an Altitudinal Gradient in Different Land-Use Categories in Lesser Himalayan Foothills of Kashmir. Eurasian Soil Sci. 2017, 50, 432–437. Available online: https://link.springer.com/article/10.1134/S106422931704010X (accessed on 15 April 2018). [CrossRef]
- Yang, Y.; Tilman, D.; Furey, G.; Lehman, C. Soil carbon sequestration accelerated by restoration of grassland biodiversity. Nat. Commun. 2019, 10, 718. [Google Scholar] [CrossRef] [PubMed]
- Yang, S.; Cammeraat, E.; Jansen, B.; den Haan, M.; van Loon, E.; Recharte, J. Soil organic carbon stocks controlled by lithology and soil depth in a Peruvian alpine grassland of the Andes. Catena 2018, 171, 11–21. [Google Scholar] [CrossRef]
- Zhang, Y.; Li, X.; Gregorich, E.G.; McLaughlin, N.B.; Zhang, X.; Guo, Y.; Guo, Y.; Liang, A. Evaluating storage and pool size of soil organic carbon in degraded soils: Tillage effects when crop residue is returned. Soil Tillage Res. 2019, 192, 215–221. [Google Scholar] [CrossRef]
- Büchi, L.; Walder, F.; Banerjee, S.; Colombi, T.; van der Heijden, M.G.; Keller, T.; Charles, R.; Six, J. Pedoclimatic factors and management determine soil organic carbon and aggregation in farmer fields at a regional scale. Geoderma 2022, 409, 115632. [Google Scholar] [CrossRef]
- Chen, S.; Wang, W.; Xu, W.; Wang, Y.; Wan, H.; Chen, D.; Tang, Z.; Tang, X.; Zhou, G.; Xie, Z.; et al. Plant diversity enhances productivity and soil carbon storage. Proc. Natl. Acad. Sci. USA 2018, 115, 4027–4032. [Google Scholar] [CrossRef]
- Dieleman, W.I.J.; Venter, M.; Ramachandra, A.; Krockenberger, A.K.; Bird, M.I. Soil carbon stocks vary predictably with altitude in tropical forests: Implications for soil carbon storage. Geoderma 2013, 204–205, 59–67. [Google Scholar] [CrossRef]
- Patton, N.R.; Lohse, K.A.; Seyfried, M.; Will, R.; Benner, S.G. Lithology and coarse fraction adjusted bulk density estimates for determining total organic carbon stocks in dryland soils. Geoderma 2019, 337, 844–852. [Google Scholar] [CrossRef]
- Kunkel, M.L.; Flores, A.N.; Smith, T.J.; McNamara, J.P.; Benner, S.G. A simplified approach for estimating soil carbon and nitrogen stocks in semi-arid complex terrain. Geoderma 2011, 165, 1–11. [Google Scholar] [CrossRef]
- He, P.; Xu, L.; Liu, Z.; Jing, Y.; Zhu, W. Dynamics of NDVI and its influencing factors in the Chinese Loess Plateau during 2002–2018. Reg. Sustain. 2021, 2, 36–46. [Google Scholar] [CrossRef]
- Freedman, B. Environmental Ecology: The Ecological Effects of Pollution, Disturbance, and Other Stresses, 2nd ed.; Academic Press: Cambridge, MA, USA, 2005. [Google Scholar]
- Nadal-Romero, E.; Cammeraat, E.; Pérez-Cardiel, E.; Lasanta, T. How do soil organic carbon stocks change after cropland abandonment in Mediterranean humid mountain areas? Sci. Total Environ. 2016, 566–567, 741–752. [Google Scholar] [CrossRef]
- Chen, X.; Chen, H.Y.H.; Chen, C.; Ma, Z.; Searle, E.B.; Yu, Z.; Huang, Z. Effects of plant diversity on soil carbon in diverse ecosystems: A global meta-analysis. Biol. Rev. 2020, 95, 167–183. [Google Scholar] [CrossRef]
- Manfrinato, W.; Piccolo, M.D.C.; Cerri, C.C.; Bernoux, M.; Cerri, C.E.P. Monitoring carbon stocks in soil of a forest-pasture chrono sequence and determining its origin with isotope technology in Guaraqueçaba (PR), Brazil. In Proceedings of the International Symposium on Forest Carbon Sequestration And Monitoring, Taipei, Taiwan, 11–15 November 2002; pp. 142–153. [Google Scholar]
- Zhang, Q.; Duan, P.; Gunina, A.; Zhang, X.; Yan, X.; Kuzyakov, Y.; Xiong, Z. Mitigation of carbon dioxide by accelerated sequestration from long-term biochar amended paddy soil. Soil Tillage Res. 2021, 209, 104955. [Google Scholar] [CrossRef]
- Qin, Y.; Feng, Q.; Holden, N.M.; Cao, J. Variation in soil organic carbon by slope aspect in the middle of the Qilian Mountains in the upper Heihe River Basin, China. Catena 2016, 147, 308–314. [Google Scholar] [CrossRef]
- Conforti, M.; Lucà, F.; Scarciglia, F.; Matteucci, G.; Buttafuoco, G. Soil carbon stock in relation to soil properties and landscape position in a forest ecosystem of southern Italy (Calabria region). Catena 2016, 144, 23–33. [Google Scholar] [CrossRef]
- Tashi, S.; Singh, B.; Keitel, C.; Adams, M. Soil carbon and nitrogen stocks in forests along an altitudinal gradient in the eastern Himalayas and a meta-analysis of global data. Glob. Chang. Biol. 2016, 22, 2255–2268. [Google Scholar] [CrossRef]
- Lombardo, L.; Saia, S.; Schillaci, C.; Mai, P.M.; Huser, R. Modeling soil organic carbon with Quantile Regression: Dissectingpredictors’ effects on carbon stocks. Geoderma 2018, 318, 148–159. [Google Scholar] [CrossRef]
- Gomes, L.C.; Faria, R.M.; de Souza, E.; Veloso, G.V.; Schaefer, C.E.G.R.; Fernandes Filho, E.I. Modelling and mapping soil organic carbon stocks in Brazil. Geoderma 2019, 340, 337–350. [Google Scholar] [CrossRef]
- Bai, Y.; Zhou, Y. The main factors controlling spatial variability of soil organic carbon in a small karst watershed, Guizhou Province, China. Geoderma 2020, 357, 113938. [Google Scholar] [CrossRef]
- Dignac, M.F.; Derrien, D.; Barre, P.; Barot, S.; Cécillon, L.; Chenu, C.; Chevallier, T.; Freschet, G.T.; Garnier, P.; Guenet, B.; et al. Increasing soil carbon storage: Mechanisms, effects of agricultural practices and proxies. A review. Agron. Sustain. Dev. 2017, 37, 14. [Google Scholar] [CrossRef]
- Galka, B.; Labaz, B.; Bogacz, A.; Bojko, O.; Kabala, C. Conversion of Norway spruce forests will reduce organic carbon pools in the mountain soils of SW Poland. Geoderma 2014, 213, 287–295. [Google Scholar] [CrossRef]
- Mayer, M.; Prescott, C.E.; Abaker, W.E.; Augusto, L.; Cécillon, L.; Ferreira, G.W.; James, J.; Jandl, R.; Katzensteiner, K.; Laclau, J.-P.; et al. Tamm Review: Influence of forest management activities on soil organic carbon stocks: A knowledge synthesis. For. Ecol. Manag. 2020, 466, 118127. [Google Scholar] [CrossRef]
- Li, B.B.; Li, P.P.; Yang, X.M.; Xiao, H.B.; Xu, M.X.; Liu, G.B. Land-use conversion changes deep soil organic carbon stock in the Chinese Loess Plateau. Land Degrad. Dev. 2021, 32, 505–517. [Google Scholar] [CrossRef]
- Hürlimann, M.; Guo, Z.; Puig-Polo, C.; Medina, V. Impacts of future climate and land cover changes on landslide susceptibility: Regional scale modelling in the Val d’Aran region (Pyrenees, Spain). Landslides 2022, 19, 99–118. [Google Scholar] [CrossRef]
- Panagos, P.; Katsoyiannis, A. Soil erosion modelling: The new challenges as the result of policy developments in Europe. Environ. Res. 2019, 172, 470–474. [Google Scholar] [CrossRef]
- Marland, G.; Pielke, R.A.; Apps, M.; Avissar, R.; Betts, R.A.; Davis, K.J.; Frumhoff, P.C.; Jackson, S.T.; Joyce, L.A.; Kauppi, P.; et al. The climatic impacts of land surface change and carbon management, and the implications for climate-change mitigation policy. Clim. Policy 2003, 3, 149–157. [Google Scholar] [CrossRef]
- Hermoso, V.; Regos, A.; Morán-Ordóñez, A.; Duane, A.; Brotons, L. Tree planting: A double-edged sword to fight climate change in an era of megafires. Glob. Chang. Biol. 2021, 27, 3001–3003. [Google Scholar] [CrossRef]
- Francaviglia, R.; Renzi, G.; Doro, L.; Parras-Alcántara, L.; Lozano-García, B.; Ledda, L. Soil sampling approaches in Mediterranean agro-ecosystems. Influence on soil organic carbon stocks. CATENA 2017, 158, 113–120. [Google Scholar] [CrossRef]
- Gregg, R.; Elias, J.; Alonso, I.; Crosher, I.; Muto, P.; Morecroft, M. Carbon Storage and Sequestration by Habitat: A Review of the Evidence, 2nd ed.; Natural England Research Report NERR094; Natural England: York, UK, 2021. [Google Scholar]
- Hawkins, C.V.; Wang, X. Sustainable development governance: Citizen participation and support networks in local sustainability initiatives. Public Work. Manag. Policy 2012, 17, 7–29. [Google Scholar] [CrossRef]
- Yang, L.; He, X.; Shen, F.; Zhou, C.; Zhu, A.X.; Gao, B.; Chen, Z.; Li, M. Improving prediction of soil organic carbon content in croplands using phenological parameters extracted from NDVI time series data. Soil Tillage Res. 2020, 196, 104465. [Google Scholar] [CrossRef]
- Deumlich, D.; Ellerbrock, R.H.; Frielinghaus, M. Estimating carbon stocks in young moraine soils affected by erosion. Catena 2018, 162, 51–60. [Google Scholar] [CrossRef]
- Wang, J.; Werner, D.; Manning, D.A. A framework for integrating the terrestrial carbon stock of estates in institutional carbon management plans. Soil Use Manag. 2021, 38, 1172–1188. [Google Scholar] [CrossRef]
- Mona, S.; Malyan, S.K.; Saini, N.; Deepak, B.; Pugazhendhi, A.; Kumar, S.S. Towards sustainable agriculture with carbon sequestration, and greenhouse gas mitigation using algal biochar. Chemosphere 2021, 275, 129856. [Google Scholar] [CrossRef]
- Domingos, T.; Valada, T.; Martins, H. Desenvolvimento sustentável e serviços de ecossistema na agricultura em Portugal: Uma abordagem geral e o caso das pastagens semeadas biodiversas. In Sustentabilidade da Montanha Portuguesa: Realidades e Desafios; Instituto Politécnico: Bragança, Portugal, 2016; pp. 107–125. ISBN 978-972-745-220-0. [Google Scholar]


| Independent Variables | Description | Reference | Data Source |
|---|---|---|---|
| Elevation (m) | Digital terrain elevation, obtained from SRTM. | Moura-Bueno et al., 2021 [45] | SRTM 1 Arc-Second (~30 m), USGS [29] |
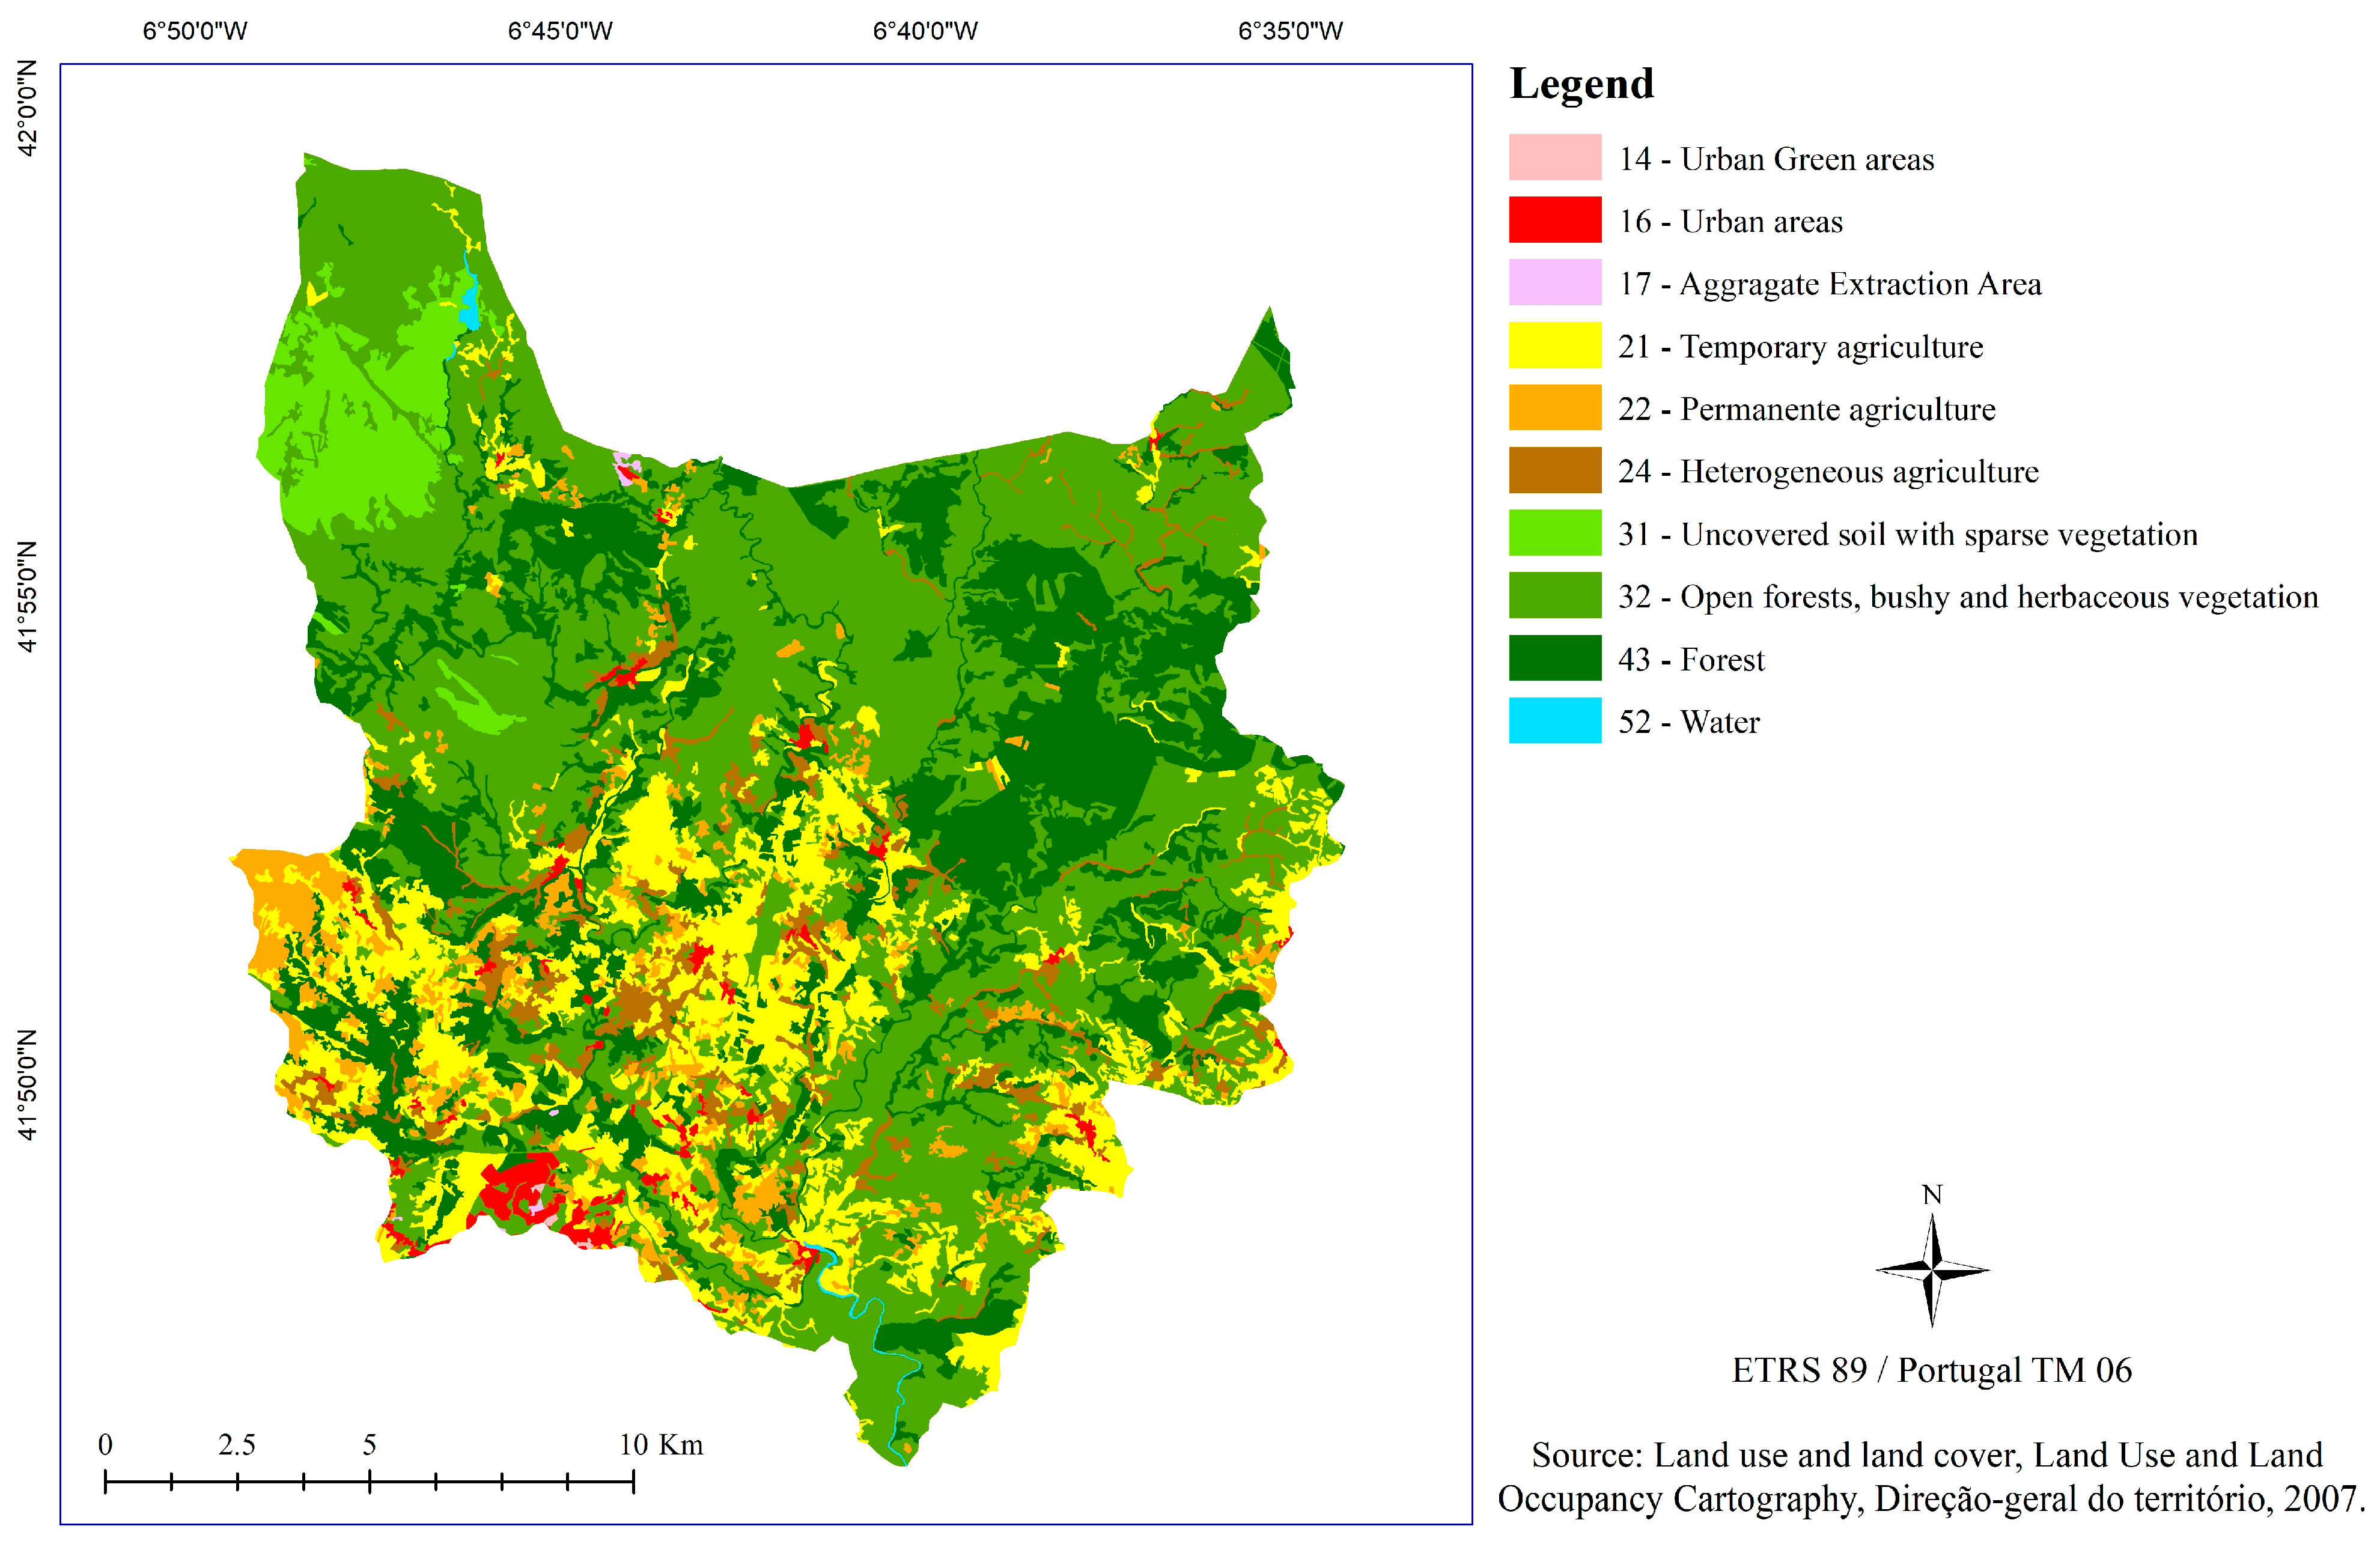
| Land use and land cover (LULC) | Vectorization of land use and occupation for the year 2007. | Feng et al., 2020 [46] Soleimani et al., 2017 [47] Fryer and Williams, 2021 [48] | Diretório-Geral do Território, 2007 [35] |
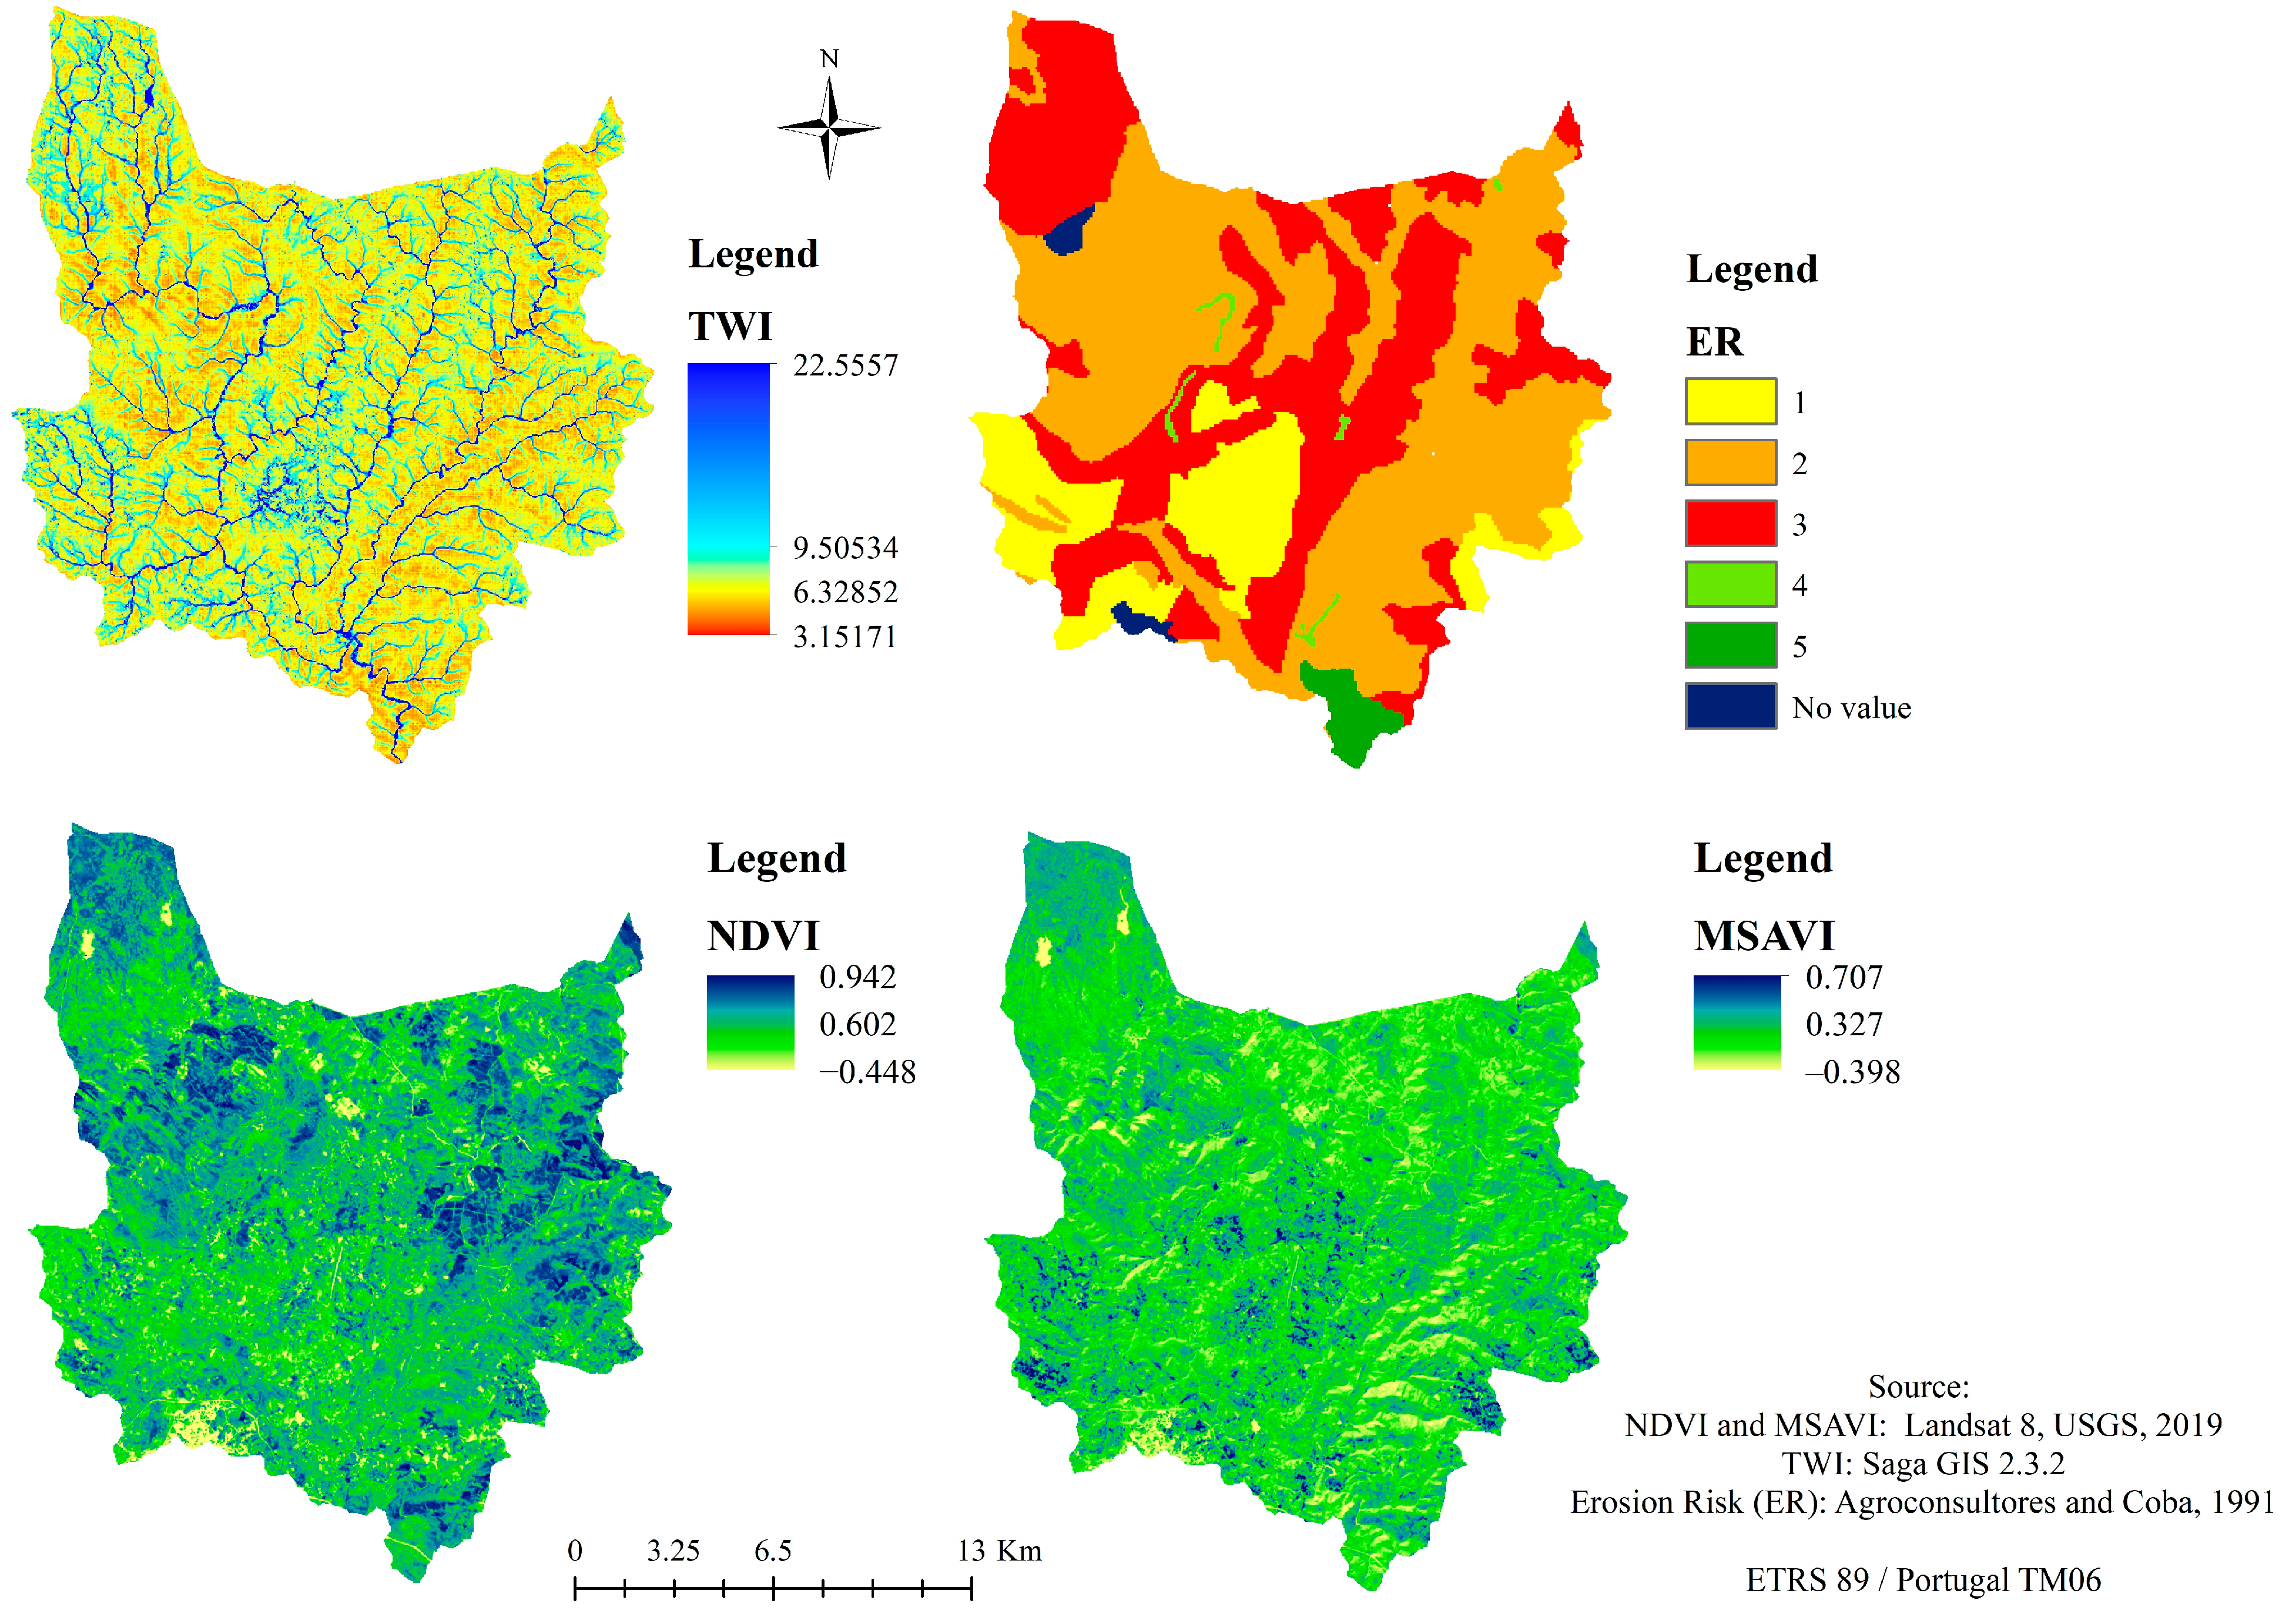
| Topographic wetness index (TWI) | TWI starts from a relationship between the basin area and slope to determine soil moisture conditions at distinct positions in the area, which can affect the erosive power of runoff. | Bell, 1995 [49] Mohseni and Salar, 2021 [50] Dharumarajan et al., 2021 [51] | Saga GIS 2.3.2 [52] |
| Normalized difference vegetation index (NDVI) | The NDVI is used to evaluate the health of vegetation: positive values for vegetation, values close to zero for rocks and bare soil, and negative for water, cloud, and snow. | Bhunia et al., 2019 [53] Khare et al., 2021 [54] | Landsat 8, USGS, 2019 [55] |
| Modified soil-adjusted vegetation index (MSAVI) | MSAVI is a hybrid vegetation index, with values ranging from 1 to −1, applied to areas with a high degree of exposed ground surface. | ||
| Erosion risk (ER) | Erosion risk refers to the probability of soil loss through erosive processes. | Pena et al., 2020 [56] Martínez-Mena et al., 2008 [57] Guimarães et al., 2021 [58] Abbas et al., 2020 [59] Li et al., 2019 [60] | Agroconsultores and Coba, 1991 [33] |
| LULC Code 1 | LULC Classes 1 | Nomenclature of Land Use and Occupancy Cartography 2 |
|---|---|---|
| 14 | Transportation, Communications and Utilities. | Urban green spaces, sports, cultural and leisure equipment, and historic areas |
| 16 | Mixed Urban or Built-up Land. | Urban land |
| 17 | Other Urban or Built-up Land. | Aggregate extraction areas, waste disposal areas and construction sites |
| 21 | Cropland and Pasture. | Temporary crops |
| 22 | Orchards, groves, vineyards, nurseries, and ornamental horticultural areas. | Permanent crops |
| 24 | Other agricultural land. | Heterogeneous agricultural areas |
| 31 | Herbaceous rangeland. | Uncovered areas with little vegetation |
| 32 | Shrub and brush rangeland. | Open forests, bushy, and herbaceous vegetation |
| 43 | Mixed Forest Land. | Forest |
| 52 | Lakes | Inland waters |
| Regression Model | Reference |
|---|---|
| Linear (bi- and multivariate) | Bhunia et al., 2019 [53] |
| Linear multivariate with stepwise | Richardson, Hill, Denesiuk and Fraser, 2017 [67] Bhunia et al., 2019 [53] |
| Partial Least Squares (PLS) | Duarte-Guardia et al., 2018 [68] |
| Random Forest | Richardson, Hill, Denesiuk and Fraser, 2017 [67] |
| Cubist | Somarathna, Minasny and Malone, 2017 [69] |
| Set | Independent Variables | Regression Models | |||||
|---|---|---|---|---|---|---|---|
| Elevation | LULC | ER | TWI | NDVI | MSAVI | ||
| 1 | x | Linear | |||||
| 2 | x | ||||||
| 3 | x | ||||||
| 4 | x | x | x | Random Forest | |||
| 5 | x | x | x | x | x | ||
| 6 | x | x | x | x | x | x | Linear multivariate. Linear multivariate with stepwise. PLS. Random Forest. Cubist. |
| Soil Layer (cm) | Set 1 | Set 2 | Set 3 | |||
|---|---|---|---|---|---|---|
| RMSE (Mg C ha−1) | R2 | RMSE (Mg C ha−1) | R2 | RMSE (Mg C ha−1) | R2 | |
| 0–5 | 5.72 | 0.55 * | 5.95 | 0.51 * | 6.31 | 0.56 * |
| 5–10 | 4.84 | 0.68 * | 5.43 | 0.57 * | 5.57 | 0.60 * |
| 10–20 | 8.53 | 0.61 * | 9.02 | 0.53 * | 9.50 | 0.53 * |
| 20–30 | 8.20 | 0.53 * | 9.23 | 0.39 * | 9.15 | 0.55 * |
| 0–30 | 24.89 | 0.52 * | 27.17 | 0.57 * | 27.84 | 0.49 * |
| Soil Layer (cm) | Set 4 | Set 5 | ||
|---|---|---|---|---|
| RMSE (Mg C ha−1) | R2 | RMSE (Mg C ha−1) | R2 | |
| 0–5 | 5.05 | 0.64 | 5.81 | 0.52 |
| 5–10 | 4.47 | 0.63 | 5.17 | 0.50 |
| 10–20 | 7.46 | 0.67 | 8.80 | 0.59 |
| 20–30 | 7.85 | 0.66 | 8.89 | 0.44 |
| 0–30 | 20.62 | 0.77 | 25.37 | 0.63 |
| Regression Model | Soil Layer (cm) | RMSE (Mg C ha−1) | R2 |
|---|---|---|---|
| Linear multivariate | 0–5 | 5.64 | 0.65 |
| 5–10 | 4.68 | 0.52 | |
| 10–20 | 8.08 | 0.61 | |
| 20–30 | 8.09 | 0.54 | |
| 0–30 | 24.21 | 0.59 | |
| Linear multivariate with Stepwise | 0–5 | 5.22 | 0.64 |
| 5–10 | 4.68 | 0.64 | |
| 10–20 | 7.87 | 0.61 | |
| 20–30 | 8.02 | 0.64 | |
| 0–30 | 22.96 | 0.62 | |
| Random Forest | 0–5 | 5.08 | 0.67 |
| 5–10 | 4.4 * | 0.63 | |
| 10–20 | 7.35 * | 0.68 | |
| 20–30 | 7.88 | 0.56 | |
| 0–30 | 19.83 * | 0.70 | |
| PLS | 0–5 | 5.43 | 0.54 |
| 5–10 | 4.69 | 0.62 | |
| 10–20 | 8.19 | 0.65 | |
| 20–30 | 8.15 | 0.55 | |
| 0–30 | 23.56 | 0.69 | |
| Cubist | 0–5 | 4.85 * | 0.66 |
| 5–10 | 4.4 | 0.61 | |
| 10–20 | 7.99 | 0.70 | |
| 20–30 | 7.76 * | 0.62 | |
| 0–30 | 21.9 | 0.72 |
Disclaimer/Publisher’s Note: The statements, opinions and data contained in all publications are solely those of the individual author(s) and contributor(s) and not of MDPI and/or the editor(s). MDPI and/or the editor(s) disclaim responsibility for any injury to people or property resulting from any ideas, methods, instructions or products referred to in the content. |
© 2023 by the authors. Licensee MDPI, Basel, Switzerland. This article is an open access article distributed under the terms and conditions of the Creative Commons Attribution (CC BY) license (https://creativecommons.org/licenses/by/4.0/).
Share and Cite
Patrício, M.B.; Lado, M.; de Figueiredo, T.; Azevedo, J.C.; Bueno, P.A.A.; Fonseca, F. Carbon Storage Patterns and Landscape Sustainability in Northeast Portugal: A Digital Mapping Approach. Sustainability 2023, 15, 16853. https://doi.org/10.3390/su152416853
Patrício MB, Lado M, de Figueiredo T, Azevedo JC, Bueno PAA, Fonseca F. Carbon Storage Patterns and Landscape Sustainability in Northeast Portugal: A Digital Mapping Approach. Sustainability. 2023; 15(24):16853. https://doi.org/10.3390/su152416853
Chicago/Turabian StylePatrício, Matheus B., Marcos Lado, Tomás de Figueiredo, João C. Azevedo, Paulo A. A. Bueno, and Felícia Fonseca. 2023. "Carbon Storage Patterns and Landscape Sustainability in Northeast Portugal: A Digital Mapping Approach" Sustainability 15, no. 24: 16853. https://doi.org/10.3390/su152416853
APA StylePatrício, M. B., Lado, M., de Figueiredo, T., Azevedo, J. C., Bueno, P. A. A., & Fonseca, F. (2023). Carbon Storage Patterns and Landscape Sustainability in Northeast Portugal: A Digital Mapping Approach. Sustainability, 15(24), 16853. https://doi.org/10.3390/su152416853