
Mineral Resource Abundance: An Assessment Methodology for a Responsible Use of Mineral Raw Materials in Downstream Industries

 ,
, 
Abstract
:1. Introduction
2. Mineral Resource Abundance: Spheres of Influence and Skill
2.1. Why Do We Exploit Mineral Resources?
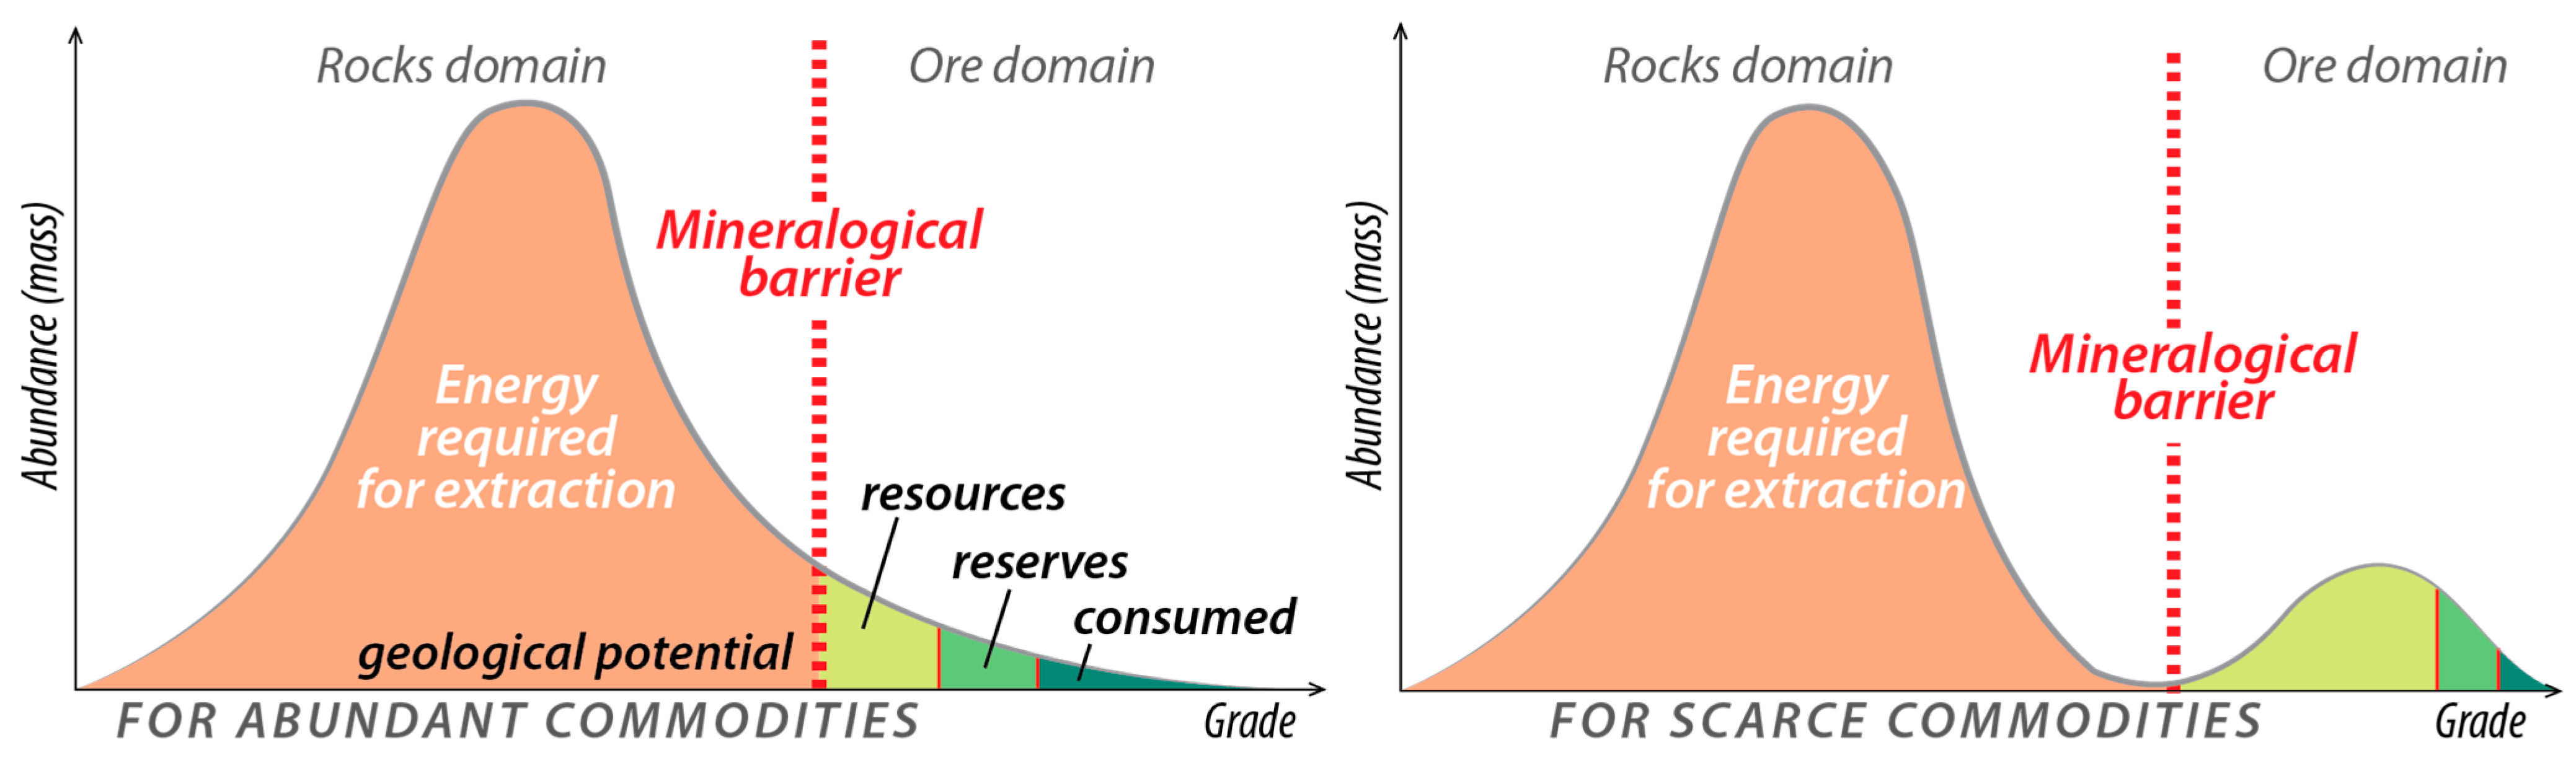
2.2. Mineral Resource Abundance, Scarcity, and Depletion: Optimism or Pessimism?
- Optimists [40,41,47,48,49,50,51,52,53]: based on the opportunity cost paradigm. All authors do not deny the progressive depletion of mineral resources but consider that human beings are sufficiently ingenious to meet the challenges of such depletion. Thus, as demand outstrips supply, costs will rise in tandem with the pressure to find substitutes or alternatives to less abundant mineral resources. Recycling is also a strong theme of the so-called optimistic authors. Thus, according to them, the geological stock or geopotential [27,54,55,56] is gigantic, and it will always be possible to extract mineral resources but at a higher cost.
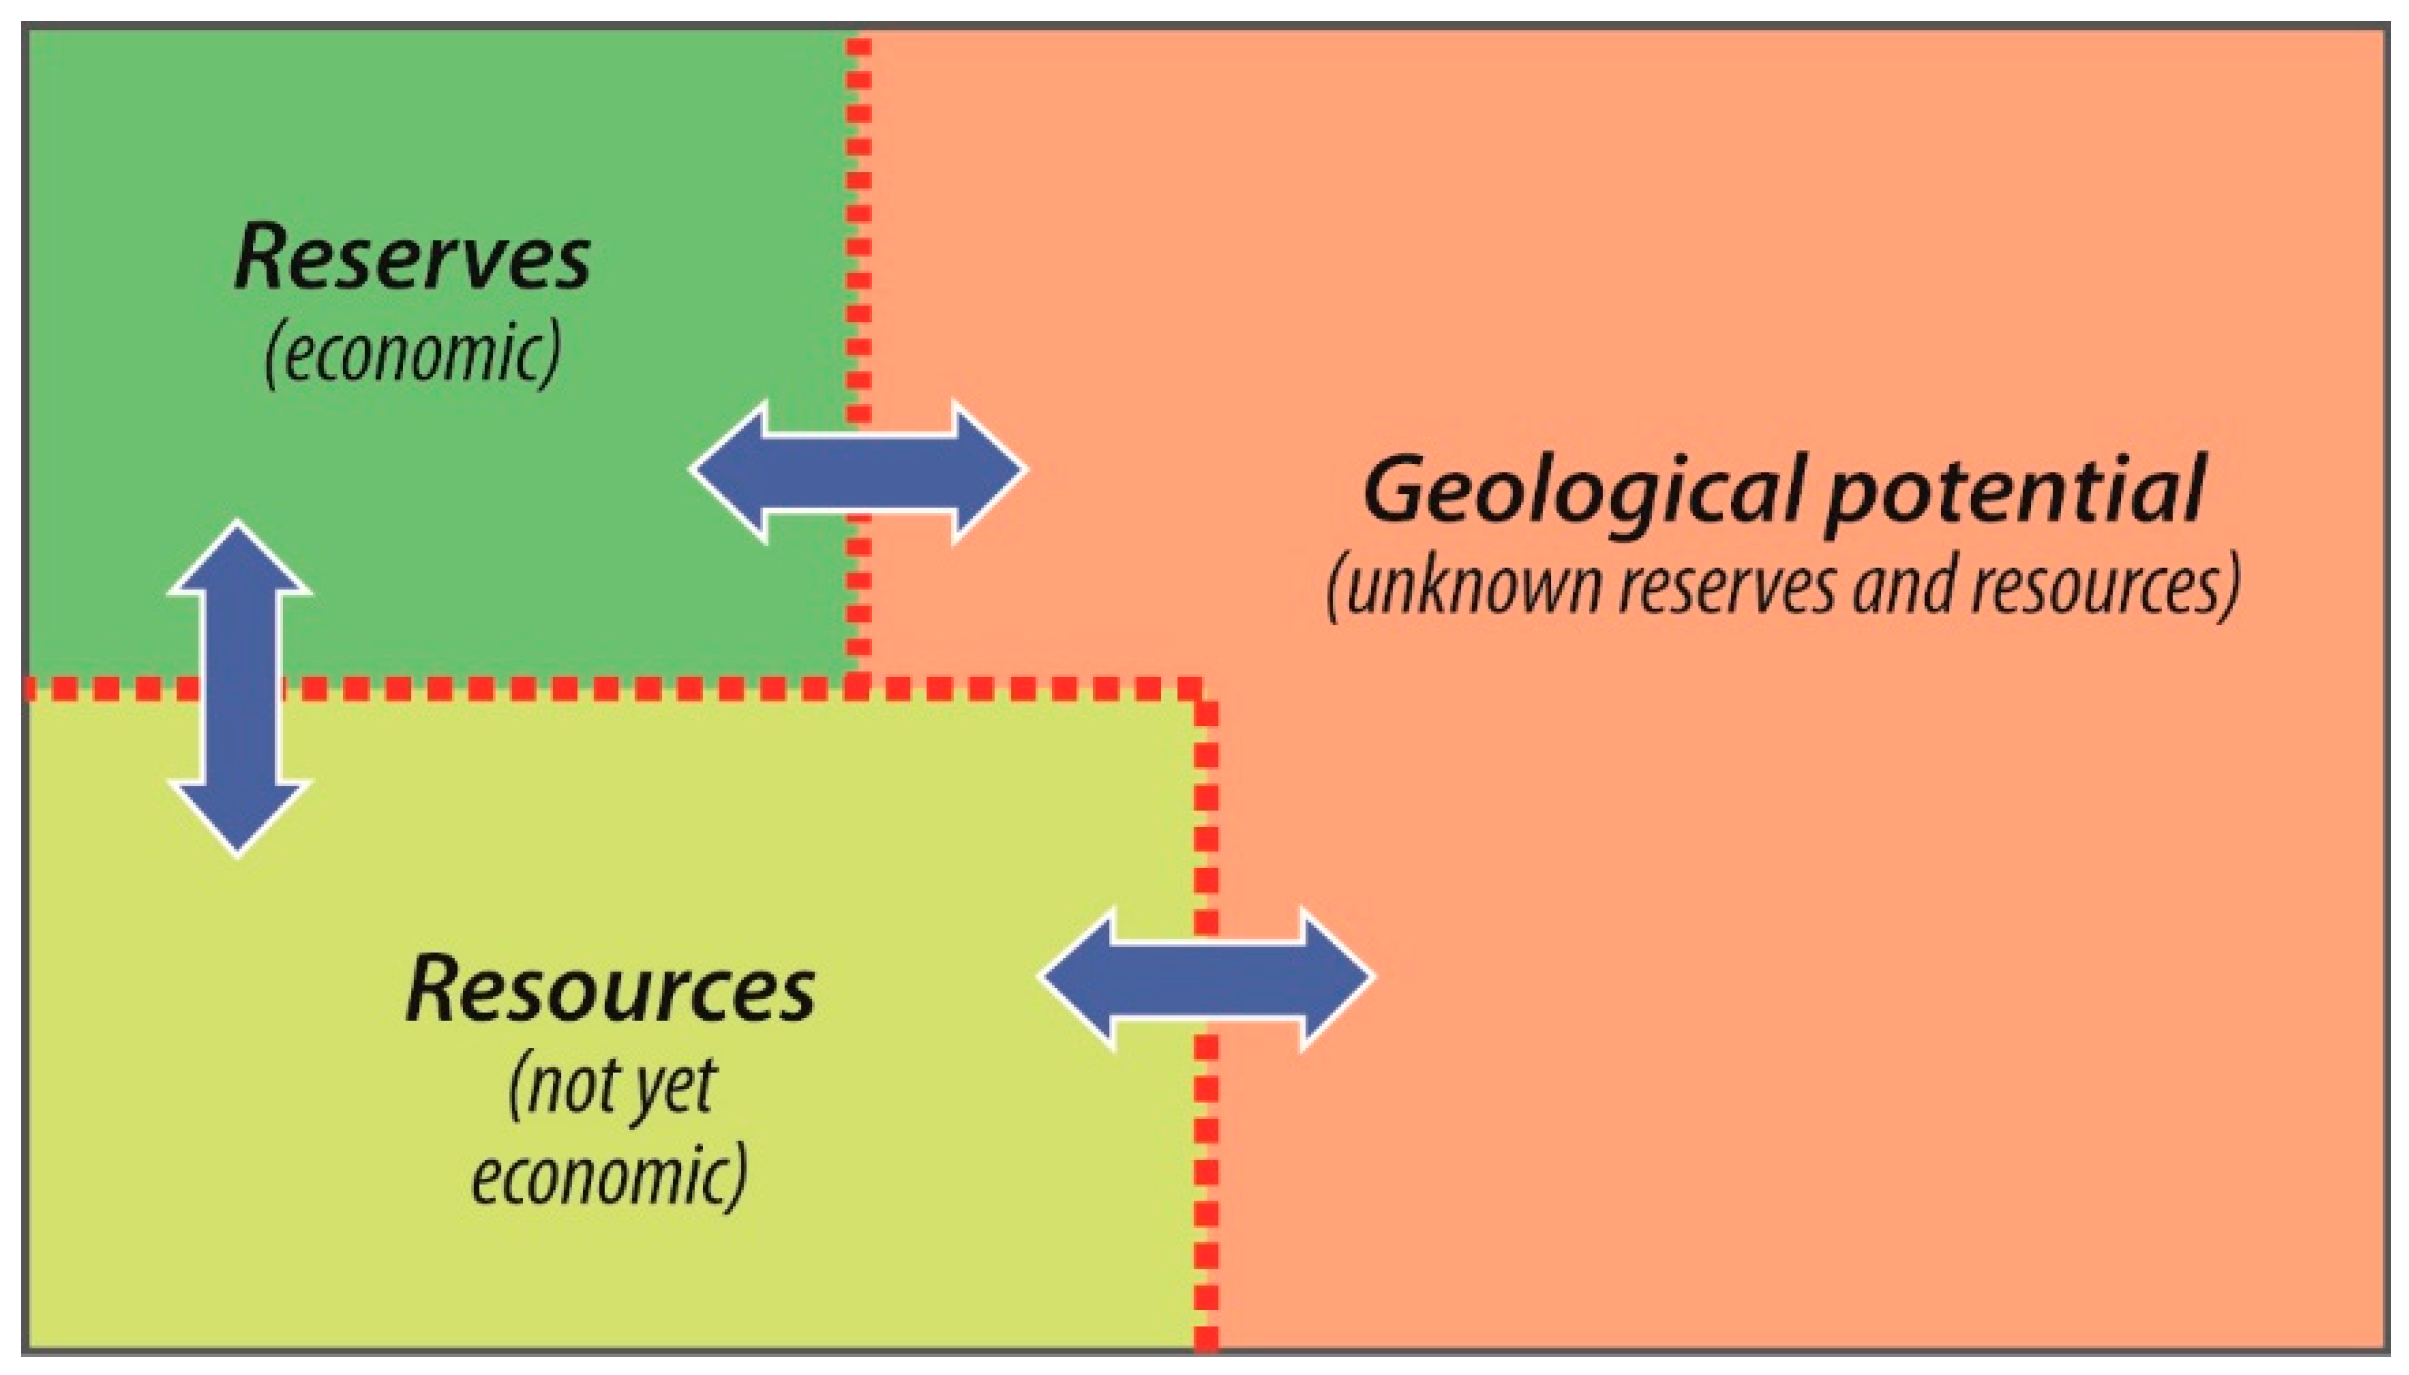
2.3. Concepts of Geological Potential, Resources, and Reserves
- A domain where the mineral substances of interest contained in the rocks (very low content and high abundance) are inaccessible from an economic and/or technical point of view because they require too much energy (can be assimilated pro parte to the geological potential area);
- A domain where mineral substances of interest are contained in ores (high grade and low abundance) that are economically viable to mine and constitute deposits (can be assimilated to the resource and reserve area).
2.4. Defining Scarcity/Abundance: Spheres of Influence and Skill
3. A Mineral Resource Abundance Definition Adapted to the Sustainable Development Challenges of Downstream Industries
3.1. Literal Definition
3.2. Defining Spheres of Criteria for Assessing the Mineral Abundance Index
- Geological (physical scarcity) related to the resources of the geosphere;
- Economic (economic scarcity) related to the resources of the technical–economic sphere.
- Geosphere: physical (natural) mineral raw material abundance defined according to criteria independent of technical–economic aspects;
- Technical–economic sphere: economic mineral raw material abundance defined according to technical and economic criteria related to the available techniques used to extract the useful commodities, as well as the associated economic, accessibility, and environmental constraints;
- Socio-epistemic sphere: mineral raw material abundance defined according to prospective criteria, which constrains/motivates innovation for substitution and recycling development.

| Sphere | Criterion | ||
|---|---|---|---|
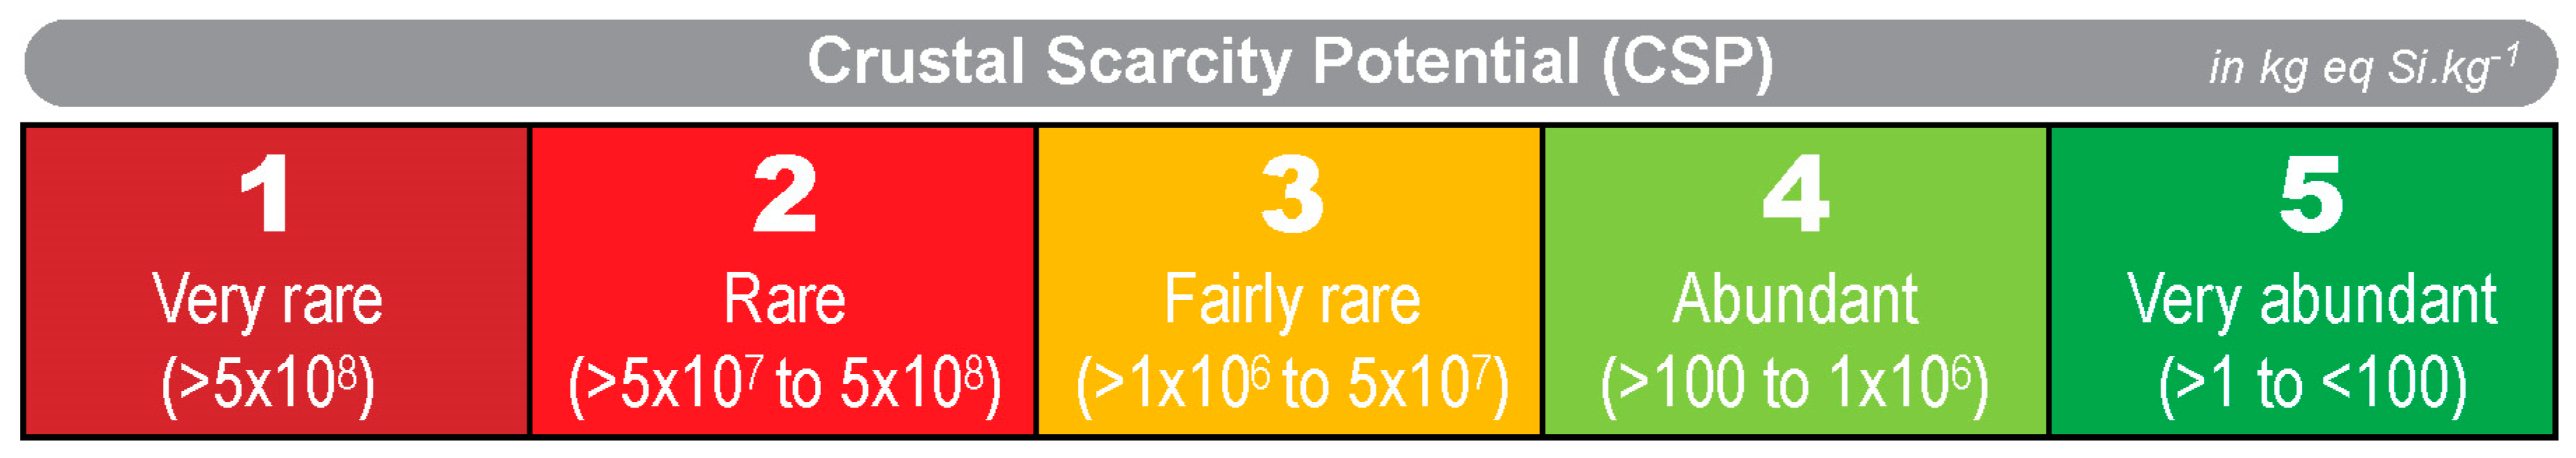
| Geosphere G (30 %) | Physical (natural) mineral abundance defined by criteria independent of technical and economic aspects | Crustal scarcity potential (CSP) 30% | Expresses the average concentration of a chemical element in the Earth’s crust compared to the average concentration of silicon (the most abundant element in the crust). |
| Energy required for extraction, treatment and separation of element (E) 50% | Expresses the energy value required to produce 1 kg of an element through its extraction, processing and separation and based mainly on the strength of chemical bonds within ore. | ||
| Enrichment factor (FE) 20% | Expresses the factor to be applied to the average crustal concentration of an element to sufficiently enrich a portion of the crust to form a deposit. | ||
| Technical-economic sphere TE (40 %) | Economic mineral abundance defined by technical-economic criteria linked to the techniques used and available to extract the useful commodities, as well as the associated economic, accessibility and environmental constraints | Years of known reserves (TR) 30% | Expresses the number of years remaining in the exploitation of a commodity for a given annual global production. |
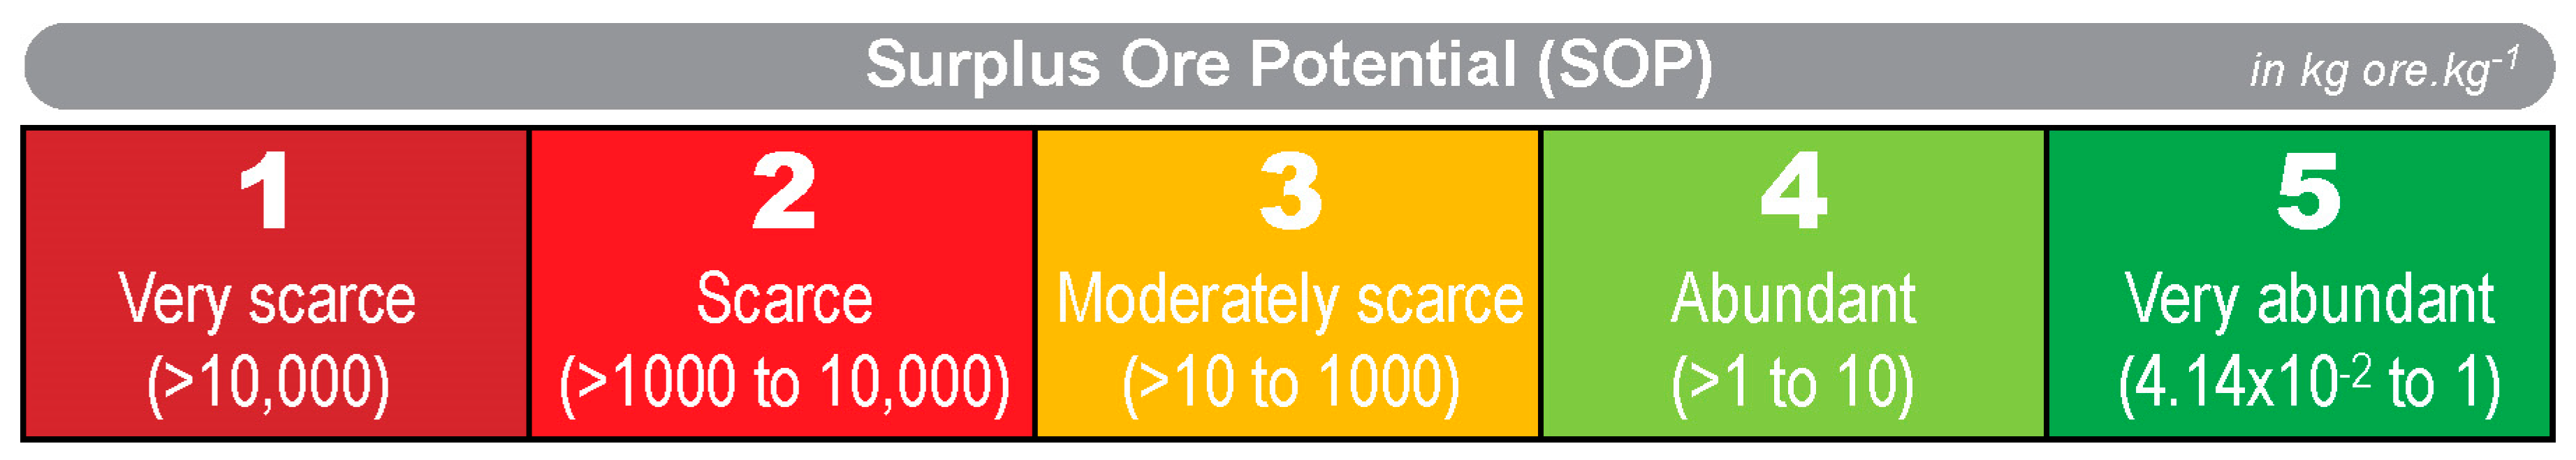
| Surplus ore potential (SOP) 20% | Expresses the increased quantity of ore to be extracted in order to compensate for the drop in the ore grade mined over time. | ||
| Resources accessibility per country (AR) 25% With 5 sub-criteria (AR1 to AR5) | Expresses the degree of accessibility to mineral resources by producing countries, which contribute at least 80% of the world production of a commodity. | ||
| Environmental impact (ENV) 25% With 2 sub-criteria (ENV1 and ENV2) | Qualifies the environmental impact of the mineral processing used to extract a commodity, as well as the environmental performance of countries that contribute at least 80% of the global production of this commodity. | ||
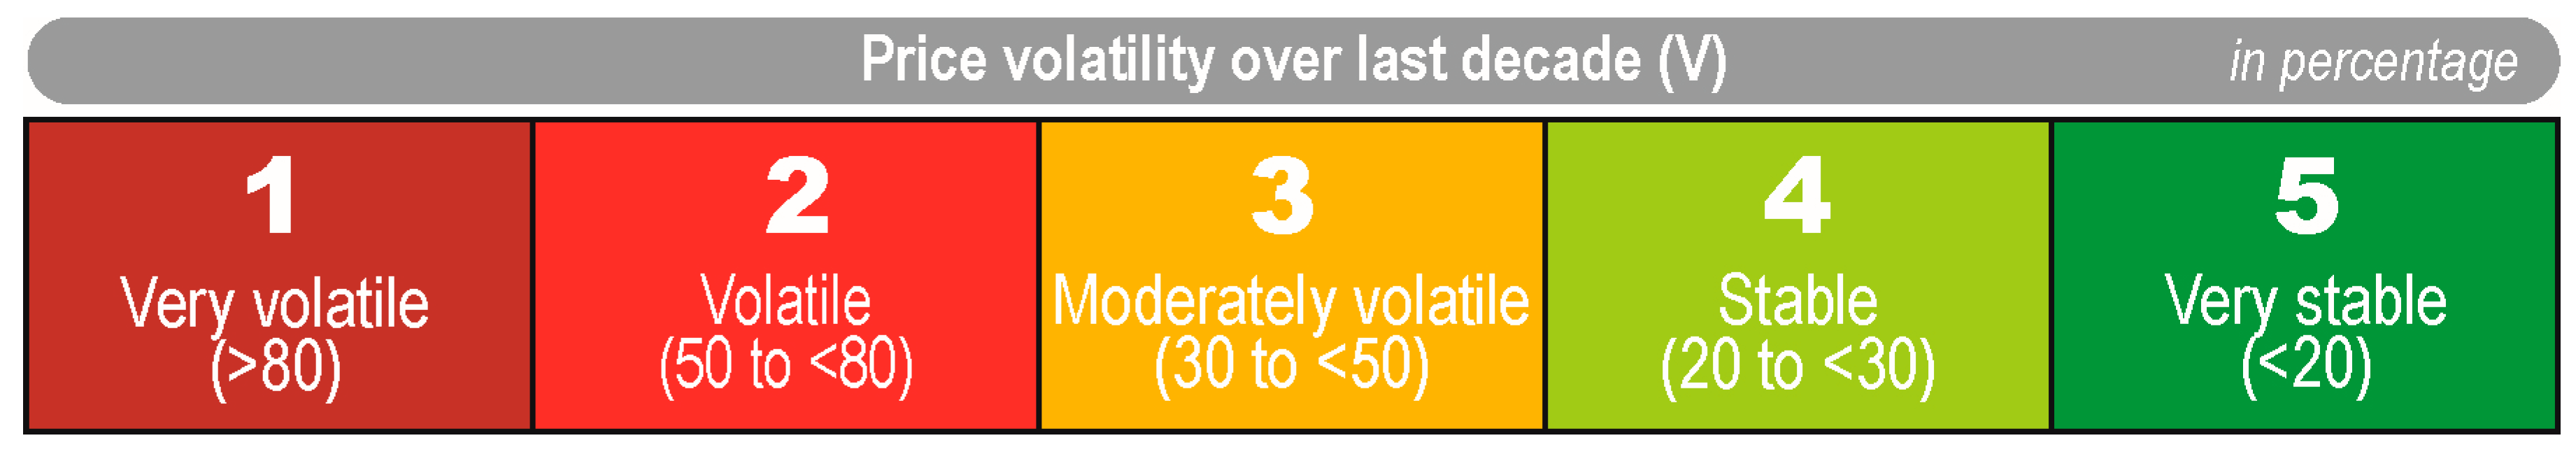
| Socio-epistemic sphere SE (30 %) | Mineral abundance defined by forward-looking criteria linked to the commodity markets, which will constrain/motivate innovation for purposes of substitution and development of recycling | Price volatility over last decade (V) 20% | Qualifies the degree of price stability over the last decade. |
| Concentration index for the production (PR) 30% | Qualifies the risks of monopoly/dependence on the production of a given commodity. | ||
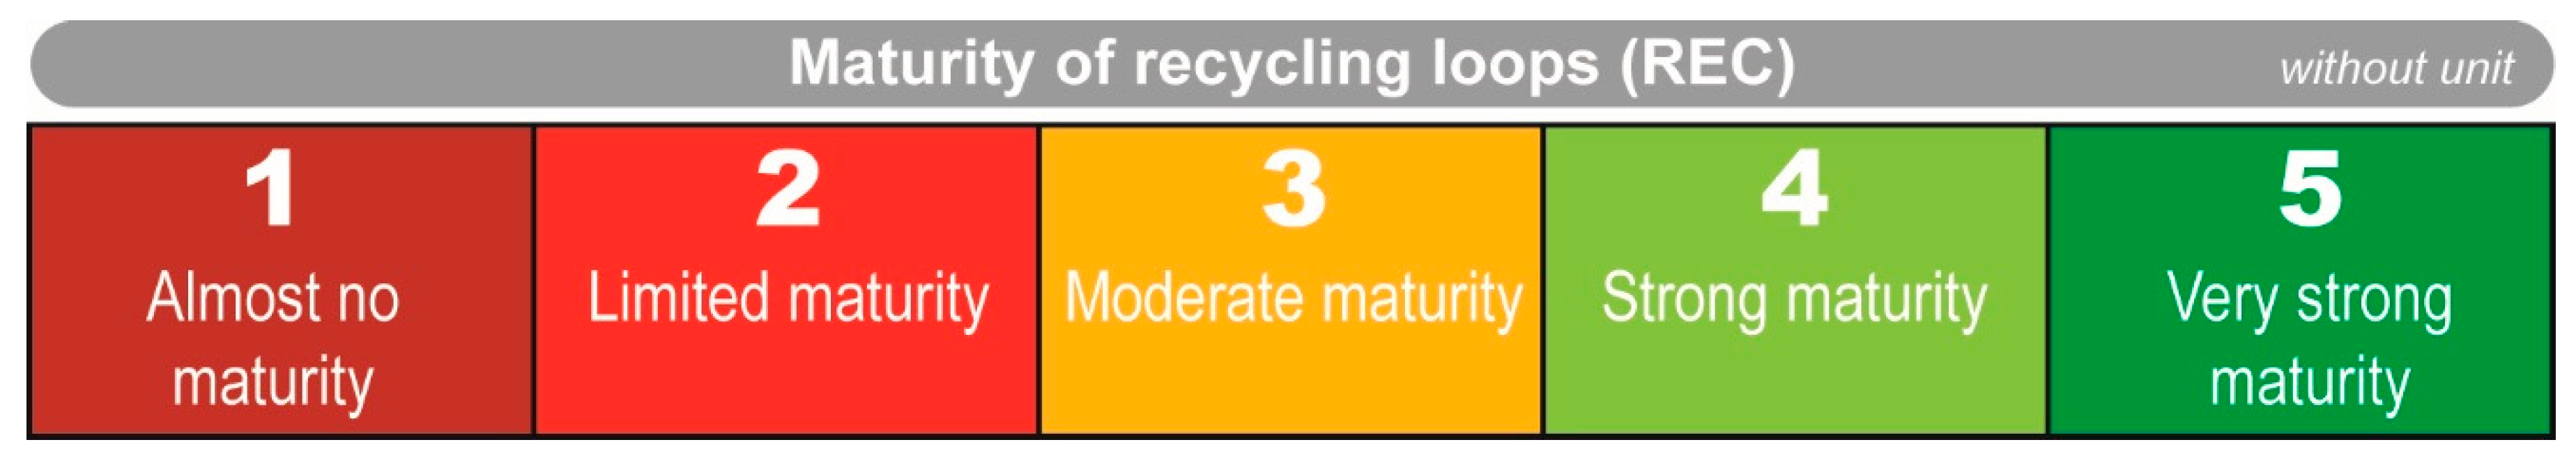
| Maturity of recycling loops (REC) 25% | Qualifies the maturity of recycling loops for a given commodity. | ||
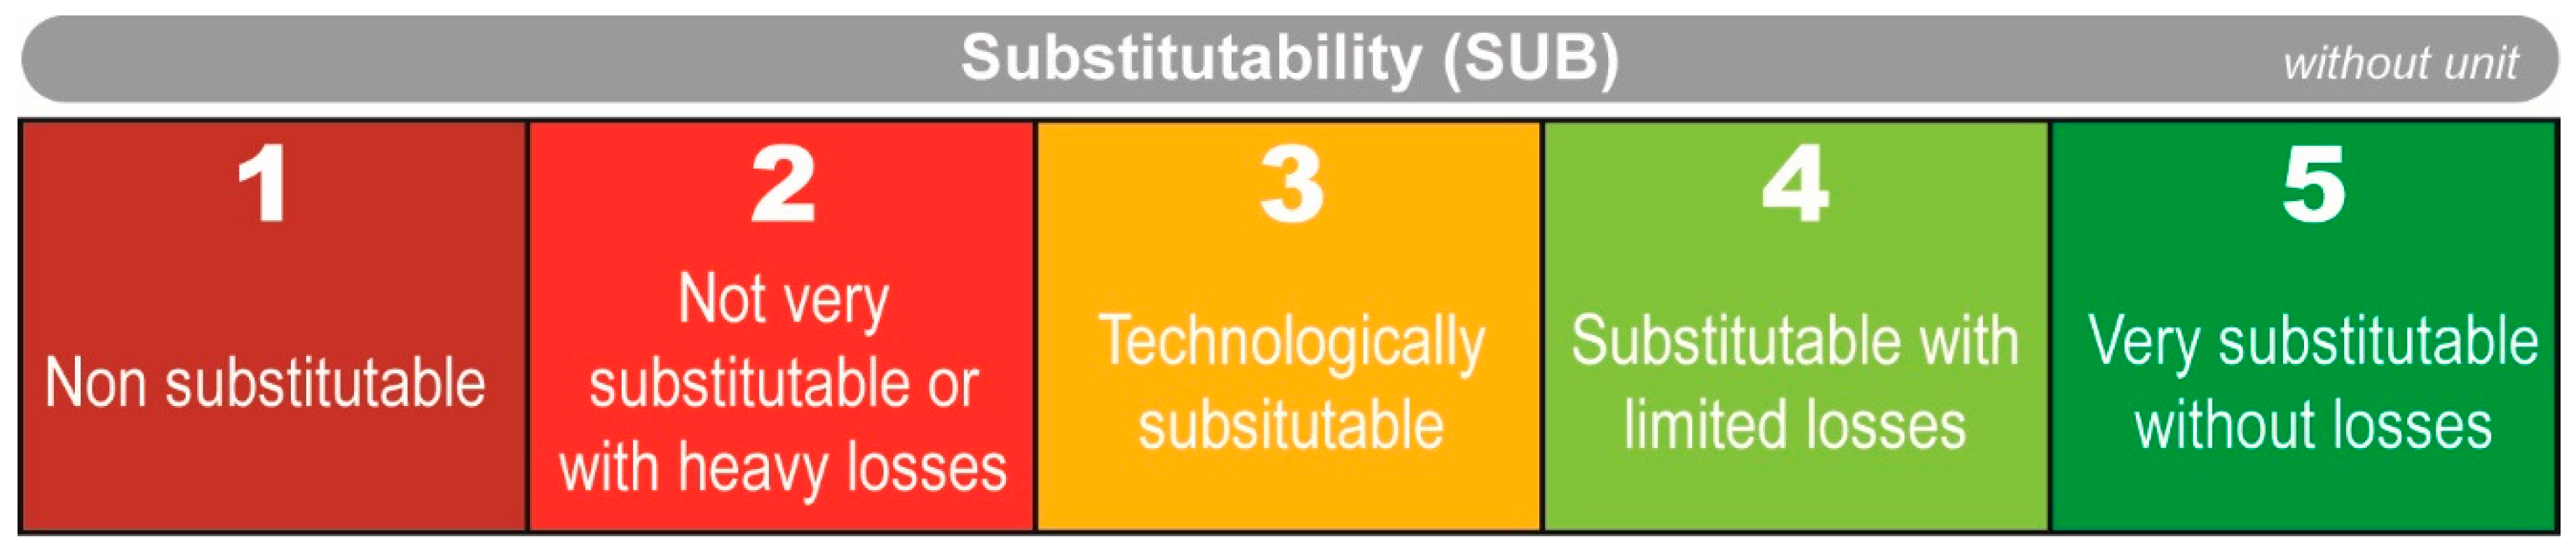
| Substitutability (SUB) 25% | Qualifies the degree of substitution of a commodity for given applications. | ||
3.3. Geosphere
3.3.1. Crustal Scarcity Potential (CSP)
- CSPx: crustal scarcity potential of element x (in kg eq Si·kg−1);
- Cx: average crustal concentration of element x (in µg·g−1 or ppm);
- CSi: average crustal concentration of the element Si (in µg·g−1 or ppm);
- CSPx expresses how much lower the average concentration of element x is than the average concentration of silicon in the Earth’s crust (in number of times).
3.3.2. Energy Required for Extraction, Treatment, and Separation of Element (E)
3.3.3. Enrichment Factor (FE)
- = enrichment factor for commodity x (without unit);
- = average content of a deposit of commodity x (in % or g·t−1);
- = average crustal concentration (Clarke) of an element x (in ppm = 0.0001% = g·t−1 = µg·g−1).
3.4. Technical–Economic Sphere
3.4.1. Years of Known Reserves (TR)
- Technological developments: unconventional deposits may become exploitable thanks to new techniques that make it possible to extract, process, and separate the useful commodity;
- Economic conditions: the price of a useful commodity varies over time and may lead to the profitability of previously unknown deposits or motivate the continuation/initiation of exploration surveys;
- Geological knowledge acquired during mining exploration may lead to the discovery of new deposits (“green field”) or extensions to known deposits (“brown field”) and thus help to increase resources, reserves, and, consequently, mineral resource abundance;
- The recycling rate: secondary raw materials (“urban mine”) may, in the future, make a greater contribution to increasing the reserves and resources of a given commodity and, hence, its abundance.
3.4.2. Surplus Ore Potential (SOP)
3.4.3. Resource Accessibility per Country (AR)
- Subcriterion “Political stability and Absence of violence/terrorism (AR1)”;
- Subcriterion “Regulatory restrictiveness index for mining/quarrying (AR2)”;
- Subcriterion “Government effectiveness (AR3)”;
- Subcriterion “Control of corruption (AR4)”;
- Subcriterion “Logistics performance (AR5)”.
Political Stability and Absence of Violence/Terrorism (AR1)
Regulatory Restrictiveness Index for Mining/Quarrying (AR2)
Government Effectiveness (AR3)
Control of Corruption (AR4)
Logistics Performance (AR5)
3.4.4. Environmental Impact (ENV)
- Ore processing (ENV1), where ores containing useful commodities are employed by downstream industries;
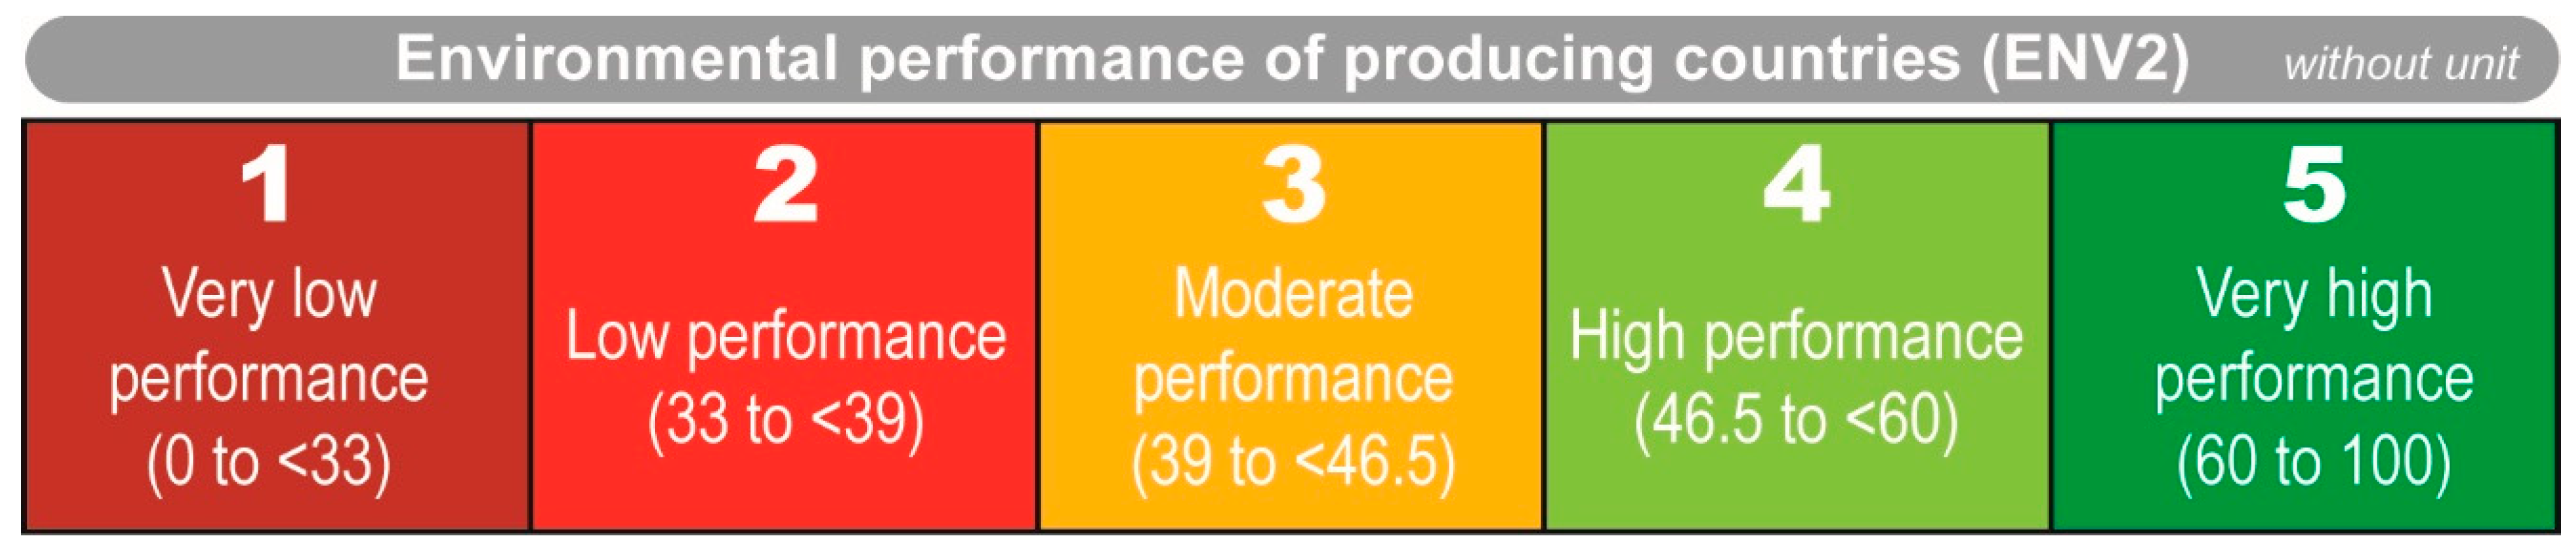
- The environmental performance of countries (ENV2), where the mineral resources, employed by downstream industries, are mined.
Ore Processing Environmental Impact (ENV1)
Environmental Performance Index (ENV2)
3.5. Socio-Epistemic Sphere
3.5.1. Price Volatility over Last Decade (V)
3.5.2. Concentration Index for the Production (PR)
3.5.3. Maturity of Recycling Loops (REC)
3.5.4. Substitutability (SUB)
4. Methodology for Assessing Mineral Resource Abundance of Commodities Used in Downstream Industries
4.1. Calculation of the Geosphere Index
- G: geosphere index value;
- P: weighting coefficient;
- V: criterion value;
- x: mineral commodity;
- i: criterion i (CSP value, E value, and FE value).
4.2. Calculation of the Technical–Economic Sphere Index
- TE: technical–economic index value;
- P: weighting coefficient;
- V: criterion value;
- x: mineral commodity;
- i: criterion i (TR value, SOP value, AR value (subcriteria AR1 to AR5), and ENV value (subcriteria ENV1 and ENV2)).
4.3. Calculation of the Socio-Epistemic Sphere Index
- SE: geosphere index value;
- P: weighting coefficient;
- V: criterion value;
- x: mineral commodity;
- i: criterion i (V value, PR value, REC value, and SUB value).
4.4. Calculation of the Mineral Abundance Index (MAI)
- MAI: mineral abundance index value;
- P: weighting coefficient;
- V: criterion value;
- x: mineral commodity;
- I: sphere I (G value, TE value, and SE value).
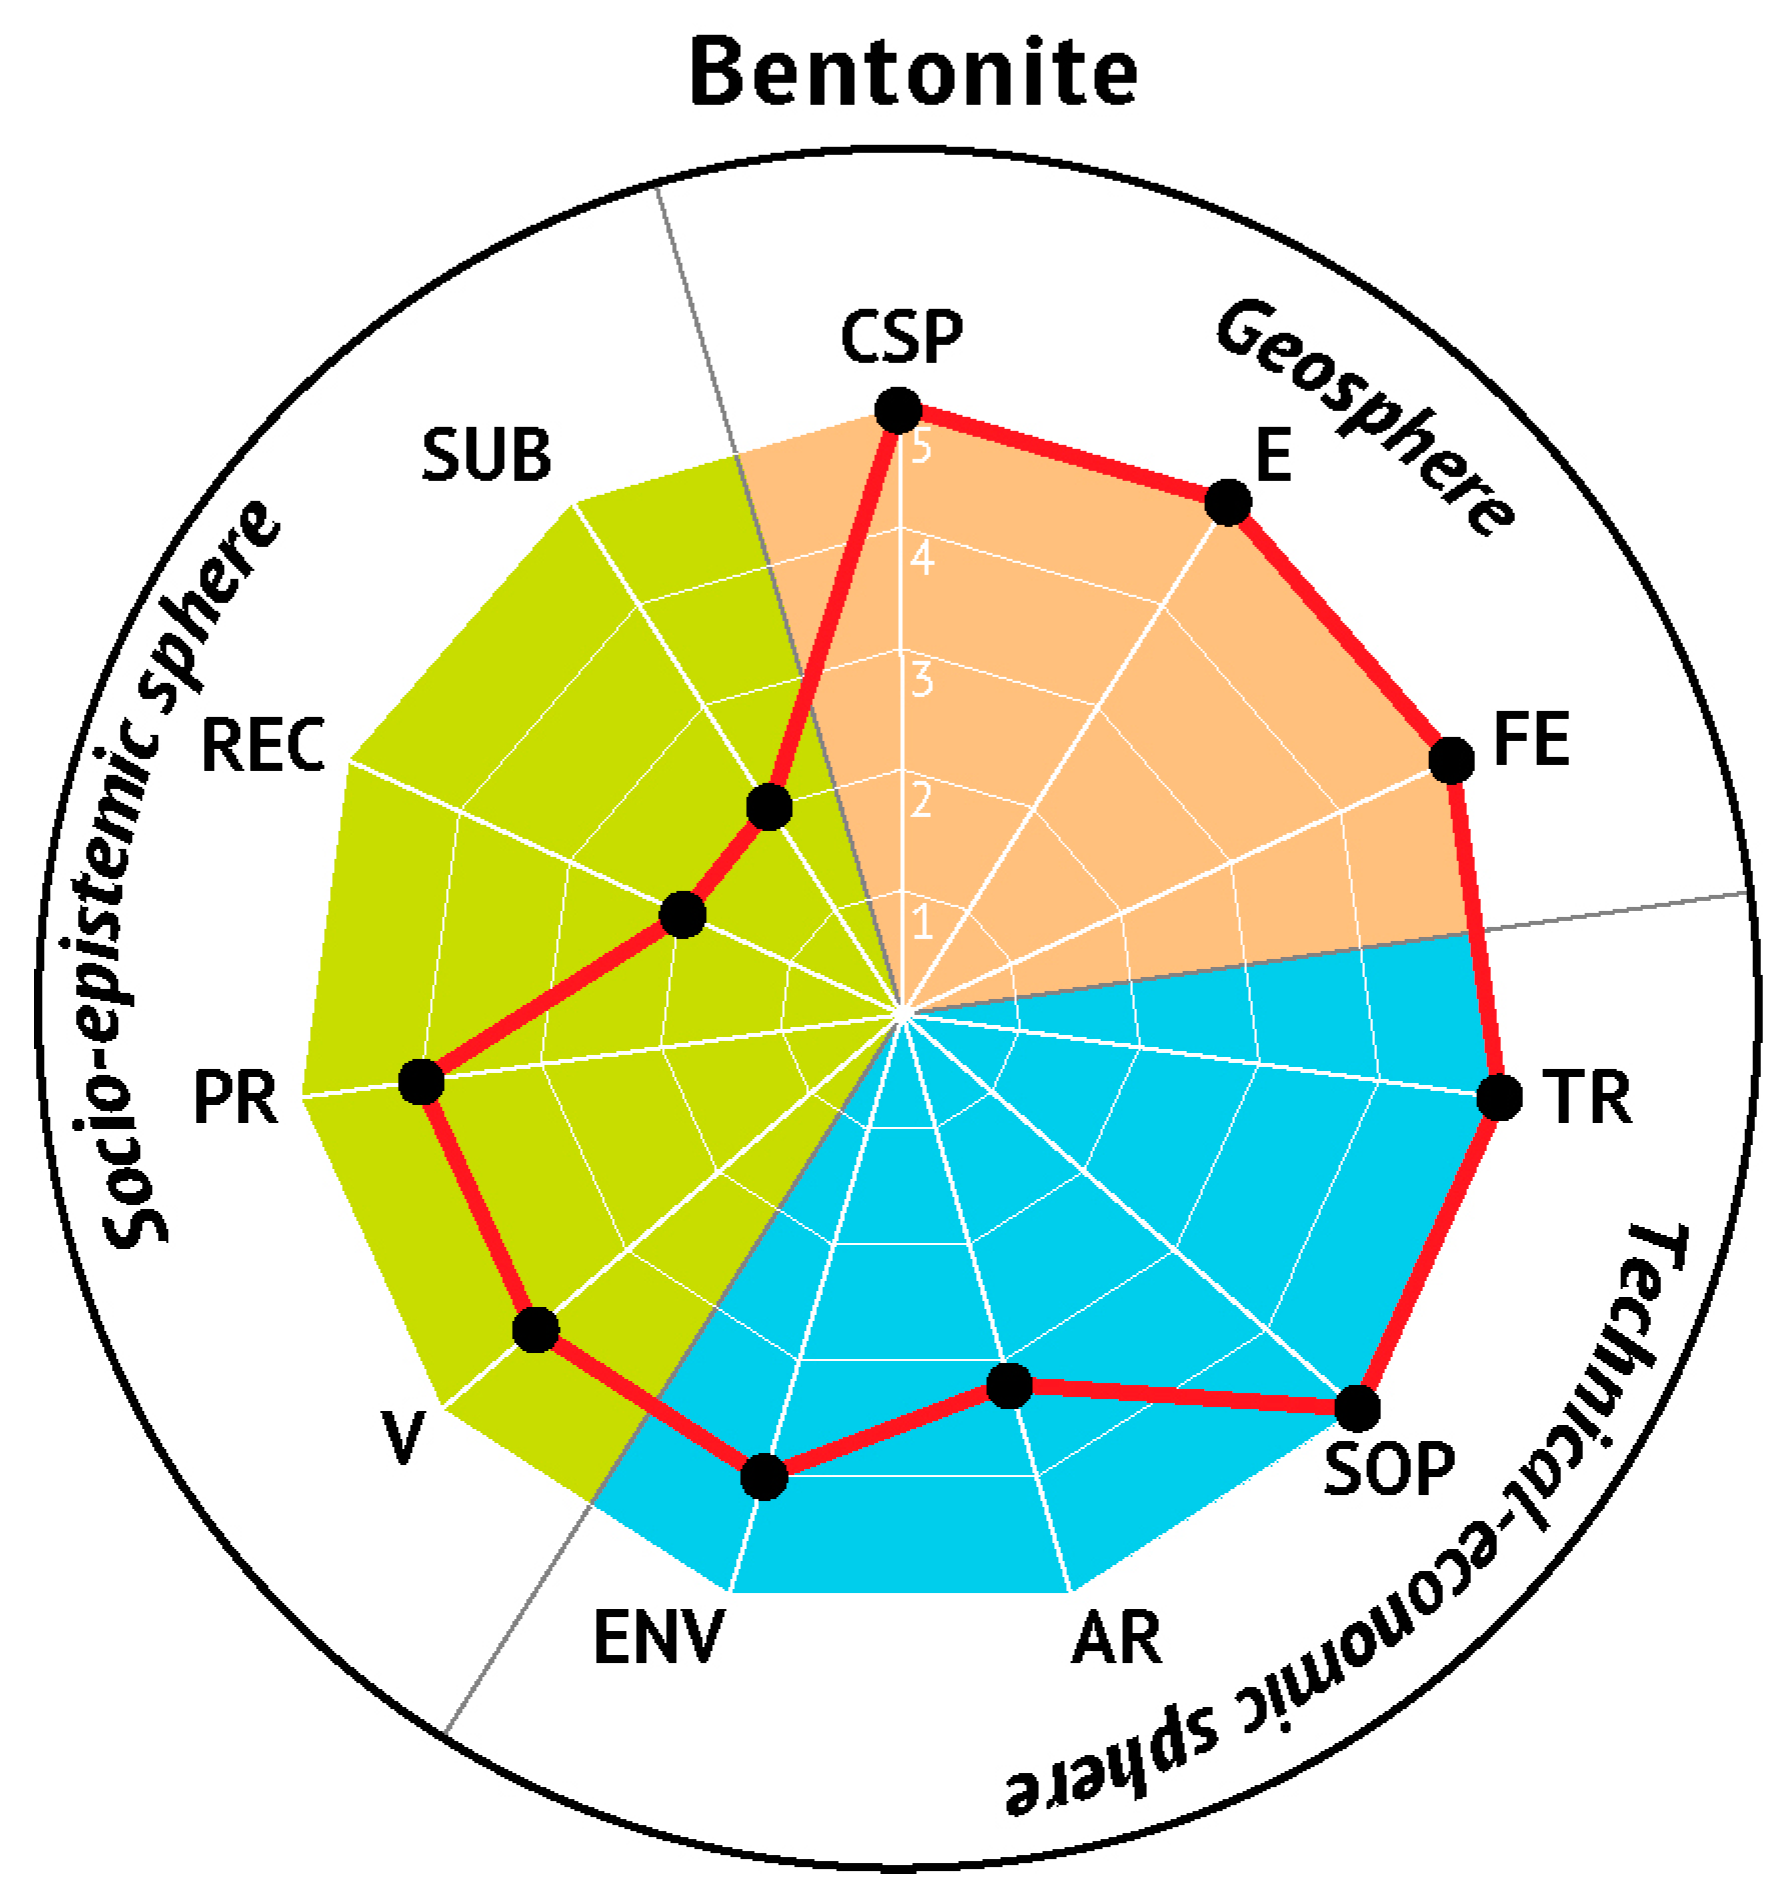
5. Example of Bentonite
5.1. Main Figures for Bentonite
5.2. Calculation of the Mineral Abundance Index (MAI) of Bentonite
6. Discussion
6.1. Limits and Challenges
6.2. What about the Link between Mineral Abundance Index and Life Cycle Analysis?
6.3. How Can the Mineral Abundance Index Promote “Green and Climate-Smart Mining” (GSCM)?
7. Conclusions
- -
- The abundance of mineral raw materials encompasses geological considerations and environmental, technical, economic, and social constraints;
- -
- An abundant mineral raw material (metal or mineral) is an inorganic species that is naturally widespread in the Earth’s crust, largely mined, and readily available on economic markets while being more or less substitutable and retaining the desired function;
- -
- To qualify the abundance of a mineral raw material used in downstream industries, the mineral abundance index (MAI) qualifies “the available quantity of a mineral raw material ingredient (metal or mineral) used in downstream industries and resulting from the transformation of a mineral raw material extracted from the Earth’s crust and available on the markets, as well as its essentiality”;
- -
- The MAI ranges from 0 (very scarce) to 100 (very abundant) and qualifies the abundance of mineral resources in a simple and rapid manner based on published and reliable data;
- -
- The MAI could be a powerful decision-making support tool for any downstream industrials and end-users making use of mineral raw materials.
Author Contributions
Funding
Institutional Review Board Statement
Informed Consent Statement
Data Availability Statement
Acknowledgments
Conflicts of Interest
References
- Achzet, B.; Reller, A.; Zepf, V.; Rennie, C.; Ashfield, M.; Simmons, J. Materials Critical to the Energy Industry: An Introduction (Report for the BP Energy Sustainability Challenge). Universität Augsburg. 2011. Available online: http://www.physik.uni-augsburg.de/lehrstuehle/rst/downloads/Materials_Handbook_Rev_2012.pdf (accessed on 15 August 2023).
- Van Schaik, A.; Reuter, M.A. Shredding, sorting and recovery of metals from WEEE: Linking design to resource efficiency. In Waste Electrical and Electronic Equipment (WEEE) Handbook; Goodship, V., Stevels, A., Eds.; Woodhead Publishing: Sawston, UK, 2012. [Google Scholar]
- Nogueira, C. Contradictions in the concept of sustainable development: An analysis in social, economic, and political contexts. Environ. Dev. 2019, 30, 129–135. [Google Scholar] [CrossRef]
- UN (United Nations). Report of the United Nations Conference on the Human Environment, Stockholm, 5–16 June 1972; Report No. A/CONF.48/14/Rev.1; UN: New York, NY, USA, 1973; 81p. [Google Scholar]
- Meadows, D.H.; Meadows, D.L.; Randers, J.S.; Behrens, W.W. The Limits to Growth; Universe Books: New York, NY, USA, 1972; 205p. [Google Scholar]
- Brundtland, G.H. Report for the World Commission on Environment and Development. Our Common Future. 1987. Available online: https://sustainabledevelopment.un.org/content/documents/5987our-common-future.pdf (accessed on 15 August 2023).
- Mitcham, C. The concept of sustainable development: Its origins and ambivalence. Technol. Soc. 1995, 17, 311–326. [Google Scholar] [CrossRef]
- UN (United Nations). Transforming Our World. The 2030 Agenda for Sustainable Development; Report No. A/RES/70/1; UN: New York, NY, USA, 2015; 41p. [Google Scholar]
- UN (United Nations). The Sustainable Development Goals Report 2021; UN: New York, NY, USA, 2021; 68p, ISBN 978-92-1-101439-6. [Google Scholar]
- Sahota, A. (Ed.) Introduction to sustainability. In Sustainability: How the Cosmetics Industry Greening Up; John Wiley & Sons: London, UK, 2014. [Google Scholar]
- Bom, S.; Jorge, J.; Ribeiro, H.M.; Marto, J. A step forward on sustainability in the cosmetics industry: A review. J. Clean. Prod. 2019, 225, 270–290. [Google Scholar] [CrossRef]
- Cao, J.; Chen, X.; Qiu, R.; Hou, S. Electric vehicle industry sustainable development with a stakeholder engagement system. Technol. Soc. 2021, 67, 101771. [Google Scholar] [CrossRef]
- Hatayama, H. The metals industry and the Sustainable Development Goals: The relationship explored based on SDG reporting. Resour. Conserv. Recycl. 2022, 178, 106081. [Google Scholar] [CrossRef]
- Luken, R.A.; Saieed, A.; Magvasi, M. Industry-related sustainable development Goal-9 progress and performance indices and policies for Sub-Saharan African countries. Environ. Dev. 2022, 42, 100694. [Google Scholar] [CrossRef]
- Hitce, J.; Xu, J.; Brossat, M.; Frantz, M.-C.; Dublanchet, A.-C.; Philippe, M.; Dalko-Csiba, M. UN sustainable development goals: How can sustainable/green chemistry contribute? Green chemistry as a source of sustainable innovations in the cosmetic industry. Curr. Opin. Green Sustain. Chem. 2018, 13, 164–169. [Google Scholar] [CrossRef]
- L’Oréal. L’Oréal for the Future. Our Sustainability Commitments for 2030. Booklet. 2020. 9p. Available online: https://www.loreal.com/-/media/project/loreal/brand-sites/corp/master/lcorp/documents-media/publications/l4f/loreal-for-the-future--booklet.pdf (accessed on 1 June 2023).
- L’Oréal. United Nations Global Compact Communication on Progress (“COP”) 2019. 2021. 47p. Available online: https://www.loreal.com/-/media/project/loreal/brand-sites/corp/master/lcorp/documents-media/publications/group/united-nations-global-compact-communication-on-progress-cop-20192020.pdf (accessed on 1 June 2023).
- Cosmetics Europe. European Trade Association for the Cosmetics and Personal Care Industry Website. 2021. Available online: https://cosmeticseurope.eu (accessed on 15 August 2023).
- Rockström, J.; Steffen, W.; Noone, K.; Persson, A.; Chapin, F.S.; Lambin, E.; Lenton, T.M.; Scheffer, M.; Folke, C.; Schellnhuber, H.J.; et al. Planetary Boundaries: Exploring the Safe Operating Space for Humanity. Ecol. Soc. 2009, 14, 32. [Google Scholar] [CrossRef]
- Steffen, W.; Richardson, K.; Rockström, J.; Cornell, S.E.; Fetzer, I.; Bennett, E.M.; Biggs, R.; Carpenter, S.R.; de Vries, W.; de Wit, C.A.; et al. Planetary boundaries: Guiding human development on a changing planet. Science 2015, 347, 1259855. [Google Scholar] [CrossRef]
- Häyhä, T.; Cornell, S.E.; Hoff, H.; Lucas, P.; van Vuuren, D. Operationalizing the Concept of a Safe Operating Space at the EU Level—First Steps and Explorations; Technical Report; Stockholm Resilience Centre: Stockholm, Sweden, 2018; 76p. [Google Scholar]
- Kolling, C.; Ribeiro, J.L.D.; Fleith de Medeiros, J. Performance of the cosmetics industry from the perspective of Corporate Social Responsibility and Design for Sustainability. Sustain. Prod. Consum. 2022, 30, 171–185. [Google Scholar] [CrossRef]
- Persson, L.; Carney Almroth, B.M.; Collins, C.D.; Cornell, S.; de Wit, C.A.; Diamond, M.L.; Fantke, P.; Hassellöv, M.; MacLeod, M.; Ryberg, M.W.; et al. Outside the Safe Operating Space of the Planetary Boundary for Novel Entities. Environ. Sci. Technol. 2022, 56, 1510–1521. [Google Scholar] [CrossRef] [PubMed]
- Anastas, P.T.; Warner, J.C. Green Chemistry, Theory and Practice; Oxford University Press: New York, NY, USA, 1998; 30p. [Google Scholar]
- Anastas, P.T.; Zimmerman, J.B. Peer Reviewed: Design Through the 12 Principles of Green Engineering. Environ. Sci. Technol. 2003, 37, 94A–101A. [Google Scholar] [CrossRef] [PubMed]
- Tang, S.; Bourne, R.A.; Smith, R.L.; Poliakoff, M. The 24 Principles of Green Engineering and Green Chemistry: “Improvements Productively”. Green Chem. 2008, 10, 268–269. [Google Scholar] [CrossRef]
- Wellmer, F.W. Reserves and resources of the geosphere, terms so often misunderstood. Is the life index of reserves of natural resources a guide to the future? Z. Dtsch. Ges. Geowiss. 2008, 159, 575–590. [Google Scholar] [CrossRef]
- Scholz, R.W.; Wellmer, F.W. Approaching a dynamic view on the availability of mineral resources: What we may learn from the case of phosphorus? Glob. Environ. Chang. 2013, 23, 11–27. [Google Scholar] [CrossRef]
- Malthus, T. An Essay on the Principles of Population; Pickering & Chatto Publishers: London, UK, 1798. [Google Scholar]
- Ricardo, D. Principles of Political Economy and Taxation; John Murray: London, UK, 1817. [Google Scholar]
- Mill, J.S. Principles of Political Economy; John W. Parker, West Strand: London, UK, 1848. [Google Scholar]
- Jevons, W.S. The Coal Question: An Inquiry Concerning the Progress of the Nation, and the Probable Exhaustion of Our Coal Mines; Flux, A.W., Ed.; Reprints of Economic Classics; Augustus M. Kelley: New York, NY, USA, 1865. [Google Scholar]
- Tilton, J.E. Depletion and the Long-run Availability of Mineral Commodities. In Proceedings of the Workshop on the Long-Run Availability of Mineral Commodities, Sponsored by Mining, Minerals, Sustainable Development Project, and Resources for the Future, Washington, DC, USA, 21–23 April 2001. [Google Scholar]
- Clarke, F.W. The relative abundance of the chemical elements. Philos. Soc. Wash. Bull. 1889, XI, 131–142. [Google Scholar]
- Taylor, S.R.; McLennan, S.M. The Continental Crust: Its Composition and Evolution; Blackwell: Oxford, UK, 1985. [Google Scholar]
- Windley, B.F. The Evolving Continents; Wiley: Hoboken, NJ, USA, 1995. [Google Scholar]
- Condie, K.C. Plate Tectonics and Crustal Evolution; Butterworth-Heinemann: Oxford, UK, 1997. [Google Scholar]
- Rudnick, R.L.; Gao, S. Composition of the Continental Crust. Treatise of Geochemistry; Elsevier: New York, NY, USA, 2003; Volume 3, pp. 1–64. [Google Scholar]
- Barnett, H.; Morse, C. Scarcity and Growth. The Economics of Natural Resource Availability; Johns Hopkins University Press, for Resources for the Future: Baltimore, MD, USA, 1963. [Google Scholar]
- Maurice, C.; Smithson, C.W. The Dooms Day Myth, 10,000 Years of Economic Crises; Hoover Institution Press, Stanford University: Stanford, CA, USA, 1984. [Google Scholar]
- Diamandis, P.H.; Kotler, S. Abundance, the Future Is Better than You Think; Free Press: New York, NY, USA, 2012. [Google Scholar]
- Meadows, D.H.; Meadows, D.L.; Randers, J. Beyond the Limits; Chelsea Green Publishing: Post Mills, VT, USA, 1992. [Google Scholar]
- Smith, K. Scarcity and Growth Reconsidered; Resources for the Future Inc.: Washington, DC, USA; John Hopkins Press, Ltd.: London, UK, 1979. [Google Scholar]
- Tilton, J.E. Exhaustible Resources and Sustainable Development: Two Different Paradigms. Resour. Policy 1996, 22, 91–97. [Google Scholar] [CrossRef]
- Tilton, J.E. On borrowed time? Assessing the threat of mineral depletion. Miner. Energy-Raw Mater. Rep. 2003, 18, 33–42. [Google Scholar] [CrossRef]
- Henckens, M.L.C.M.; Driessen, P.P.J.; Ryngaert, C.; Worrell, R. The set-up of an international agreement on the conservation and sustainable use of geologically scarce mineral resources. Resour. Policy 2016, 49, 92–101. [Google Scholar] [CrossRef]
- Hodges, C.A. Mineral resources, environmental issues and land use. Science 1995, 268, 1305–1312. [Google Scholar] [CrossRef]
- Gunn, G. Mineral Scarcity—A Non-Issue? British Geological Survey Communication: Keyworth, UK, 2011. [Google Scholar]
- Simon, J.L. Resources, population, environment: An oversupply of false bad news. Science 1980, 208, 1431–1438. [Google Scholar] [CrossRef]
- Simon, J.L. The Ultimate Resource; Princeton University Press: Princeton, NJ, USA, 1981. [Google Scholar]
- Adelman, M.A. Mineral depletion, with special reference to petroleum. Rev. Econ. Stat. 1990, 72, 1–10. [Google Scholar] [CrossRef]
- Beckerman, W. Small Is Stupid; Duckworth: London, UK, 1995. [Google Scholar]
- Lomborg, B. The Skeptical Environmentalist; Cambridge University Press: Cambridge, UK, 2001. [Google Scholar]
- McKelvey, V.E. Relation of reserves of the elements to their crustal abundance. Am. J. Sci. 1960, 258A, 234–241. [Google Scholar]
- Skinner, B.J. A second iron age ahead? Am. Sci. 1976, 64, 258–269. [Google Scholar]
- Wellmer, F.W.; Scholz, R.W. The Right to Know the Geopotential of Minerals for Ensuring Food Supply Security: The Case of Phosphorus. J. Ind. Ecol. 2015, 19, 3–6. [Google Scholar] [CrossRef]
- Kesler, S.E. Mineral Resources, Economics and the Environment; Macmillan: New York, NY, USA, 1994. [Google Scholar]
- Diederen, A. Metal Minerals Scarcity: A Call for Managed Austerity and the Elements of Hope. Netherlands Geological Survey (TNO). 2009. 13p. Available online: https://hcss.nl/wp-content/uploads/2009/03/10.03_.2009_-_Metal_minerals_scarcity_A_call_for_managed_austerity_and_the_elements_of_hope_.pdf (accessed on 15 August 2023).
- Bardi, U. Plundering the Planet; 33rd Report for the Club of Rome; The Club of Rome: Rome, Italy, 2013. [Google Scholar]
- Dasgupta, P.; Heal, G. The optimal depletion of exhaustible resources, the review of economic studies. Symp. Econ. Exhaustible Resour. 1974, 41, 3–28. [Google Scholar]
- Dasgupta, P.; Heal, G. Economic Theory and Exhaustible Resources; University Press: Cambridge, UK, 1979. [Google Scholar]
- Goodland, R. The concept of sustainability. Annu. Rev. Ecol. Syst. 1995, 26, 1–24. [Google Scholar] [CrossRef]
- Heal, G. Valuing the Future, Economic Theory and Sustainability; Columbia University Press: New York, NY, USA, 1998. [Google Scholar]
- Perman, R.; Ma, Y.; McGilvray, J.; Common, M. Natural Resource and Environmental Economics; Pearson Education Limited: London, UK, 2003. [Google Scholar]
- International Law Association. Legal Principles Relating to Climate Change, Washington Conference; International Law Association: London, UK, 2014. [Google Scholar]
- Henckens, M.L.C.M.; Driessen, P.P.J.; Worrell, E. Metal Scarcity and Sustainability, Analyzing the Necessity to Reduce the Extraction of Scarce Metals. Resour. Conserv. Recycl. 2014, 93, 1–8. [Google Scholar] [CrossRef]
- Hubbert, M.K. Nuclear Energy and Fossil Fuels; Drilling and Production Practice, Publication No. 95; Shell Development Company: Emeryville, CA, USA, 1956. [Google Scholar]
- Blondel, F.; Lasky, S.F. Mineral reserves and mineral resources. Econ. Geol. 1956, 60, 686–697. [Google Scholar] [CrossRef]
- McKelvey, V.E. Mineral resource estimates and public policy. Am. Sci. 1972, 60, 32–40. [Google Scholar]
- U.S. Bureau of Mines and U.S. Geological Survey Principles of a Resource/Reserve Classification for Minerals; USGS Circular 831; USGS: Reston, VA, USA, 1980; 5p.
- Mookherjee, A.; Panigrahi, M.K. Reserve base in relation to crustal abundance of metals: Another look. J. Geochem. Explor. 1994, 51, 1–9. [Google Scholar] [CrossRef]
- Kooroshy, J.; Meindersma, C.; Podkolinski, R.; Rademaker, M.; Sweijs, T.; Didieren, A.; Beerthuizen, M.; de Goede, S. Scarcity of Minerals—A Strategic Security Issue; The Hague Centre for Strategic Studies 2-1-10; The Hague Centre for Strategic: The Hague, The Netherlands, 2009; 148p. [Google Scholar]
- Skinner, B.J. Long Run Availability of Minerals, Keynote Talk at a Workshop “Exploring the Resource Base”; Resources for the Future: Washington, DC, USA, 2001. [Google Scholar]
- Phillips, W.G.B. Statistical estimation of global mineral resources. Resour. Policy 1977, 3, 268–280. [Google Scholar] [CrossRef]
- Van Vuuren, D.; Strengers, B.; de Vries, H. Long-term perspectives on world metal use—A system-dynamics model. Resour. Policy 1999, 25, 239–255. [Google Scholar] [CrossRef]
- North, D.C. Economic sociology and new institutional economics. In Handbook of New Institutional Economics; Menard, C., Shirley, M.M., Eds.; Springer: Paris, France, 2005. [Google Scholar]
- National Research Council (NRC). Minerals, Critical Minerals, and the U.S. Economy. Committee on Critical Mineral Impacts of the U.S. Economy, Committee on Earth Resources, National Research Council; The National Academies Press: Washington, DC, USA, 2008. [Google Scholar]
- VBW. Rohstoffsituation in Bayern: Keine Zukunft ohne Rohstoffe; Association of Bavarian Industry: Munich, Germany, 2009. [Google Scholar]
- European Commission (EU). Critical Raw Materials for the EU, Report of the Ad-Hoc Working Group on Defining Critical Raw Materials. Eucom. 39. 2010. Available online: https://ec.europa.eu/docsroom/documents/5662/attachments/1/translations (accessed on 15 August 2023).
- Erdmann, L.; Graedel, T.E. Criticality of non-fuel minerals: A review of major approaches and analyses. Environ. Sci. Technol. 2011, 45, 7620–7630. [Google Scholar] [CrossRef]
- Christmann, P.; Labbé, J.F. Notice de Réalisation et D’utilisation des Fiches de Synthèse sur la Criticité des Matières Premières Minérales Non-Énergétiques; BRGM Report No. RP-64661-FR; BRMG: Orléans, France, 2015; 61p. [Google Scholar]
- Schrijvers, D.; Hool, A.; Blengini, G.A.; Chen, W.Q.; Dewulf, J.; Eggert, R.; van Ellen, L. A review of methods and data to determine raw material criticality. Resour. Conserv. Recycl. 2020, 155, 104617. [Google Scholar] [CrossRef]
- Lapko, Y. Opening the Black Box of Material Criticality Heterogeneity and Interrelations of Companies within and across Industrial Sectors. Ph.D. Thesis, KTH Royal Institute of Technology—Politecnico di Milano, Milan, Italy, 2018; 84p. [Google Scholar]
- Graedel, T.E.; Barr, R.; Chandler, C.; Chase, T.; Choi, J.; Christoffersen, L.; Friedlander, E.; Henly, C.; Jun, C.; Nassar, N.T.; et al. Methodology of Metal Criticality Determination. Environ. Sci. Technol. 2012, 46, 1063–1070. [Google Scholar] [CrossRef] [PubMed]
- Wäger, P.A.; Lang, D.J.; Wittmer, D.; Bleischwitz, R.; Hagelüken, C. Towards a More Sustainable Use of Scarce Metals. A Review of Intervention Options along the Metals Life Cycle. GAIA 2012, 21, 300–309. [Google Scholar] [CrossRef]
- Wellmer, F.W.; Dalheimer, M. The Feedback Control Cycle as Regulator of Past and Future Mineral Supply. Miner. Depos. 2012, 47, 713–729. [Google Scholar] [CrossRef]
- Achzet, B.; Helbig, C. How to Evaluate Raw Material Supply Risks—An Overview. Resour. Policy 2013, 38, 435–447. [Google Scholar] [CrossRef]
- Roelich, K.; Dawson, D.A.; Purnell, P.; Knoeri, C.; Revell, R.; Busch, J.; Steinberger, J.K. Assessing the Dynamic Material Criticality of Infrastructure Transitions: A Case of Low Carbon Electricity. Appl. Energy 2014, 123, 378–386. [Google Scholar] [CrossRef]
- Glöser, S.; Espinoza, L.T.; Gandenberger, C.; Faulstich, M. Raw Material Criticality in the Context of Classical Risk Assessment. Resour. Policy 2015, 44, 35–46. [Google Scholar] [CrossRef]
- Peck, D.; Kandachar, P.; Tempelman, E. Critical Materials from a Product Design Perspective. Mater. Des. 2015, 65, 147–159. [Google Scholar] [CrossRef]
- Weiser, A.; Lang, D.J.; Schomerus, T.; Stamp, A. Understanding the Modes of Use and Availability of Critical Metals—An Expert-Based Scenario Analysis for the Case of Indium. J. Clean. Prod. 2015, 94, 376–393. [Google Scholar] [CrossRef]
- Helbig, C.; Wietschel, L.; Thorenz, A.; Tuma, A. How to Evaluate Raw Material Vulnerability—An Overview. Resour. Policy 2016, 48, 13–24. [Google Scholar] [CrossRef]
- Jin, Y.; Kim, J.; Bertrand, G. Review of Critical Material Studies. Resour. Conserv. Recycl. 2016, 113, 77–87. [Google Scholar] [CrossRef]
- Bach, V.; Finogenova, N.; Berger, M.; Winter, L.; Finkbeiner, M. Enhancing the Assessment of Critical Resource Use at the Country Level with the SCARCE Method—Case Study of Germany. Resour. Policy 2017, 53, 283–299. [Google Scholar] [CrossRef]
- Scholz, R.W. Environmental Literacy in Science and Society: From Knowledge to Decisions; Cambridge University Press: Cambridge, UK, 2011. [Google Scholar]
- Arvidsson, R.; Ljunggren, M.; Sandén, B.; Nordelöf, A.; André, H.; Tillman, A.M. A crustal scarcity indicator for long-term global elemental resource assessment in LCA. Int. J. Life Cycle Assess. 2020, 25, 1805–1817. [Google Scholar] [CrossRef]
- Gordon, R.B.; Bertram, M.; Graedel, T.E. On the sustainability of metal supplies: A response to Tilton and Lagos. Resour. Policy 2007, 32, 24–28. [Google Scholar] [CrossRef]
- Nishiyama, T.; Adachi, T. Resource depletion calculated by the ratio of the reserve plus cumulative consumption to the crustal abundance for gold. Non-Renew. Resour. 1995, 4, 253–261. [Google Scholar] [CrossRef]
- Rankin, W.J. Minerals, Metals and Sustainability; CSIRO: Canberra, Australia, 2011. [Google Scholar]
- Wedepohl, H.K. The composition of the continental crust. Geochim. Cosmochim. Acta 1995, 59, 1217–1232. [Google Scholar] [CrossRef]
- Reuter, M.A.; Van Schaik, A.; Ignatenko, O.; De Haan, G.J. Fundamental limits for the recycling of end-of-life vehicles. Miner. Eng. 2006, 19, 433–449. [Google Scholar] [CrossRef]
- Frenzel, M.; Kullik, J.; Reuter, M.A.; Gutzmer, J. Raw material “criticality”—Sense or nonsense? J. Phys. D Appl. Phys. 2017, 50, 123002. [Google Scholar] [CrossRef]
- Watson, B.J.; Eggert, R.G. Understanding relative metal prices and availability. Combining physical and economic perspectives. J. Ind. Ecol. 2020, 25, 890–899. [Google Scholar] [CrossRef]
- Hischier, R.; Weidema, B.; Althaus, H.J.; Bauer, C.; Doka, G.; Dones, R.; Frischknecht, R.; Hellweg, S.; Humbert, S.; Jungbluth, N.; et al. Implementation of Life Cycle Impact Assessment Methods; Ecoinvent Report 3, v2.2; Swiss Centre for Life Cycle Inventories: Dübendorf, Switzerland, 2010; 177p. [Google Scholar]
- Nuss, P.; Eckelman, M.J. Life Cycle Assessment of Metals: A Scientific Synthesis. PLoS ONE 2014, 9, e101298. [Google Scholar] [CrossRef] [PubMed]
- Dehoust, G.; Manhart, A.; Dolega, P.; Vogt, R.; Kemper, C.; Auberger, A.; Becker, F.; Scholl, C.; Rechlin, A.; Priester, M. Environmental Criticality of Raw Materials. An Assessment of Environmental Hazard Potentials of Raw Materials from Mining and Recommendations for an Ecological Raw Materials Policy; Report No. FB000275/ANH-ENG; German Environment Agency: Dessau-Roßlau, Germany, 2020; 254p. [Google Scholar]
- Cech, R.E. The price of metals. J. Met. 1970, 22, 21–22. [Google Scholar] [CrossRef]
- Phillips, W.; Edwards, D. Metal prices as a function of ore grade. Resour. Policy 1976, 2, 167–178. [Google Scholar] [CrossRef]
- Chapman, P.F.; Roberts, F. Metal Resources and Energy; Butterworths: Oxford, UK, 1983. [Google Scholar]
- Norgate, T.; Jahanshahi, S. Low-grade ores-smelt, leach or concentrate? Miner. Eng. 2010, 23, 65–73. [Google Scholar] [CrossRef]
- Vieira, M.D.; Goedkoop, M.J.; Storm, P.; Huijbregts, M.A. Ore grade decrease as life cycle impact indicator for metal scarcity: The case of copper. Environ. Sci. Technol. 2012, 46, 12772–12778. [Google Scholar] [CrossRef]
- Fizaine, F.; Court, V. Renewable electricity producing technologies and metal depletion: A sensitivity analysis using the EROI. Ecol. Econ. 2015, 110, 106–118. [Google Scholar] [CrossRef]
- Weng, Z.; Haque, N.; Mudd, G.M.; Jowitt, S.M. Assessing the energy requirements and global warming potential of the production of rare earth elements. J. Clean. Prod. 2016, 139, 1282–1297. [Google Scholar] [CrossRef]
- Vidal, O.; Rostom, F.Z.; François, C.; Giraud, G. Prey-predator long-term modeling of copper reserves, production, recycling, price, and cost of production. Environ. Sci. Technol. 2019, 53, 11323–11336. [Google Scholar] [CrossRef] [PubMed]
- UNECE (United Nations Framework Classification for Resources). UNECE Energy Series 61, Update 2019. 2020. 28p. Available online: https://unece.org/DAM/energy/se/pdfs/UNFC/publ/UNFC_ES61_Update_2019.pdf (accessed on 15 August 2023).
- Toulhoat, P. WMF Criticality Assessment. In Proceedings of the World Materials Forum, Nancy, France, 28 June 2018. 15 slides. [Google Scholar]
- Müller-Wenk, R. Depletion of Abiotic Resources Weighted on Base of “Virtual” Impacts of Lower Grade Deposits Used in Future; Institute for Economy and Ecology. Discussion Paper 57; University of Saint Gallen: St. Gallen, Switzerland, 1998. [Google Scholar]
- Berger, M.; Sonderegger, T.; Alvarenga, R.; Bach, V.; Cimprich, A.; Dewulf, J.; Frischknecht, R.; Guinée, J.; Helbig, C.; Huppertz, T.; et al. Mineral resources in life cycle impact assessment: Part II—Recommendations on application-dependent use of existing methods and on future method development needs. Int. J. Life Cycle Assess. 2020, 25, 798–813. [Google Scholar] [CrossRef]
- Mudd, G. An analysis of historic production trends in Australian base metal mining. Ore Geol. Rev. 2007, 32, 227–261. [Google Scholar] [CrossRef]
- Prior, T.; Giurco, D.; Mudd, G.; Mason, L.; Behrish, J. Resource depletion, peak minerals and the implications for sustainable resource management. Glob. Environ. Chang. 2012, 22, 577–587. [Google Scholar] [CrossRef]
- Vieira, M.D.; Ponsioen, T.C.; Goedkoop, M.J.; Huijbregts, M.A. Surplus Ore Potential as a Scarcity Indicator for Resource Extraction. J. Ind. Ecol. 2016, 21, 381–390. [Google Scholar] [CrossRef]
- Huijbregts, M.A.; Steinmann, Z.J.N.; Elshout, P.M.F.; Stam, G.; Verones, F.; Vieira, M.D.; Hollander, A.; Zijp, M.; Van Zelm, R. ReCiPe 2016 v1.1—A Harmonized Life Cycle Impact Assessment Method at Midpoint and Endpoint Level; RIVM Report 2016-0104a; National Institute for Public Health and the Environment: Bilthoven, The Netherlands, 2017; 201p. [Google Scholar]
- Vieira, M.D.; Huijbregts, M.A. Mineral Resource Scarcity. LC-IMPACT Project: A Regionalized Life Cycle Damage Assessment Method. Website Methodology. 2016. 7p. Available online: https://lc-impact.eu (accessed on 1 June 2023).
- Vieira, M.D. Fossil and Mineral Resource Scarcity in Life Cycle Assessment. Ph.D. Thesis, Radboud University, Nijmegen, The Netherlands, 2018. [Google Scholar]
- Verones, F.; Hellweg, S.; Anton, A.; Azevedo, L.; Chaudhary, A.; Cosme, N.; Cucurachi, S.; De Baan, L.; Dong, Y.; Fantke, P.; et al. LC-IMPACT: A regionalized life cycle damage assessment method. J. Ind. Ecol. 2020, 24, 1201–1219. [Google Scholar] [CrossRef]
- Kaufmann, D.; Kraay, A.; Mastruzzi, M. The Worldwide Governance Indicators: Methodology and Analytical Issues. World Bank Policy Research Working Paper 5430. 2010. Available online: https://ssrn.com/abstract=1682130 (accessed on 15 August 2023).
- World Bank. 2021. Available online: https://info.worldbank.org/governance/wgi (accessed on 15 August 2023).
- Kalinova, B.; Palerm, A.; Thomsen, S. OECD’s FDI Restrictiveness Index: 2010 Update; OECD: Paris, France, 2010; 27p. [Google Scholar] [CrossRef]
- OECD—Organisation for Economic Co-Operation and Development. FDI Regulatory Restrictiveness Index Year 2020. 2021. Available online: https://stats.oecd.org/Index.aspx?datasetcode=FDIINDEX# (accessed on 15 August 2023).
- Arvis, J.F.; Ojala, L.; Wiederer, C.; Shepherd, B.; Raj, A.; Dairabayeva, K.; Kiiski, T. Connecting to Compete 2018. Trade Logistics in the Global Economy. The Logistics Performance Index and Its Indicators; The International Bank for Reconstruction and Development/The World Bank: Washington, DC, USA, 2018; 82p. [Google Scholar]
- Philippe, M.; Didillon, B.; Gilbert, L. Industrial commitment to green and sustainable chemistry: Using renewable materials & developing eco-friendly processes and ingredients in cosmetics. Green Chem. 2012, 14, 952–956. [Google Scholar]
- Philippe, M.; Didillon, B.; Gilbert, L. Naturalness: Its assessment in the development of sustainable and green chemistry ingredients. An industrial commitment. Ann. Falsif. L’expert. Chim. Toxicol. 2016, 985, 36–43. [Google Scholar]
- Esty, D.C.; Levy, M.A.; Srebotnjak, T.; de Sherbinin, A.; Kim, C.H.; Anderson, B. Pilot 2006 Environmental Performance Index; Yale Center for Environmental Law and Policy: New Haven, CT, USA, 2006; 367p. [Google Scholar]
- UBA (Umwelt Bundes Amt). Analysis of the Yale Environmental Performance Index (EPI); Research Report 363-01-136, UBA-FB 001104/E; UBA: Dessau-Roßlau, Germany, 2008; 50p.
- Wendling, Z.A.; Emerson, J.W.; de Sherbinin, A.; Esty, D.C. 2020 Environmental Performance Index; Yale Center for Environmental Law and Policy: New Haven, CT, USA, 2020; 220p, Available online: https://epi.yale.edu/ (accessed on 15 August 2023).
- Papadimitriou, E.; Neves, A.R.; Saisana, M. JRC Statistical Audit of the 2020 Environmental Performance Index; EUR 30234 EN; JRC120879; Publications Office of the European Union: Luxembourg, 2020; ISBN 978-92-76-19125-4. [Google Scholar] [CrossRef]
- Duclos, S.J.O.; Konitzer, J.P.; Douglas, G. Design in an Era of Constrained Resources. Mech. Eng. 2010, 132, 36–40. [Google Scholar] [CrossRef]
- Blengini, G.A.; Blagoeva, D.; Dewulf, J.; Torres de Matos, C.; Nita, V.; Vidal-Legaz, B.; Latunussa, C.E.L.; Kayam, Y.; Talens Peirò, L.; Baranzelli, C.; et al. Assessment of the Methodology for Establishing the EU List of Critical Raw Materials; JRC106997; Publications Office of the European Union: Luxembourg, 2017; ISBN 978-92-79-69612-1. [Google Scholar] [CrossRef]
- Nassar, N.T.; Graedel, T.E.; Harper, E.M. By-product metals are technologically essential but have problematic supply. Sci. Adv. 2015, 1, 1–10. [Google Scholar] [CrossRef]
- Allaby, A.; Allaby, M. A Dictionary of Earth Sciences, 2nd ed.; Oxford University Press: Oxford, UK, 1999; 640p. [Google Scholar]
- Verhoef, E.V.; Dijkema, G.P.J.; Reuter, M.A. Process Knowledge, System Dynamics, and Metal Ecology. J. Ind. Ecol. 2004, 8, 23–43. [Google Scholar] [CrossRef]
- Natenberg, S. Option Volatility and Pricing. Advanced Trading Strategies and Techniques; McGraw-Hill: New York, NY, USA, 1994; 470p. [Google Scholar]
- Hirschman, A. National Power and the Structure of Foreign Trade; University of California Press: Berkeley, CA, USA, 1945; 172p. [Google Scholar]
- Herfindahl, O.C. Concentration in the Steel Industry. Unpublished Ph.D. Thesis, Columbia University, OCLC, New York, NY, USA, 1950. [Google Scholar]
- Calkins, S. The New Merger Guidelines and the Herfindahl-Hirschman Index. Calif. Law Rev. 1983, 71, 402–429. [Google Scholar] [CrossRef]
- Rhoades, S.A. The Herfindahl-Hirschman index. Federal Reserve bulletin. Issue March 1993, 1993, 188–189. [Google Scholar]
- Geldron, A. Les besoins en matières premières minérales et la place du recyclage pour une économie circulaire. Rev. Mines Carr. 2015, 225, 75–83. [Google Scholar]
- UNEP. Recycling Rates of Metals—A Status Report; Graedel, T.E., Allwood, J., Birat, J.P., Reck, B.K., Sibley, S.F., Sonnemann, G., Buchert, M., Hagelüken, C., Eds.; A Report of the Working Group on the Global Metal Flows to the International Resource Panel; UNEP: Nairobi, Kenya, 2011. [Google Scholar]
- USDOE. Critical Materials Strategy. U.S. Department of Energy. 2010. Available online: http://energy.gov/sites/prod/files/edg/news/documents/criticalmaterialsstrategy.pdf (accessed on 15 August 2023).
- Rosenau-Tornow, D.; Buchholz, P.; Riemann, A.; Wagner, M. Assessing the long-term supply risks for mineral raw materials—A combined evaluation of past and future trends. Resour. Policy 2009, 34, 161–175. [Google Scholar] [CrossRef]
- Saaty, T.L. Décider Face à la Complexité: Une Approche Analytique Multicritère D’aide à la Décision; Esf Éditeur: Paris, France, 1984; 231p, ISBN 9782710104919. [Google Scholar]
- Harben, P.W. The Industrial Minerals Handybook IV—A Guide to Markets, Specifications & Prices, 4th ed.; Industrial Mineral Information: London, UK, 2002; Volume 412, pp. 48–54. [Google Scholar]
- Kogel, J.E.; Trivedi, N.C.; Barker, J.M.; Krukowski, S.T. Industrial Minerals and Rocks—Commodities, Markets and Uses; Society for Mining, Metallurgy and Exploration Inc.: Englewood, CO, USA, 2006; Volume 1548, pp. 357–368. [Google Scholar]
- Christidis, G.E.; Huff, W.D. Geological aspects and genesis of bentonites. Elements 2009, 5, 93–98. [Google Scholar] [CrossRef]
- Elsenhour, D.D.; Brown, R.K. Bentonite and its impact on modern life. Elements 2009, 5, 83–88. [Google Scholar] [CrossRef]
- USGS. Bentonite. Mineral Commodity Summaries 2022. 2022; 2p. Available online: https://pubs.usgs.gov/periodicals/mcs2022/mcs2022-clays.pdf (accessed on 15 August 2023).
- USGS. Clay and Shales. Minerals Yearbook. 2018; 21p. Available online: https://pubs.usgs.gov/myb/vol1/2018/myb1-2018-clay-shale.pdf (accessed on 15 August 2023).
- Becker, L.C.; Bergfeld, W.F.; Belsito, D.V.; Hill, R.A.; Klaassen, C.D.; Liebler, D.C.; Andersen, F.A. Safety assessment of ammonium hectorites as used in cosmetics. Int. J. Toxicol. 2013, 32, 33S–40S. [Google Scholar] [CrossRef]
- IMA (Industrial Minerals Association). Recycling Industrial Minerals. 2018. 24p. Available online: http://old.ima-europe.eu/sites/ima-europe.eu/files/publications/IMA-Europe_Recycling%20Sheets_2018.pdf (accessed on 15 August 2023).
- Reports and Data Company. Bentonite Market By Product Type (Sodium Bentonite, Calcium Bentonite, Sulphur Bentonite, Others), By Application (Foundry Sands, Iron Ore Pelletizing, Pet Litter, Drilling Mud, Civil Engineering, Others), By Region Forecast to 2032. Report N°RND_001249, Materials and Chemicals, 224p. 2023. Available online: https://www.emergenresearch.com/industry-report/bentonite-market (accessed on 22 November 2023).
- European Commission (EU). Study on EU’s List of Critical Raw Materials; Factsheets on Non-Critical Raw Materials; EU: Brussels, Belgium, 2020; Volume 589, pp. 40–51.
- Gemechu, E.; Kumar, A. A review of how life cycle assessment has been used to assess the environmental impacts of hydropower energy. Renew. Sustain. Energy Rev. 2022, 167, 112684. [Google Scholar] [CrossRef]
- Mio, A.; Fermeglia, M.; Favi, C. A critical review and normalization of the life cycle assessment outcomes in the naval sector. Artic. Descr. J. Clean. Prod. 2022, 370, 133476. [Google Scholar] [CrossRef]
- Amicarelli, V.; Bux, C.; Spinelli, M.P.; Lagioia, G. Life cycle assessment to tackle the take-make-waste paradigm in the textiles production. Waste Manag. 2022, 151, 10–27. [Google Scholar] [CrossRef] [PubMed]
- Hunt, R.; Franklin, W.E. LCA—How it came about—Personal reflections on the origin and the development of LCA in the USA. Int. J. Life Cycle Assess. 1996, 1, 4–7. [Google Scholar] [CrossRef]
- Klöpffer, W. Life Cycle Assessment. From the Beginning to the Current State. Environ. Sci. Pollut. Res. 1997, 4, 223–228. [Google Scholar] [CrossRef] [PubMed]
- Muralikrishna, I.V.; ValliManickam, V. Chapter Five—Life Cycle Assessment. Environmental Management. In Science and Engineering for Industry; Elsevier: Amsterdam, The Netherlands, 2017; 639p, ISBN 978-0-12-811989-1. [Google Scholar]
- Guinée, J.B.; Heijungs, R. A proposal for the definition of resource equivalency factors for use in product life-cycle assessment. Environ. Toxicol. Chem. 1995, 14, 917–925. [Google Scholar]
- Guinée, J.B.; Gorée, M.; Heijungs, R.; Huppes, G.; Kleijn, R.; de Koning, A.; van Oers, L.; Wegener Sleeswijk, A.; Suh, S.; Udo de Haes, H.A. Handbook on Life Cycle Assessment: Operational Guide to the ISO Standards; Kluwer Academic Publisher: Dordrecht, The Netherlands, 2002. [Google Scholar]
- Van Oers, L.; de Koning, A.; Guinée, J.B.; Huppes, G. Abiotic Resource Depletion in LCA; Road and Hydraulic Engineering Institute, Ministry of Transport and Water: Amsterdam, The Netherlands, 2002; 75p. [Google Scholar]
- Van Oers, L.; Guinée, J.B.; Heijungs, R. Abiotic resource depletion potentials (ADPs) for elements revisited-updating ultimate reserve estimates and introducing time series for production data. Int. J. Life Cycle Assess. 2019, 25, 294–308. [Google Scholar] [CrossRef]
- Beylot, A.; Ardente, F.; Sala, S.; Zampori, L. Accounting for the dissipation of abiotic resources in LCA: Status, key challenges and potential way forward. Resour. Conserv. Recycl. 2020, 157, 104748. [Google Scholar] [CrossRef]
- Sonderegger, T.; Berger, M.; Alvarenga, R.; Bach, V.; Cimprich, A.; Dewulf, J.; Frischknecht, R.; Guinée, J.; Helbig, C.; Huppertz, T.; et al. Mineral resources in life cycle impact assessment part I: A review. Int. J. Life Cycle Assess. 2020, 25, 784–797. [Google Scholar] [CrossRef]
- Stewart, M.; Weidema, B. A consistent framework for assessing the impacts from resource use: A focus on resource functionality. Int. J. Life Cycle Assess. 2005, 10, 240–247. [Google Scholar] [CrossRef]
- IPCC. Climate Change 2023: Synthesis Report; Core Writing Team, Lee, H., Romero, J., Eds.; Contribution of Working Groups I, II and III to the Sixth Assessment Report of the Intergovernmental Panel on Climate Change; IPCC: Geneva, Switzerland, 2023; 184p. [Google Scholar] [CrossRef]
- ICMM. Policy on Climate Change: Implementing a Global Solution to Managing a Low Emissions Economy; International Council on Mining and Metals: London, UK, 2009. [Google Scholar]
- Mudd, G.M. The environmental sustainability of mining in Australia: Key mega-trends and looming constraints. Resour. Policy 2010, 35, 98–115. [Google Scholar] [CrossRef]
- ICMM. The Role of Minerals and Metals in a Low Carbon Economy (InBrief); ICMM: London, UK, 2012. [Google Scholar]
- Odella, S.D.; Bebbington, A.; Freya, K.E. Mining and climate change: A review and framework for analysis. Extr. Ind. Soc. 2018, 5, 201–214. [Google Scholar] [CrossRef]
- Hund, K.; La Porta, D.; Fabregas, T.P.; Laing, T.; Drexhage, J. Minerals for Climate Action: The Mineral Intensity of the Clean Energy Transition; World Bank Group Report; World Bank: Washington, DC, USA, 2020; 112p. [Google Scholar]
- Jiskani, I.M.; Cai, Q.; Zhou, W.; Shah, S.A.A. Green and climate-smart mining: A framework to analyze open-pit mines for cleaner mineral production. Resour. Policy 2021, 71, 102007. [Google Scholar] [CrossRef]
- Jiskani, I.M.; Cai, Q.; Zhou, W.; Lu, X.; Shah, S.A.A. An integrated fuzzy decision support system for analyzing challenges and pathways to promote green and climate smart mining. Expert Syst. Appl. 2022, 188, 116062. [Google Scholar] [CrossRef]
- Jiskani, I.M.; Zhou, W.; Hosseini, S.; Wang, Z. Mining 4.0 and climate neutrality: A unified and reliable decision system for safe, intelligent, and green & climate-smart mining. J. Clean. Prod. 2023, 410, 137313. [Google Scholar]


| Sphere | Criterion | Sub-Criterion | Weighting Coefficient | Value | Normalised Value per Criterion (on 5) | Normalised and Weighted Value per Criterion | Weighted Score per Sphere | Mineral Abundance Index (AI) (on 100) | |
|---|---|---|---|---|---|---|---|---|---|
| Geosphere | Crustal Scarcity Potential (CSP) | 30% | 30% | 1.20 × 101 | 5 | 1.50 | 1.50 | 79.88 | |
| Energy required for extraction (E) | 50% | 0.354 | 5 | 2.50 | |||||
| Enrichment factor (FE) | 20% | 9.9 | 5 | 1.00 | |||||
| Technical-economic sphere | Years of Known Reserves (TR) | 40% | 30% | >100 | 5 | 1.50 | 1.72 | ||
| Surplus Ore Potential (SOP) | 20% | 1.58 × 10⁻¹ | 5 | 1.00 | |||||
| Resources accessibility per country (AR) | AR1 | 5% | 42.89 | 3 | 0.80 | ||||
| AR2 | 5% | 0.097 | 2 | ||||||
| AR3 | 5% | 72.58 | 4 | ||||||
| AR4 | 5% | 57.30 | 3 | ||||||
| AR5 | 5% | 3.53 | 4 | ||||||
| Environmental impact (ENV) | ENV1 | 12.5% | 4 | 4 | 1.00 | ||||
| ENV2 | 12.5% | 53.21 | 4 | ||||||
| Socio-epistemic sphere | Price volatility over last decade (V) | 30% | 20% | 5 | 4 | 0.80 | 0.98 | ||
| Concentration index for the production (PR) | 30% | 4 | 4 | 1.20 | |||||
| Maturity of recycling loops (REC) | 25% | 3 | 3 | 0.75 | |||||
| Substitutability (SUB) | 25% | 2 | 2 | 0.50 | |||||
| Criterion | Sub-Criterion | Temporal Reliability (Update Frequency) | Methodological Consistency | Applicability | References | |
|---|---|---|---|---|---|---|
| Geosphere | Crustal Scarcity Potential (CSP) | Strong | Strong | Strong | [96] | |
| Energy required for extraction (E) | Strong | Moderate to strong | Moderate to strong (value is sometimes missing for industrial minerals) | [105,106] | ||
| Enrichment factor (FE) | Moderate to strong (up to 30 years) | Moderate to strong | Moderate to strong (sometimes difficult to get an average ore content) | [38] Papers on mineral deposits | ||
| Technical-economic sphere | Years of Known Reserves (TR) | Weak (1 year) | Moderate to strong | Moderate to strong (figures can differ according to the authors) | USGS Mineral Yearbooks Papers on deposits | |
| Surplus Ore Potential (SOP) | Moderate (linked to extrapolation with prices for some commodities) | Moderate (linked to extrapolation with prices for some commodities) | Moderate (value is sometimes missing for industrial minerals) | [121,124] | ||
| Resources accessibility per country (AR) | AR1 | Weak (1 year) | Strong | Weak to moderate (depends on the knowledge of the producing countries and sub-criteria are missing for some countries) | Worldwide Governance Indicators (WGI) [126,127]: PV (Political Stability and Absence of Violence/Terrorism). https://info.worldbank.org/governance/wgi, accessed on 22 November 2023 | |
| AR2 | FDI Regulatory Restrictiveness Index [128]: Industrial Sector “Mining & Quarrying” [129]. www.oecd.org/investment/fdiindex.htm, accessed on 22 November 2023 | |||||
| AR3 | WGI [126]: GE (Government Effectiveness). https://info.worldbank.org/governance/wgi, accessed on 22 November 2023 | |||||
| AR4 | WGI [126]: CC (Control of Corruption). https://info.worldbank.org/governance/wgi, accessed on 22 November 2023 | |||||
| AR5 | Logistics Performance Index (LPI) [130]. lpi.worldbank.org, accessed on 22 November 2023 | |||||
| Environmental impact (ENV) | ENV1 | Strong | Strong | Moderate (sometimes difficult to find the information due to industrial secrecy) | Literature review of papers on ore processing | |
| ENV2 | Weak (2 years) | Strong | Weak to moderate (depends on the knowledge of the producing countries) | Environmental Performance Index (EPI), [133,135]. University of Yale. https://epi.yale.edu/epi-results/2020/component/epi, accessed on 22 November 2023 | ||
| Socio-epistemic sphere | Price volatility over last decade (V) | Moderate (10 years) | Moderate to strong | Moderate (since industrial minerals and some metals are not systematically quoted) | Literature review (LME, UN ComTrade, USGS Mineral Commodity Summaries, etc.) | |
| Concentration index for the production (PR) | Moderate (ca. 5–10 years) | Moderate to strong | Moderate to strong (literature can be limited or absent for some commodities) | Literature review focusing on the commodity | ||
| Maturity of recycling loops (REC) | Moderate (ca. 5–10 years) | Moderate to strong | Moderate (literature can be limited or absent for some commodities) | Literature review focusing on the commodity | ||
| Substitutability (SUB) | Moderate (ca. 5–10 years) | Moderate to strong | Moderate (literature can be limited or absent for some commodities) | Literature review focusing on the commodity |
Disclaimer/Publisher’s Note: The statements, opinions and data contained in all publications are solely those of the individual author(s) and contributor(s) and not of MDPI and/or the editor(s). MDPI and/or the editor(s) disclaim responsibility for any injury to people or property resulting from any ideas, methods, instructions or products referred to in the content. |
© 2023 by the authors. Licensee MDPI, Basel, Switzerland. This article is an open access article distributed under the terms and conditions of the Creative Commons Attribution (CC BY) license (https://creativecommons.org/licenses/by/4.0/).
Share and Cite
Charles, N.; Lefebvre, G.; Tuloup, R.; Carreaud, A.; Boubault, A.; Serrand, A.-S.; Picault, M.; Piguet, V.; Manzin, V.; Deswarte, F.; et al. Mineral Resource Abundance: An Assessment Methodology for a Responsible Use of Mineral Raw Materials in Downstream Industries. Sustainability 2023, 15, 16783. https://doi.org/10.3390/su152416783
Charles N, Lefebvre G, Tuloup R, Carreaud A, Boubault A, Serrand A-S, Picault M, Piguet V, Manzin V, Deswarte F, et al. Mineral Resource Abundance: An Assessment Methodology for a Responsible Use of Mineral Raw Materials in Downstream Industries. Sustainability. 2023; 15(24):16783. https://doi.org/10.3390/su152416783
Chicago/Turabian StyleCharles, Nicolas, Gaétan Lefebvre, Rémy Tuloup, Audrey Carreaud, Antoine Boubault, Anne-Sophie Serrand, Maxime Picault, Virginie Piguet, Valeria Manzin, Fabien Deswarte, and et al. 2023. "Mineral Resource Abundance: An Assessment Methodology for a Responsible Use of Mineral Raw Materials in Downstream Industries" Sustainability 15, no. 24: 16783. https://doi.org/10.3390/su152416783
APA StyleCharles, N., Lefebvre, G., Tuloup, R., Carreaud, A., Boubault, A., Serrand, A.-S., Picault, M., Piguet, V., Manzin, V., Deswarte, F., & Aupoil, J. (2023). Mineral Resource Abundance: An Assessment Methodology for a Responsible Use of Mineral Raw Materials in Downstream Industries. Sustainability, 15(24), 16783. https://doi.org/10.3390/su152416783