Article

Size Distribution and Secondary Formation of Particulate Organic Nitrates in Winter in a Coastal Area

1
Environment Research Institute, Shandong University, Qingdao 266237, China
2
Department of Meteorology, COMSATS University Islamabad, Islamabad 45550, Pakistan
*
Authors to whom correspondence should be addressed.
Sustainability 2023, 15(24), 16776; https://doi.org/10.3390/su152416776
Submission received: 1 November 2023 / Revised: 9 December 2023 / Accepted: 11 December 2023 / Published: 13 December 2023
(This article belongs to the Section Air, Climate Change and Sustainability)

Abstract

:
Understanding the size distribution, variation patterns, and potential formation mechanisms of particulate organic nitrates (PONs) is crucial for assessing their influences on atmospheric chemistry, air quality, and the regional climate. This study investigates PONs in the coastal atmosphere of Qingdao, China by collecting size-resolved particulate matter samples and analyzing six types of organic nitrates, namely pinene keto nitrate (PKN229), monoterpene hydroxyl nitrate (MHN215), monoterpene dicarbonyl nitrate (MDCN247), oleic acid hydroxyl nitrate (OAHN361), oleic acid keto nitrate (OAKN359), and pinene sulfate organic nitrate (PSON295), using ultrahigh-performance liquid chromatography(mass spectrometry). The mean total concentration of organic nitrates in fine particles reaches 677 ng m−3. The predominant compound is MHN215, followed by PKN229 and MDCN247. All six organic nitrates exhibited distinct concentration peaks in the droplet mode, with MDCN247 and OAHN361 showing a minor peak in the condensation mode. In addition, an apparent concentration peak is observed in the coarse mode for OAKN359. Comparative analyses under various conditions highlight the significant influences of primary emissions and secondary formation processes on the abundance and size distribution of organic nitrates. For instance, both firework displays during festivals and high NOx emissions from fuel combustion significantly increase the concentrations of condensation-mode organic nitrates, whereas dust particles enhanced the heterogeneous formation of coarse-mode particles. Furthermore, the high humidity of the coastal area promotes aqueous formation in droplet-mode particles.

Graphical Abstract

1. Introduction

Particulate organic nitrates (PONs), acknowledged as essential constituents within organic aerosols (OAs), play a pivotal role in contributing to fine particulate matters with a diameter equal or less than 2.5 µm (PM2.5), altering the recycling of reactive nitrogen, and influencing cloud formation [1,2]. The contribution of PONs to OAs are estimated in the range from 5% to 77% [3,4]. PONs contribute between 2% and 12% of OAs during summer in the southeast of the United States [5,6]. In addition, the hydroxyl and hydroperoxyl radicals (HOx = OH + HO2 + RO2) and the nitrogen oxide (NOx) cycle allow organic nitrates to store NOx temporarily and affect the ozone (O3) budget [7,8,9]. A previous study shows that 52% of the NOx that PONs sequester can be released back into the atmosphere [10]. Furthermore, PONs are extremely hygroscopic and serve as cloud condensation nuclei (CCN) that influence cloud formation and regional climate due to the presence of hydrophilic groups, such as nitrate, hydroxyl and carboxyl groups [5,11,12,13]. Given their substantial effects on air quality, atmospheric chemistry, and regional climate, there has been a growing interest in investigating the chemical characterization and secondary production of PONs through both laboratory and field studies in recent years.
PONs form primarily as a result of the secondary oxidation of anthropogenic or biogenic volatile organic compounds (BVOCs) when exposed to radicals of other oxidizing agents in the presence of NOx [13,14]. Previous studies have confirmed that the abundance of PONs is significantly influenced by the physical and chemical characteristics of aerosols, mixing ratios of precursors and oxidants, meteorological parameters, and anthropogenic activities [13,15,16]. BVOCs, such as oleic acid, isoprene, sesquiterpene, and monoterpenes, are recognized as key precursors of PONs, and the formation of PONs varied largely depending upon BVOC species [16]. Elevated concentrations of both BVOCs and NOx contribute to an increase in PON production through the oxidation of BVOCs in the presence of NOx during photochemical processes, as noted in the studies by Lee and Li [3,17]. PONs can also form through aqueous processes during relatively high humidity conditions [18].
As indicated by modeling simulations and laboratory investigations, heterogeneous and aqueous reactions also play a crucial role in the generation of organic nitrates [4,19,20]. Recent studies have focused on understanding how aerosol acidity influences the secondary formation of organic nitrates. For instance, an acid-catalyzed mechanism has been suggested for organic nitrate formation from α-pinene [21]. Furthermore, airborne measurements revealed that thermal power plants produced coal-burning plumes, characterized by abundant sulfate aerosols, promoted the nighttime formation of organic nitrates [22]. Hunag et al. [23] affirmed that increasing aerosol acidity facilitated the production of organic nitrates. Despite the recognition of biogenic volatile organic compounds (BVOCs) as the primary precursors of PONs and the various possible PON formation processes, modeling simulations often underestimate PON concentrations owing to uncertainty regarding their sources and formation pathways, as discussed by the study in [24].
Previous PON observations in the urban and rural areas of China have demonstrated that there is a significant variation in PON abundance and concentrations range from below detection limits to several micrograms per cubic meter [17,25,26,27,28,29]. PON abundance varies markedly by season and location owing to the effects of natural conditions and anthropogenic activities. In general, PONs exhibit relatively high concentrations in summer, as intense photochemical activity and strong BVOC emissions during the hot season facilitate the secondary formation of PONs [30]. A comparative study on field observations over multiple locations and seasons was conducted in eastern China by Zhang et al. [16], who reported that areas with high vegetation cover typically have greater PON concentrations because of the enhanced formation due to abundant BVOCs. Moreover, weather conditions, particularly ambient humidity, significantly influenced the PON’s formation in South China [16]. In addition, biomass burning and coal combustion promote the production of PONs, owing to the intensive emissions of NOx and VOCs, abundant oxidants, and acidic sulfate aerosols [16,31,32]. Previous studies have revealed the effects of natural conditions and human activities on the formation of PONs [15,16,30]; however, the influences and characteristics in rural coastal regions have not been well studied.
This study provides an analysis and presentation of the size distribution features, concentrations, and chemical composition of PONs in the coastal region of Qingdao in northern China. Moreover, it delves into the examination and discussion of potential formation pathways and the factors influencing organic nitrates under diverse atmospheric conditions. Notably, this research marks the pioneering effort to report the size distribution characteristics of organic nitrates and to elucidate their formation pathways by considering variations in size distribution. It provides basic input data for atmospheric chemistry and regional climate models, which helps to comprehensively understand the physical and chemical properties of organic nitrogen-containing aerosols, and support the policy making for persistent air quality improvement.

2. Materials and Methods
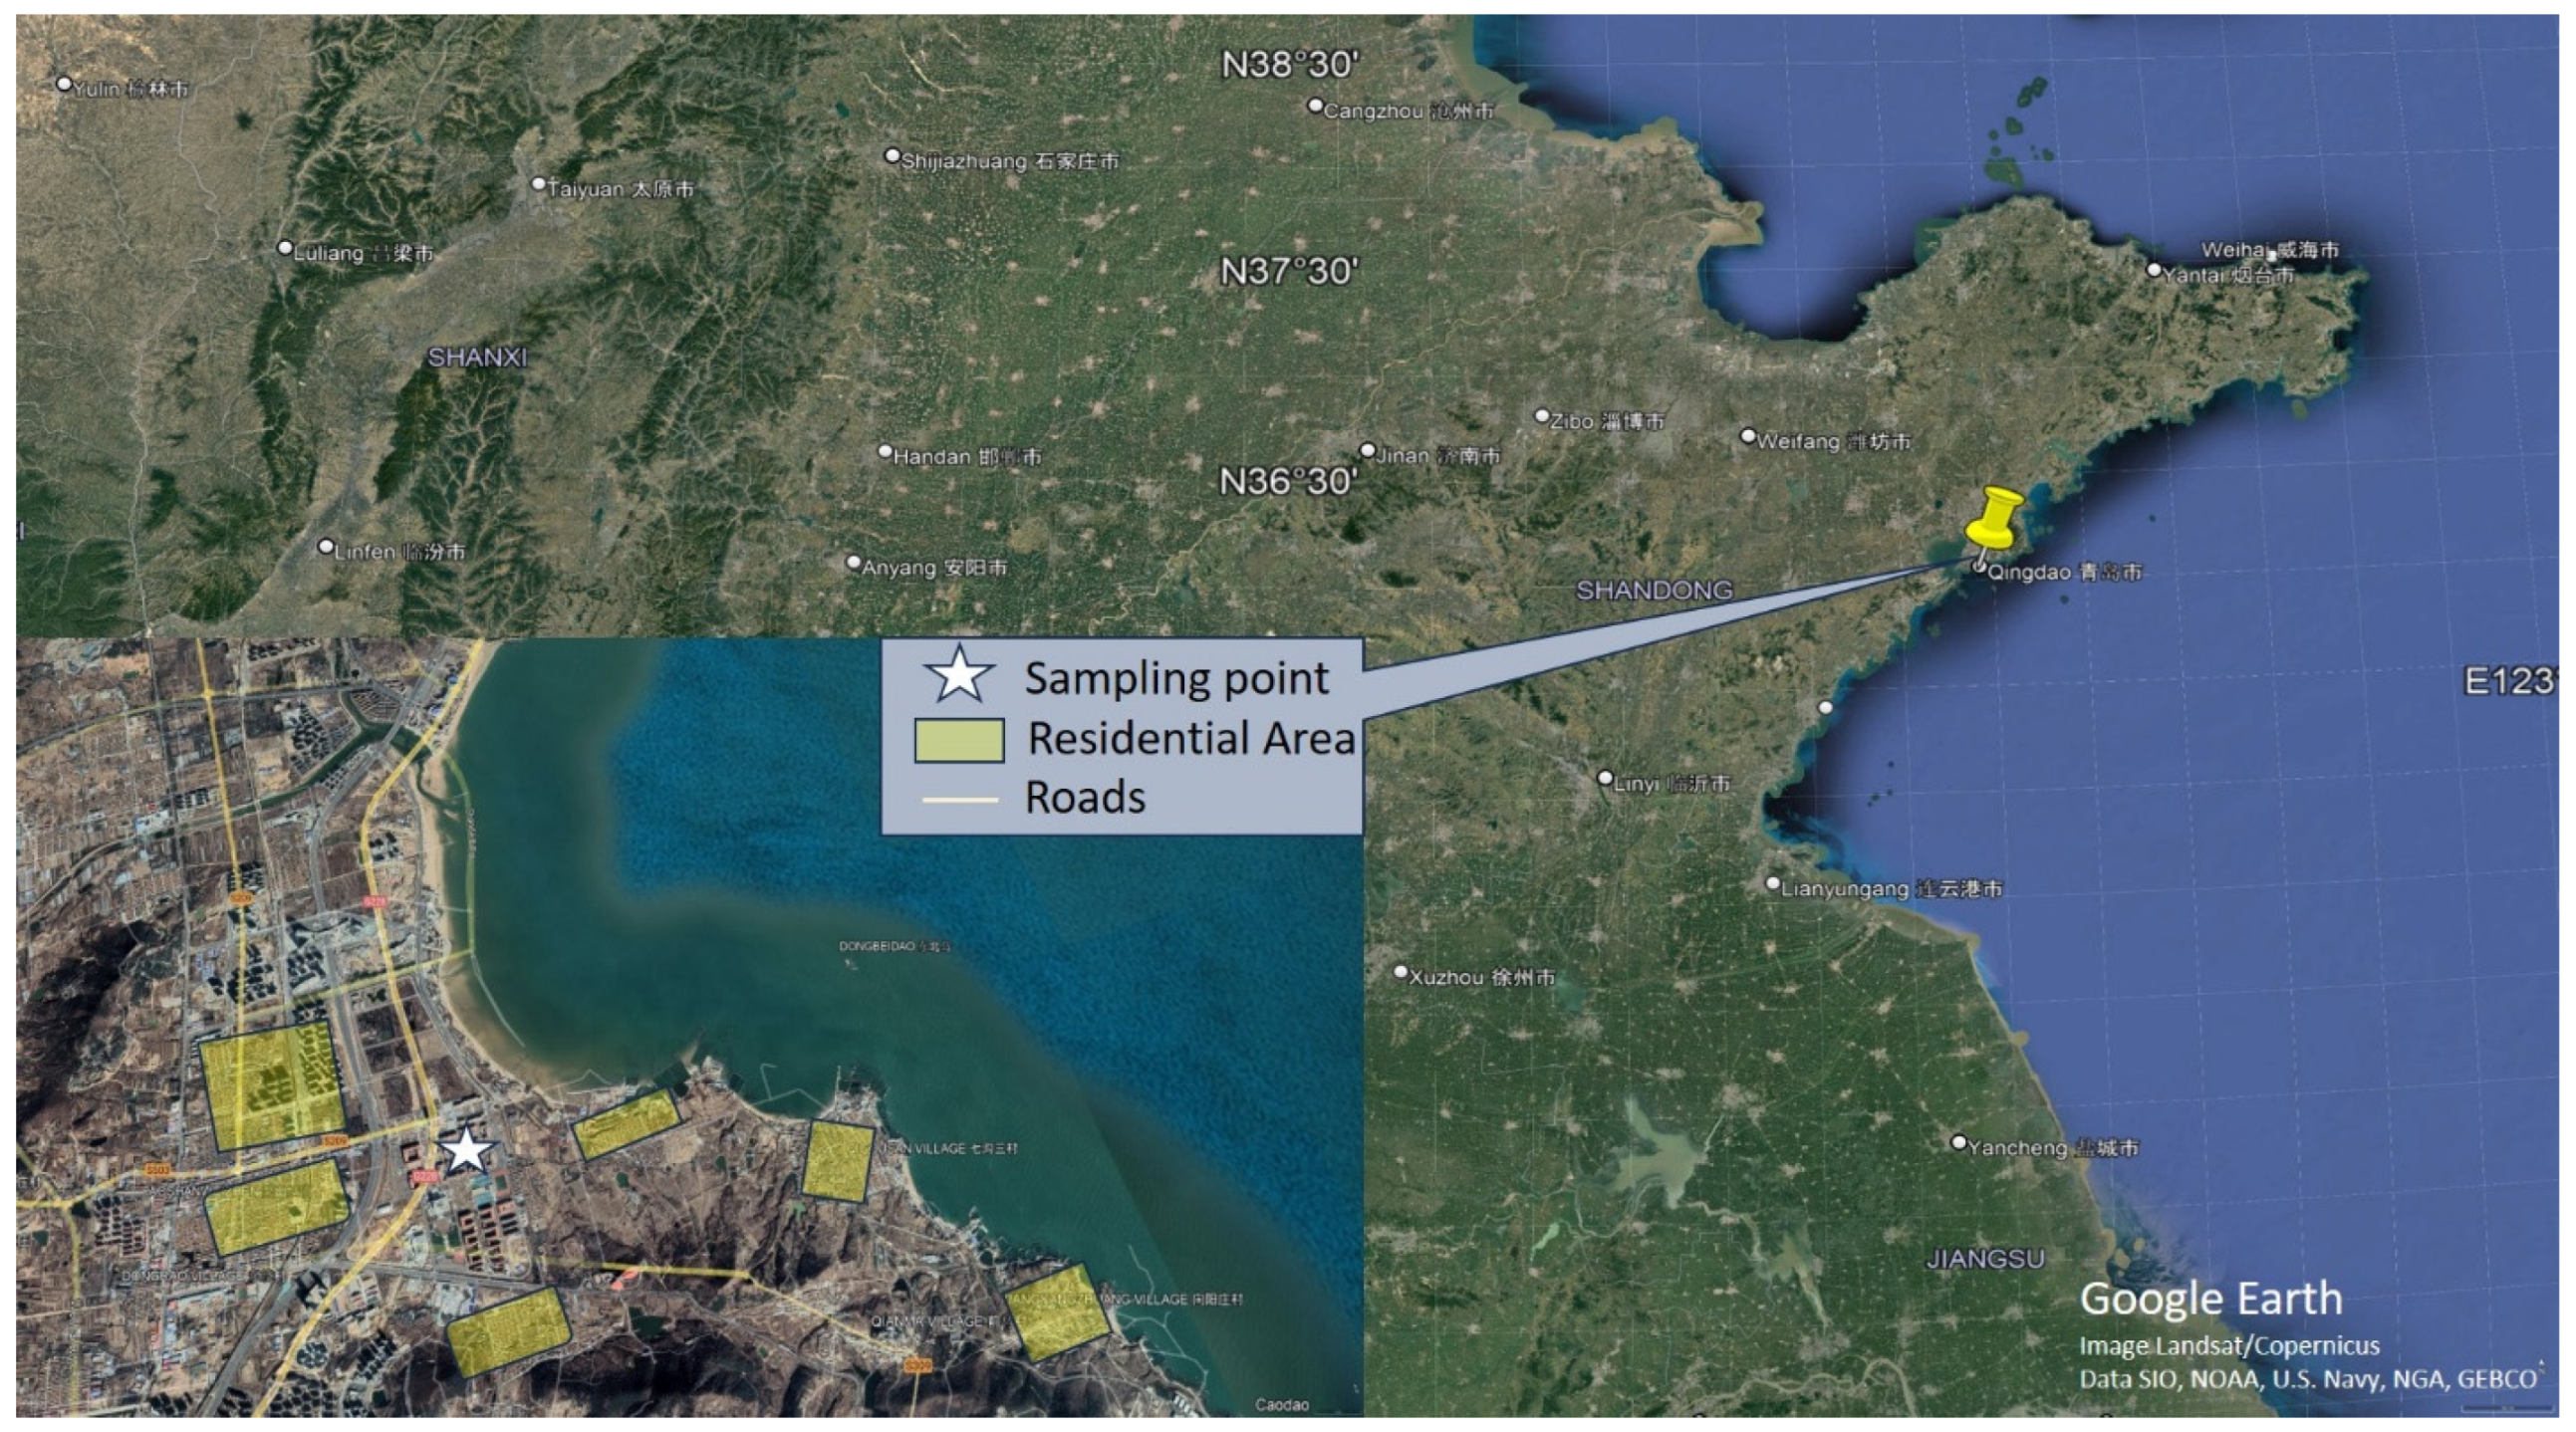
2.1. Study Area

The sampling site is situated on the coast in the north of Qingdao (Figure 1). Qingdao is a coastal city located in northern and eastern China, with generally remarkable anthropogenic emissions and complex coastal meteorological conditions. The collection of particulate matter samples was carried out on the rooftop of a four- story building within the Qingdao campus of Shandong University (~15 m above sea level; 36.36° N, 120.69° E). Farmlands, residential areas, and scholastic districts surround the sampling site. The Yellow Sea is located about 500 m to the east of the site and there is a low-traffic expressway is about 500 m to the west. Overall, this site represents a rural coastal environment with a modest level of nearby anthropogenic emissions from adjacent traffic and residential activities. The site was exposed to firework burning plumes for the Lantern Festival on 19 February. Furthermore, a dust event was noticed from 17 to 19 January with air masses transported from the Gobi Desert as reported by Liang et al. [33].

2.2. Sample Collection and Auxiliary Measurements

Sampling of size-resolved particulate matters was done with the help of a micro-orifice uniform deposition impactor (MOUDI, Model 100, MSP, USA) (shown in Figure S1 in the Supplementary Materials (SM)), by maintaining the flow rate of 30 L min−1. By using quartz fiber filters with a diameter of 47 mm of (Pall Corporation, Port Washington, NY, USA), particulate matters were sampled and classified into nine different size ranges: 0.18–0.32, 0.32–0.56, 0.56–1, 1–1.8, 1.8–3.2, 3.2–5.6, 5.6–10, 10–18 and 18–100 µm. A diameter with 1.8 µm was selected to differentiate between coarse and fine particles because a cut-point of 2.5 µm was absent. The sampling periods were from 11–31 January and from 15–25 February 2019. Depending on pollution levels, a total of 154 samples in 16 sets (each set contains nine samples of particles in different sizes) were obtained with a time resolution of 1 day or 2 days. Before the collection of samples, the quartz filters were placed in a furnace at 600 °C for 2 h to eliminate any potential organic molecules adsorbed. After sample collection, the filters were kept in a refrigerator at a temperature of −20 °C until further analysis.
During the sample collection periods, trace level gas analyzers were installed to monitor the abundance of ozone (O3), sulfur dioxide (SO2), and NOx in real time (Models 49i, 43i, and 42i, respectively, Thermo Scientific, USA). Meteorological data, including relative humidity (RH), temperature (T), wind direction and wind speed, were obtained from the Weather Underground website [34].

2.3. Organic Nitrate Determination and Chemical Analyses

The sample filter was cut into small pieces and then 15 mL methanol (high-performance liquid chromatography (HPLC) grade, Sigma-Aldrich, St. Louis, MO, USA) was introduced. It was extracted twice with a shaker for 40 min. The extract solution was stored at 4 °C overnight and the supernatant was concentrated to near dryness at room temperature via rotary evaporation. Then, 1.5 mL of methanol was added to re-dissolve the residues and the concentrated solution was filtered through a 0.22 μm of poly- tetrafluoroethylene (PTFE) syringe filter. The solution was blown to near dryness using a moderate stream of high-purity nitrogen and the final residues were re-dissolved using 300 μL methanol.
An ultra high-performance liquid chromatography (UHPLC) system (Ultimate 3000, Thermo Scientific, Waltham, MA, USA) (shown in Figure S1) and a quadrupole mass spectrometer (ISQ EC, Thermo Scientific, USA) equipped with a positive mode electrospray ionization (ESI) source were used to analyze the contents of PONs. An Atlantis C18 column (2.1 mm × 15 mm, 2.1 μm; Waters, Milford, MA, USA) was used to separate the analytes at a temperature of 24 °C. Gradient elution at a flow rate of 0.2 mL min−1 was conducted with eluent (A) methanol and eluent (B) 0.1% formic acid with deionized water (HPLC grade, Sigma-Aldrich, USA). The elution program was designated as follows: a composition of 30% A and 70% B was kept for 3 min; A increased to 90% and B decreased to 10% within 10 min and they were maintained for 3 min; and then the composition was returned to 30% A and 70% B within 0.1 min and held for 7.9 min. The six types of organic nitrates detected in the particulate matter samples in the current study were: monoterpene hydroxyl nitrate (MHN215, molecular weight (MW) = 215), pinene keto nitrate (PKN229, MW = 229), monoterpene dicarbonyl nitrate (MDCN247, MW = 247), oleic acid keto nitrate (OAKN359, MW = 359), oleic acid hydroxyl nitrate (OAHN361, MW = 361), and pinene sulfate organic nitrate (PSON295MW = 295). Additional information on the identification of organic nitrates can be found in our previous studies [35,36].
Three surrogate standards, namely, 2-hydroxy-3-pinanone (gas chromatography (GC) grade, TCI, Tokyo, Japan) for MDCN247, MHN215 and PKN229, ricinoleic acid (analytical reagent grade, Sigma-Aldrich, USA) for OAHN361 and OAKN359, and camphor sulfonic acid (GC grade, TCI) for PSON295 were used for the approximate quantification of the six types of organic nitrates concentrations on the basis of similar molecular structures and close retention time. In addition, 400 μL of 2 mg L−1 tropinone (>98%, International Laboratory, San Francisco, CA, USA) in methanol was used as an internal standard.

2.4. Quality Assurance and Quality Control

After the field sampling campaign, a set of additional blank samples (nine samples in total) was collected. The signals of the blank samples for organic nitrates were much lower than those of the ambient samples and were not subtracted from the sample signals when conducting the quantification. To avoid potential interferences from those organic compounds with similar molecular weights, precise mass-to-charge ratios and characteristic neutral/ion fragments from a high-resolution Orbitrap mass spectrometer were carefully examined. Linear fitting curves of peak areas and the standard concentrations (r2 > 0.99) (shown in Figure S2) were created for the quantification of organic nitrates. The recoveries of ricinoleic acid, 2-hydroxy-3-pinanone and camphor sulfonic acid were at acceptable levels of 74%, 77%, and 78%, respectively. It should be noted that the application of surrogate standards in this study increased the uncertainty of the measured PONs concentrations. In addition, field calibrations were conducted periodically for the trace gas analyzers, with a zero-span calibration being carried out every week and multiple-point calibration before and after the field campaign.

2.5. Data Processing

The MOUDI’s cut point is the diameter at which the efficiency of particle collection is equal to 50%. Therefore, a geometrically average diameter of the upper and lower sizes was used to represent the size bin. Ambient particles generally exhibit a reasonably normal distribution when compared with particle diameter on a logarithmic scale. Therefore, dC/dlog10Dp, where dC stands for the concentration of organic nitrates within each size bin and dlog10Dp represents the difference in the logarithms of the upper and lower particle sizes, was calculated to display the size-resolved concentrations with a logarithmic x-axis of particle diameter. Particle modes were directly divided by the cut points to simplify calculation. To determine the size distribution properties of particulate matters, three modes were used, i.e., condensation mode (0.18–0.56 µm), droplet mode (0.56–1.8 µm), and coarse mode (1.8–100 µm). For comparison, the concentration of each organic nitrate and the total concentration of the six organic nitrates (∑PONs) in different particle size ranges, i.e., PM1 (≤1 µm), PM1.8 (≤1.8 µm), PM10 (≤10 µm), and total suspended particles (TSP, ≤100 µm) were also calculated. In addition, box-plot distributions were plotted for total organic nitrates in TSP under different atmospheric conditions and correlation analysis was conducted between PONs with different air pollutants and meteorological parameters. Furthermore, significant difference has been tested when examining the variation trend, comparing the values, and evaluating the correlations.

3. Results

3.1. Concentrations and Variation Patterns of PONs

Table 1 presents a summary of the concentrations of organic nitrates in coastal Qingdao. The total concentrations of the six organic nitrates in PM1, PM1.8, PM10 and TSP were 415 ± 238, 606 ± 309, 927 ± 459 and 1099 ± 577 ng m−3, respectively. Among the six organic nitrate species, MHN215 exhibited the highest abundance with a TSP concentration of 397 ± 240 ng m−3, followed by PKN229, MDCN247 and OAKN359. OAHN361 and PSON295 were low, at 50.8 ± 21.4 and 31.8 ± 25.7 ng m−3, respectively.
Figure 2 illustrates the time series of the concentrations of organic nitrates in TSP, trace gases, and PM2.5 and the meteorological parameters in coastal Qingdao during the sampling periods. A significant fluctuation was observed in the concentration of organic nitrates. The concentrations of individual organic nitrates in TSP ranged from 31.8 to 397 ng m−3, and the total concentration varied from 520 to 2272 ng m−3. The concentration of organic nitrates varied with anthropogenic pollutants and meteorological conditions. In particular, the maximum concentration of ∑PONs (2272 ng m−3) was recorded on 11 January, accompanied by high levels of PM2.5 (93.4 μg m−3), NOx (42.2 ppb), and RH (83%). Overall, high concentrations of organic nitrates were recorded during the periods with high levels of PM2.5 (>90 μg m−3), NOx (maximum value > 40 ppb), and high RH (maximum RH > 80%).
To verify the potential influences of anthropogenic emissions and meteorological conditions on the abundance of PONs, correlation analysis was applied to between the six organic nitrates, different air pollutants and meteorological parameters. Figure S3 shows that PONs exhibited moderately strong positive correlations with PM2.5 and NOx concentrations and RH (p < 0.05). Furthermore, the box plots for the concentration of ∑PONs at different levels of NOx, PM2.5 and RH exhibit generally positive trends (p < 0.05; shown in Figure 3). In particular, very high concentrations of PONs were recorded under the conditions of NOx > 30 μg m−3, PM2.5 > 95 μg m−3, or RH > 70%.

3.2. Size Distributions and Chemical Compositions

Figure 4 presents the average size distribution patterns of the six organic nitrates. As shown, the majority of the four biogenic organic nitrates (MHN215, PKN229, MDCN247 and PSON295) were distributed in fine particles, with distinct concentration peaks appearing in particles smaller than 1.8 µm. In particular, a singular concentration peak existed in the size bin of 1.0–1.8 µm (droplet mode) for MHN215 and PSON295, and PKN229 and MDCN247 exhibited two concentration peaks in the size bins of 0.32–0.56 µm (condensation mode) and 1.0–1.8 µm. However, the anthropogenic organic nitrates of OAKN359 and OAHN361 were nearly evenly distributed in fine and coarse particles, with two small concentration peaks appearing in 0.32–0.56 µm and 3.2–5.6 µm (or 1.8–3.2 µm).
The fractions of the six organic nitrates in different size bins are shown and compared in Figure 5. Overall, MHN215 contributed the largest part, with contributions of 26–40%, followed by PKN229 (24–37%), OAKN359 (11–25%) and MDCN247 (3–20%). OAHN361 and PSON295 only comprised a small portion, with contributions less than 10%. However, MDCN247 exhibited higher proportions (p < 0.05) in fine particles (specifically within 0.32–1.8 µm) than in coarse particles (within 3.2–100 µm) (16–20% versus 3–7%), whereas OAKN359 in fine particles presented smaller proportions (p < 0.05) than in coarse particles (11–15% versus 23–25%).

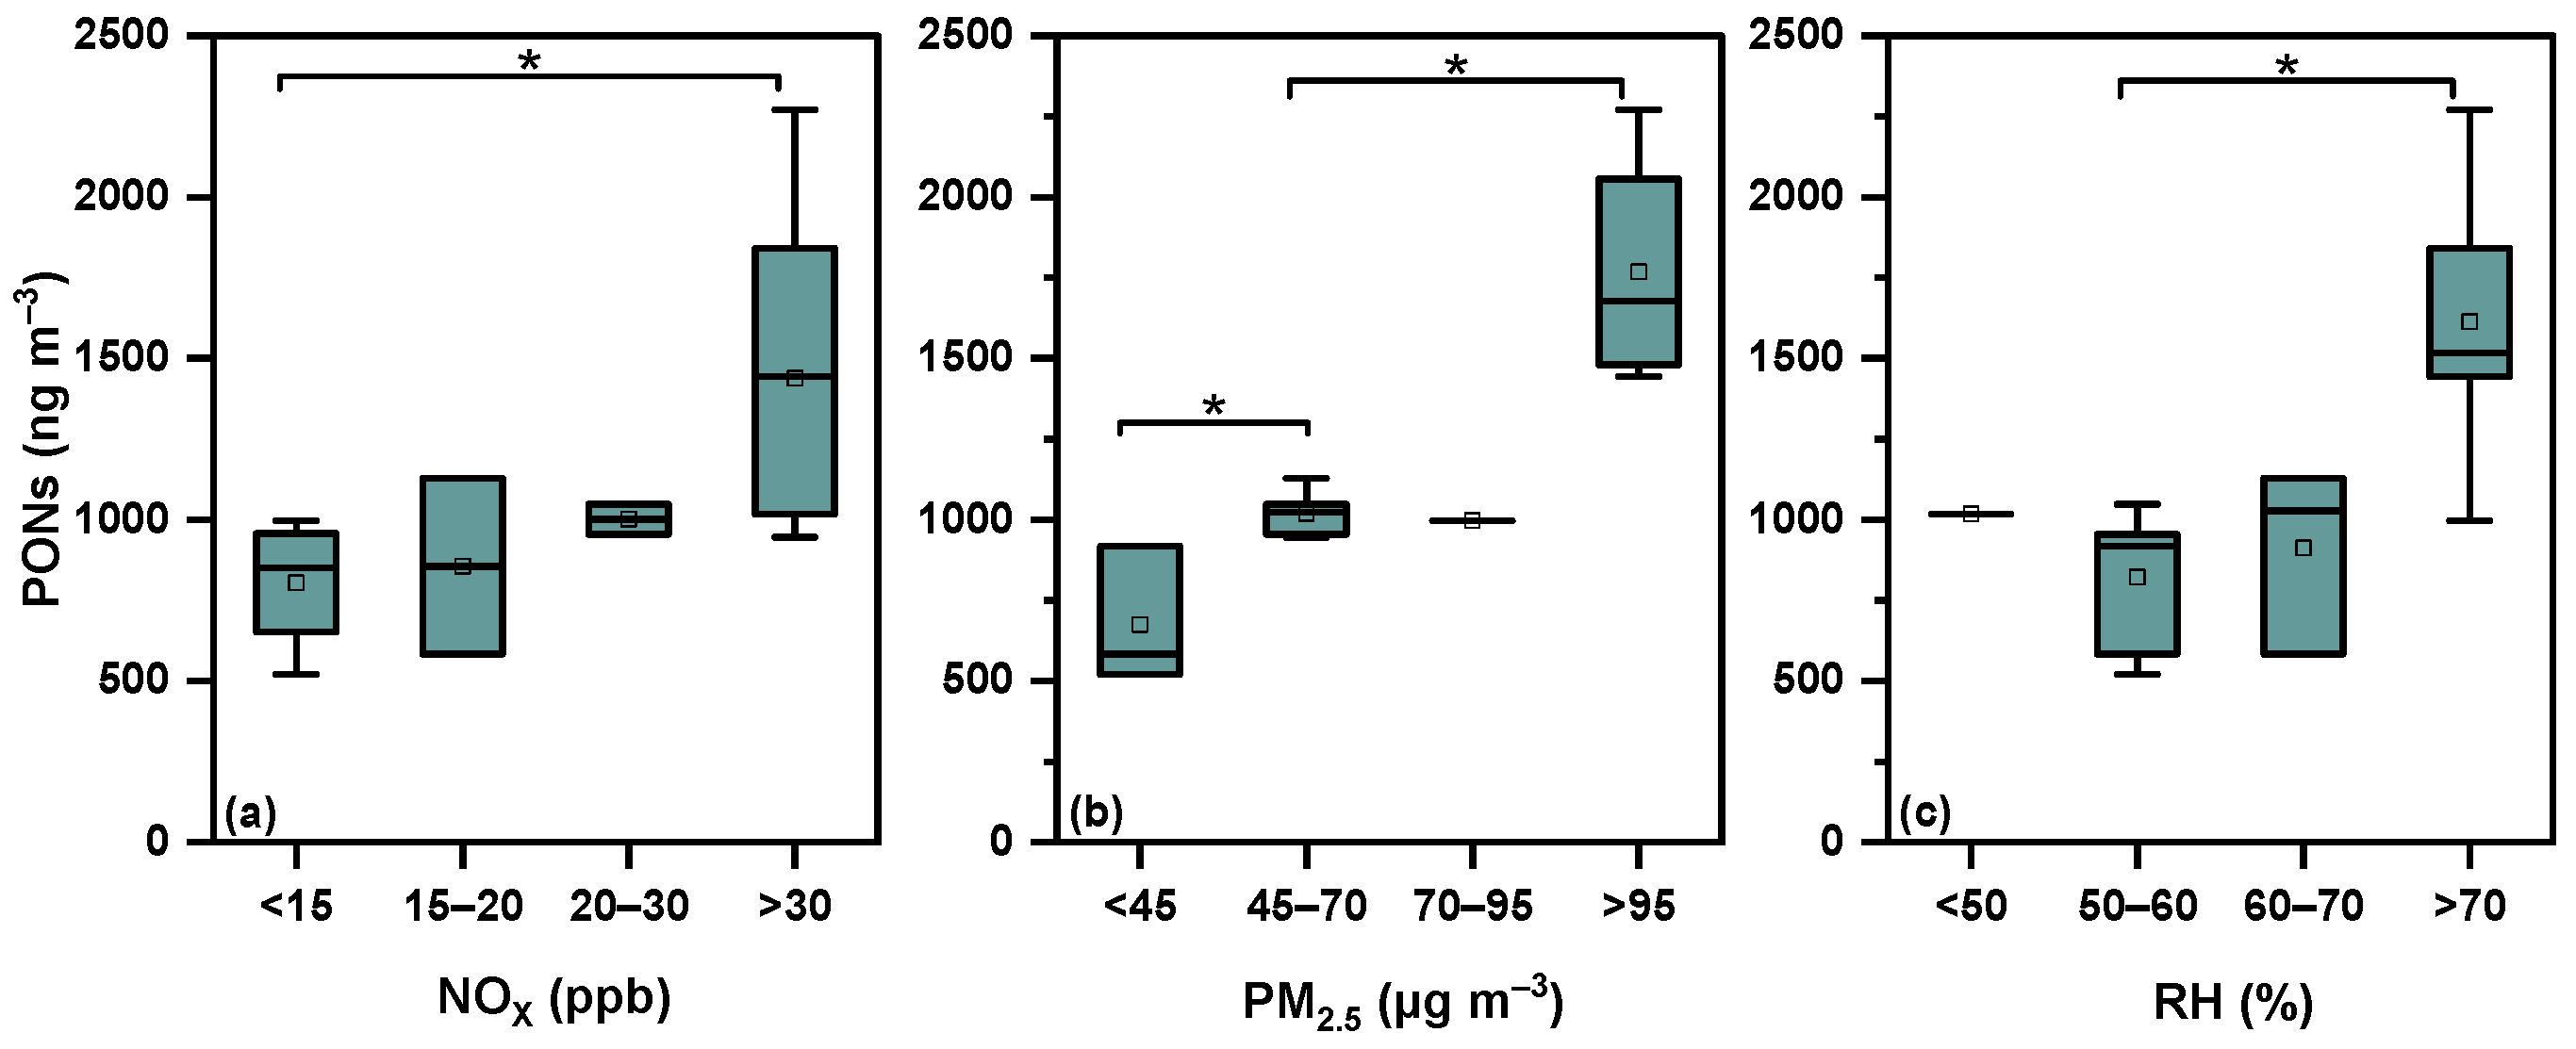
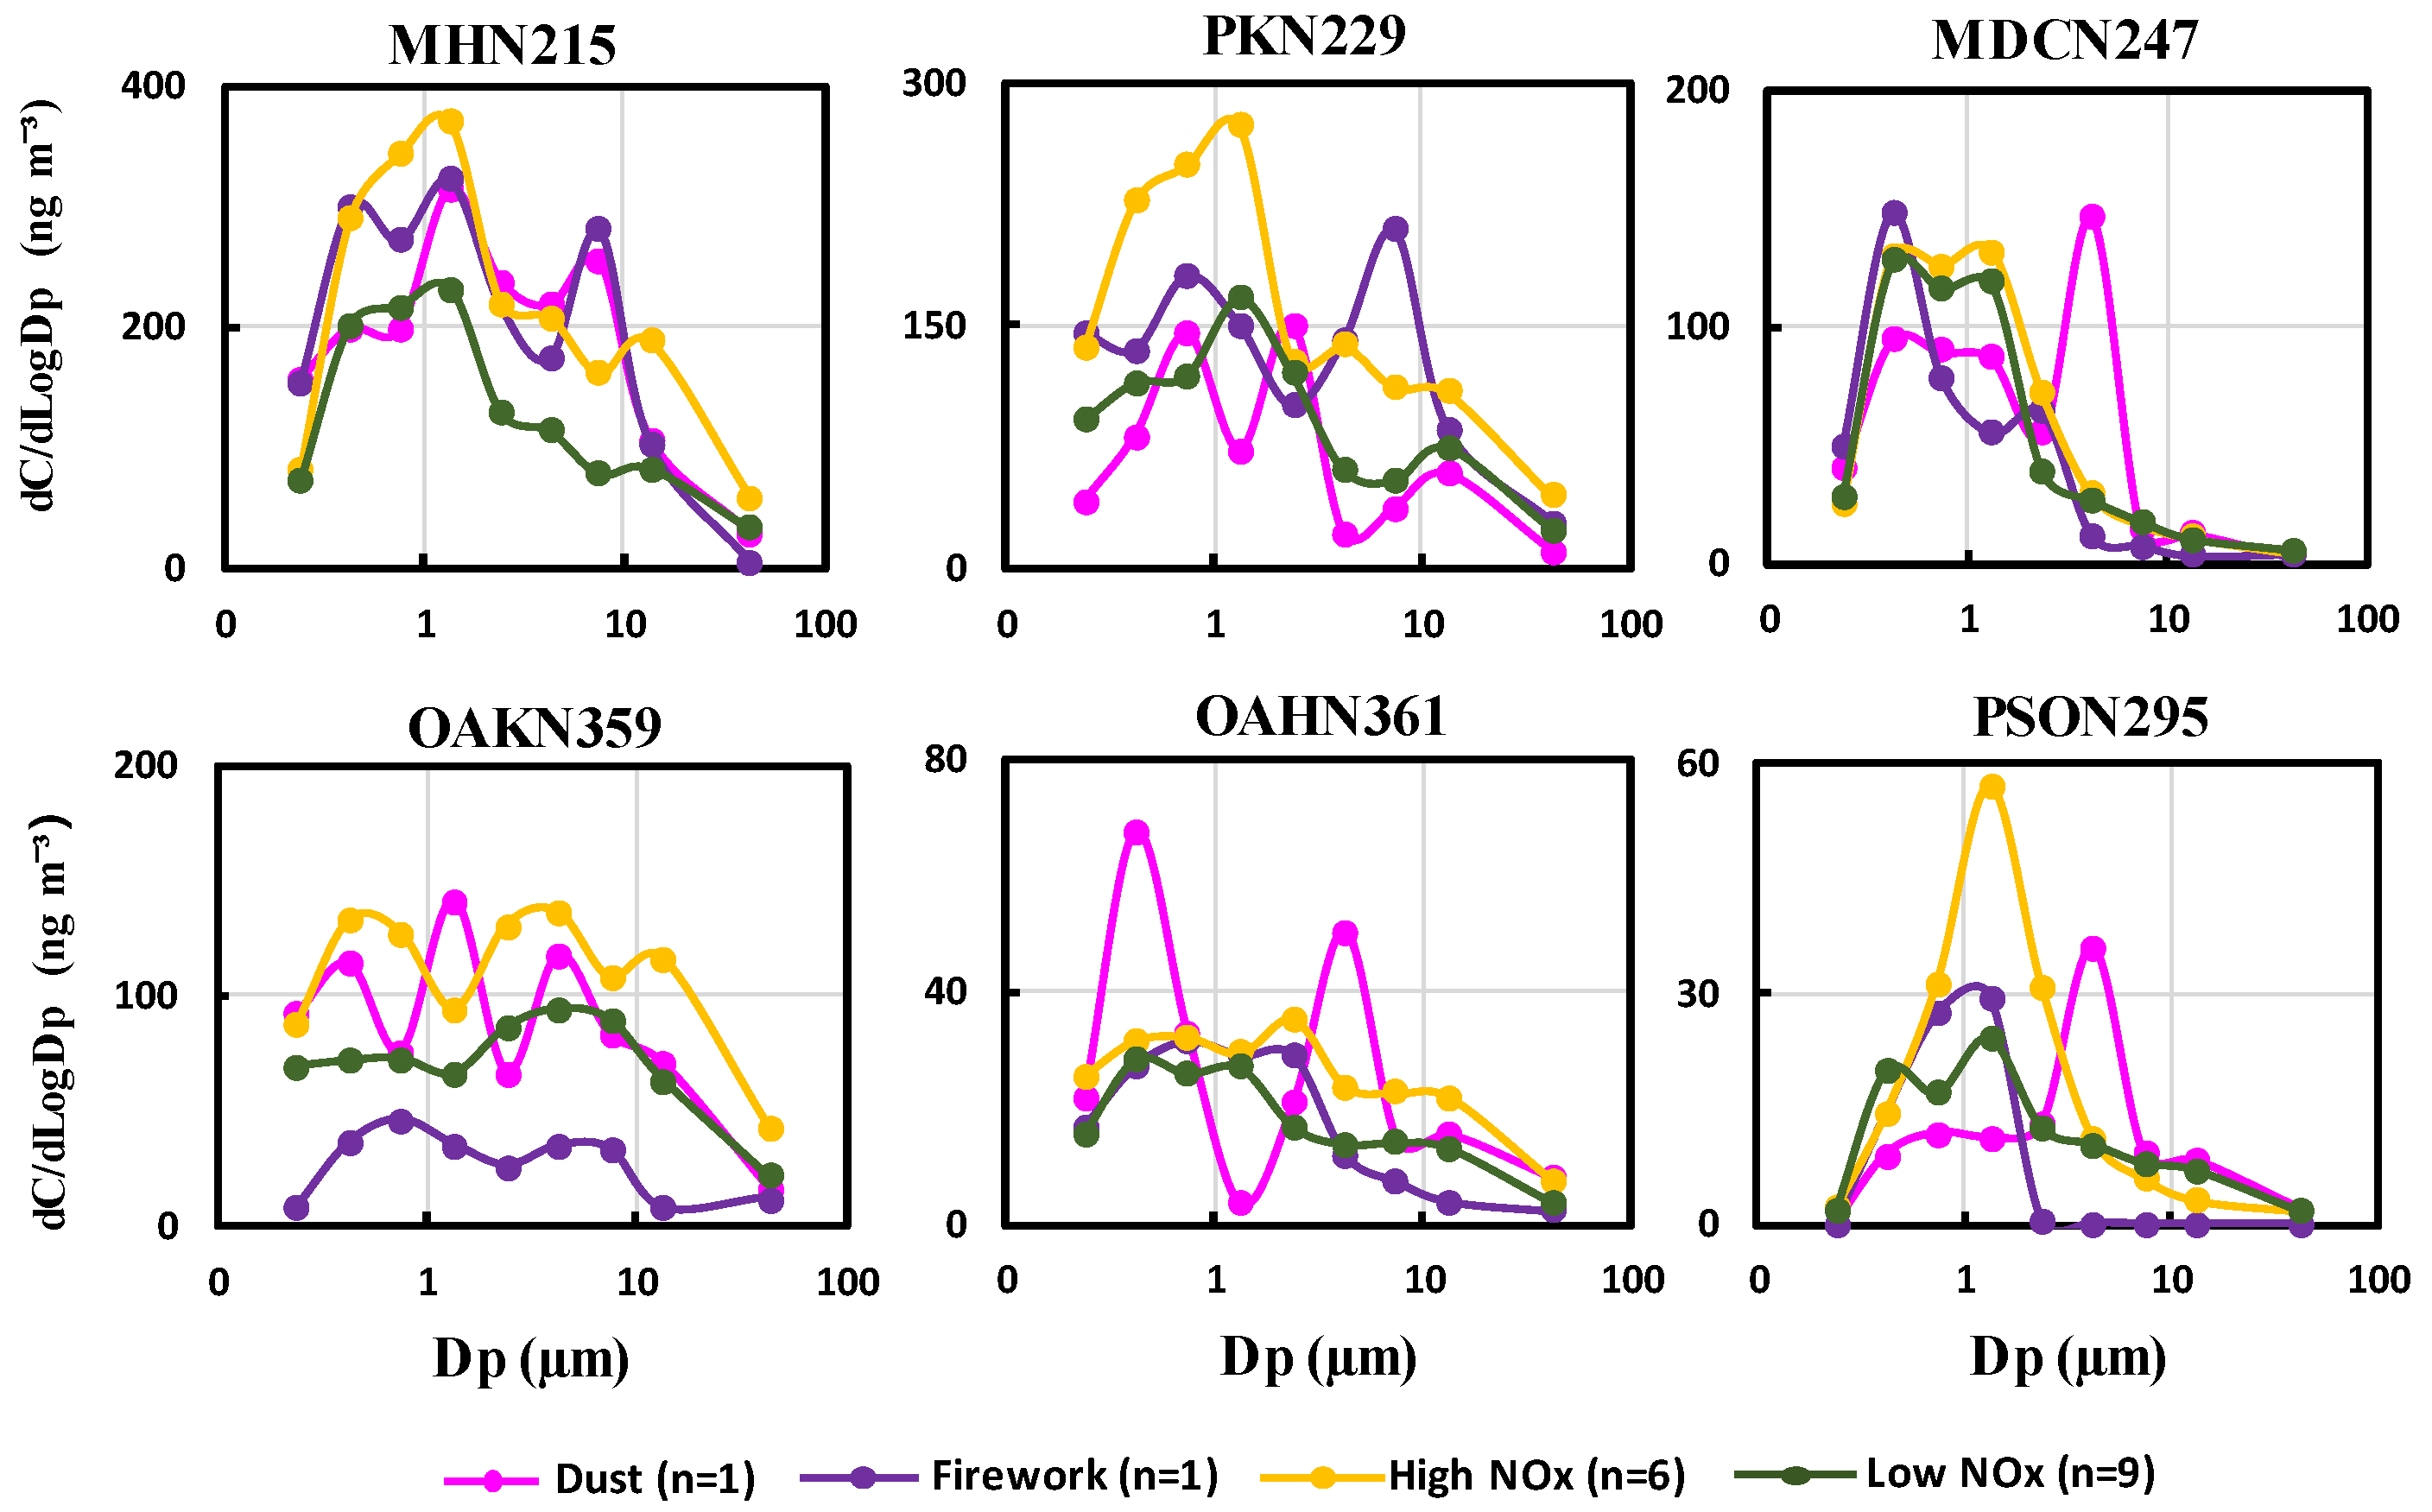
3.3. Effects of Primary Emissions on the Size Distribution Characteristics

As mentioned above, anthropogenic emissions exhibited apparent influences on the concentrations of PONs. To analyze the impact of primary emissions on the distribution characteristics, the average size distributions of the six organic nitrates during the dust event and the fireworks display and under high and low NOx conditions were compared (Figure 6). Size-resolved samples with high NOx (>25 ppb) and low NOx (<25 ppb) were chosen for the comparison, with consideration of the influence of NOx abundance on the concentrations of PONs as mentioned earlier. In addition, the size distributions of organic nitrates during the dust event (17–19 January) and fireworks display (February) were compared together to examine the differences in the distribution characteristics.
During the dust event, most organic nitrates existed in coarse-mode particles. Specifically, MHN215 and OAKN359 exhibited large concentration peaks in droplet-mode particles (1.0–1.8 µm). In addition, PSON295 and MDCN247 exhibited large whereas MHN215, OAKN359 and OAHN361 presented small concentration peaks in coarse-mode particles (3.2–5.6 µm). A small concentration peak within 0.32–0.56 µm also occurred for OAKN359 and OAHN361. During the fireworks display, MHN215 and PSON295 exhibited peaks within the size bin of 1.0–1.8 µm, and OAHN361 and OAKN359 exhibited a peak within the size bin of 0.56–1.0 µm. PKN229 exhibited a high concentration peak within size bin 5.6–10 µm (coarse mode), indicating that it was produced by condensation of gaseous compounds on pre-existing coarse particles. Notably, MDCN247 presented a high concentration within the size bin of 0.32–0.56 µm (condensation mode). In cases of high NOx conditions, large concentration peaks occurred in droplet-mode particles (1.0–1.8 µm) for MNH215, PKN229, and PSON295. Two concentration peaks were also observed for MDCN247 in fine particles, i.e., a large peak in the condensation mode (0.32–0.56 µm) and a small peak in the droplet mode (1.0–1.8 µm). Nevertheless, OAKN359 and OAHN361 showed a small peak in the coarse-mode particles (3.2–5.6 µm or 1.8–3.2 µm).

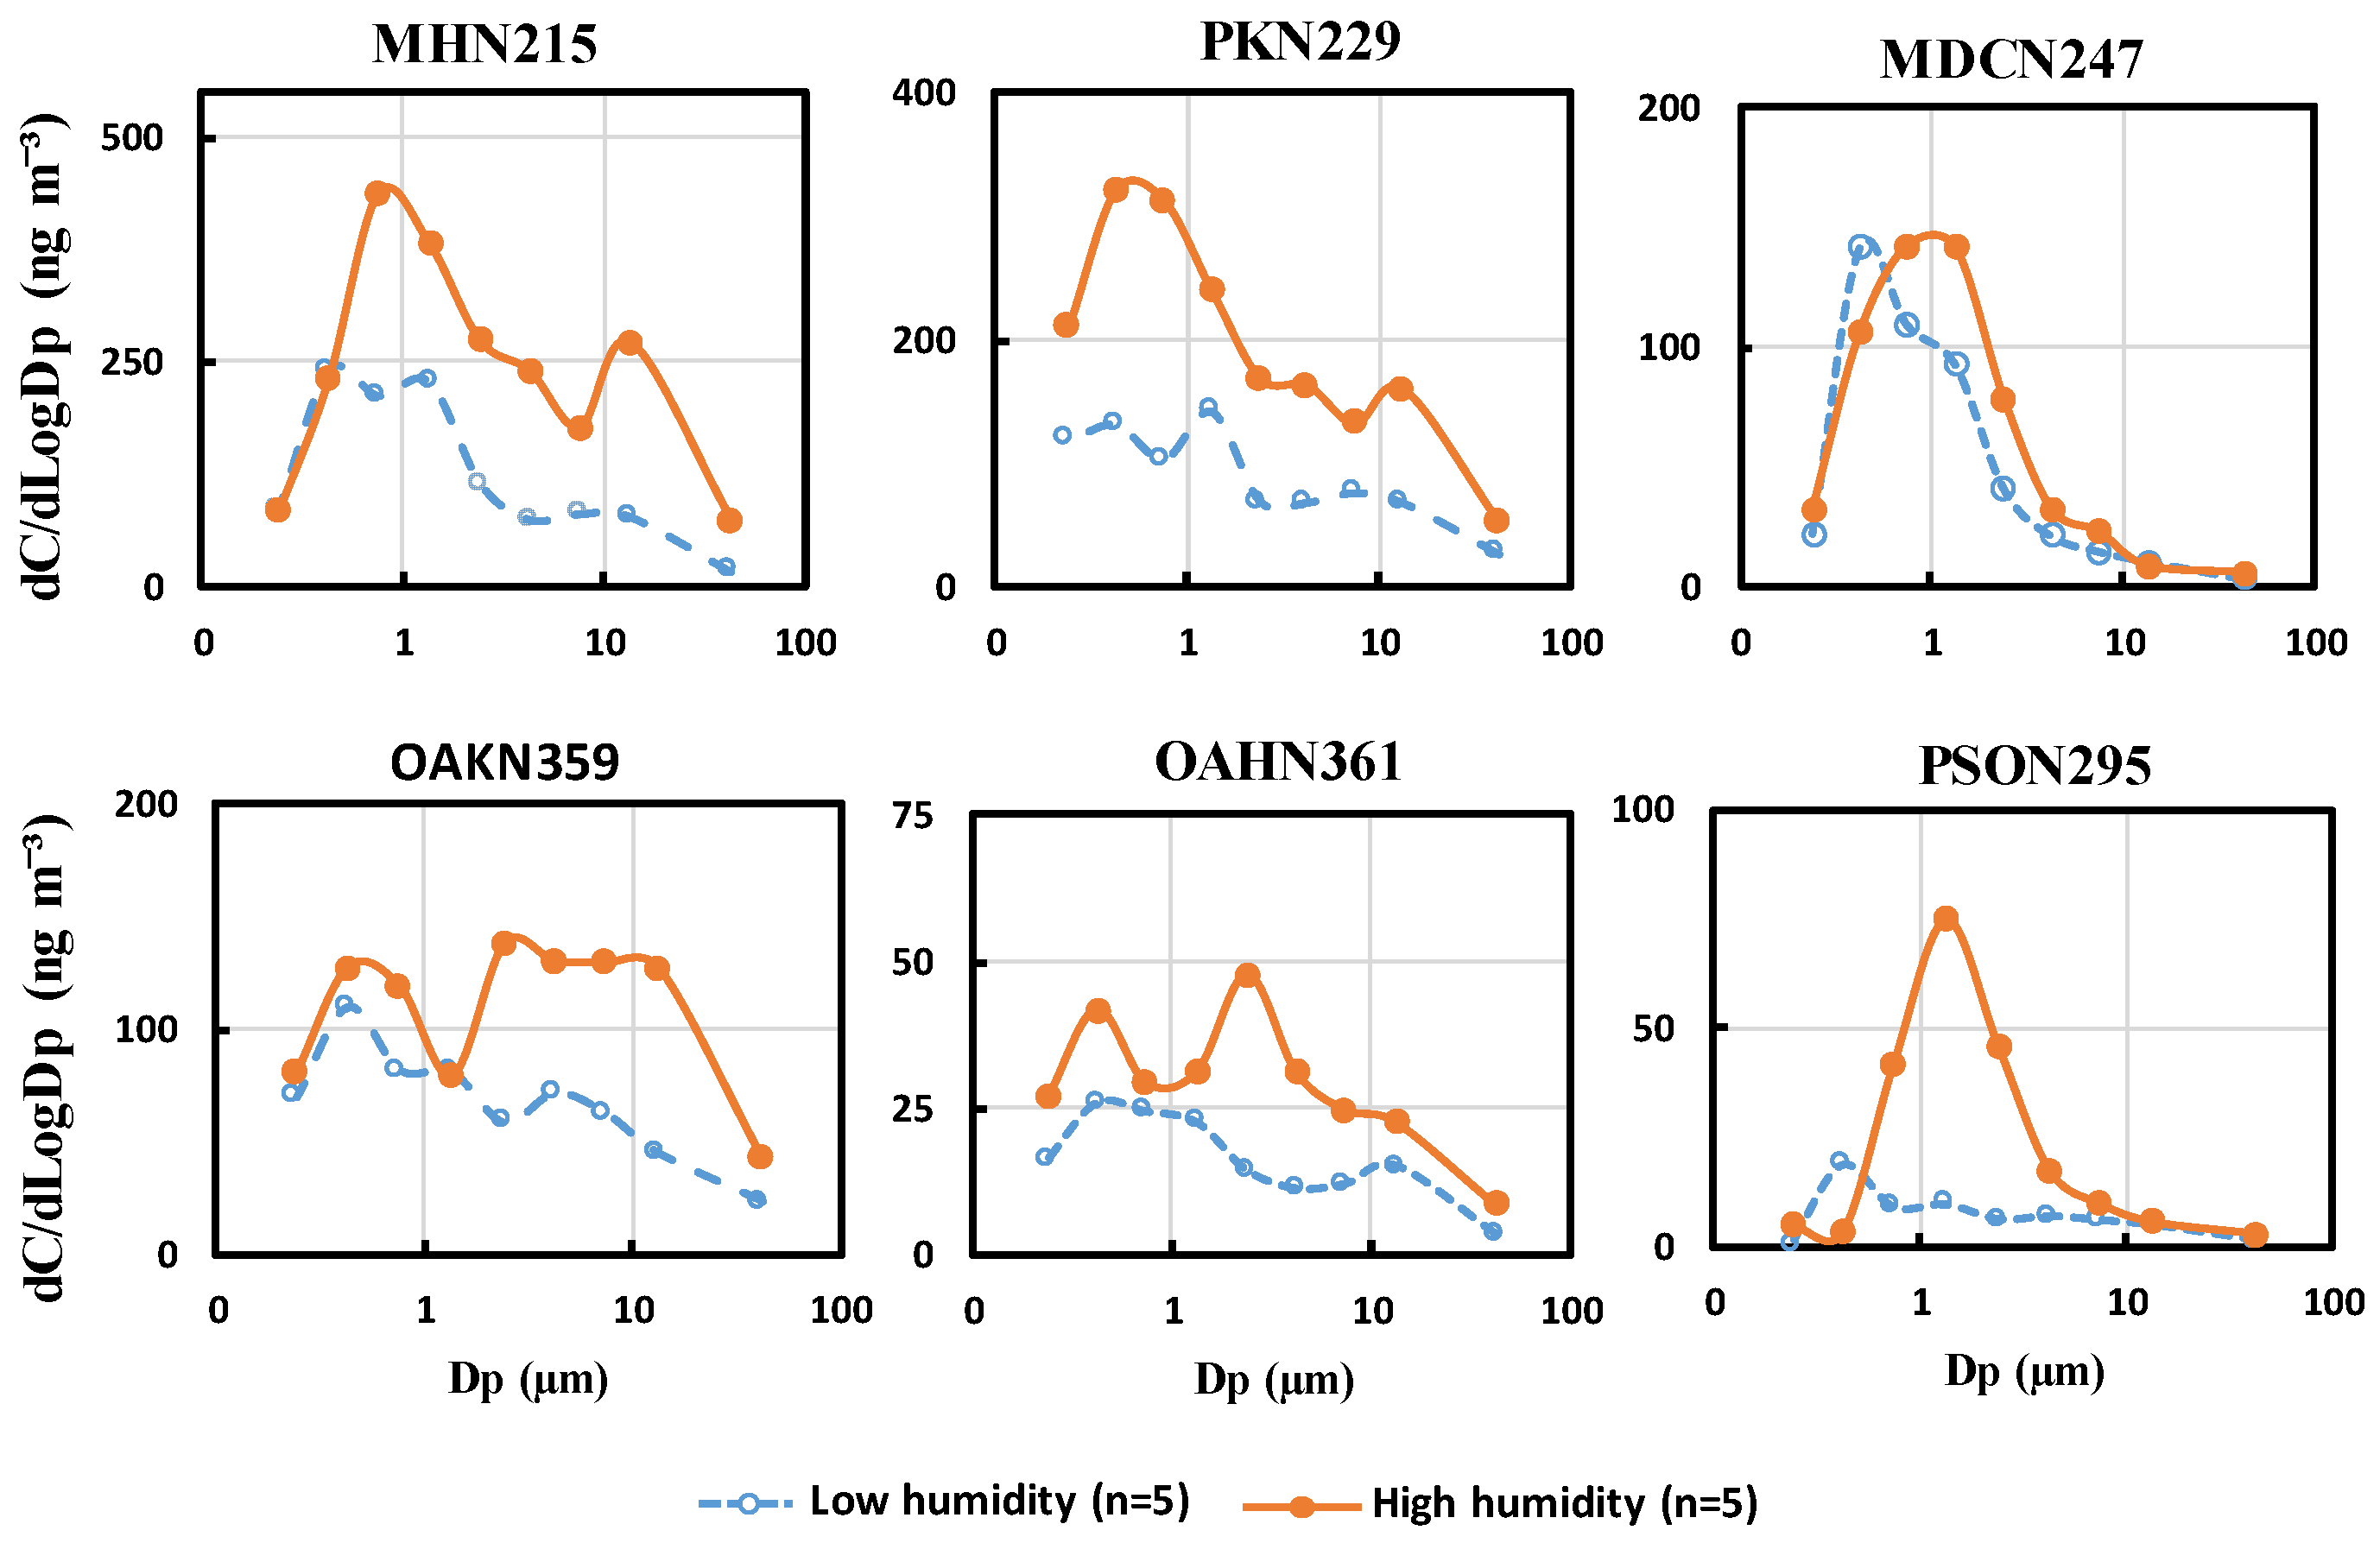
3.4. Changes in Size Distribution Caused by Moisture and Aqueous Reactions

To clarify the effect of humidity on the concentration of PONs, the size distributions of the six organic nitrates at two different humidity levels (low humidity: RH < 60% and high humidity: RH > 70%) were compared (as shown in Figure 7). A concentration peak in condensation-mode particles (0.32–0.56 µm) was observed for most of the organic nitrates at a relatively low RH (<60%). When the RH exceeded 70%, the concentrations of organic nitrates, particularly for MHN215, PKN229 and MDCN247, increased within the size ranges of 0.32–0.56 µm, and a distinct concentration peak was observed in droplet-mode particles (0.56–1.8 µm).

4. Discussion

Overall, the concentrations of PONs in fine particles in coastal Qingdao during winter were substantial high. Compared with other locations in China (as shown in Table S1), the mean total concentration in coastal Qingdao (677 ng m−3) is slightly higher than those in rural Dongying and urban Guangzhou during summer (415–512 ng m−3) [13,16]. It is nearly twice as high as those at Mt. Tai and in rural Dongying and urban Beijing during winter (201–330 ng m−3) and at Mt. Tai and in urban Jinan during spring (247–325 ng m−3) and more than three times as high as those in urban Jinan and urban Nanjing during fall (113–196 ng m−3) [13,15,16,35,36]. The substantially large amounts of organic nitrates during winter are presumably caused by the aging and transmission of pollutants from anthropogenic activities [15,37,38]. In general, the concentrations of PONs in Qingdao are similar to the concentrations recorded in rural and urban areas of Shandong, urban Beijing, and at Mt. Tai. This suggests that there are typically high levels of PONs over the North China Plain during winter.
In this study, the positive correlations between the six organic nitrates and related air pollutants and meteorological parameters indicate the important effects of NOx, PM2.5 concentrations and humidity on the formation and accumulation of PONs. In our previous study, a positive correlation was observed between NOx and PONs in rural Dongying during winter, which was attributed to the accelerated chemical reactions associated with NOx [13]. In addition, the elevated concentration of PONs under high humidity conditions is possibly caused by the facilitated gas-to-particle/liquid partitioning and aqueous formation [15]. Moreover, high levels of fine particles may increase PONs through the enhanced formation on aerosol surfaces and particle accumulation under unfavorable meteorological conditions.
The predominance of organic nitrates in fine particles in Qingdao during winter is mainly associated with their formation processes. Condensation-mode PONs were derived largely from gas-phase oxidation followed by the subsequent gas-to-particle partitioning and condensation on pre-existing particles, whereas the droplet-mode PONs probably came from the aqueous formation in the liquid water layer on aerosol surfaces [39,40]. Nevertheless, the occurrence of oleic acid-derived nitrates in coarse-mode particles was possibly related to the combination of acidic substances on alkaline crustal dusts and sea salts [41,42,43]. The decrease of MDCN247 and increase of OAKN359 in coarse particles when compared with fine particles indicate that MDCN247 has an extremely weak affinity with alkaline coarse particles, whereas OAKN359 has an extremely strong affinity. In addition, the high proportion of PKN229 in the ultrafine particles within 0.18–0.32 µm was probably caused by low volatility. More laboratory experiments are required to test and verify this speculation.
The increase in organic nitrates in droplet-mode particles during the dust event may have been caused by the unusually high humidity after the dust event. Previous studies have demonstrated that under conditions of high humidity, the aqueous chemistry of semi-volatile organic molecules may facilitate the efficient formation of SOAs [44,45]. The large surface areas of dust particles are thought to be responsible for the increase in organic nitrates in coarse-mode particles, as they promote the heterogeneous production of these species on coarse particles [46,47]. A previous study at Mount Heng observed that dusts increased the production of secondary components in coarse particles, such as sulfates and oxalates [48]. The dramatic increase in organic nitrates when fireworks were burnt suggest that the fireworks display prompted the emissions of precursors [49,50] and also the production of PONs. The dominance of droplet-mode particles during fireworks display indicates that aqueous reactions are an important pathway of their formation. In addition, the significant increase (p < 0.05) in the concentrations of PONs under the condition of high levels of NOx suggests considerable promotion of NOx on the formation of PONs. The results of the aerial investigation in the southeast of the United States have indicated that power plant plumes with high levels of NOx increase the production of isoprene-derived nitrates [22]. Furthermore, laboratory simulations have shown that changes in NOx concentrations can affect the formation pathways, production rates, and chemical composition of organic nitrates [51,52].
When ambient humidity increased, the concentrations of organic nitrates rose and the particle size at which the highest concentrations of organic nitrates occurred switched from condensation mode to droplet mode. The significant increase (p < 0.05) in the contents of organic nitrates in droplet-mode particles under elevated humid conditions shows that organic nitrates are rapidly formed through aqueous processes in the liquid layer on the aerosol surface or within small droplets. When RH exceeds over 60%, the hygroscopic components of the fine particles can absorb water vapor and create liquid water on their surfaces, thereby facilitating the secondary formation of organic nitrates through aqueous processes, which is similar to the formation mechanism of aqueous-phase sulfates [12,16,53,54]. Aljawhary et al. [55] discovered that aqueous processes provide an additional source of α-pinene oxidation products. Hence, we assume that high humidity accelerated the formation of PONs via aqueous reactions in aerosol liquid water or cloud water. Moreover, in the high-humidity samples, concentration peaks were observed in coarse-mode particles (3.2–5.6 µm) for OAKN359 and OAHN361, which probably linked to the relatively strong acidity of the oleic acid derived nitrates. More research work is needed to determine the specific causes of this phenomenon.

5. Conclusions

This study investigated six types of organic nitrates across nine distinct size ranges during the winter season in a coastal area within rural Qingdao. Coastal Qingdao exhibited generally elevated concentrations of PONs compared with other locations, with a total average concentration of 677 ng m−3 in fine particles. Among the six identified organic nitrates, MHN215, PKN229, and MDCN247 were the most abundant. Emissions of NOx and burning of fireworks during the festival caused a notable impact on organic nitrate concentrations. However, the presence of dust contributed to uneven production of organic nitrates in coarse particles. Moreover, the moisture over the coastal region enhanced the production of organic nitrates in droplet-mode particles. Our results highlight the substantial influences of anthropogenic emissions on the formation of PONs in different particle sizes. They help policy makers in the regulation of emissions and controlling factors that contribute to PONs. Nevertheless, the complex and seasonally varying nature of primary and secondary processes necessitates long-term comprehensive field and laboratory studies to fully understand the diverse formation pathways involved.

Supplementary Materials

The following supporting information can be downloaded at: https://www.mdpi.com/article/10.3390/su152416776/s1, Table S1: Average concentrations of organic nitrates in fine particles observed in this study and other locations in the literature (unit: ng m−3); Figure S1: Photos of the MOUDI for collecting particulate matter samples (left) and the UPLC-MS for analyzing organic nitrates (right) in this study; Figure S2: Standard curves of ricinoleic acid, 2-hydroxy-3-pinanone and camphor sulfonic acid; Figure S3: Pearson’s correlation matrix between six organic nitrates and different air pollutants including ozone (O3), sulfur dioxide (SO2), nitric oxide (NO), nitrogen oxide (NOx), and fine particles (PM2.5) and meteorological parameters covering relative humidity (RH), wind direction (WD), wind speed (WS), and temperature (T). “×” represents the significant level p > 0.05.

Author Contributions

Validation, Formal analysis, Investigation, Writing—Original draft, A.S.; Conceptualization, Methodology, Resources, Writing—Review & editing, Supervision, Funding acquisition, X.W.; Data curation, Methodology, J.C.; Investigation, Y.L.; Formal analysis, S.K.; Supervision, Writing—Review & editing, J.A.; Writing—Review & editing, J.H.S.; Resources, L.X.; Resources, W.W. All authors have read and agreed to the published version of the manuscript.

Funding

This work was supported by the National Natural Science Foundation of China (nos. 42377094, 42250410319), the Natural Science Foundation of Shandong Province (no. ZR2020YQ30), and received financial support from Shandong University (grant no. 2020QNQT012). The authors would like to express gratitude to the Weather Underground for providing meteorological data.

Institutional Review Board Statement

Not applicable.

Informed Consent Statement

Not applicable.

Data Availability Statement

The data presented in this study are available on request from the corresponding author. The data are not publicly available due to confidentiality conditions.

Conflicts of Interest

The authors declare no conflict of interest.

References

  1. Ayres, B.R.; Allen, H.M.; Draper, D.C.; Brown, S.S.; Wild, R.J.; Jimenez, J.L.; Day, D.A.; Campuzano-Jost, P.; Hu, W.; de Gouw, J.; et al. Organic nitrate aerosol formation via NO3 + biogenic volatile organic compounds in the southeastern United States. Atmos. Chem. Phys. 2015, 15, 13377–13392. [Google Scholar] [CrossRef]
  2. Jia, N.; Li, Y.; Chen, R.; Yang, H. A Review of Global PM2.5 Exposure Research Trends from 1992 to 2022. Sustainability 2023, 15, 10509. [Google Scholar] [CrossRef]
  3. Lee, A.K.Y.; Adam, M.G.; Liggio, J.; Li, S.M.; Li, K.; Willis, M.D.; Abbatt, J.P.D.; Tokarek, T.W.; Odame-Ankrah, C.A.; Osthoff, H.D.; et al. A large contribution of anthropogenic organo-nitrates to secondary organic aerosol in the Alberta oil sands. Atmos. Chem. Phys. 2019, 19, 12209–12219. [Google Scholar] [CrossRef]
  4. Ng, N.L.; Brown, S.S.; Archibald, A.T.; Atlas, E.; Cohen, R.C.; Crowley, J.N.; Day, D.A.; Donahue, N.M.; Fry, J.L.; Fuchs, H.; et al. Nitrate radicals and biogenic volatile organic compounds: Oxidation, mechanisms, and organic aerosol. Atmos. Chem. Phys. 2017, 17, 2103–2162. [Google Scholar] [CrossRef]
  5. Xu, L.; Suresh, S.; Guo, H.; Weber, R.J.; Ng, N.L. Aerosol characterization over the southeastern United States using high-resolution aerosol mass spectrometry: Spatial and seasonal variation of aerosol composition and sources with a focus on organic nitrates. Atmos. Chem. Phys. 2015, 15, 7307–7336. [Google Scholar] [CrossRef]
  6. Rollins, A.W.; Browne, E.C.; Min, K.E.; Pusede, S.E.; Wooldridge, P.J.; Gentner, D.R.; Goldstein, A.H.; Liu, S.; Day, D.A.; Russell, L.M.; et al. Evidence for NO(x) control over nighttime SOA formation. Science 2012, 337, 1210–1212. [Google Scholar] [CrossRef]
  7. Mao, J.; Paulot, F.; Jacob, D.J.; Cohen, R.C.; Crounse, J.D.; Wennberg, P.O.; Keller, C.A.; Hudman, R.C.; Barkley, M.P.; Horowitz, L.W. Ozone and organic nitrates over the eastern United States: Sensitivity to isoprene chemistry. J. Geophys. Res. Atmos. 2013, 118, 11256–11268. [Google Scholar] [CrossRef]
  8. Lee, B.H.; Mohr, C.; Lopez-Hilfiker, F.D.; Lutz, A.; Hallquist, M.; Lee, L.; Romer, P.; Cohen, R.C.; Iyer, S.; Kurtén, T.; et al. Highly functionalized organic nitrates in the southeast United States: Contribution to secondary organic aerosol and reactive nitrogen budgets. Proc. Natl. Acad. Sci. USA 2016, 113, 1516–1521. [Google Scholar] [CrossRef]
  9. Farmer, D.K.; Perring, A.E.; Wooldridge, P.J.; Blake, D.R.; Baker, A.; Meinardi, S.; Huey, L.G.; Tanner, D.; Vargas, O.; Cohen, R.C. Impact of organic nitrates on urban ozone production. Atmos. Chem. Phys. 2011, 11, 4085–4094. [Google Scholar] [CrossRef]
  10. Zare, A.; Romer, P.S.; Nguyen, T.; Keutsch, F.N.; Skog, K.; Cohen, R.C. A comprehensive organic nitrate chemistry: Insights into the lifetime of atmospheric organic nitrates. Atmos. Chem. Phys. 2018, 18, 15419–15436. [Google Scholar] [CrossRef]
  11. Tegen, I.; Schepanski, K. Climate Feedback on Aerosol Emission and Atmospheric Concentrations. Curr. Clim. Chang. Rep. 2018, 4, 1–10. [Google Scholar] [CrossRef]
  12. Xu, L.; Guo, H.; Boyd, C.M.; Klein, M.; Bougiatioti, A.; Cerully, K.M.; Hite, J.R.; Isaacman-VanWertz, G.; Kreisberg, N.M.; Knote, C.; et al. Effects of anthropogenic emissions on aerosol formation from isoprene and monoterpenes in the southeastern United States. Proc. Natl. Acad. Sci. USA 2015, 112, 37–42. [Google Scholar] [CrossRef]
  13. Zhang, J.; Wang, X.; Li, R.; Dong, S.; Chen, J.; Zhang, Y.; Zheng, P.; Li, M.; Chen, T.; Liu, Y.; et al. Significant impacts of anthropogenic activities on monoterpene and oleic acid-derived particulate organic nitrates in the North China Plain. Atmos. Res. 2021, 256, 105585. [Google Scholar] [CrossRef]
  14. Xu, L.; Du, L.; Tsona, N.T.; Ge, M. Anthropogenic Effects on Biogenic Secondary Organic Aerosol Formation. Adv. Atmos. Sci. 2021, 38, 1053–1084. [Google Scholar] [CrossRef]
  15. Chen, J.; Wang, X.; Zhang, J.; Li, M.; Li, H.; Liu, Z.; Bi, Y.; Wu, D.; Yin, X.; Gu, R.; et al. Particulate organic nitrates at Mount Tai in winter and spring: Variation characteristics and effects of mountain-valley breezes and elevated emission sources. Environ. Res. 2022, 212, 113182. [Google Scholar] [CrossRef]
  16. Zhang, J.; Wang, X.; Li, R.; Dong, S.; Zhang, Y.; Zheng, P.; Li, M.; Chen, T.; Liu, Y.; Xue, L.; et al. Particulate organic nitrates in eastern China: Variation characteristics and effects of anthropogenic activities. Atmos. Chem. Phys. Discuss. 2019, 19, 1–22. [Google Scholar] [CrossRef]
  17. Li, J.; Li, H.; Li, K.; Chen, Y.; Zhang, H.; Zhang, X.; Wu, Z.; Liu, Y.; Wang, X.; Wang, W.; et al. Enhanced secondary organic aerosol formation from the photo-oxidation of mixed anthropogenic volatile organic compounds. Atmos. Chem. Phys. 2021, 21, 7773–7789. [Google Scholar] [CrossRef]
  18. Xu, Y.; Miyazaki, Y.; Tachibana, E.; Sato, K.; Ramasamy, S.; Mochizuki, T.; Sadanaga, Y.; Nakashima, Y.; Sakamoto, Y.; Matsuda, K.; et al. Aerosol Liquid Water Promotes the Formation of Water-Soluble Organic Nitrogen in Submicrometer Aerosols in a Suburban Forest. Environ. Sci. Technol. 2020, 54, 1406–1414. [Google Scholar] [CrossRef]
  19. Riedel, T.; Lin, Y.-H.; Budisulistiorini, S.; Gaston, C.; Thornton, J.; Zhang, Z.; Vizuete, W.; Gold, A.; Surratt, J. Heterogeneous Reactions of Isoprene-Derived Epoxides: Reaction Probabilities and Molar Secondary Organic Aerosol Yield Estimates. Environ. Sci. Technol. Lett. 2015, 2, 38–42. [Google Scholar] [CrossRef]
  20. Northcross, A.L.; Jang, M. Heterogeneous SOA yield from ozonolysis of monoterpenes in the presence of inorganic acid. Atmos. Environ. 2007, 41, 1483–1493. [Google Scholar] [CrossRef]
  21. Rindelaub, J.D.; Borca, C.H.; Hostetler, M.A.; Slade, J.H.; Lipton, M.A.; Slipchenko, L.V.; Shepson, P.B. The acid-catalyzed hydrolysis of an α-pinene-derived organic nitrate: Kinetics, products, reaction mechanisms, and atmospheric impact. Atmos. Chem. Phys. 2016, 16, 15425–15432. [Google Scholar] [CrossRef]
  22. Fry, J.L.; Brown, S.S.; Middlebrook, A.M.; Edwards, P.M.; Campuzano-Jost, P.; Day, D.A.; Jimenez, J.L.; Allen, H.M.; Ryerson, T.B.; Pollack, I.; et al. Secondary organic aerosol (SOA) yields from NO3 radical + isoprene based on nighttime aircraft power plant plume transects. Atmos. Chem. Phys. 2018, 18, 11663–11682. [Google Scholar] [CrossRef]
  23. Huang, W.; Yang, Y.; Wang, Y.; Gao, W.; Li, H.; Zhang, Y.; Li, J.; Zhao, S.; Yan, Y.; Ji, D.; et al. Exploring the inorganic and organic nitrate aerosol formation regimes at a suburban site on the North China Plain. Sci. Total Environ. 2021, 768, 144538. [Google Scholar] [CrossRef]
  24. Pye, H.O.T.; Luecken, D.J.; Xu, L.; Boyd, C.M.; Ng, N.L.; Baker, K.R.; Ayres, B.R.; Bash, J.O.; Baumann, K.; Carter, W.P.L.; et al. Modeling the Current and Future Roles of Particulate Organic Nitrates in the Southeastern United States. Environ. Sci. Technol. 2015, 49, 14195–14203. [Google Scholar] [CrossRef]
  25. Ma, Y.; Xu, X.; Song, W.; Geng, F.; Wang, L. Seasonal and diurnal variations of particulate organosulfates in urban Shanghai, China. Atmos. Environ. 2014, 85, 152–160. [Google Scholar] [CrossRef]
  26. He, Q.-F.; Ding, X.; Wang, X.-M.; Yu, J.-Z.; Fu, X.-X.; Liu, T.-Y.; Zhang, Z.; Xue, J.; Chen, D.-H.; Zhong, L.-J.; et al. Organosulfates from Pinene and Isoprene over the Pearl River Delta, South China: Seasonal Variation and Implication in Formation Mechanisms. Environ. Sci. Technol. 2014, 48, 9236–9245. [Google Scholar] [CrossRef]
  27. Zhang, J.K.; Cheng, M.T.; Ji, D.S.; Liu, Z.R.; Hu, B.; Sun, Y.; Wang, Y.S. Characterization of submicron particles during biomass burning and coal combustion periods in Beijing, China. Sci. Total Environ. 2016, 562, 812–821. [Google Scholar] [CrossRef]
  28. Ye, Y.; Xie, Z.; Zhu, M.; Wang, X. Molecular Characterization of Organosulfates in Arctic Ocean and Antarctic atmospheric aerosols. Atmos. Chem. Phys. Discuss. 2019, 19, 1–24. [Google Scholar] [CrossRef]
  29. Wang, Y.; Hu, M.; Guo, S.; Wang, Y.; Zheng, J.; Yang, Y.; Zhu, W.; Tang, R.; Li, X.; Liu, Y.; et al. The secondary formation of organosulfates under interactions between biogenic emissions and anthropogenic pollutants in summer in Beijing. Atmos. Chem. Phys. 2018, 18, 10693–10713. [Google Scholar] [CrossRef]
  30. Zhang, Y.; Sun, J.; Zheng, P.; Chen, T.; Liu, Y.; Han, G.; Simpson, I.J.; Wang, X.; Blake, D.R.; Li, Z.; et al. Observations of C1–C5 alkyl nitrates in the Yellow River Delta, northern China: Effects of biomass burning and oil field emissions. Sci. Total Environ. 2019, 656, 129–139. [Google Scholar] [CrossRef] [PubMed]
  31. Fu, M.; Yang, Y.; Li, Y.; Wang, H.; Yu, F.; Liu, J. Beijing Heavy-Duty Diesel Vehicle Battery Capacity Conversion and Emission Estimation in 2022. Sustainability 2023, 15, 11019. [Google Scholar] [CrossRef]
  32. Yang, X.; Deng, X.; Li, G.; Liu, Y.; Gao, Q. Human Activities Aggravate VOC Pollution in the Huangshui River of the Tibetan Plateau. Sustainability 2022, 14, 11983. [Google Scholar] [CrossRef]
  33. Liang, Y.; Wang, X.; Dong, S.; Liu, Z.; Mu, J.; Lu, C.; Zhang, J.; Li, M.; Xue, L.; Wang, W. Size distributions of nitrated phenols in winter at a coastal site in north China and the impacts from primary sources and secondary formation. Chemosphere 2020, 250, 126256. [Google Scholar] [CrossRef]
  34. Cloud. IBM. 2019. Available online: https://www.wunderground.com (accessed on 25 February 2019).
  35. Li, R.; Wang, X.; Gu, R.; Lu, C.; Zhu, F.; Xue, L.; Xie, H.; Du, L.; Chen, J.; Wang, W. Identification and semi-quantification of biogenic organic nitrates in ambient particulate matters by UHPLC/ESI-MS. Atmos. Environ. 2018, 176, 140–147. [Google Scholar] [CrossRef]
  36. Zhang, J.; Wang, X.; Zhang, Y.; Gu, R.; Xia, M.; Li, H.; Dong, S.; Xue, L.; Wu, Z.; Zhang, Y.; et al. Pollution characteristics and formation of particulate organic nitrates in winter in Beijing City. Geochimica 2020, 49, 252–261. [Google Scholar] [CrossRef]
  37. Miousse, I.R.; Hale, R.B.; Alsbrook, S.; Boysen, G.; Broadnax, T.; Murry, C.; Williams, C.; Park, C.H.; Richards, R.; Reedy, J.; et al. Climate Change and New Challenges for Rural Communities: Particulate Matter Matters. Sustainability 2023, 15, 16192. [Google Scholar] [CrossRef]
  38. Huang, H.; Jiang, P.; Chen, Y. Analysis of the Social and Economic Factors Influencing PM2.5 Emissions at the City Level in China. Sustainability 2023, 15, 16335. [Google Scholar] [CrossRef]
  39. Shchekin, A.K.; Podguzova, T.S. The modified Thomson equation in the theory of heterogeneous vapor nucleation on charged solid particles. Atmos. Res. 2011, 101, 493–502. [Google Scholar] [CrossRef]
  40. Chim, M.M.; Cheng, C.T.; Davies, J.F.; Berkemeier, T.; Shiraiwa, M.; Zuend, A.; Chan, M.N. Compositional evolution of particle-phase reaction products and water in the heterogeneous OH oxidation of model aqueous organic aerosols. Atmos. Chem. Phys. 2017, 17, 14415–14431. [Google Scholar] [CrossRef]
  41. Li, J.; Wang, G.; Zhou, B.; Cheng, C.; Cao, J.; Shen, Z.; An, Z. Chemical composition and size distribution of wintertime aerosols in the atmosphere of Mt. Hua in central China. Atmos. Environ. 2011, 45, 1251–1258. [Google Scholar] [CrossRef]
  42. Zhang, D.; Zang, J.; Shi, G.; Iwasaka, Y.; Matsuki, A.; Trochkine, D. Mixture state of individual Asian dust particles at a coastal site of Qingdao, China. Atmos. Environ. 2003, 37, 3895–3901. [Google Scholar] [CrossRef]
  43. Huang, X.-F.; Dai, J.; Zhu, Q.; Yu, K.; Du, K. Abundant Biogenic Oxygenated Organic Aerosol in Atmospheric Coarse Particles: Plausible Sources and Atmospheric Implications. Environ. Sci. Technol. 2020, 54, 1425–1430. [Google Scholar] [CrossRef]
  44. Hu, W.; Hu, M.; Hu, W.; Jimenez, J.L.; Yuan, B.; Chen, W.; Wang, M.; Wu, Y.; Chen, C.; Wang, Z.; et al. Chemical composition, sources, and aging process of submicron aerosols in Beijing: Contrast between summer and winter. J. Geophys. Res. Atmos. 2016, 121, 1955–1977. [Google Scholar] [CrossRef]
  45. Hu, J.; Wang, P.; Ying, Q.; Zhang, H.; Chen, J.; Ge, X.; Li, X.; Jiang, J.; Wang, S.; Zhang, J.; et al. Modeling biogenic and anthropogenic secondary organic aerosol in China. Atmos. Chem. Phys. 2017, 17, 77–92. [Google Scholar] [CrossRef]
  46. Wang, G.H.; Zhou, B.H.; Cheng, C.L.; Cao, J.J.; Li, J.J.; Meng, J.J.; Tao, J.; Zhang, R.J.; Fu, P.Q. Impact of Gobi desert dust on aerosol chemistry of Xi’an, inland China during spring 2009: Differences in composition and size distribution between the urban ground surface and the mountain atmosphere. Atmos. Chem. Phys. 2013, 13, 819–835. [Google Scholar] [CrossRef]
  47. Lv, S.; Wang, F.; Wu, C.; Chen, Y.; Liu, S.; Zhang, S.; Li, D.; Du, W.; Zhang, F.; Wang, H.; et al. Gas-to-Aerosol Phase Partitioning of Atmospheric Water-Soluble Organic Compounds at a Rural Site in China: An Enhancing Effect of NH3 on SOA Formation. Environ. Sci. Technol. 2022, 56, 3915–3924. [Google Scholar] [CrossRef]
  48. Wang, X.; Wang, W.; Xue, L.; Gao, X.; Nie, W.; Yu, Y.; Zhou, Y.; Yang, L.; Zhang, Q.; Wang, T. Size-resolved aerosol ionic composition and secondary formation at Mount Heng in South Central China. Front. Environ. Sci. Eng. 2013, 7, 815–826. [Google Scholar] [CrossRef]
  49. Kong, S.F.; Li, L.; Li, X.X.; Yin, Y.; Chen, K.; Liu, D.T.; Yuan, L.; Zhang, Y.J.; Shan, Y.P.; Ji, Y.Q. The impacts of firework burning at the Chinese Spring Festival on air quality: Insights of tracers, source evolution and aging processes. Atmos. Chem. Phys. 2015, 15, 2167–2184. [Google Scholar] [CrossRef]
  50. Singh, A.; Pant, P.; Pope, F.D. Air quality during and after festivals: Aerosol concentrations, composition and health effects. Atmos. Res. 2019, 227, 220–232. [Google Scholar] [CrossRef]
  51. Morales, A.C.; Jayarathne, T.; Slade, J.H.; Laskin, A.; Shepson, P.B. The production and hydrolysis of organic nitrates from OH radical oxidation of β-ocimene. Atmos. Chem. Phys. 2021, 21, 129–145. [Google Scholar] [CrossRef]
  52. Pullinen, I.; Schmitt, S.; Kang, S.; Sarrafzadeh, M.; Schlag, P.; Andres, S.; Kleist, E.; Mentel, T.F.; Rohrer, F.; Springer, M.; et al. Impact of NOx on secondary organic aerosol (SOA) formation from α-pinene and β-pinene photooxidation: The role of highly oxygenated organic nitrates. Atmos. Chem. Phys. 2020, 20, 10125–10147. [Google Scholar] [CrossRef]
  53. Fang, Y.; Ye, C.; Wang, J.; Wu, Y.; Hu, M.; Lin, W.; Xu, F.; Zhu, T. Relative humidity and O3 concentration as two prerequisites for sulfate formation. Atmos. Chem. Phys. 2019, 19, 12295–12307. [Google Scholar] [CrossRef]
  54. Li, J.; Zhang, Z.; Wu, Y.; Tao, J.; Xia, Y.; Wang, C.; Zhang, R. Effects of chemical compositions in fine particles and their identified sources on hygroscopic growth factor during dry season in urban Guangzhou of South China. Sci. Total Environ. 2021, 801, 149749. [Google Scholar] [CrossRef]
  55. Aljawhary, D.; Zhao, R.; Lee, A.K.Y.; Wang, C.; Abbatt, J.P.D. Kinetics, Mechanism, and Secondary Organic Aerosol Yield of Aqueous Phase Photo-Oxidation of α-Pinene Oxidation Products. J. Phys. Chem. A 2016, 120, 1395–1407. [Google Scholar] [CrossRef]
Figure 1. Map showing the location of the sampling site and the surrounding roads and residential areas.
Sustainability 15 16776 g001
Figure 2. Time series of the concentrations of six organic nitrates in total suspended particles and relevant pollutants including nitrogen oxide (NOx), nitric oxide (NO), ozone (O3), sulfur dioxide (SO2), and fine particles (PM2.5), and meteorological parameters covering temperature (T), relative humidity (RH), and wind direction and speed. Orange shading indicates the dust event and pink shading indicates fireworks display.
Sustainability 15 16776 g002
Figure 3. Box-plot distributions of the concentrations of total organic nitrates (PONs) in total suspended particles as a function of (a) nitrogen oxide (NOx), (b) fine particles (PM2.5), and (c) relative humidity (RH). Asterisks (*) indicate statistically significant differences (p < 0.05) between the organic nitrate concentrations under different conditions.
Sustainability 15 16776 g003
Figure 4. Average size distribution of six organic nitrates with error bars representing the standard deviations.
Sustainability 15 16776 g004
Figure 5. Average proportions of the six organic nitrates in the sum in different size bins.
Sustainability 15 16776 g005
Figure 6. Average size distributions of six organic nitrates during the dust event, the fireworks display, and low (<25 ppb) and high (>25 ppb) NOx days. “n” indicates the numbers of samples under the above four conditions.
Sustainability 15 16776 g006
Figure 7. Average size distributions of six organic nitrates during low (RH < 60%) and high humidity (RH > 70%) days. “n” indicates the numbers of samples under low- and high-humidity conditions.
Sustainability 15 16776 g007
Table 1. Average concentrations of six types of organic nitrates and their totals in PM1 (≤1 µm), PM1.8 (≤1.8 µm), PM10 (≤10 µm), and TSP (≤100 µm) (mean ± standard deviation, unit: ng m−3).
ParametersPM1PM1.8PM10TSP
MHN215138 ± 85.5215 ± 114.4333 ± 180.4397 ± 240.0
PKN229115 ± 92.5164 ± 105.4243 ± 138.7294 ± 162.9
MDCN24767.2 ± 15.697.3 ± 26.2123 ± 31.2129 ± 31.0
OAKN35963.8 ± 31.184.5 ± 38.7155.4 ± 67.3197 ± 93.6
OAHN36119.6 ± 6.326.4 ± 7.842.7 ± 16.850.8 ± 21.4
PSON2959.7 ± 7.019.4 ± 16.229.2 ± 24.731.8 ± 25.7
∑PONs415 ± 238606 ± 309927 ± 4591099 ± 577
Disclaimer/Publisher’s Note: The statements, opinions and data contained in all publications are solely those of the individual author(s) and contributor(s) and not of MDPI and/or the editor(s). MDPI and/or the editor(s) disclaim responsibility for any injury to people or property resulting from any ideas, methods, instructions or products referred to in the content.

