Article

Extraction of Bunkering Services from Automatic Identification System Data and Their International Comparisons

Graduate School of Engineering, University of Tokyo, Tokyo 113-8656, Japan
*
Author to whom correspondence should be addressed.
Sustainability 2023, 15(24), 16711; https://doi.org/10.3390/su152416711
Submission received: 9 November 2023 / Revised: 4 December 2023 / Accepted: 8 December 2023 / Published: 10 December 2023
(This article belongs to the Section Sustainable Transportation)

Abstract

:
Despite the increased demand for alternative fuel bunkering and the importance of its base formation, quantitative information or statistics on bunkering are very limited due to data availability. This study aims to develop a quantitative method to extract bunkering operations and analyze and compare the actual bunkering operations, such as bunkering service times and starting times in the port area, by extracting anchored vessels using a clustering method and matching them with bunker barges spatio-temporally. The algorithm also reflects the characteristic behavior of bunker barges, including calling at refineries and bunker barge bases. This study then focuses on bunkering in three port areas and compares their characteristics from various perspectives. The study’s key findings reveal variations in vessel types and service times across three port areas, particularly in Tokyo Bay, where shorter service times are observed for containerships and dry bulk carriers due to high fuel prices. Additionally, it highlights differences in bunkering start times, with Tokyo Bay for daytime operations and Singapore Port for a more balanced distribution throughout the day. Furthermore, bunkering locations differ, with Tokyo Bay and Busan Port having most operations at container terminals, while offshore bunkering is prevalent in Singapore Port.

1. Introduction

Bunkering, the fuel supply to ships, is one of the most important activities in the maritime shipping industry. Although bunkering fuel is sometimes supplied from land-based supply depots or trucks, most bunkering fuel is supplied by bunker barges on a ship-to-ship (STS) basis in the port area [1]. The timing of bunkering varies depending on the port, type of vessel, and situations, for example, whether the bunker barge is laid alongside on the opposite side of the quay when cargo is loaded or discharged at the quay or anchored together when the vessels are anchored offshore. Moreover, each vessel does not always fill up with a full load of fuel at each port call. A vessel may limit the refueling amount to the minimum necessary in ports with relatively high prices, whereas a vessel may stop over the ports only for refueling. Therefore, competition among neighboring ports to provide better bunkering services is sometimes observed.
In recent years, in response to growing global environmental awareness, the maritime sector has faced replacing fuel oil with other fuels for ships as part of efforts to build a decarbonized society [2]. In Japan, the large LNG-fueled car carrier SAKURA LEADER was completed in October 2020, and the LNG bunker barge KAGUYA, which is used to supply LNG fuel, has begun operations [3]. In addition, alternative fuels such as ammonia, hydrogen fuel cells, and carbon-recycled methane are expected to emerge and spread in the future, and the supply methods and systems for each type of fuel are being studied [4].
Based on the competitive situation among ports in bunkering, the bunkering strategy of each port should be considered in the context of a global bunkering network with the service level of each port. Since bunkering demand is low in the early stages of the prevalence of new fuels, it is essential to consider the situation of other ports. However, at present, few statistics or pieces of literature comprehensively organize the actual situation of bunkering in each port, making it difficult to compare the bunkering service level among ports.
Although some studies on bunkering, such as comparisons of port competitiveness and the determinants of competitiveness, take qualitative approaches based on questionnaire surveys, few quantitative analyses have been conducted mainly because of the difficulty of collecting data, as will be described in Section 2. Therefore, this study uses a vessel’s automatic identification system (AIS) data for quantitatively evaluating vessel movements, including bunkering. This study aims to develop an algorithm to extract bunkering operations based on AIS data and to understand and compare the characteristics of bunkering operations, such as distributions of bunkering service times and starting times of bunkering operations by size and type of bunkered vessels and bunker barges in several Asian port areas (Tokyo Bay, Busan Port, and Singapore Port) and their differences, including locations and number of bunkering during refueling.
The remainder of this paper is organized as follows. Section 2 summarizes the literature review and positions this study. Section 3 states the data used in this study, and Section 4 describes the methodology and algorithm used to extract bunkering operations and validates them. Section 5 shows the characteristics of bunkering operations in three port areas and discusses their difference by size and type of bunkered vessels. A summary of the study is presented in Section 6.

2. Literature Review

Most studies on bunkering operations have taken a qualitative approach, and few have taken a quantitative approach. Acosta et al. [5] analyzed the factors determining the competitiveness of bunkering in each port in the Strait of Gibraltar from the port operator’s perspective. They found that fuel prices and geographic advantage were the two main factors influencing shipping companies’ choice of bunkering port, followed by cost and service quality, such as port tariffs and waiting times. Aronietis et al. [6] interviewed shipping companies in the port of Antwerp to investigate the decision-making factors in bunkering port selection. They concluded that cost, including fuel prices, was the main factor, while the quantity and quality of fuel and service reliability were also important. Lam et al. [7] developed a framework and methodology for assessing the competitiveness of ports as bunkering hubs and conducted empirical studies on Singapore and Shanghai Ports. Yao et al. [8] proposed an optimization model that determines the optimal bunkering port, bunkering volume, and ship speed to minimize the total bunker fuel-related costs for a single liner service. Wang et al. [9] used the Fuzzy Delphi–TOPSIS procedure to develop a benchmarking framework for liner shipping companies to evaluate the performance of bunkering ports. Ghosh et al. [10] developed a dynamic programming model of bunkering decisions for a liner service to minimize total bunkering cost with uncertainty on fuel consumption using Monte Carlo simulation, and Aydin et al. [11] also proposed a dynamic programming model to optimize the vessel speed, bunkering ports, and bunkering amounts of a liner service with uncertain service times and time windows at ports. De et al. [12] focused on the problem of bunker fuel management for liner shipping networks under different fuel pricing scenarios with mixed integer non-linear programming to minimize the total expected cost, considering the fluctuation of fuel prices at various ports. Meanwhile, Meng et al. [13] dealt with a practical tramp ship routing problem to maximize the total profit with different bunker prices at different ports using an integer linear programming model.
Regarding LNG bunkering, Peng et al. [14] summarized the research on port LNG bunkering stations, including fuel demand forecast, bunkering method selection, and LNG bunkering network planning. For example, Tam [15] studied the compatibility of shore-to-ship and STS operations for LNG bunkering and showed bunker barge specifications and operational requirements to ensure compatibility of the two approaches. Chae et al. [16] forecasted the LNG bunkering demand by country with meta-analysis and several machine learning techniques, while Kim et al. [17] and Ha et al. [18] examined the decision-making factors for LNG bunkering selection and found that safety and security issues, bunkering prices, port service charges, and vessel turnaround time were the main factors, as with heavy oil. Aymelek et al. [19] proposed an optimal liner shipping network model considering the bunkering of LNG fuel, and Ursavas et al. [20] proposed a Lagrangian relaxation heuristic algorithm on LNG bunkering network design and applied it to the West European river network. Liu et al. [21] proposed a heuristic algorithm for solving the LNG bunkering problem, including decisions to assign ships to tanks, manage the inventory of the tanks, and schedule LNG trucks for bunkering ships and replenishing tanks. Moreover, Yang and Lam [22] developed a simulation model of the bunker supply chain and evaluated the impact of ammonia bunkering, another alternative fuel other than LNG.
Meanwhile, AIS data allow for quantitative analysis of vessel behavior [23,24,25]. Mou et al. [26] conducted a quantitative analysis of vessels involved in collisions using AIS data for the Port of Rotterdam. Dobrkovic et al. [27] showed how to apply a genetic algorithm to clustering ship waypoints and used it to create a directed graph representing maritime routes. Zhang et al. [28] presented an analytical approach based on AIS data to analyze vessel traffic demand and the spatio-temporal dynamics of vessel traffic in port waters for Singapore Port. Nguyen et al. [29] introduced a deep learning framework for detecting anomalous vessel behavior using AIS data. Han et al. [30] proposed a clustering method for AIS data by combining DBSCAN with the Mahalabinos distance metric. Murray and Perera [31] introduced a deep learning framework that uses AIS data to support regional vessel behavior prediction. Liu et al. [32] proposed a framework for extracting global maritime shipping traffic networks using AIS data based on DBSCAN.
Regarding an algorithm for extracting bunkering operations based on AIS data, Aarsnes [33] proposed a method based on certainty assessment using vessel length and heading. Fuentes [34] proposed a method for identifying ship anchoring patterns and extracting bunkering operations using the DBSCAN algorithm. In his method, the trajectory of anchored vessels was extracted using DBSCAN, and if a tanker stayed continuously around the trajectory, it was recognized as a rendezvous for bunkering. These studies used only the proximity of the bunker barge to the vessel as a criterion and did not reflect the navigation history of the bunker barge, leaving much for improvement in computational complexity and accuracy. In addition, Market Intelligence Network (MINT) [35], an AIS data service provided by S&P Global, lists bunkering activities based on AIS data. MINT has its own list of bunker barges and detects bunkering operations if the high proximity of a barge in the list to another vessel is observed; however, it does not cover bunkering at quays, and its algorithm is unclear. Therefore, this study aims to develop a more sophisticated bunkering operation extraction algorithm that considers the behavior of bunker barges. Specifically, the proposed method uses AIS data to extract characteristic behaviors of bunkering vessels, such as refueling at refineries and anchoring at bases, filters the data accordingly, and uses a combination of Aarsnes’s [33] and Fuentes’s [34] methods to extract bunkering operations.

3. Data

3.1. AIS Data

AIS is a communication system that transmits vessel dynamics and voyage-related information at irregular intervals ranging from a few seconds to a few minutes. The safety of life at sea (SOLAS) regulation requires AIS to be fitted aboard for all ships of 300 gross tons or more engaged on international voyages, all passenger ships, and cargo ships of 500 gross tons or more not engaged on international navigation [23]. The data transmitted by AIS include the following dynamic, static, and voyage-related information on ships.
  • Static information: IMO number, signal letters and ship’s name, length and breadth of the vessel, type of vessel, and location of the positioning system antenna on the vessel.
  • Dynamic information: coordinated universal time, course to ground, speed to ground, bow heading, rate of turn, and navigation status.
  • Voyage-related information: ship’s draft, dangerous cargo (type), destination, estimated time of arrival, and information on the safety of navigation.
This study uses all AIS data (approximately 66 million rows) for vessels navigated in the target water areas during the target period. The AIS data used in this study have been processed to some extent by the data providers and are not the original data at intervals of a few seconds. Bunker barges with MMSI (maritime mobile service identity) or IMO numbers and vessels with IMO numbers are included in the analysis. Notably, the results obtained in this study do not provide a complete picture of the actual situation of bunkering because many bunker barges do not meet the specifications enforced to equip AIS, and thus, most of them do not equip it on board.
In addition to dynamic information contained in AIS data, draft information is also used in this study because the increase or decrease in draft reflects the change in cargo and fuel loading status. Thus, it is used together with ship speed to understand the bunker barge operation quantitatively, although its reliability is relatively low because it is manually input by seafarers [36].

3.2. List of Bunker Barges

This study needs to prepare a list of bunker barges. However, vessels registered under vessel types other than bunker barges in AIS data are often used for bunkering. Therefore, as candidates for bunker barges, we consider all tankers that conducted bunkering operations during the year 2021 in the bunkering database provided by MINT. Notably, these vessels may be engaged in activities other than bunkering, including transporting liquid cargo.

3.3. Target Areas and Period

This study targets three water areas (Tokyo Bay, Busan Port, and Singapore Port), as shown in Figure 1, where the characteristics of bunkering operations are considered different. The analysis period is three months, from February to April 2021. The number of vessels navigating each area of this study is shown in Table 1.

4. Methods

4.1. Bunkering Operation and Estimation Framework

In a bunkering operation, the shipowner or shipping company orders a bunkering supplier, specifying the type and quantity of fuel. Once the contract for an STS bunkering is signed and a time and location for bunkering are specified, the vessel to be bunkered usually anchors and waits for the bunker barge. During the operation, the vessels are secured to each other with ropes, and oil is pumped using hoses. Bunkering is operated with great care to prevent oil leakage at sea. Since the performance of fuel tanks of a bunkered vessel limits the speed and pressure at which oil can be delivered, a bunker barge does not necessarily speed up the operation for its high performance. After the operation, the client signs a document indicating that the operation has been conducted under an agreement, and the bunker barge leaves.
Bunker barges must also be preloaded with sufficient fuel to supply the operation by refueling at the refinery. In Tokyo Bay, for example, bunker barges are generally refueled at refineries in Chiba, Kawasaki, Yokohama, and other cities the day before operations, dock at night at their bases, and move to the bunker barges the next morning to supply fuel.
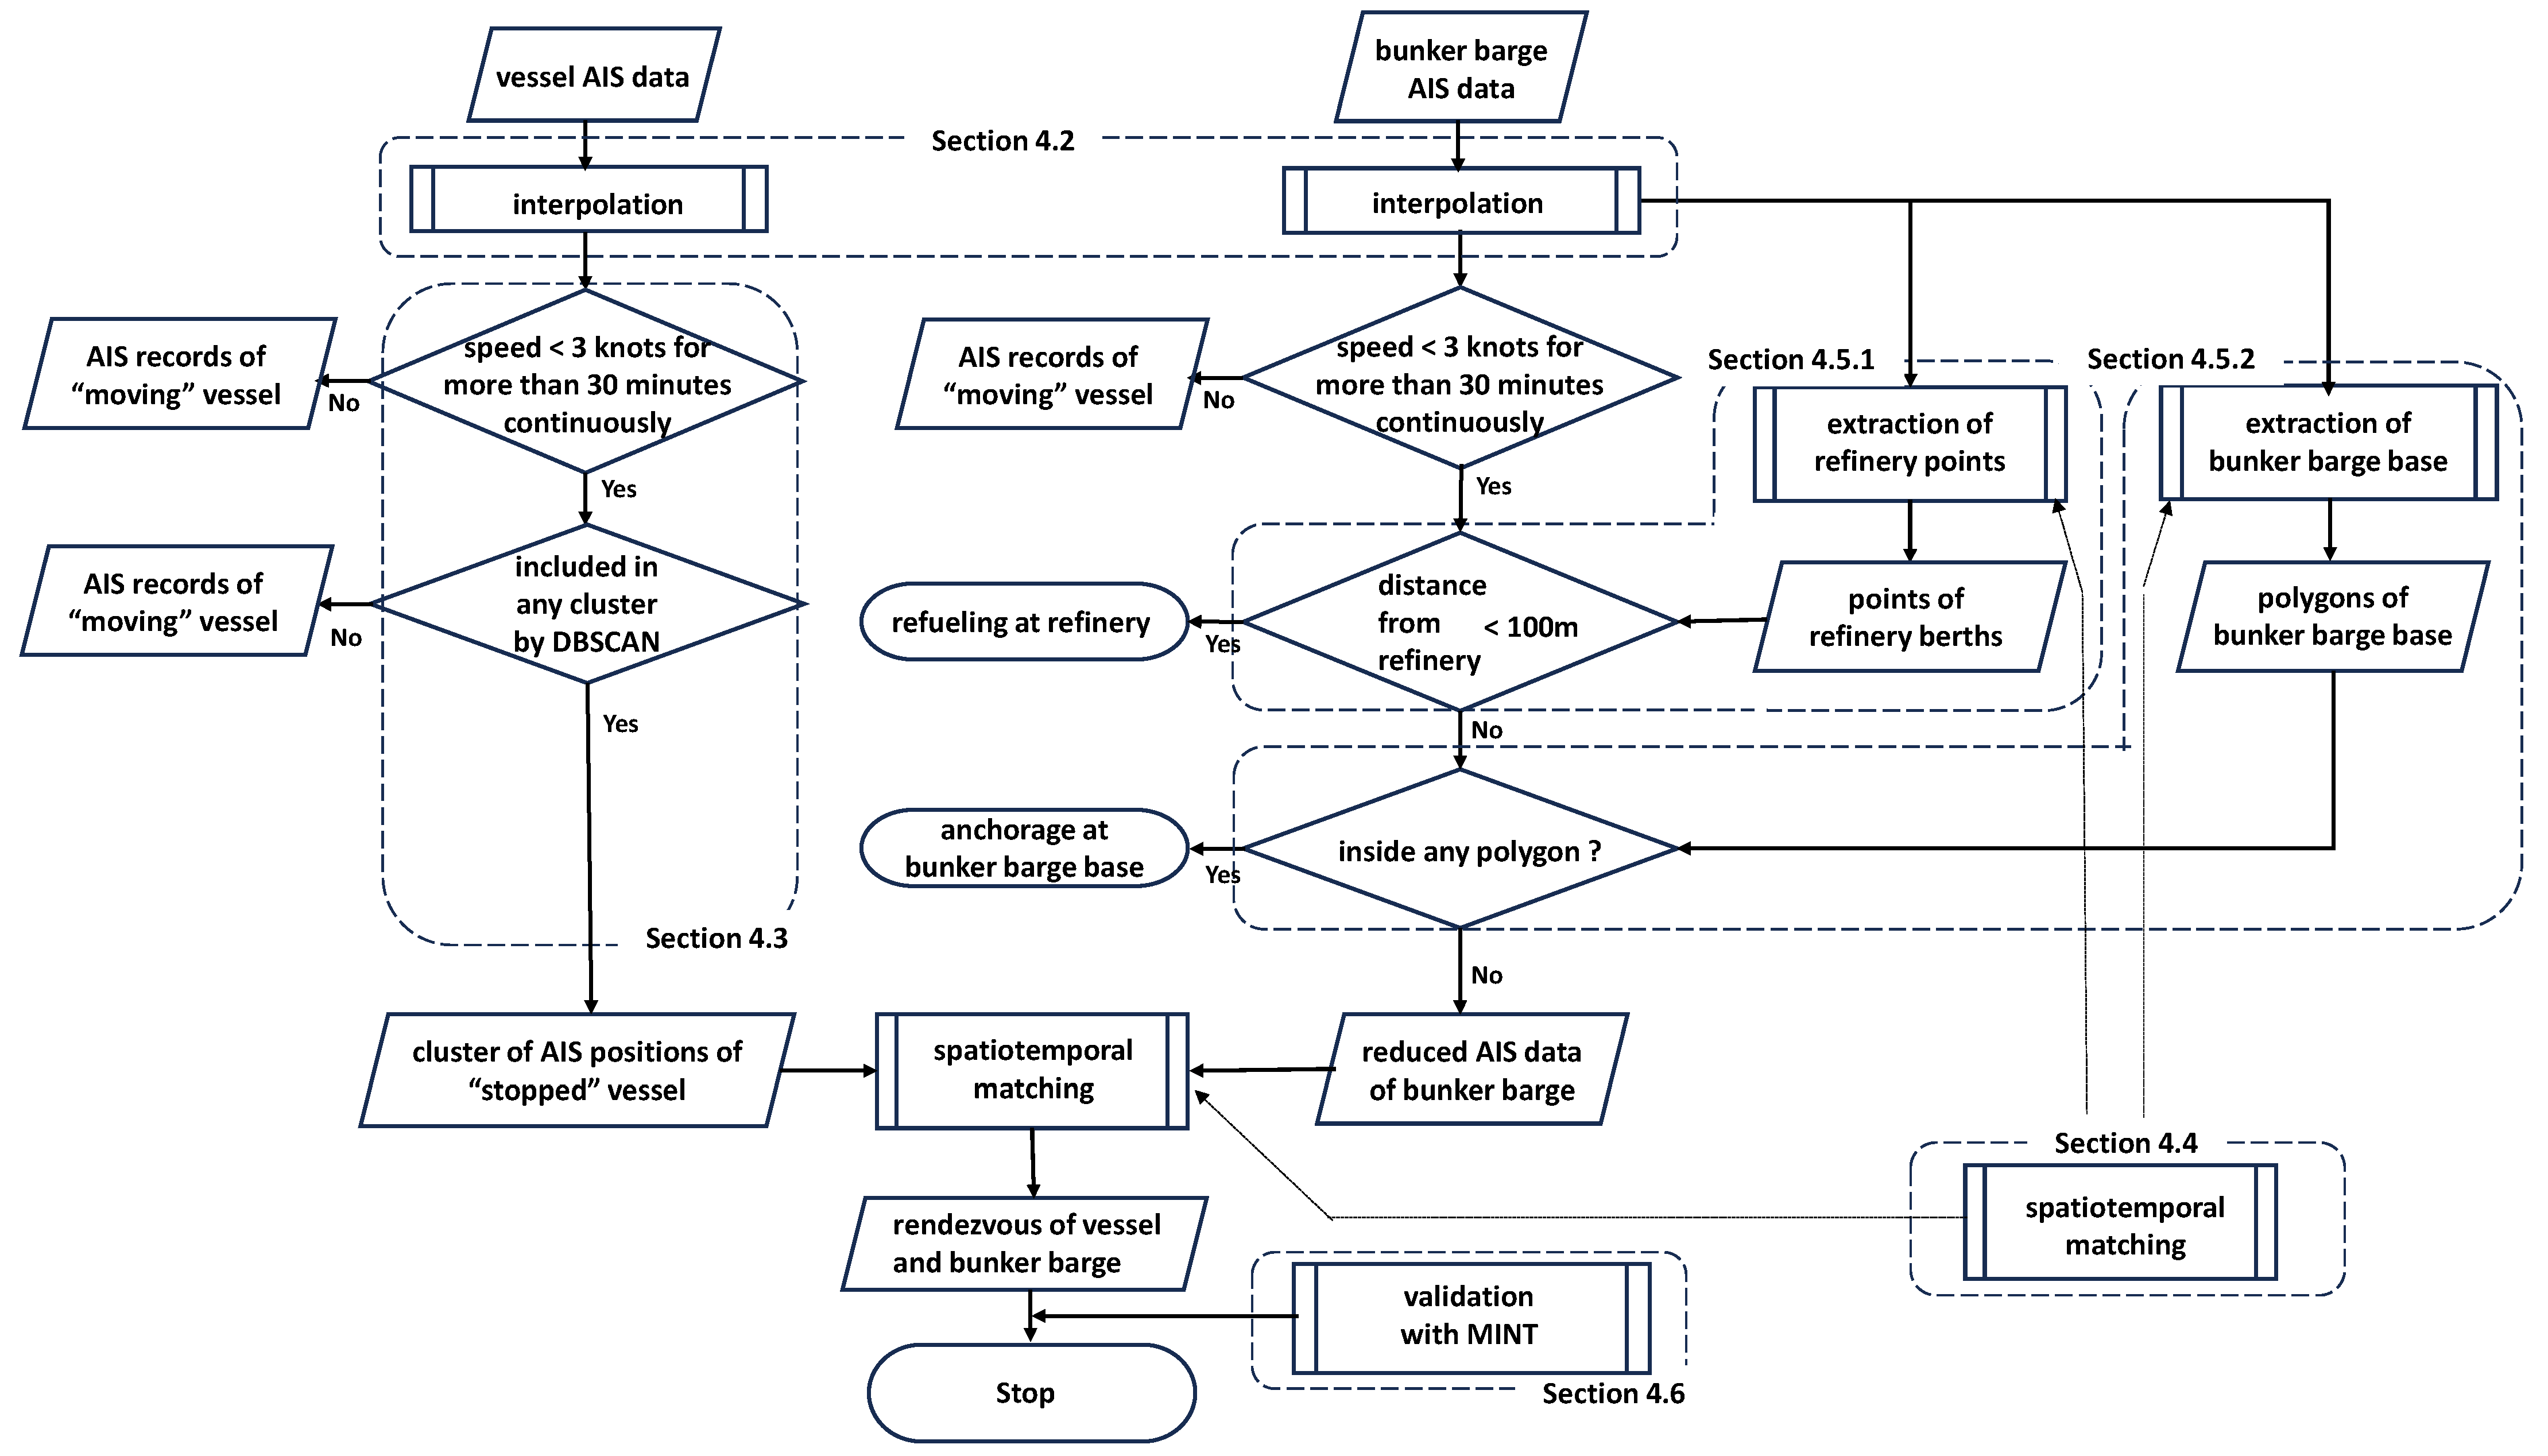
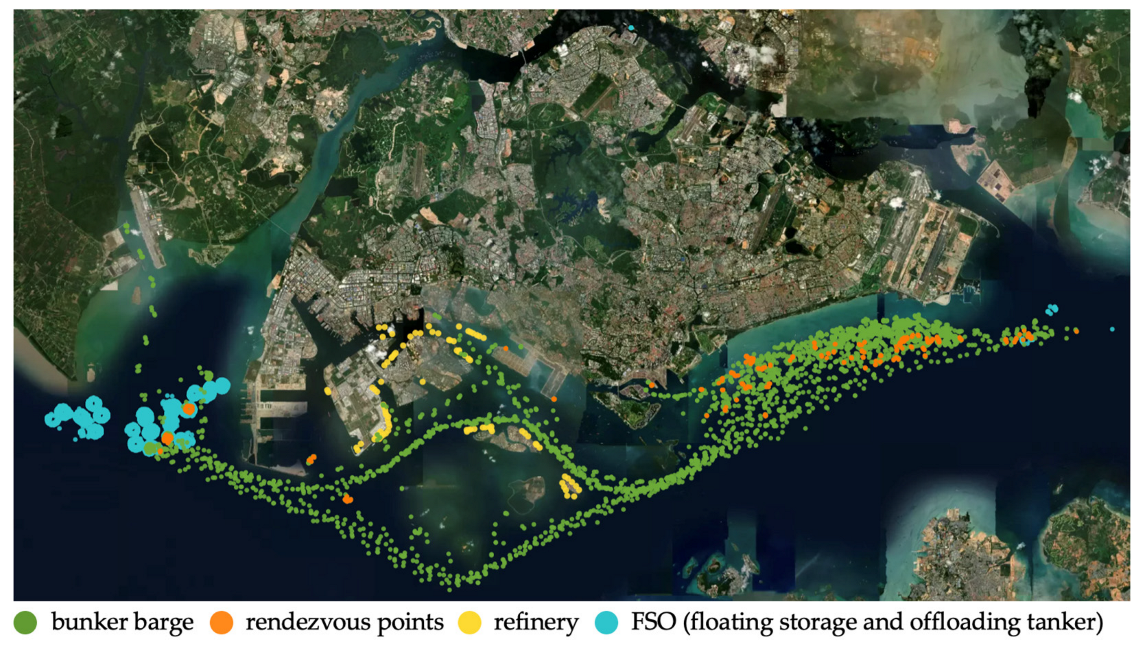
Based on such bunkering operation flow, this study develops a bunkering operation extraction algorithm that considers the behavior of bunker barges, as shown in Figure 2. The basic concept of bunkering operation extraction in this study is to detect rendezvous between bunker barges and anchored vessels by estimating the proximity of both vessels from the time stamps and latitude/longitude information in the AIS data. However, the vessels listed in bunker barges are also included in the anchored vessels to be refueled because they may be engaged in transporting liquid cargo, as mentioned in Section 3.2. In other words, two vessels listed in bunker barges may sometimes match each other. Therefore, after interpolating AIS data in Section 4.2, while anchored vessels are extracted using a clustering method (Section 4.3), the behavior of bunker barges is reflected in the data based on the history of port calls to refineries and bunker bases (Section 4.5). Finally, we match bunker barges with bunkered vessels spatio-temporally (Section 4.4).

4.2. Interpolating AIS Data

Although AIS data contain information such as latitude/longitude and ship speed at each time stamp, the time interval is not always uniform. The larger the interval, the more difficult it would be to obtain sufficient information on vessel movements. Therefore, data interpolation is necessary to obtain reliable results in our algorithm to spatio-temporally match the trajectories of bunker barges and anchored vessels during operations.
This study uses linear interpolation for latitude and longitude information of AIS data, as with several previous studies [28,37], with time intervals between 10 min and 2 h so that the data interval becomes within 5 min, based on the assumption that the distance traveled by vessels during bunkering operations is small. Notably, if a data interval is over 2 h, we remove it as discontinuous, unreliable data. In addition, vessel speed is also interpolated based on the distance traveled.
Specifically, the latitude l a t t , longitude l o n t , and ship speed v t at time t   ( t i < t < t i + 1   ) are interpolated as described in Equations (1)–(3).
l a t t = l a t t i + ( l a t t i + 1   l a t t i ) · t     t i t i + 1     t i
l o n t = l o n t i + ( l o n t i + 1     l o n t i ) · t     t i t i + 1     t i
v t = D t i + 1 ,   t i t i + 1     t i  
where D t i + 1 , t i   is the distance traveled by the vessel from time t i   to t i + 1 .
In addition, AIS data, in which the ship’s speed in the target water areas is less than 3 knots for more than 30 consecutive minutes, are extracted to reduce the computational complexity.

4.3. Extracting Anchored Vessels

In extracting bunkering operations, only AIS data that satisfy the speed and trajectory suitable for bunkering for both bunker barges and bunkered vessels should be examined. However, the speed over ground in the AIS data is not always zero when the vessel stops; in particular, a vessel may move to some extent under the influence of wind and currents in operations in offshore bunkering.
To consider these conditions and reduce the computational complexity of the matching algorithm, a density-based spatial clustering of applications with noise (DBSCAN) is used to extract the anchored vessels’ data based on the location information. The DBSCAN parameter ϵ is defined in Equation (4) based on Fuentes [34], allowing for some movement of anchored vessels. This equation assumes that the distance traveled in a short time can be approximated based on the Euclidean distance calculated from the latitude and longitude.
ϵ ( d e g r e e ) = D i s t a n c e ( m ) 60 ( nm / degree ) 1852 ( m / nm )
The movement of up to 200 m in 10 min is caused by external forces such as wind and currents; thus, the conditions for forming clusters are set as ϵ = 0.018   (equivalent to 200 m) and m i n P t s = 3 [34].

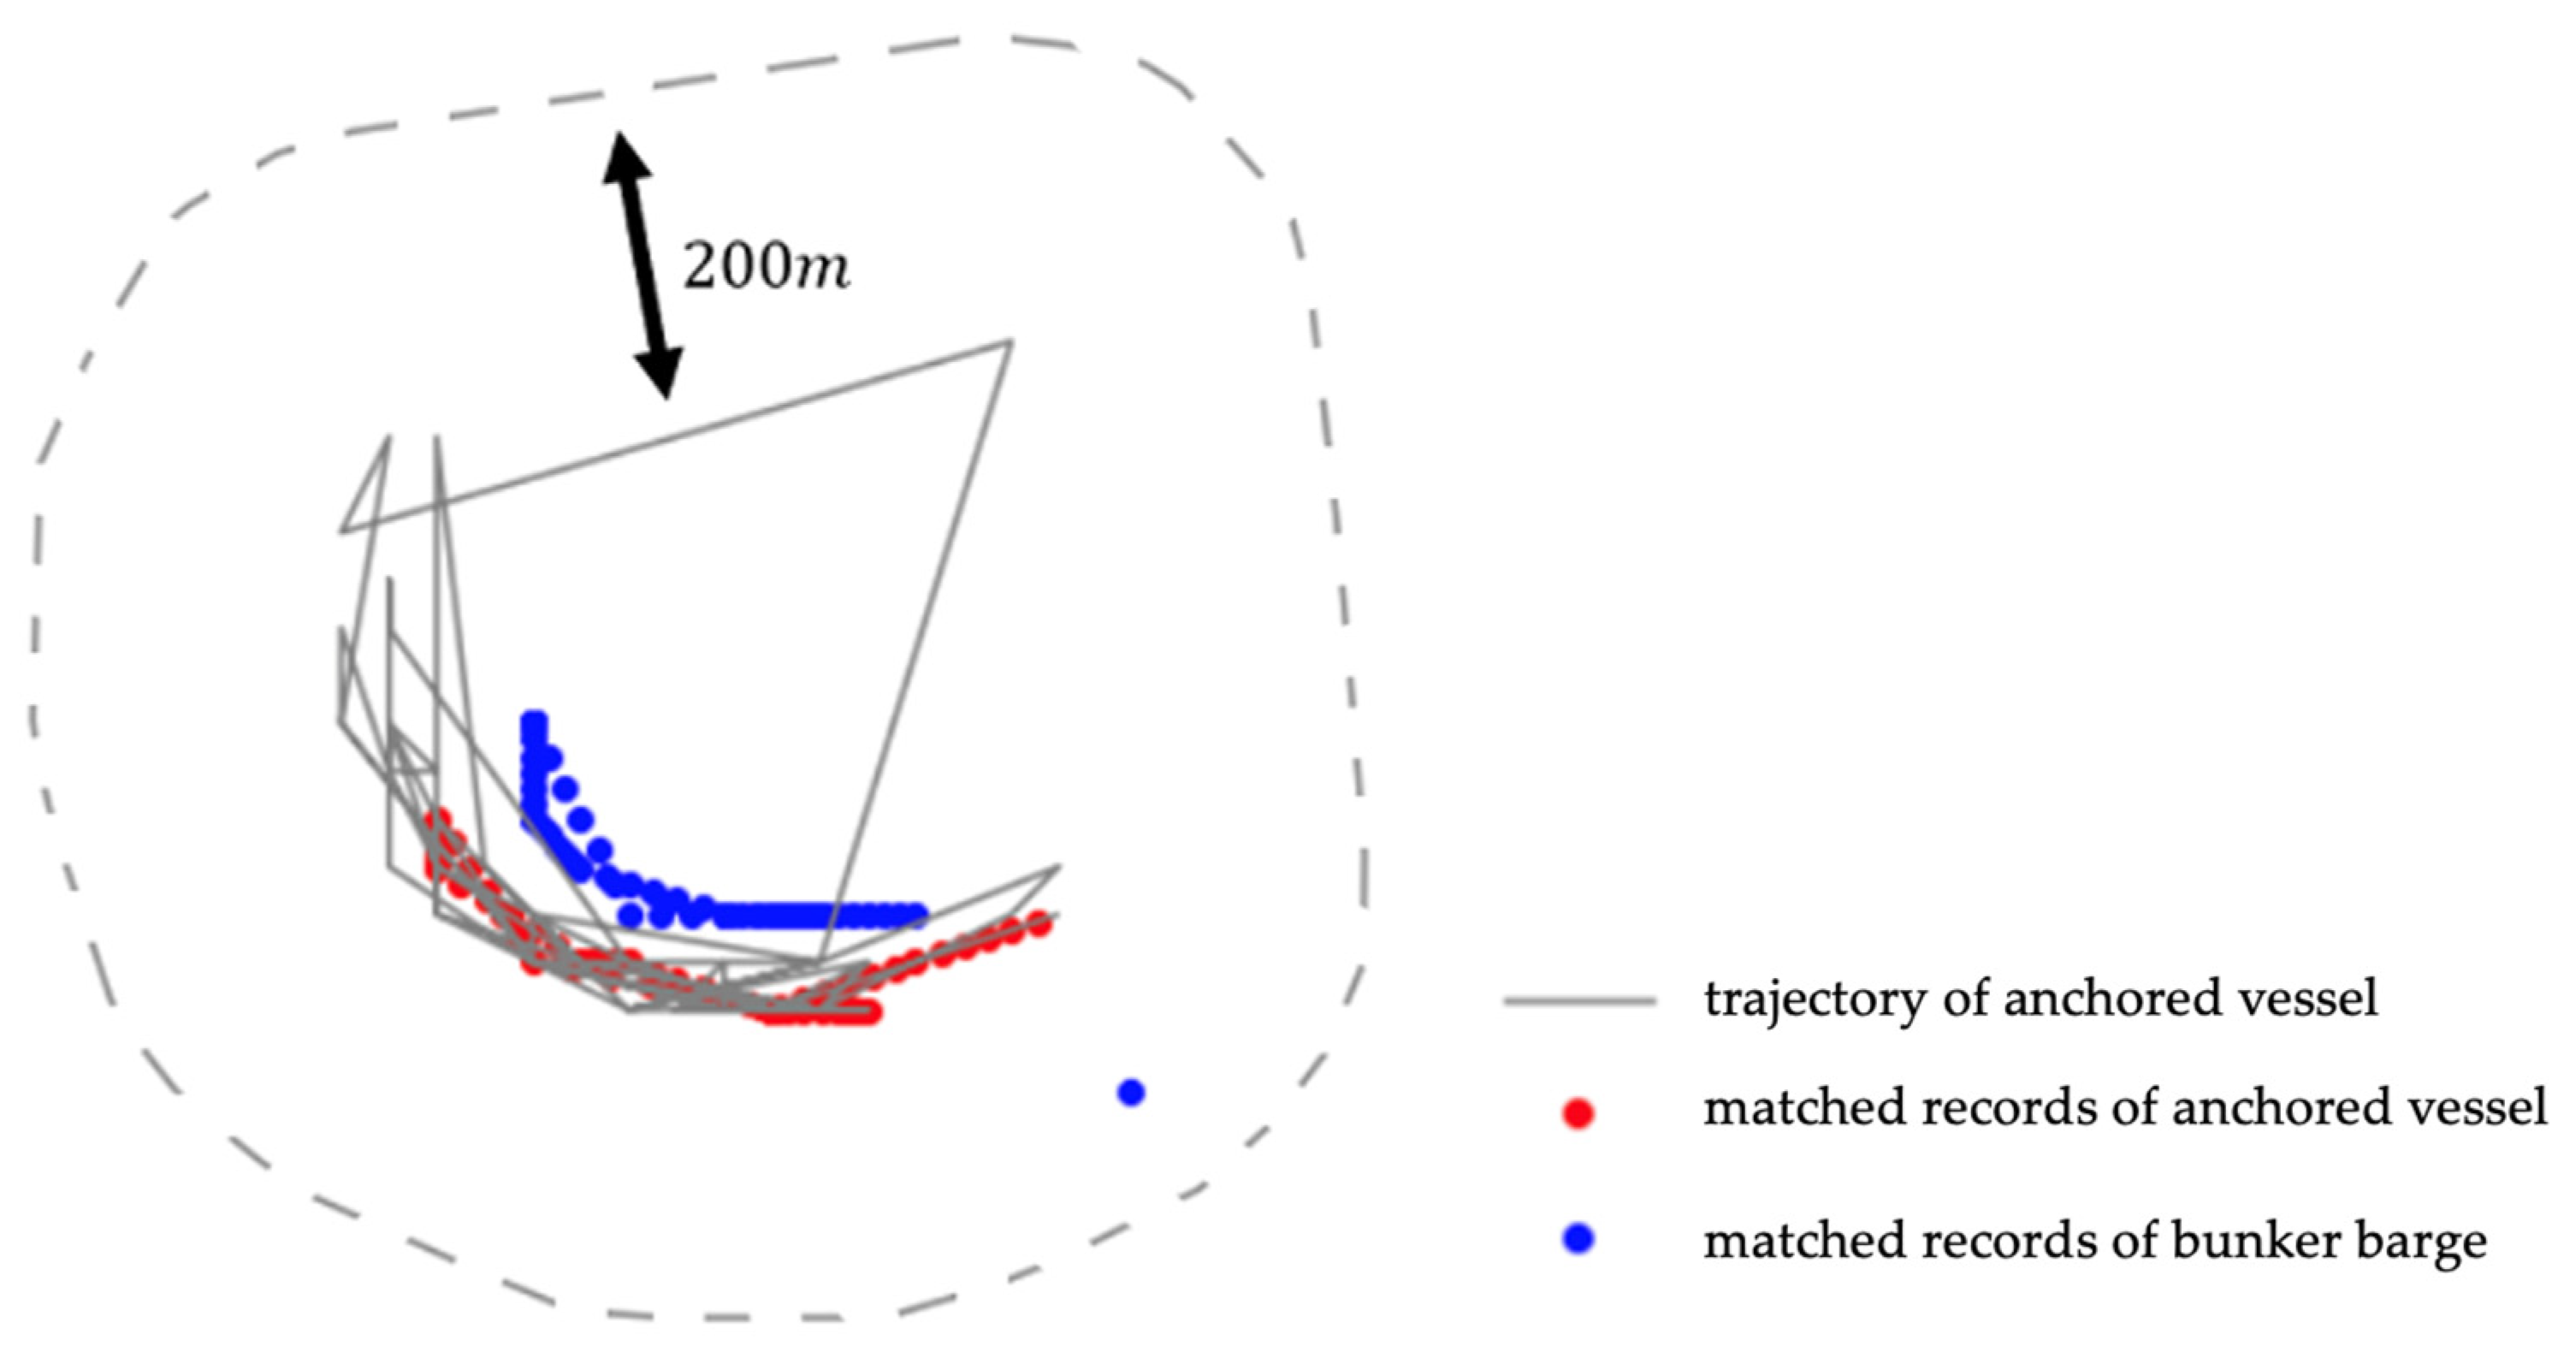
4.4. Spatio-Temporal Matching of Anchored Vessels and Bunker Barges

The anchored vessels extracted as described in Section 4.3 and bunker barges are matched spatio-temporally to detect rendezvousing vessels, as shown in Figure 3. Notably, this method considers bunkering with multiple bunker barges attached to one bunkered vessel because such operations are sometimes observed, especially in refueling with large quantities. The procedure is as follows.
(1)
Create a trajectory of the anchored vessel.
(2)
Extract bunker barges located within 200 m of the above trajectory according to the start and end times of anchored vessels. In addition, to avoid detecting bunker barges that simply cross the trajectory and pass by, we impose a condition that the bunker barges should remain within the area for at least 30 min.
(3)
Match the coordinates of each anchored vessel with the coordinates of each bunker barge in space and time. The data of bunker barges whose differences in time stamps are within 10 min of each anchored vessel’s coordinates and whose distance is less than 150 m are extracted.
The larger the vessel, the larger the distance between the rendezvousing vessels, whose locations are represented by the AIS antenna equipped in each vessel, because each vessel carries it in a different position. Moreover, GPS errors may sometimes occur. However, the larger the vessel distance threshold for detecting a rendezvous, the more likely a bunker barge will be matched with unrelated anchored vessels, especially in a crowded port such as Singapore. Thus, this study set 150 m as the threshold of the rendezvous at distances between vessels in bunkering operations. Although we adopt the same threshold (150 m) in all ports for consistency, a detailed determination of the optimum threshold or other detailed considerations, such as the directions between vessels [33], is one of the future issues.

4.5. Considering Bunker Barges’ Behavior

As mentioned in Section 4.1, bunker barges stop not only during bunkering but also during refueling and at their base. Meanwhile, multiple barges are considered to anchor in the refueling area and at their base, and they are also matched by the method presented in Section 4.4. Thus, the following data processing must be additionally conducted to distinguish between bunkering and other operations.

4.5.1. Refueling at Refineries

As mentioned in Section 4.1, refueling at refineries is a typical activity other than bunkering for bunker barges. This study focuses on changes in the draft of barges to identify the anchorage points instead of individually investigating the location of refineries and refueling berths and obtaining their coordinates. The refinery locations are efficiently identified by specifying the points where the draft of bunker barges has increased according to the following steps.
(1)
Considering that refueling to the bunker barge is performed while the bunker barge is at anchor, the location data for the vessels whose draft has increased compared to the previous time are extracted.
(2)
The location data acquired in the previous step are clustered by applying DBSCAN with є = 0.009 (equivalent to 100 m) and minPts = 1.
(3)
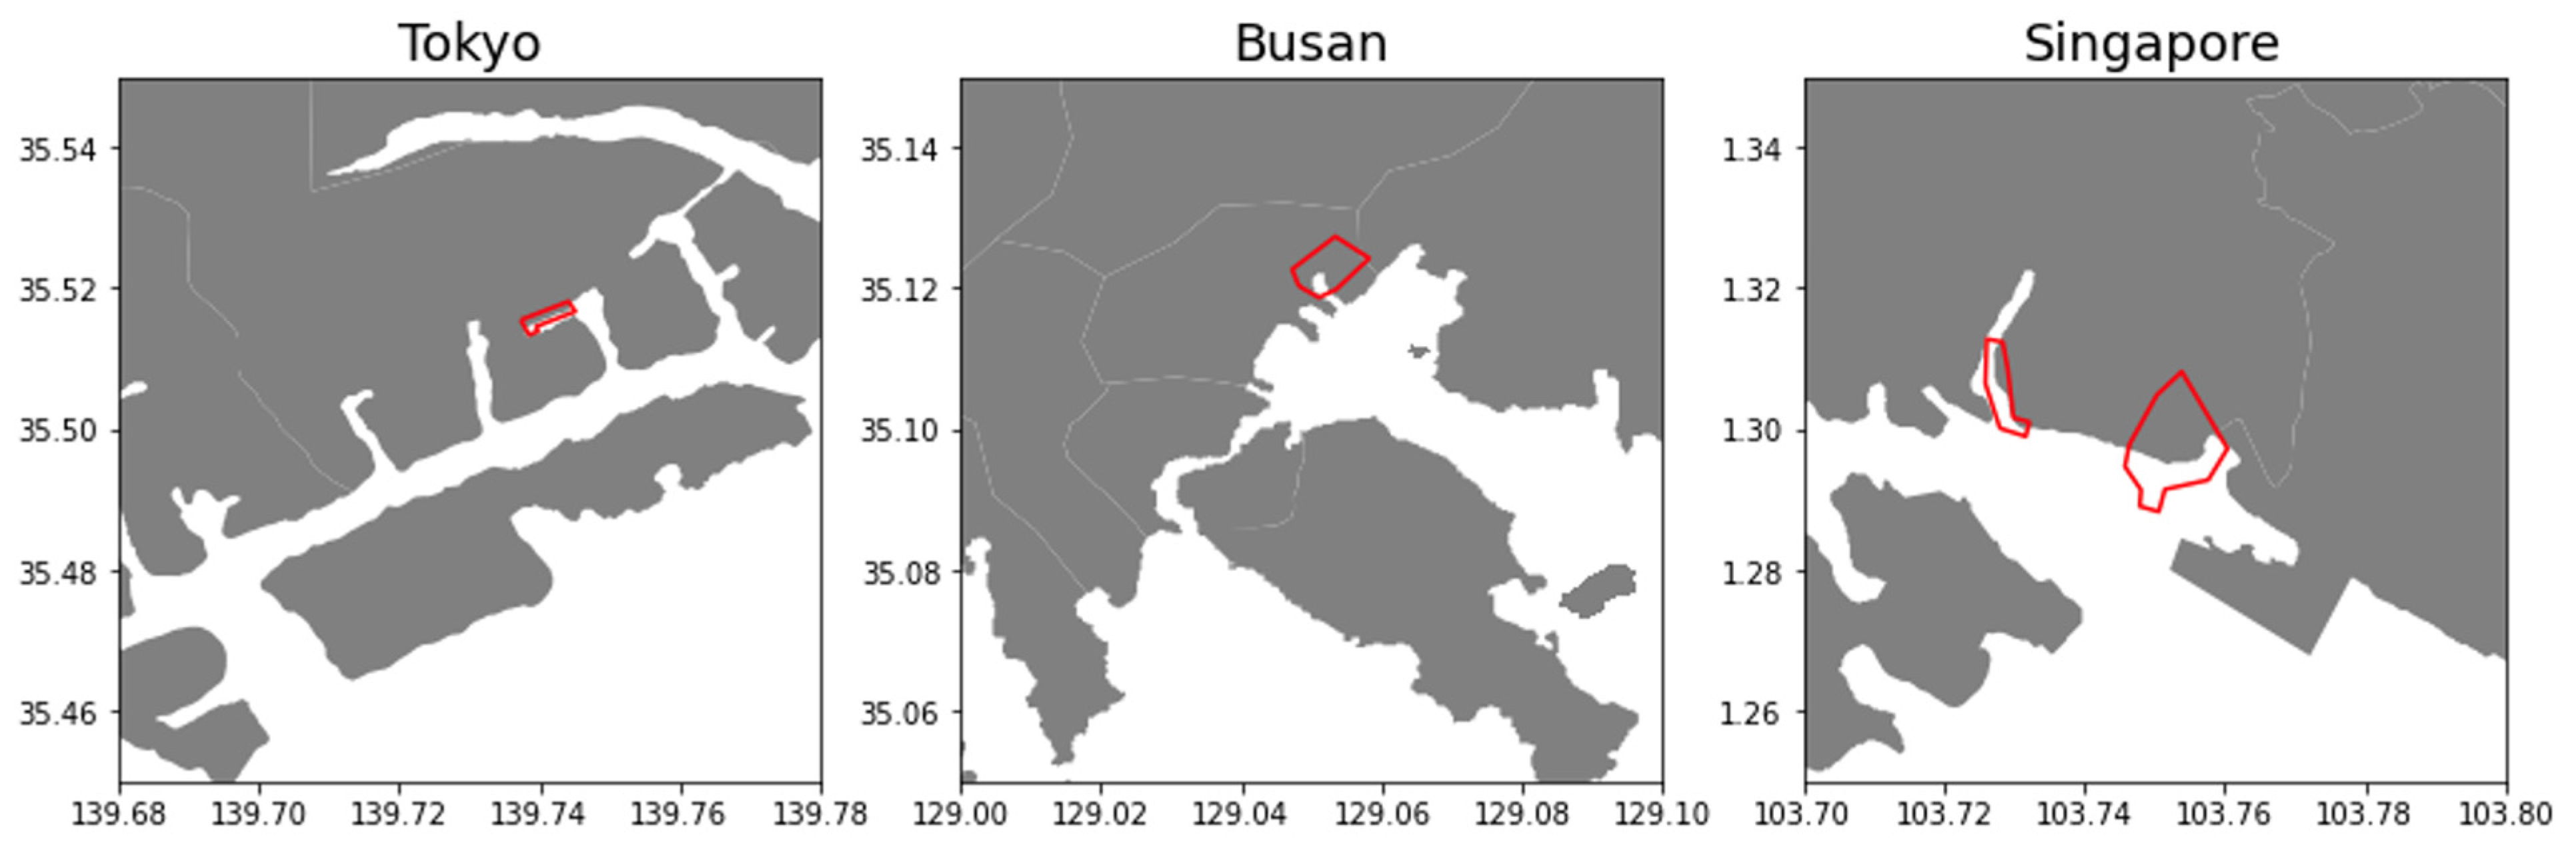
The center of gravity (average of latitude and longitude) of the points included in each cluster is used as the representative point. These points are confirmed with satellite images whether or not they are refueling berths at the refineries.
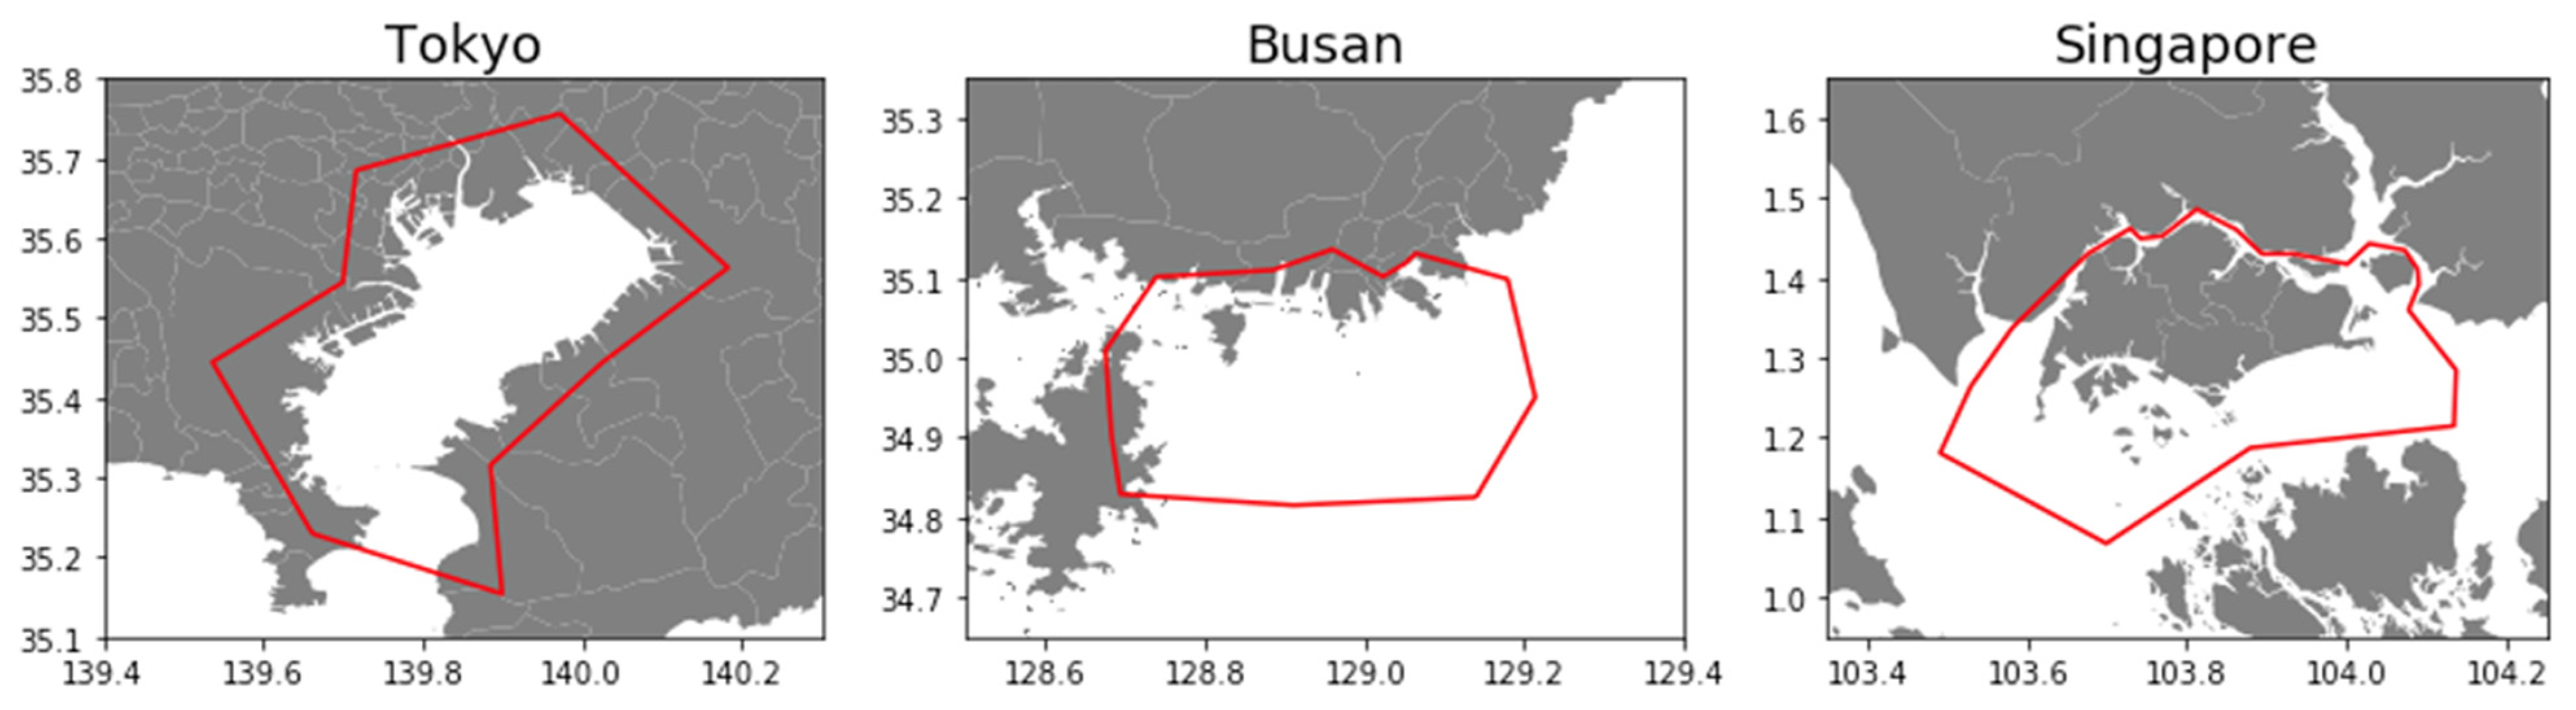
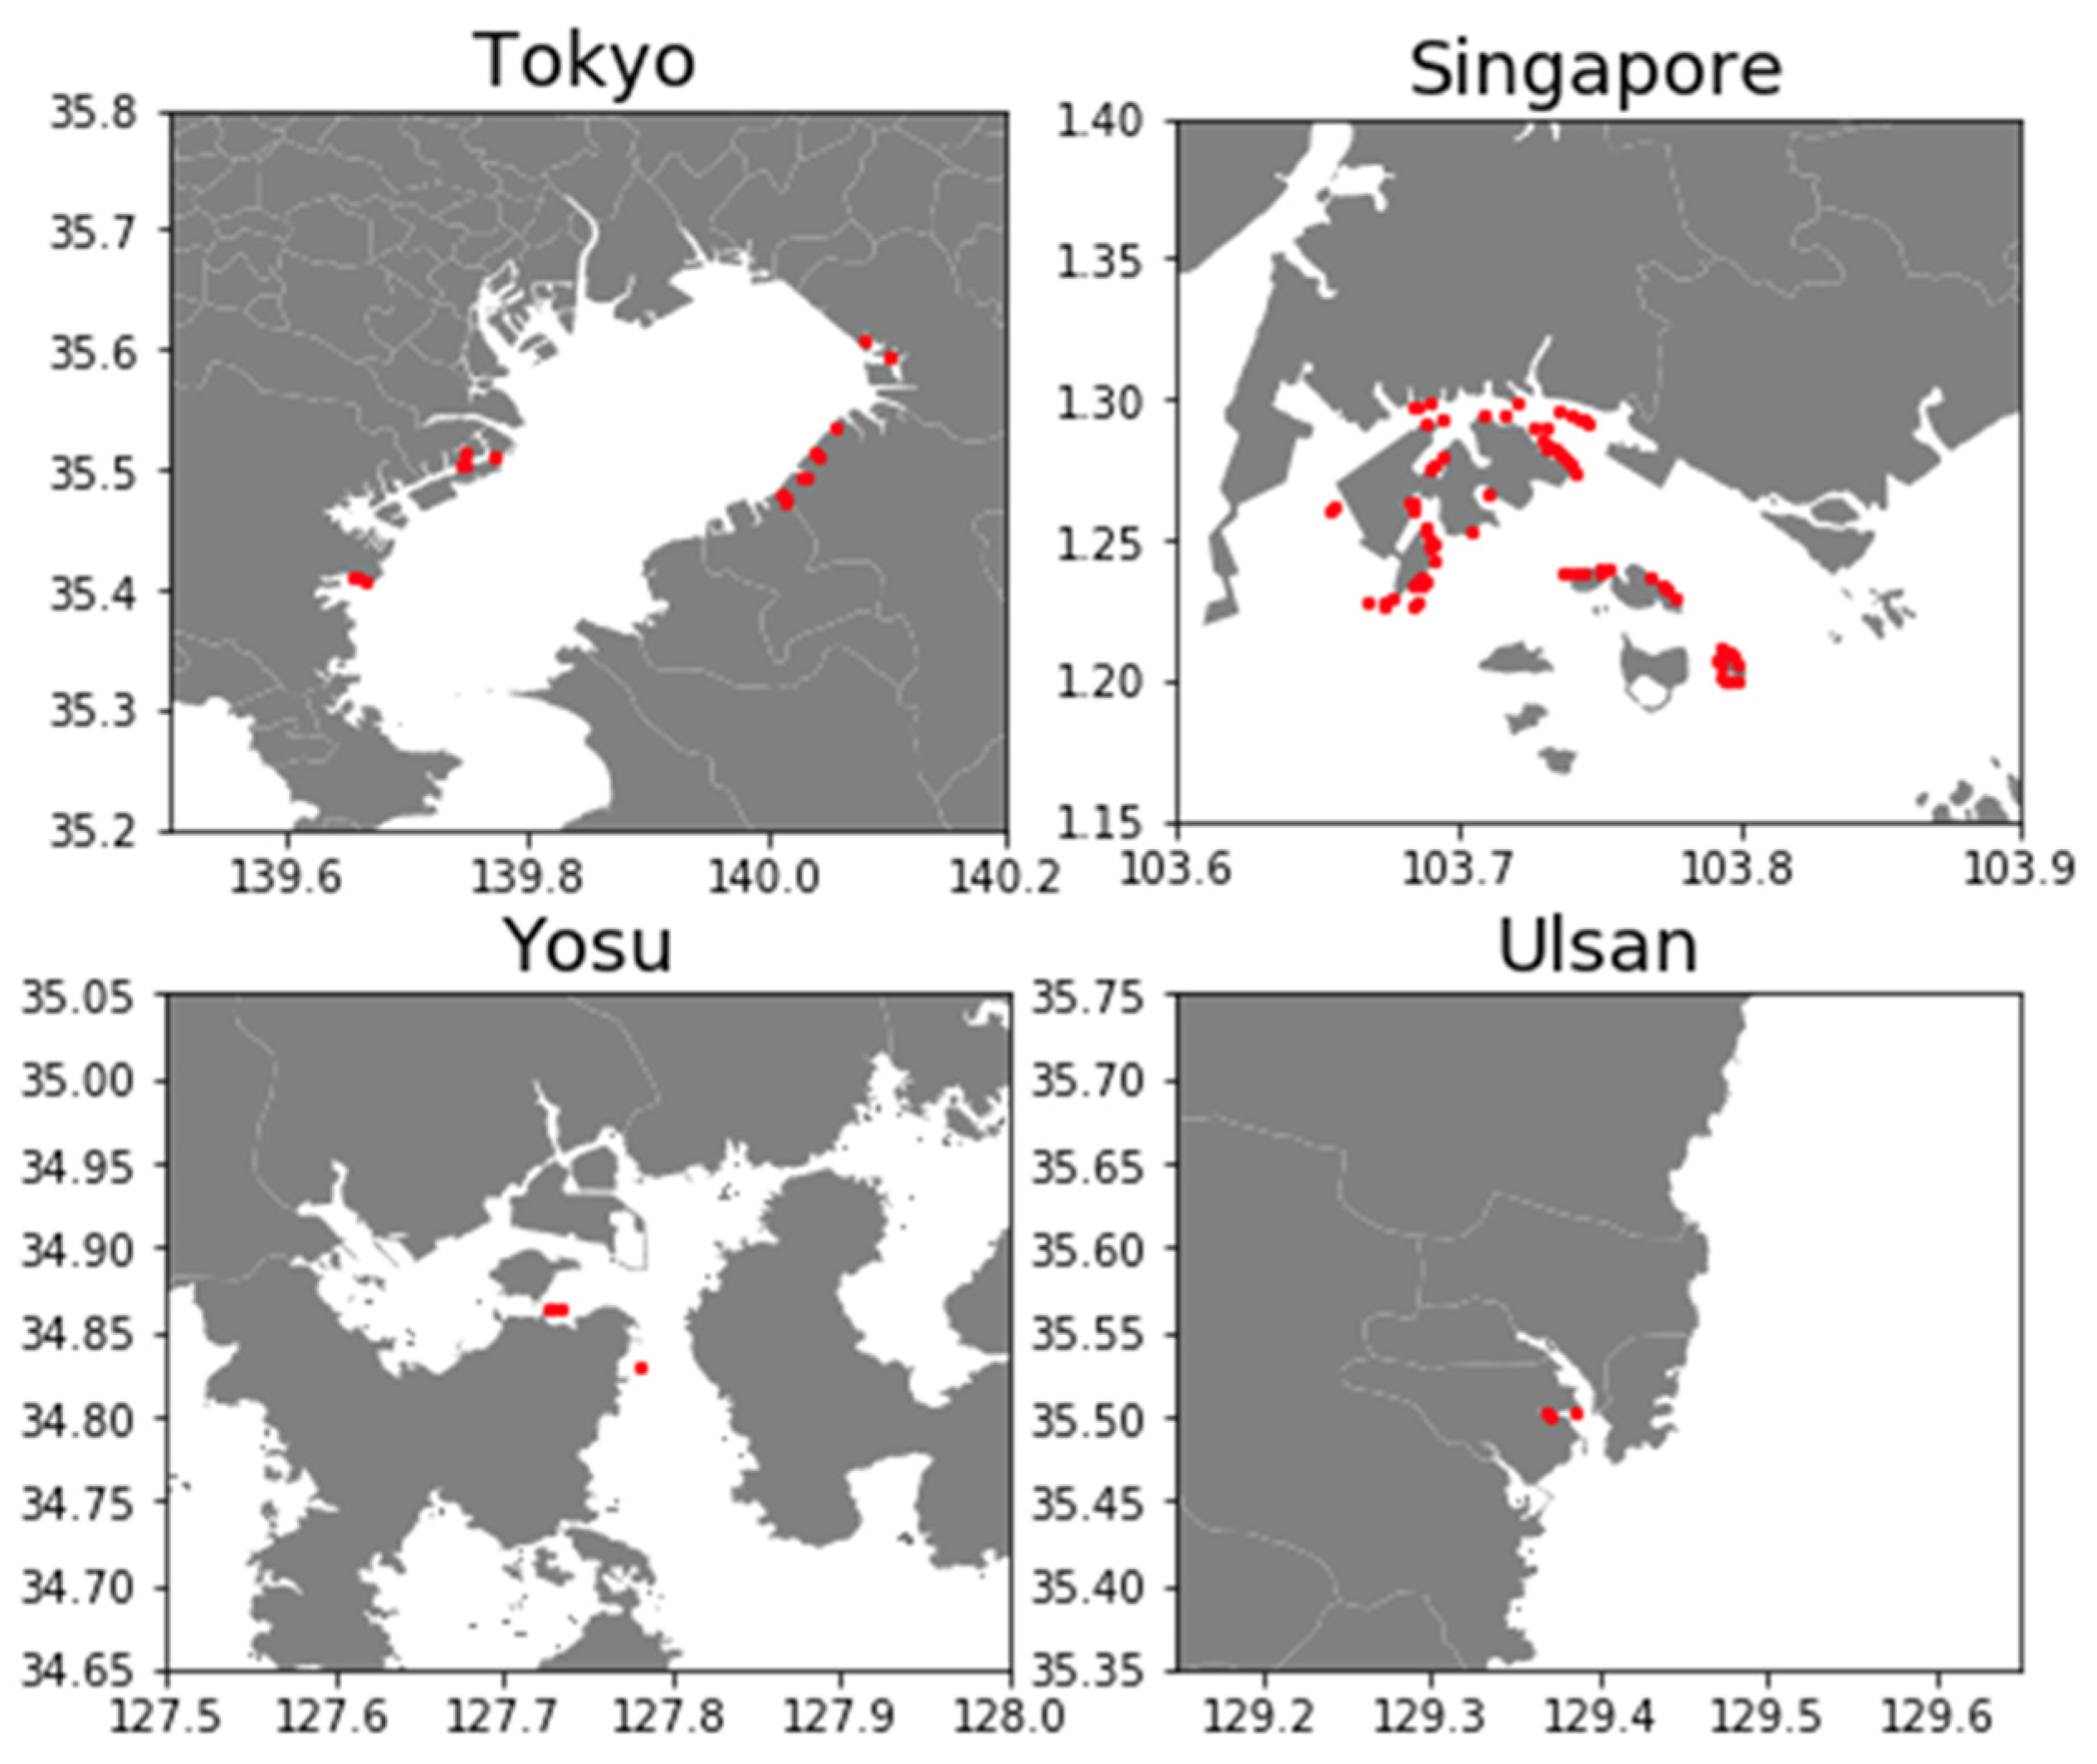
Figure 4 shows the possible refinery berths in the three water areas (Tokyo Bay, Busan Port, and Singapore Port). Since no refineries are found in the Busan Port area, refineries in the nearby ports of Yeosu and Ulsan are extracted based on the bunker barge activity range.
As described above, we assume bunker barges stay within a radius of 100 m from each berth to be refueling activities at the refineries. In matching anchored vessels and bunker barges described in Section 4.4, data matched in the vicinity of the refinery are removed because the two bunker barges might be individually refueled there.

4.5.2. Anchorage at the Bunker Barge Base

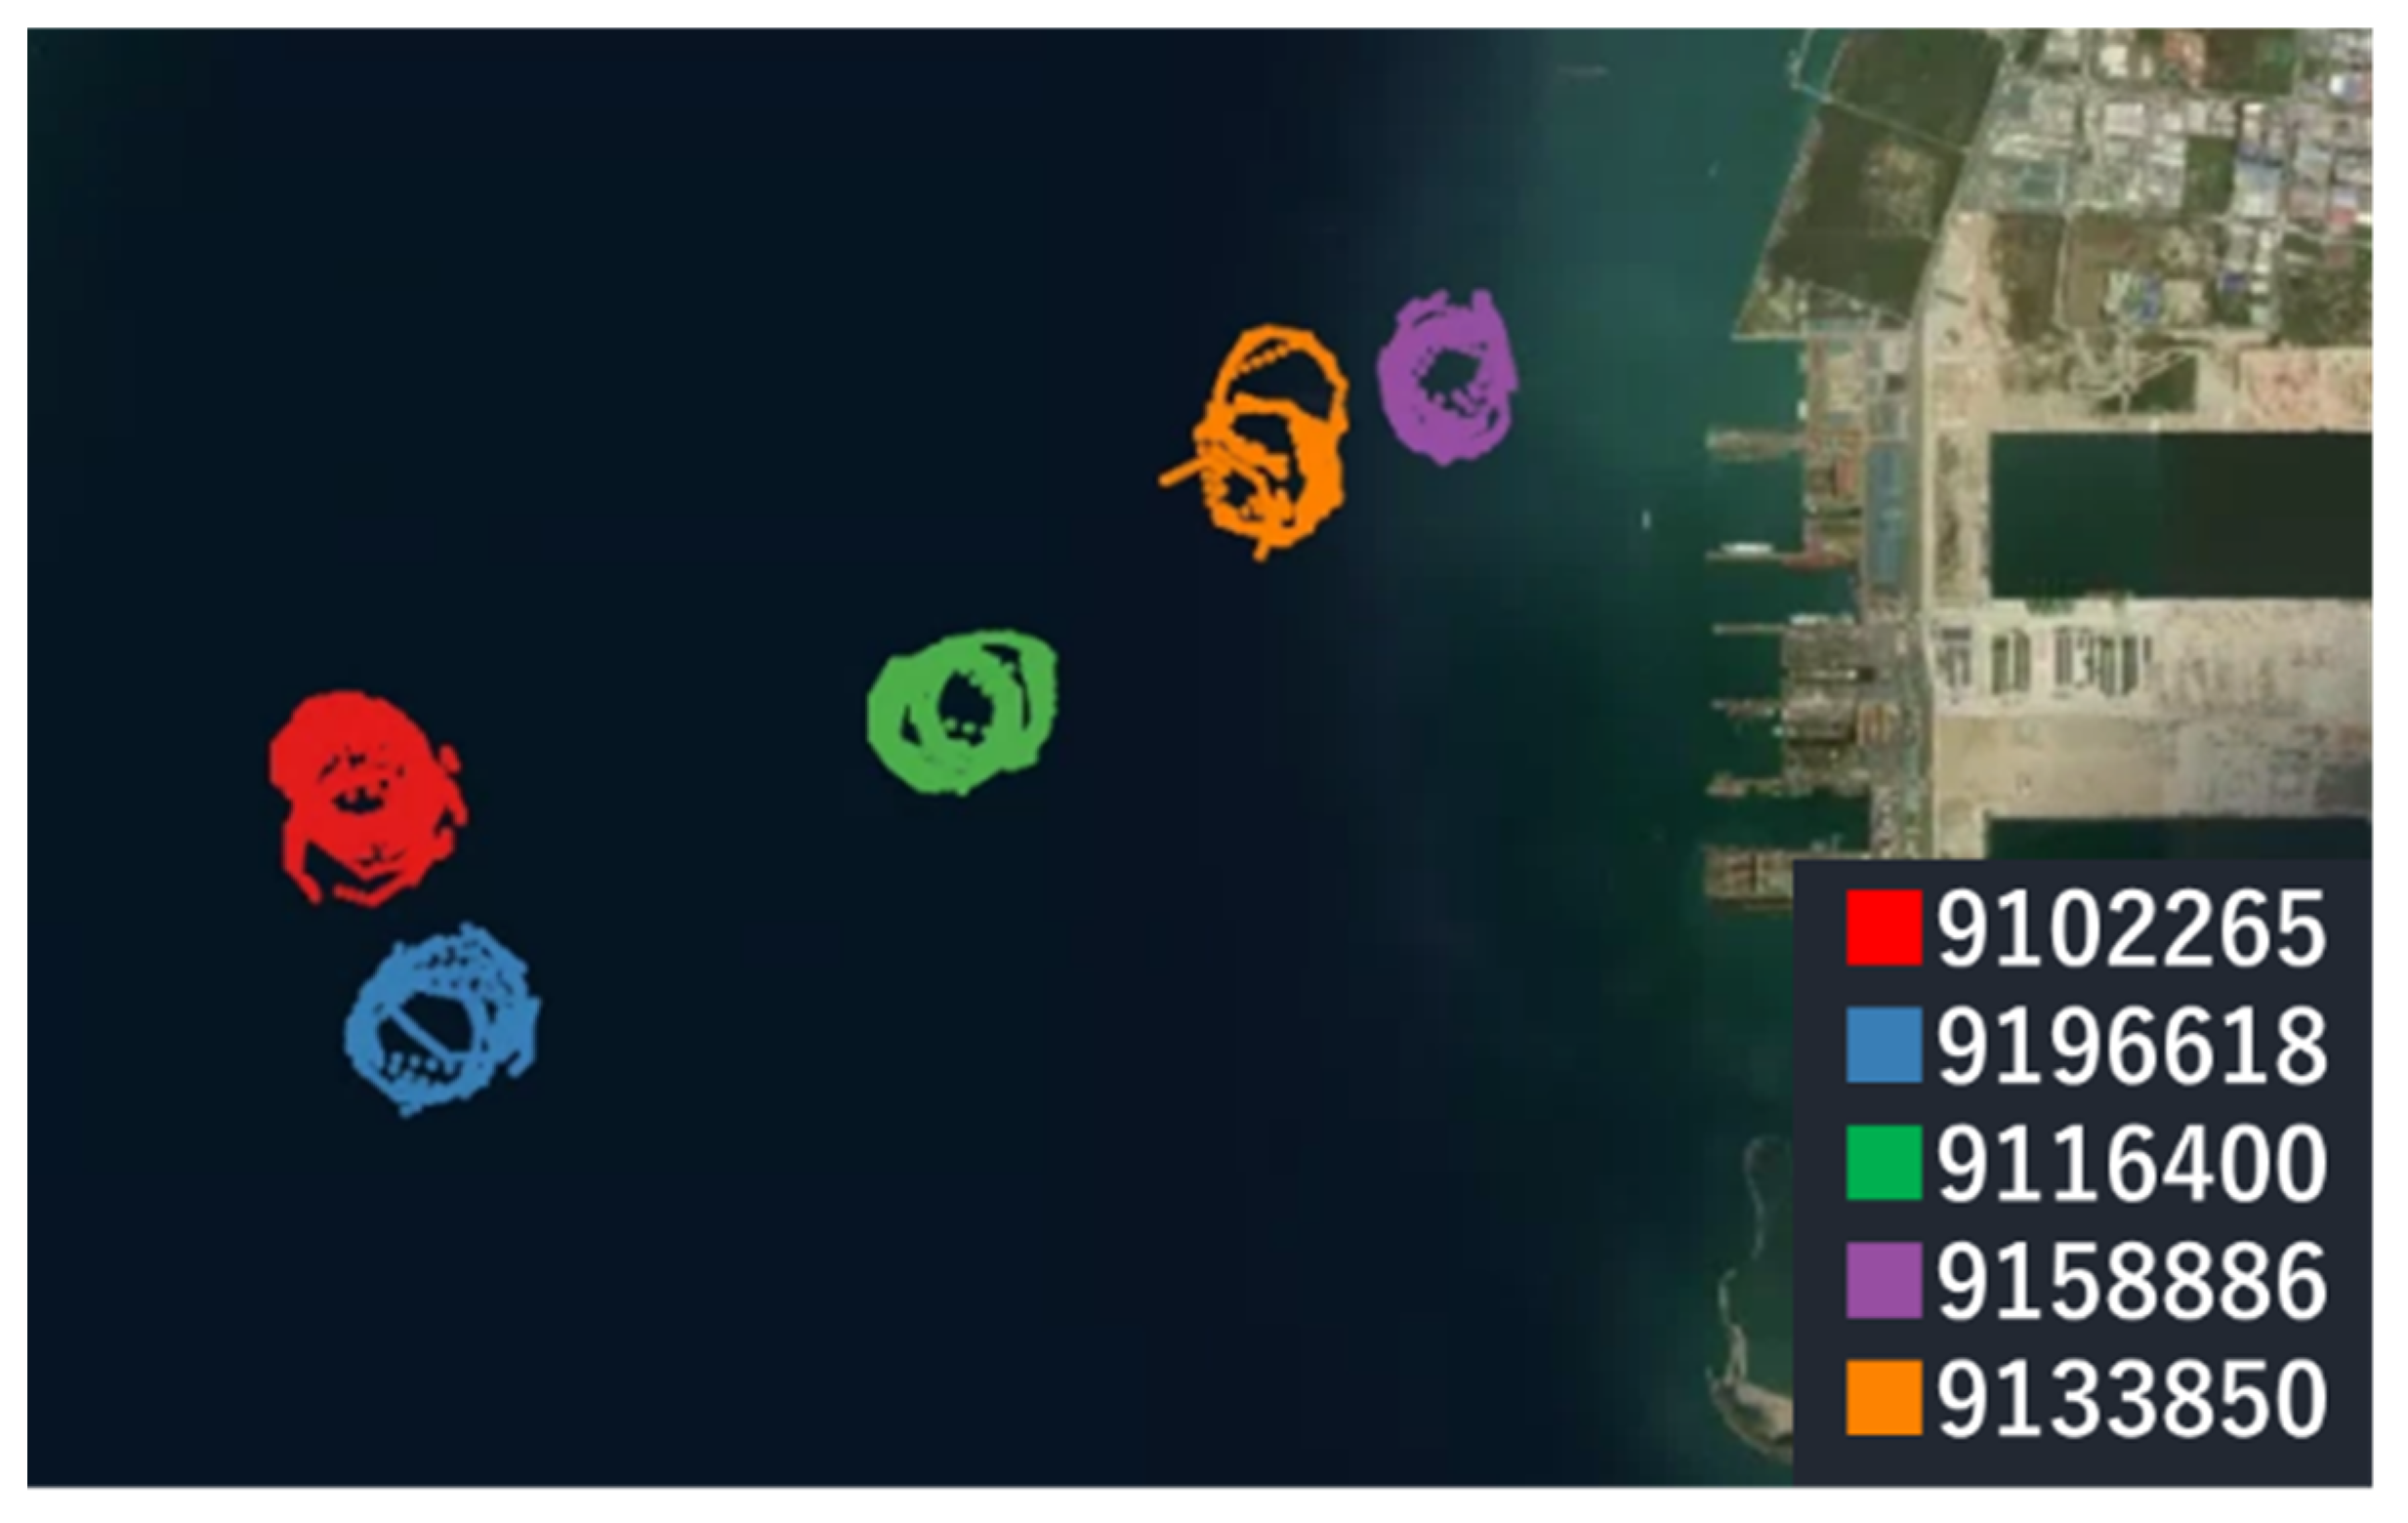
Since bunker barges sometimes berth at their bases, as with oil refineries, vessels berthing at the base may be matched as rendezvous because of their proximity. By observing the obtained coordinates where bunker barges are matched using the matching method described in Section 4.4 with satellite images, the locations of the bunker barge bases are identified, as shown in Figure 5. The matching data in these bases are removed from bunkering operation points.
In addition, anchored vessels that are matched with bunker barges more than ten times during the period are excluded from the analysis because these vessels are considered rendezvous for other purposes (see Section 5.5).

4.6. Validation of the Proposed Method

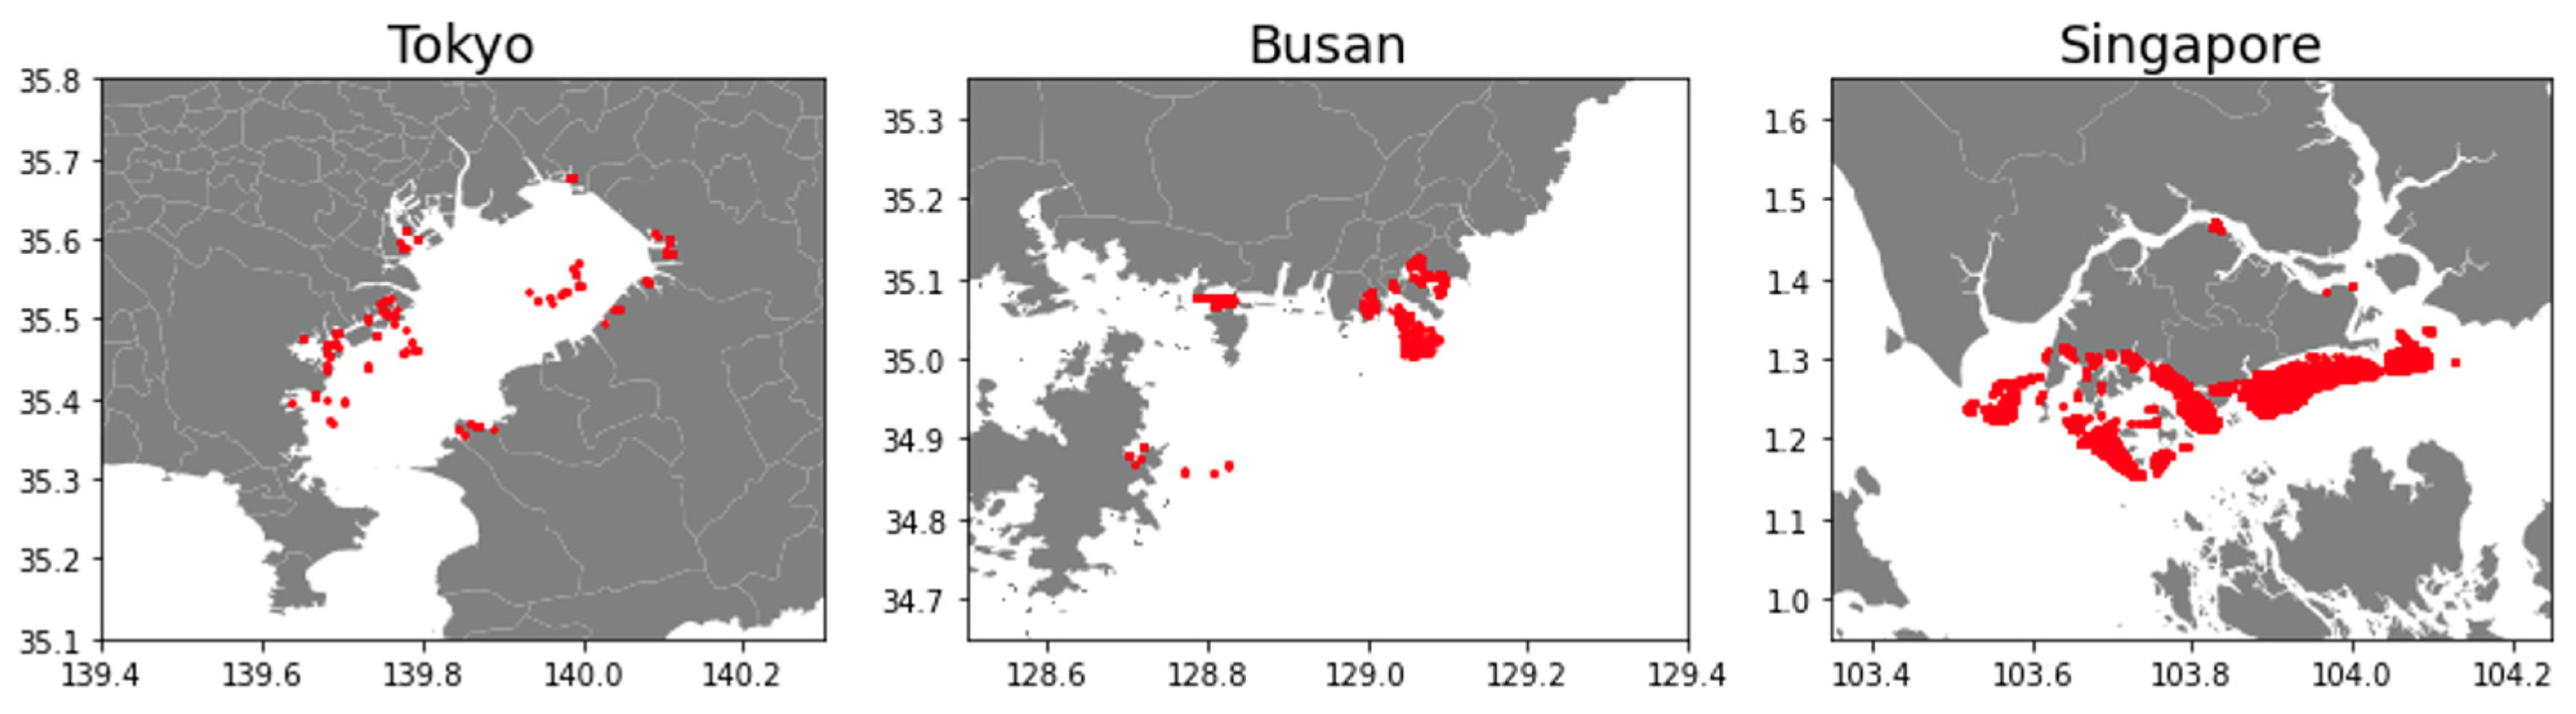
The estimated matching points for bunker barges are shown in Figure 6. In Tokyo Bay, most bunkering operations occur at quays, while offshore operations are limited to two major areas. Many bunkering operations at quays also characterize Busan Port, and offshore operations are limited to the south of the port. In Singapore Port, operations are observed regardless of offshore anchorage or quay.
As described in Section 2, limited pieces of literature comprehensively summarize the actual bunkering operation in each area. Table 2 compares the estimated results of this study and the bunkering information provided by MINT. The table shows that our method extracted more operations in Tokyo Bay and Busan Port than MINT. By contrast, MINT extracted more than twice as many operations as our method in Singapore Port. This result is discussed in the following two cases.
(1)
Operations listed in MINT but not extracted by this method:
One reason our method cannot extract the operations is that MINT uses more detailed AIS data to estimate bunkering, whereas the AIS data used in this study are interpolated from data that had been processed to some extent by the data providers. This raises the possibility that there are not sufficient data for matching.
On the other hand, the MINT estimation may also contain some errors. For example, among the bunkering operations listed by MINT, we found that bunker barge speeds in some records were more than 10 knots, which were likely to be misestimated, at least concerning the timing of bunkering.
(2)
Operations not listed in MINT but extracted by this method:
Although this study includes rendezvous at the quay in the extraction, they were not included in MINT. Therefore, the number of bunkering operations for containerships, which tend to be bunkered at the quay, may be particularly underestimated in MINT. This is why the number of bunkering operations extracted by our method is much larger in Busan Port. For example, our method observed many bunkering activities at quays in the New Busan Port area, while MINT extracted only one.

5. Analysis Results

In this section, we analyze and compare the characteristics of the bunkering activities in each area estimated by the proposed method from the following perspectives.

5.1. Type of Bunkered Vessels and Their Characteristics

Figure 7 shows a breakdown of the types of bunkered vessels in each area. In Tokyo Bay, tankers accounted for the largest share (49.7%), followed by dry bulk carriers. Containerships accounted for the largest share in Busan Port, accounting for 51.1% of the total, including not only full containerships but also vessels capable of carrying containers. In Singapore Port, bulk carriers accounted for 38.3% of the total, followed by tankers (30.4%) and containerships (16.6%). In all three ports, tankers, containerships, and dry bulk carriers accounted for over 80% of the total vessel types.
Table 3 summarizes the median of the bunkering service time during which the bunker barge rendezvoused with anchored vessels and the length overall (LOA) of bunkered vessels by vessel type. As shown in the table, the median service time for containerships and bulk carriers in Tokyo Bay was the shortest compared with other ports, while that for containerships at Singapore Port and that for bulk carriers at Busan Port were the longest. By contrast, the difference in median service time for tankers was not significant among port areas.
Figure 8 and Figure 9 also show the distribution of the bunkering service time and LOA of bunkered vessels by vessel type. As shown in Figure 8, the distribution of service times in Busan Port was more widely distributed compared with other ports, especially tankers and bulk carriers (see Figure 8a,c). This is partly because the farther location of refineries in the Busan area, as described in Section 4.5.1, lowered the accuracy in estimating service times for these vessels, which were mainly refueled offshore. Regarding the distribution of LOA, as shown in Figure 9a, small vessels accounted for most tankers in Tokyo Bay, while large tankers were common in Singapore Port. By contrast, the distributions of LOA for containerships and bulk carriers were not significantly different among port areas, as shown in Figure 9b,c.
Previous studies discussed in Section 2 reported that cost is a major factor for shipowners and shipping companies in selecting bunkering ports. The cost of bunkering depends largely on the fuel oil price in the country. According to bunkering operators, in countries like Japan, where bunkering fuel prices are high, it is common for vessels not to fill their fuel tanks to the full in a single operation but to receive only the minimum supply needed to reach the next destination. The observations that service times for bulk carriers and containerships in Tokyo Bay were shorter than those in Busan and Singapore Ports, although the vessel size distributions were not significantly different, reflect this situation.
Meanwhile, the characteristics of tankers, such as median bunkering service time and distribution of LOA, were different from other types of vessels. One of the reasons may be that some rendezvous between bunker barges were included in tankers, regardless of their consideration described in Section 4.5.

5.2. Relationship of Bunker Barge and Bunkered Vessel Size

Figure 10 shows the relationships between bunker barges and bunkered vessels in LOA and capacity (gross tonnage, GT, and deadweight tonnage, DWT). The correlation coefficients in LOA were -0.37, 0.19, and 0.23 for Tokyo Bay, Busan Port, and Singapore Port, respectively, while those in capacity were -0.06, 0.23, and 0.15, respectively. The figure indicates that all bunker barges provide bunkering services to a wide range of vessel sizes, according to these little correlations between the size of bunker barges and bunkered vessels.
Table 4 shows the number of bunkering operations and service hours by the size of bunkered vessels. In Tokyo Bay and Busan Port, the average service time for bunkered vessels below 10,000 DWT was large, partly because long rendezvous times at the bunker barge base are not fully removed and affect the results as an outlier. These things considered, the table indicates that in Singapore Port, the larger the bunkered vessel size, the longer the service time, except for the smallest vessels. By contrast, no significant correlations between the bunkered vessel size and bunkering service time were observed at the other two ports. This suggests that in Singapore Port, vessels tend to refuel to nearly full tank capacity in a single operation.

5.3. Bunkering Operation Time

Figure 11 shows the distribution of the starting time of bunkering services in each area, indicating that services increased from around 7 to 8 am in all areas. In particular, most bunker barges started operations in the morning in Tokyo Bay and Busan Port. In Tokyo Bay, shown in Figure 11a, most bunkering services operated during the daytime, with 78.1% of the total services starting in the 12 h from 7 to 19. In Busan Port, shown in Figure 11b, nighttime operations were more common than in Tokyo, with 65.4% of all operations starting during the same hours (7 to 19). By contrast, as shown in Figure 11c, operations in Singapore Port started both day and night, and only 54.5% of all operations started during the same hours.

5.4. Where Bunkering Operations Take Place

Whether bunkering operations occur at the quay or offshore during cargo handling operations varies depending on ports and many conditions, including vessel type. For example, containerships tend to be bunkered during loading or discharging containers at container terminals to avoid delays in their sailing schedule [6]. This study analyzes the differences in bunkering locations for fully cellular containerships in each area. Operations within 300 m of the container terminals in each area are defined as quay operations and other operations as offshore operations.
Table 5 shows the number of bunkering operations for each location type. All containerships in Tokyo Bay and most in Busan Port were bunkered during quay operations for loading and discharging. By contrast, offshore operations were also common in Singapore Port. Figure 12 shows the service time distribution of quay and offshore bunkering of containerships in each area. In particular, Figure 12c indicates that the service time of offshore bunkering was relatively shorter in Singapore Port. This is because containerships bunkered offshore were smaller than those bunkered at the quay, as shown in Figure 13, which shows the distribution of containership size (DWT) in Singapore Port.
These results indicate that most containerships are bunkered at quays while providing their liner service; whereas, especially in Singapore Port, some containerships, mainly relatively small ones, are bunkered while anchoring offshore or by calling for refueling.

5.5. Behavior Analysis of Bunker Barges

In this subsection, we analyze the behavior of bunker barges in each area based on the estimated bunkering operation and refinery information. Table 6 shows the number of bunker barges that had and had not refueled at refineries and the number of bunkering operations. The table indicates that in Tokyo Bay and Busan Port, most operations were conducted by bunker barges refueled at the refineries. However, 14.6% of the bunker barges in Singapore Port never anchored at the refinery. Figure 14 shows the three-month trajectories of the bunker barges with a high frequency of operations (71 times) and a low frequency of stays at refineries (16 times). One of the possible explanations for the discrepancy between the number of operations and stays at the refinery was floating storage and offloading (FSO) tankers, as shown in Table 7 and Figure 15, which are designed to store fuel and supply it to tankers, providing bunker fuels to bunker barges in Singapore Port.
The average number of bunkering operations per refinery stop for bunker barges that have ever refueled at a refinery is 0.87, 0.81, and 1.80 in Tokyo Bay, Busan Port, and Singapore Port, respectively. This result indicates that bunker barges in Tokyo Bay and Busan Port tended to refuel after each operation, whereas those in Singapore Port tended to bunker multiple times in a single refueling. Another possible reason why the average number in Busan Port was as small as that in Tokyo Bay is that bunker barges in Busan also conducted operations at other ports such as Ulsan and Yeosu.

6. Conclusions

This paper developed an algorithm to extract rendezvous between bunker barges and other vessels using AIS data. Specifically, anchored vessels were first extracted, and the distance between the coordinates of the anchored vessel and bunker barges was calculated for spatio-temporal matching. By using DBSCAN to extract anchored vessels, vessels drifting during rendezvous, not only stopped vessels, can be extracted. In addition, by considering the matching at the refinery and bunker barge base, the stopping of bunker barges around these places can be subtracted from potential bunker points. Compared with the bunkering information provided by MINT, the accuracy of the extraction results was found to depend on the granularity of AIS data. Meanwhile, our algorithm can detect many operations at quays that MINT does not cover.
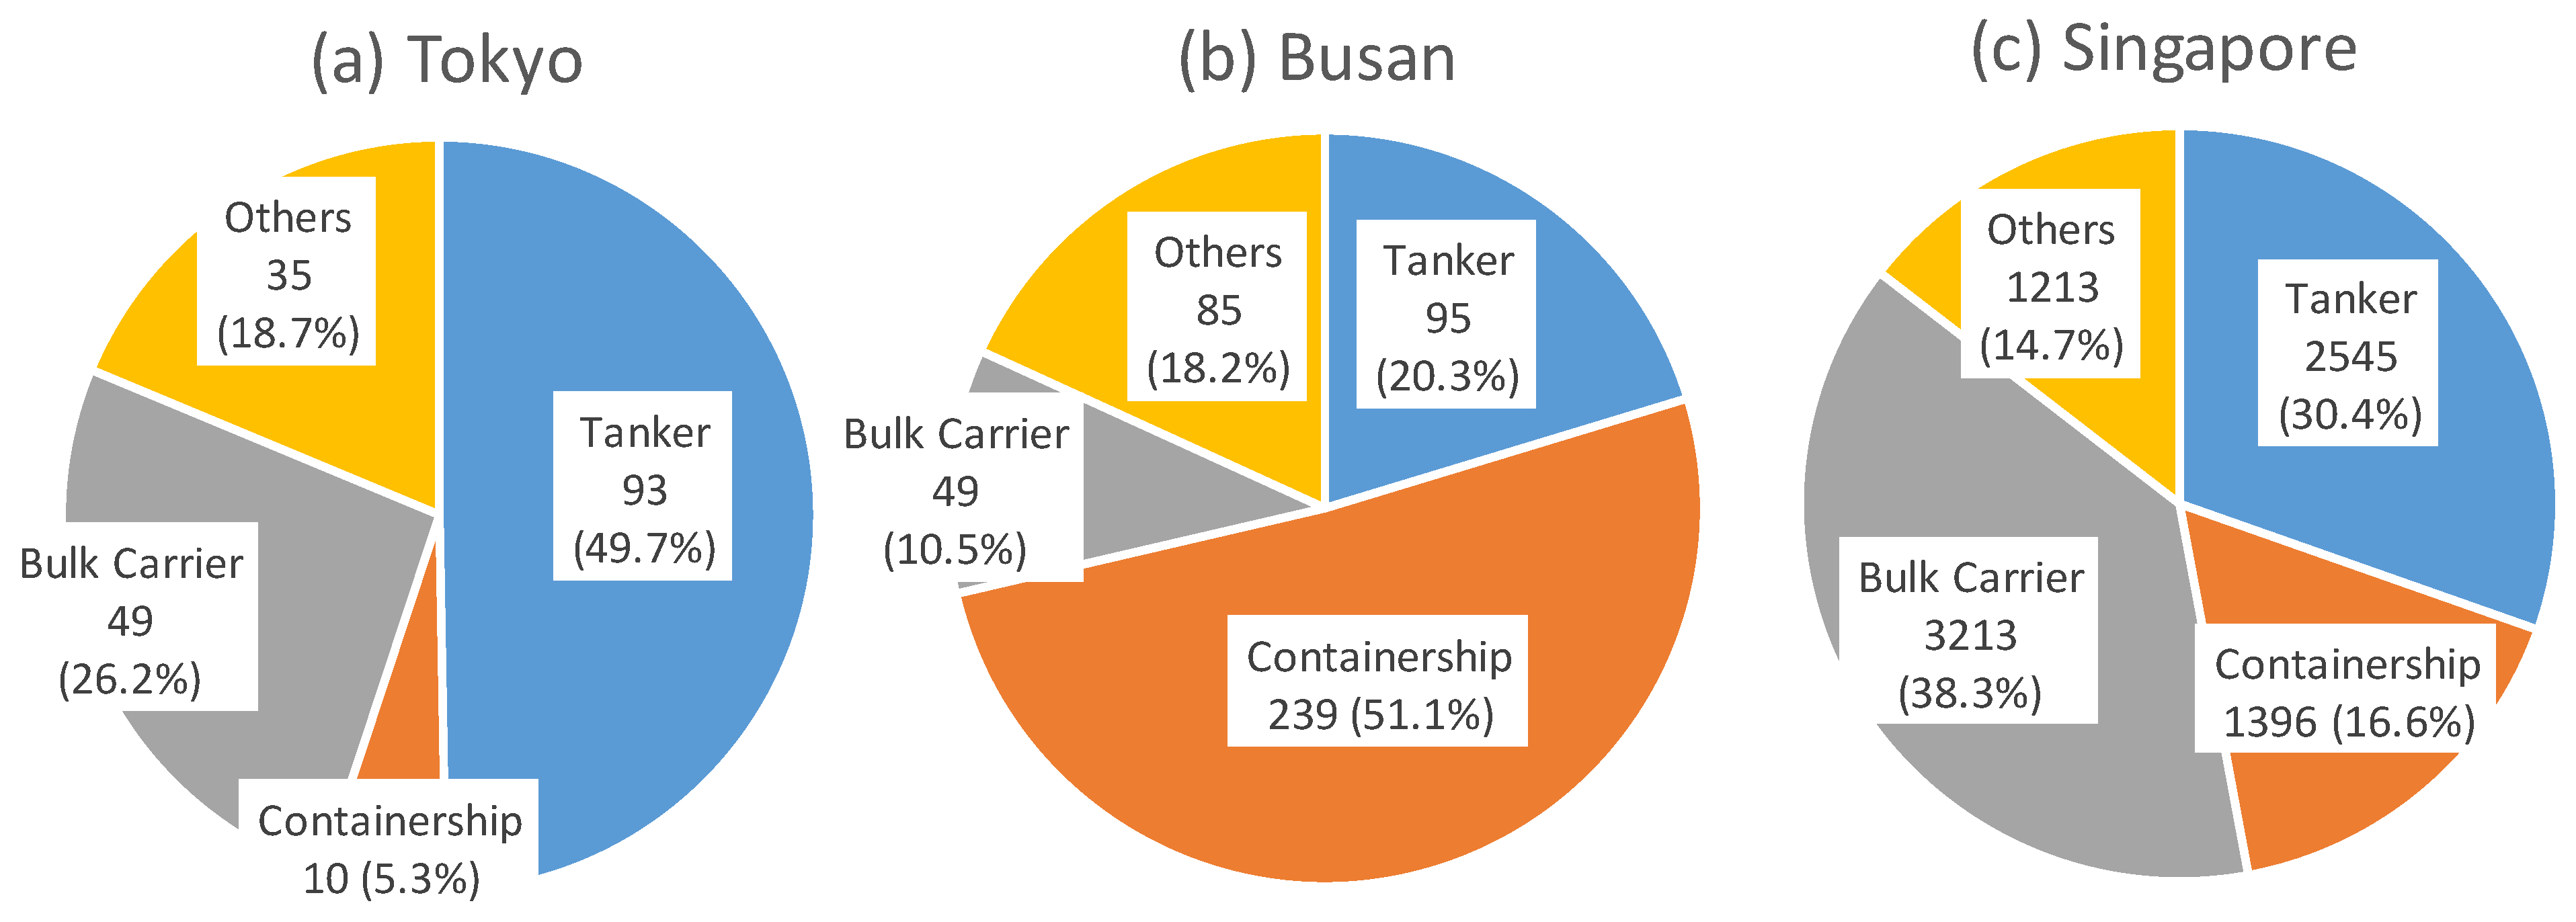
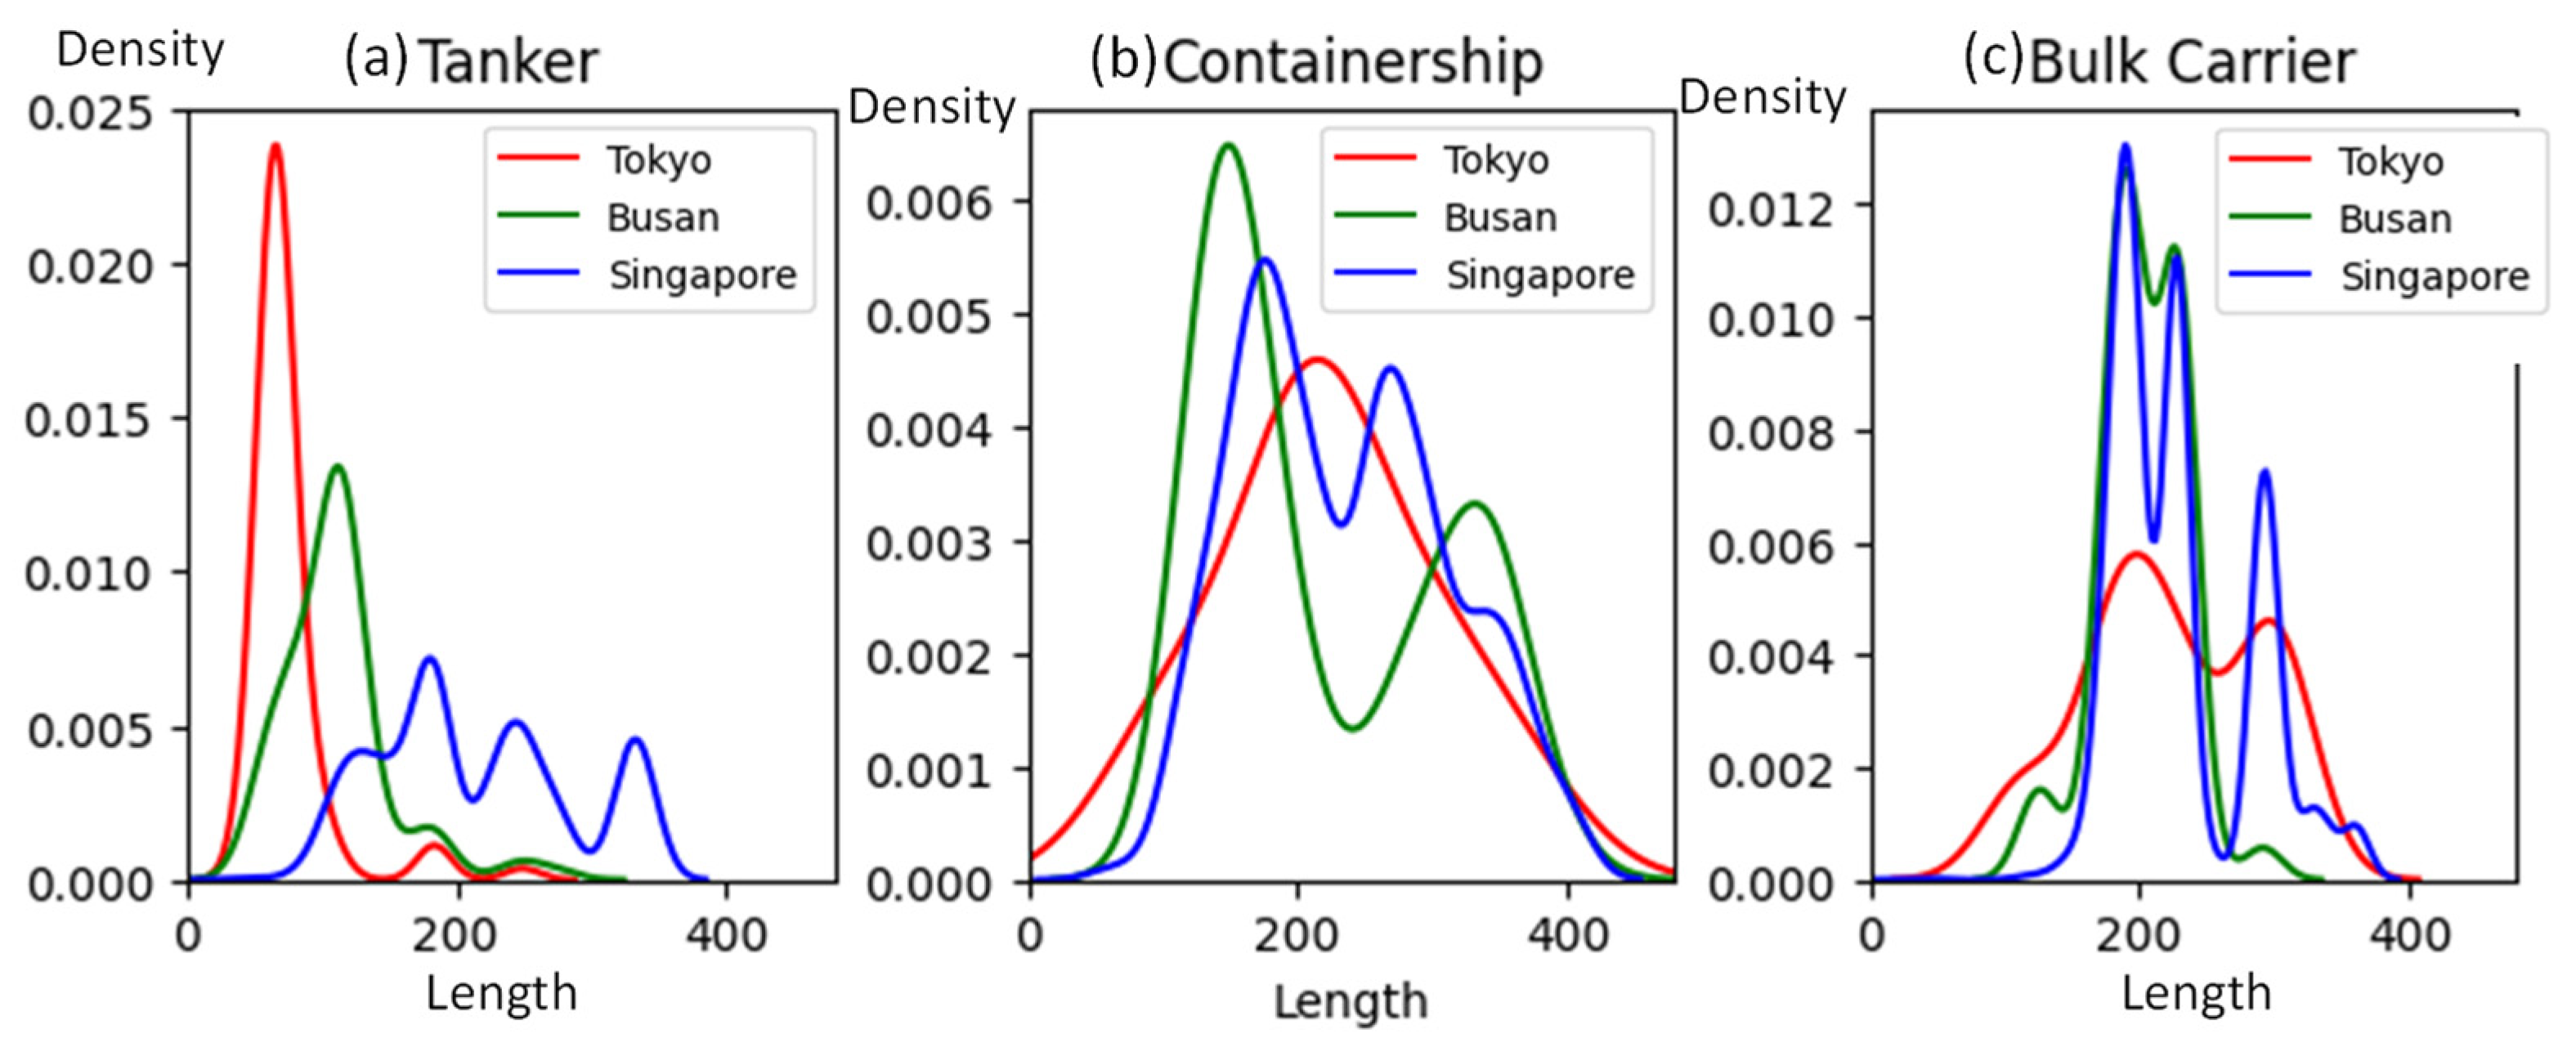
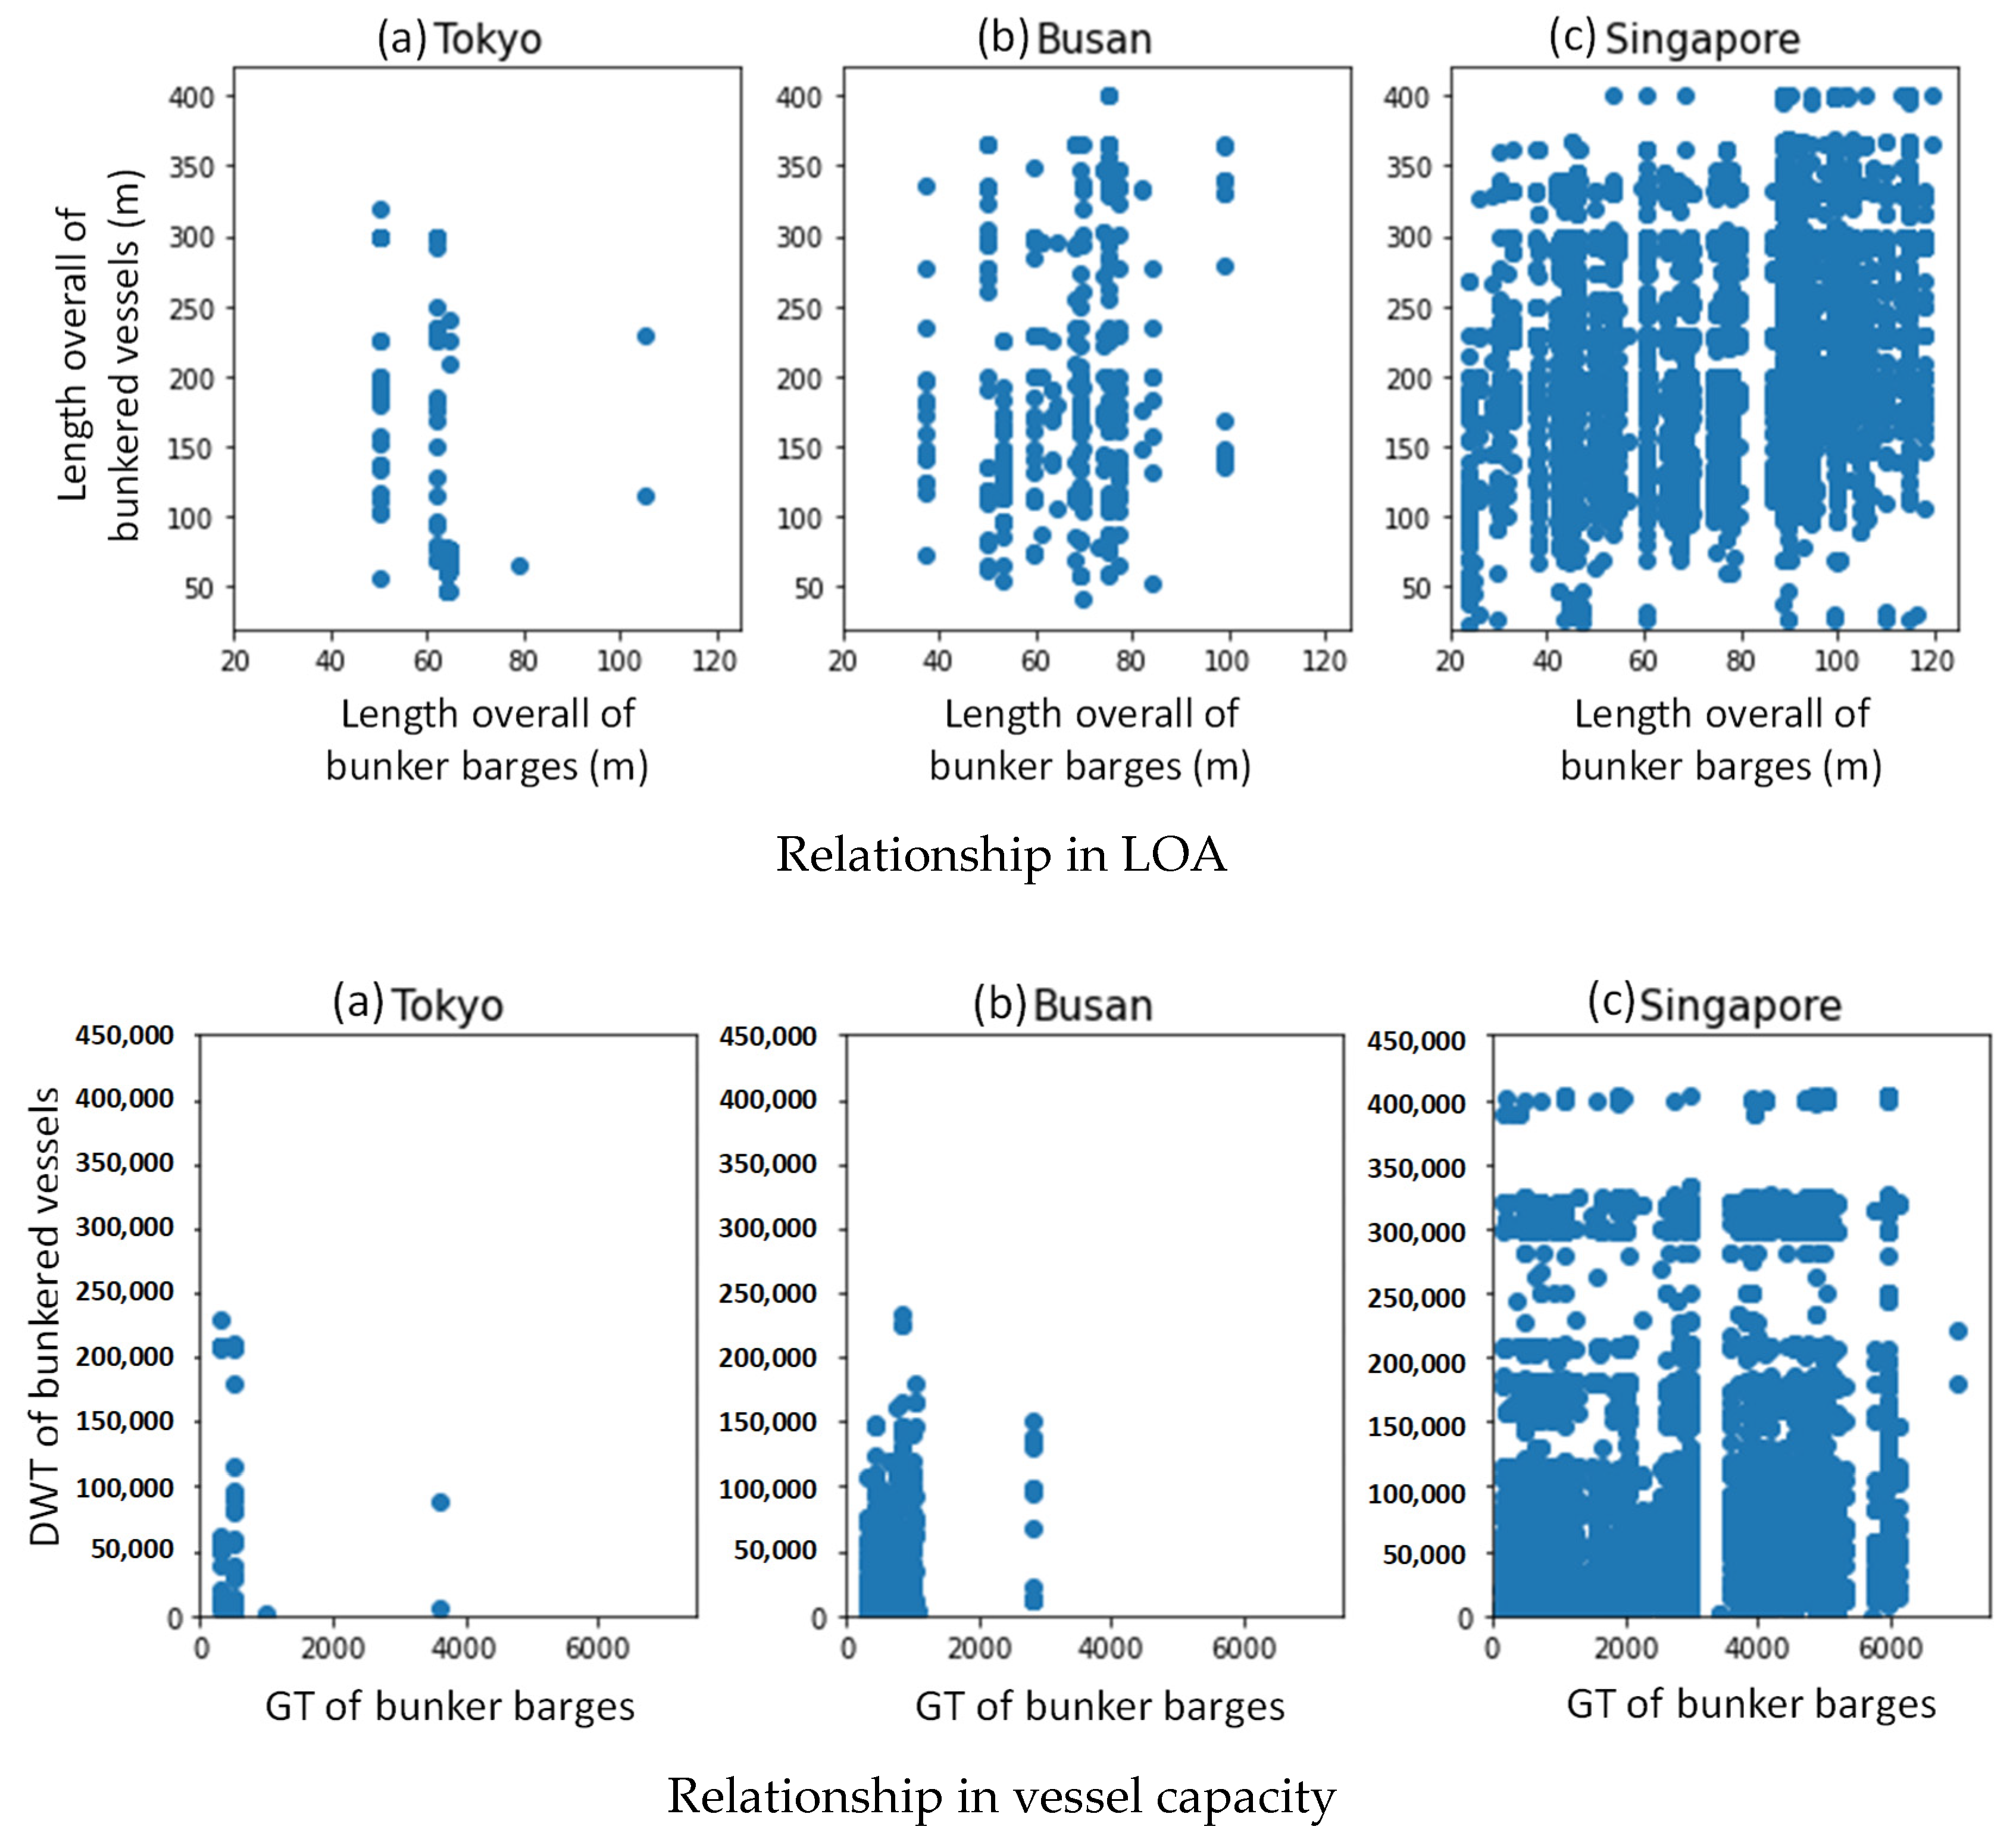
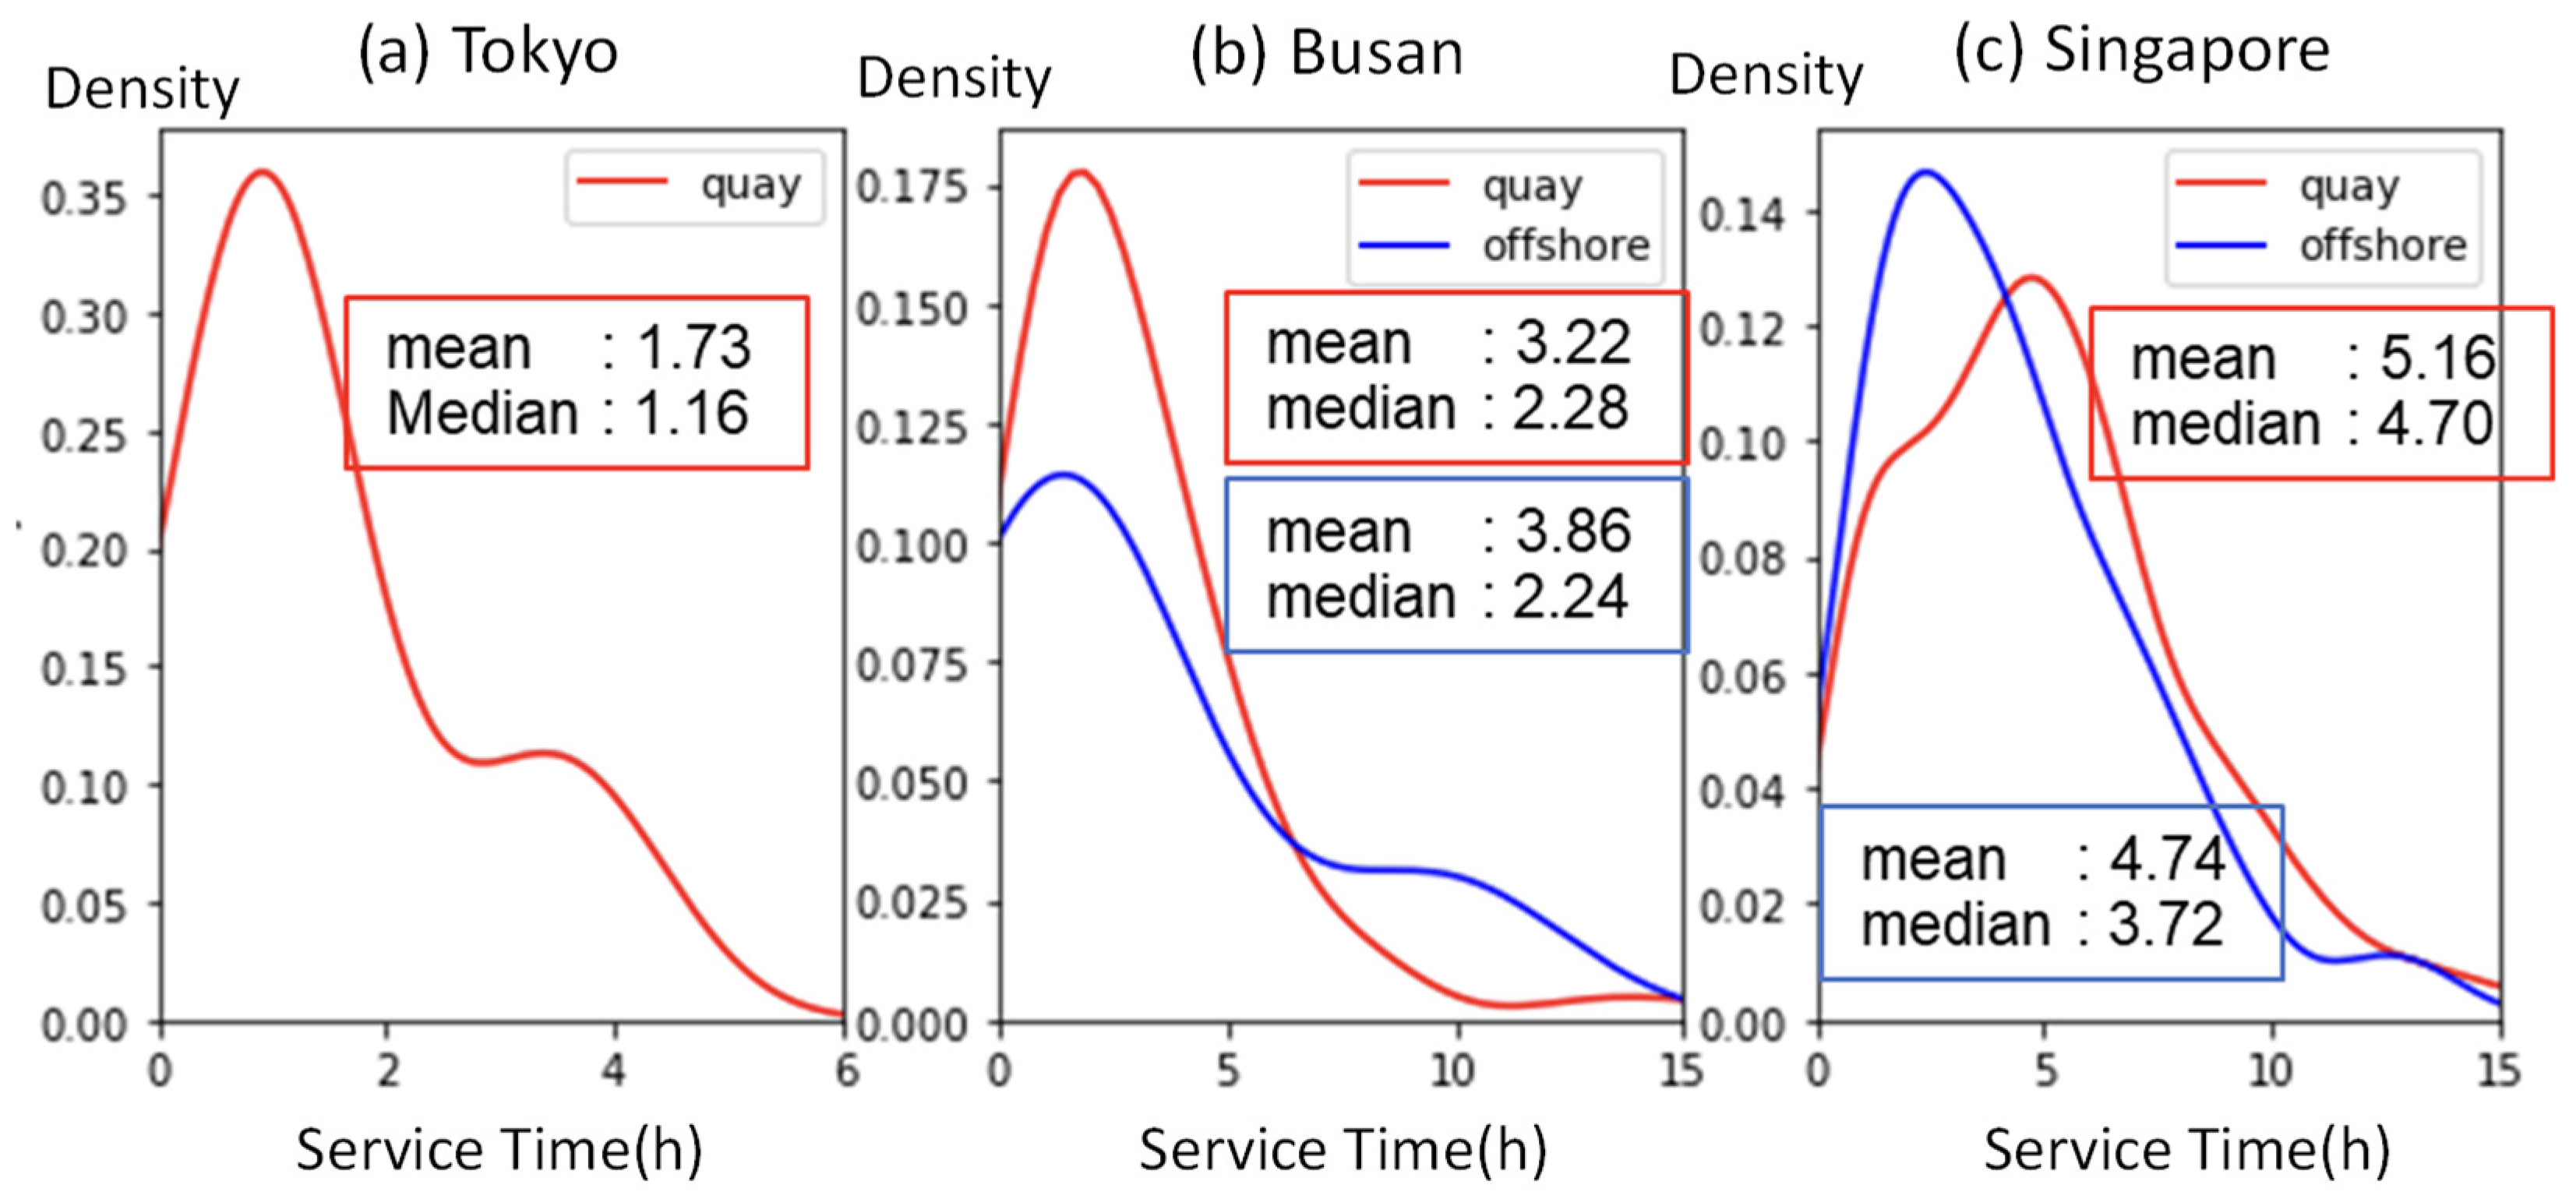
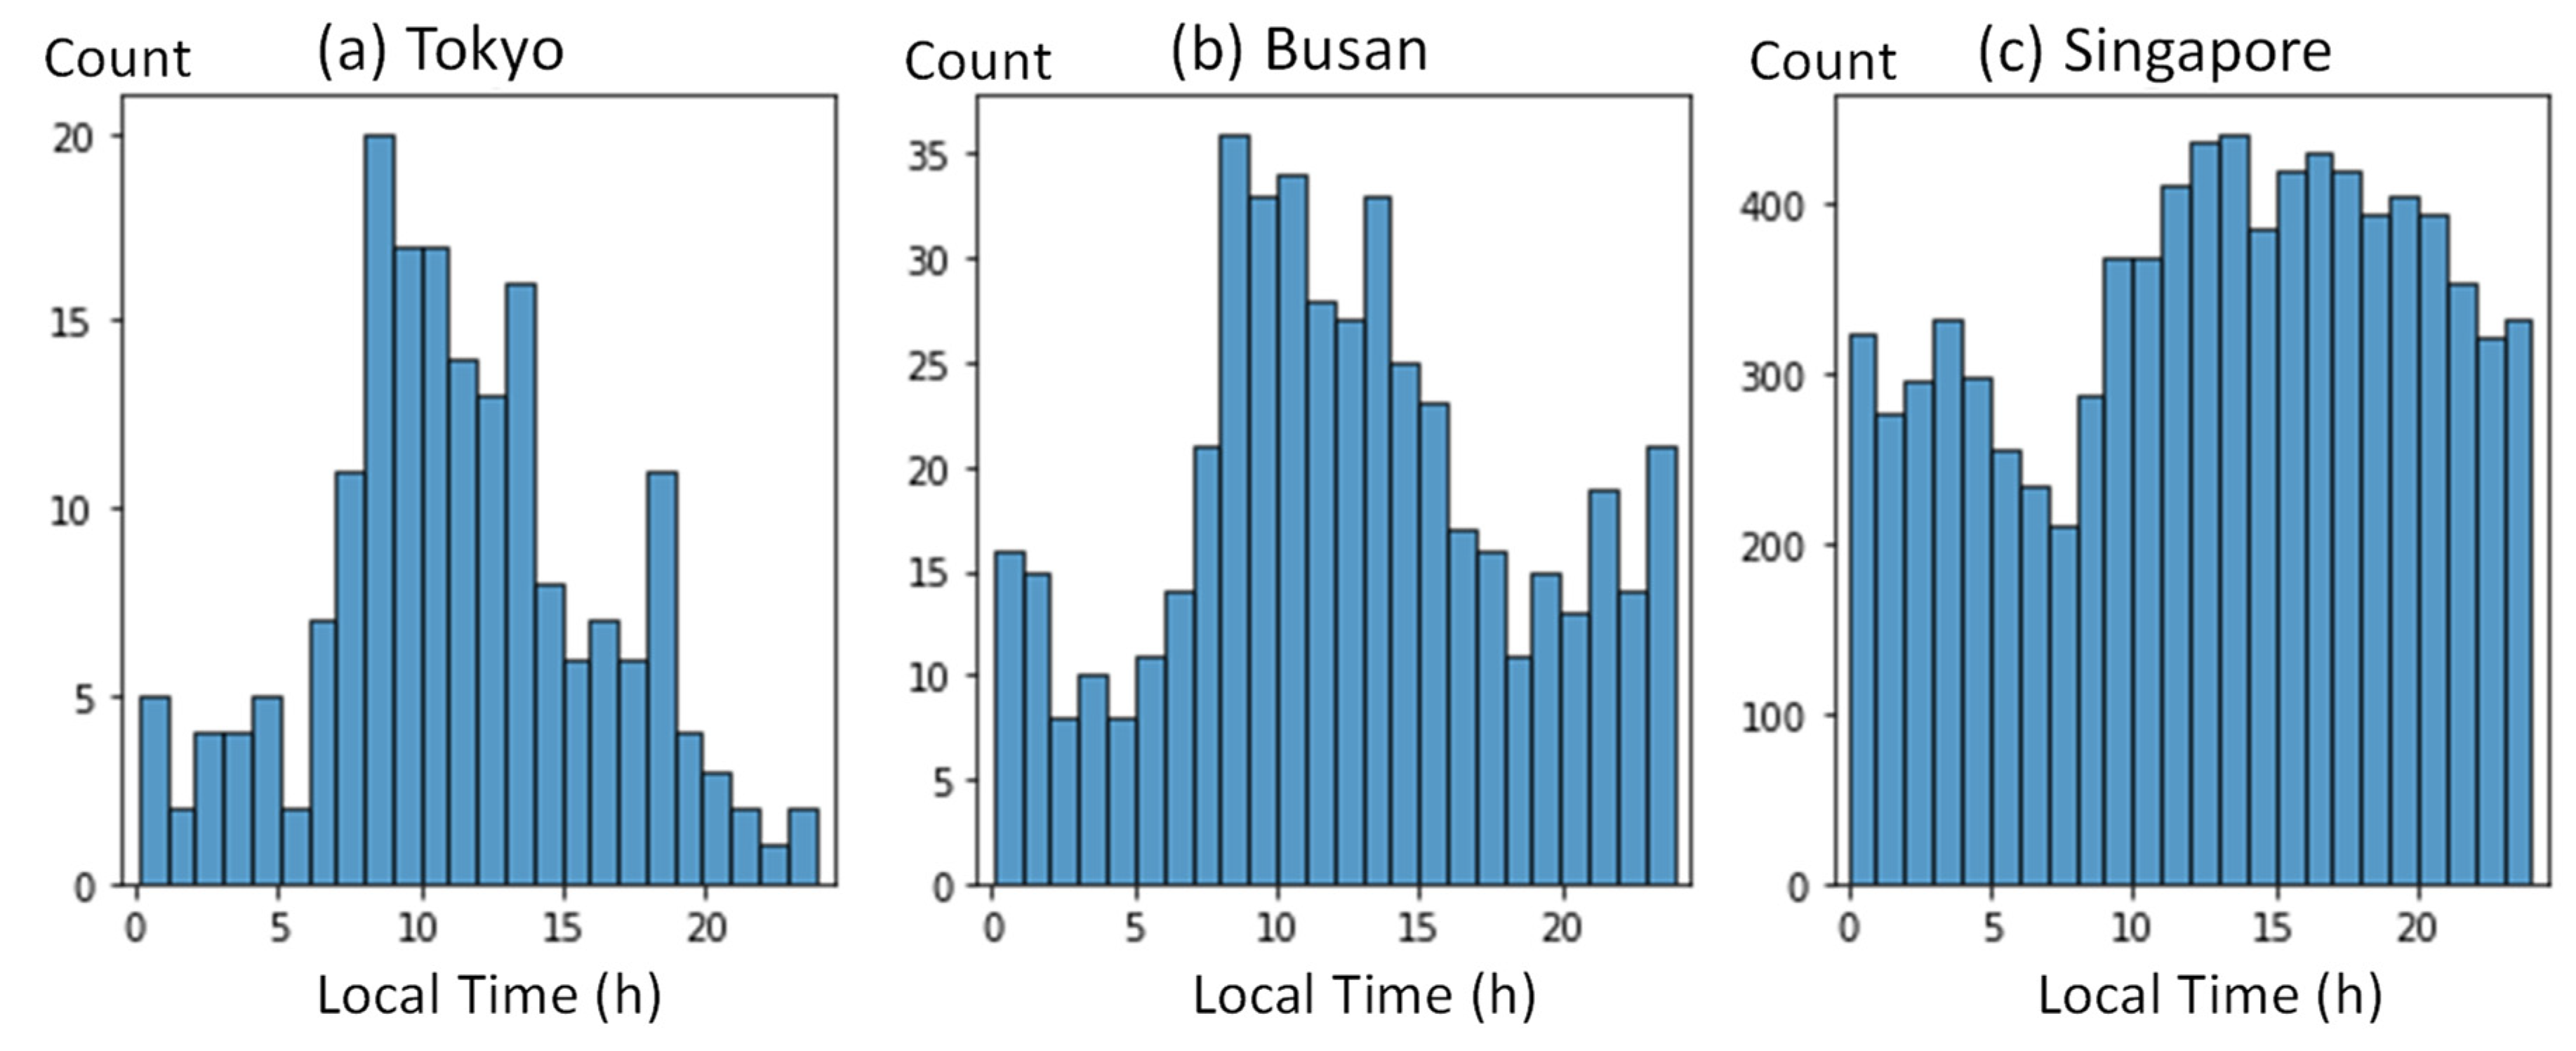
Subsequently, based on the estimated bunkering service data, we examined the characteristics and differences in bunkering service times and starting times of bunkering operations by size and type of bunkered vessels in Tokyo Bay, Busan Port, and Singapore Port. The main findings were as follows. First, the composition of vessel types to be bunkered and the service times of bunkering operations differed among the three port areas. In Tokyo Bay, in particular, service times were shorter for containerships and bulk carriers than the other two ports, suggesting lower order volumes of fuel due to its high prices. Second, no correlation between the size of bunker barges and bunkered vessels was found in all ports, whereas there was a positive correlation between the size of the containerships and the bunkering service times in Singapore Port. Third, regarding the start time of bunkering, most bunkering services started during the daytime in Tokyo Bay, whereas operations in Singapore Port more equally started throughout the day. Fourth, regarding bunkering locations of containerships, most bunkering operations took place at the container terminals in Tokyo Bay and Busan Port, whereas it was common for operations offshore in Singapore Port. This result indicates that most containerships are bunkered at quays while providing their liner service, whereas some containerships are bunkered while anchoring offshore in Singapore Port. Lastly, the number of times bunker barges rendezvoused with other vessels for a single refueling varied by port. This result implies that in the areas where a bunker barge is usually refueled at the refinery for each bunkering operation, such as Tokyo Bay, the accuracy of determining whether a rendezvous is for bunkering or not can be improved from the behavior pattern of bunker barges acquired from AIS data. However, for ports such as Busan and Singapore, where bunkering is performed multiple times per refueling, it is more difficult to determine the purpose of rendezvous.
In summary, this study reveals the reality of bunkering, which varies by port because of the differences in market conditions, such as the frequency of bunkering opportunities, bunker prices, and regulations. As a result, similar to Fuentes’s [34] analysis of Mediterranean ports, this study confirms that service time and bunkering locations (quaysides or offshore) vary depending on ports. In addition, the bunkering service times obtained in this study are, even in Singapore Port, overall shorter than those in Fuentes [34] because we estimate the rendezvous between bunker barges and bunkered vessels more strictly by spatio-temporally matching individual AIS data before clustering. Furthermore, this study considers the behavior of bunkering barges to circumnavigate not only bunkered vessels but also refineries and bunker barge bases, which were not considered in the existing literature, and clarifies the characteristics of each port from the perspective of bunkering vessel operations.
One of the future issues, other than applying our method to the ports in other regions of the world, is to link the knowledge obtained from the method proposed in this study to forming alternative fuel bunkering bases such as LNG. For example, in the development stage of bunkering bases with few refueling stations, the current situation in Singapore Port, where milk-run operations are a distinctive feature, will be helpful as a reference. Another lesson from Singapore Port, which provides bunkering services day and night, is the possibility of encouraging bunkering operations during nighttime, including formulating regulations and developing bunkering bases to optimize bunkering services. It is also important to model the selection of bunkering ports for each type of cargo vessel and the amount of bunker fuel ordered to predict the future bunkering demand and develop a strategy for bunkering service provision.

Author Contributions

Conceptualization, E.W. and R.S.; methodology, E.W.; software, E.W.; validation, E.W. and R.S.; formal analysis, E.W.; investigation, E.W. and R.S.; resources, R.S.; data curation, E.W. and R.S.; writing—original draft preparation, E.W.; writing—review and editing, R.S.; visualization, E.W.; supervision, R.S.; project administration, R.S.; funding acquisition, R.S. All authors have read and agreed to the published version of the manuscript.

Funding

This research was funded by JSPS KAKENHI, grant number 20H00286.

Institutional Review Board Statement

Not applicable.

Informed Consent Statement

Not applicable.

Data Availability Statement

Data are contained within the article.

Conflicts of Interest

The authors declare no conflict of interest.

References

  1. World Ports Sustainability Program. Available online: https://sustainableworldports.org/clean-marine-fuels/lng-bunkering/ports/lng-bunker-infrastructure (accessed on 26 August 2023).
  2. International Maritime Organization. Available online: https://www.imo.org/en/MediaCentre/PressBriefings/Pages/Revised-GHG-reduction-strategy-for-global-shipping-adopted-.aspx (accessed on 26 August 2023).
  3. Nippon Yusen Kaisha. Available online: https://www.nyk.com/english/news/2022/20220325_02.html (accessed on 26 August 2023).
  4. Ministry of Economy, Trade and Industry of Japan. Available online: https://www.mlit.go.jp/common/001354313.pdf (accessed on 26 August 2023).
  5. Acosta, M.; Coronado, D.; Cerban, M.D.M. Bunkering competition and competitiveness at the ports of the Gibraltar Strait. J. Transp. Geogr. 2011, 19, 911–916. [Google Scholar] [CrossRef]
  6. Aronietis, R.; Sys, C.; Van Hassel, E.; Vanelslander, T. Investigating the bunkering choice determinants: The case of the port of Antwerp. J. Shipp. Trade 2017, 2, 8. [Google Scholar] [CrossRef]
  7. Lam, J.S.L.; Chen, D.; Cheng, F.; Wong, K. Assessment of the Competitiveness of Ports as Bunkering Hubs: Empirical Studies on Singapore and Shanghai. Transp. J. 2011, 50, 176–203. [Google Scholar] [CrossRef]
  8. Yao, Z.; Ng, S.H.; Lee, L.H. A study on bunker fuel management for the shipping liner services. Comput. Oper. Res. 2012, 39, 1160–1172. [Google Scholar] [CrossRef]
  9. Wang, Y.; Yeo, G.-T.; Ng, A.K.Y. Choosing optimal bunkering ports for liner shipping companies: A hybrid Fuzzy-Delphi–TOPSIS approach. Transp. Policy 2014, 35, 358–365. [Google Scholar] [CrossRef]
  10. Ghosh, S.; Lee, L.H.; Ng, S.H. Bunkering decisions for a shipping liner in an uncertain environment with service contract. Eur. J. Oper. Res. 2015, 244, 792–802. [Google Scholar] [CrossRef]
  11. Aydin, N.; Lee, H.; Mansouri, S.A. Speed optimization and bunkering in liner shipping in the presence of uncertain service times and time windows at ports. Eur. J. Oper. Res. 2017, 259, 143–154. [Google Scholar] [CrossRef]
  12. De, A.; Choudhary, A.; Turkay, M.; Tiwari, M.K. Bunkering policies for a fuel bunker management problem for liner shipping networks. Eur. J. Oper. Res. 2021, 289, 927–939. [Google Scholar] [CrossRef]
  13. Meng, Q.; Wang, S.; Lee, C.-Y. A tailored branch-and-price approach for a joint tramp ship routing and bunkering problem. Transp. Res. Part B 2015, 72, 1–19. [Google Scholar] [CrossRef]
  14. Peng, Y.; Zhao, X.; Zuo, T.; Wang, W.; Song, X. A systematic literature review on port LNG bunkering station. Transp. Res. Part D 2021, 91, 102704. [Google Scholar] [CrossRef]
  15. Tam, J.H. Overview of performing shore-to-ship and ship-to-ship compatibility studies for LNG bunker vessels. J. Mar. Eng. Technol. 2022, 21, 257–270. [Google Scholar] [CrossRef]
  16. Chae, G.-Y.; An, S.-H.; Lee, C.-Y. Demand forecasting for liquified natural gas bunkering by country and region using meta-analysis and artificial intelligence. Sustainability 2021, 13, 9058. [Google Scholar] [CrossRef]
  17. Kim, A.-R.; Kwak, D.-W.; Seo, Y.-J. Evaluation of liquefied natural gas bunkering port selection. Int. J. Logist. Res. Appl. 2021, 24, 213–226. [Google Scholar] [CrossRef]
  18. Ha, M.-H.; Park, H.; Seo, Y.-J. Understanding core determinants in LNG bunkering port selection: Policy implications for the maritime industry. Mar. Policy 2023, 152, 105608. [Google Scholar] [CrossRef]
  19. Aymelek, M.; Boulougouris, E.K.; Turan, O.; Konovessis, D. Challenges and opportunities for LNG as a ship fuel source and an application to bunkering network optimization. In Maritime Technology and Engineering—Proceedings of MARTECH 2014; CRC Press/Balkema: Boca Raton, FL, USA, 2014. [Google Scholar] [CrossRef]
  20. Ursavas, E.; Zhu, S.X.; Savelsbergh, M. LNG bunkering network design in inland waterways. Transp. Res. Part C 2020, 120, 102779. [Google Scholar] [CrossRef]
  21. Liu, B.; Li, Z.-C.; Wang, Y. A branch-and-price heuristic algorithm for the bunkering operation problem of a liquefied natural gas bunkering station in the inland waterways. Transp. Res. Part B 2023, 167, 145–170. [Google Scholar] [CrossRef]
  22. Yang, M.; Lam, J.S.L. Operational and economic evaluation of ammonia bunkering—Bunkering supply chain perspective. Transp. Res. Part D 2023, 117, 103666. [Google Scholar] [CrossRef]
  23. Tu, E.; Zhang, G.; Rachmawati, L.; Rajabally, E.; Huang, G.B. Exploiting AIS data for intelligent maritime navigation: A comprehensive survey from data to methodology. IEEE Trans. Intell. Transp. Syst. 2018, 19, 1559–1582. [Google Scholar] [CrossRef]
  24. Svanberg, M.; Santén, V.; Hörteborn, A.; Holm, H.; Finnsgård, C. AIS in maritime research. Mar. Policy 2019, 106, 103520. [Google Scholar] [CrossRef]
  25. Yang, D.; Wu, L.; Wang, S.; Jia, H.; Li, K.X. How big data enriches maritime research—A critical review of Automatic Identification System (AIS) data applications. Transp. Rev. 2019, 39, 755–773. [Google Scholar] [CrossRef]
  26. Mou, J.M.; Tak, C.V.D.; Ligteringen, H. Study on collision avoidance in busy waterways by using AIS data. Ocean Eng. 2010, 37, 483–490. [Google Scholar] [CrossRef]
  27. Dobrkovic, A.; Iacob, M.-E.; Van Hillegersberg, J. Maritime pattern extraction and route reconstruction from incomplete AIS data. Int. J. Data Sci. Anal. 2018, 5, 111–136. [Google Scholar] [CrossRef]
  28. Zhang, L.; Meng, Q.; Fwa, T.F. Big AIS data based spatial-temporal analyses of ship traffic in Singapore port waters. Transp. Res. Part E 2019, 129, 287–304. [Google Scholar] [CrossRef]
  29. Nguyen, D.; Simonin, M.; Hajduch, G.; Vadaine, R.; Tedeschi, C.; Fablet, R. Detection of Abnormal Vessel Behaviours from AIS data using GeoTrackNet: From the Laboratory to the Ocean. In Proceedings of the 21st IEEE International Conference on Mobile Data Management (MDM), Versailles, France, 30 June–3 July 2020; pp. 264–268. [Google Scholar] [CrossRef]
  30. Han, X.; Armenakis, C.; Jadidi, M. Modeling Vessel Behaviours by Clustering AIS Data Using Optimized DBSCAN. Sustainability 2021, 13, 8162. [Google Scholar] [CrossRef]
  31. Murray, B.; Perera, L.P. An AIS-based deep learning framework for regional ship behavior prediction. Reliab. Eng. Syst. Saf. 2021, 215, 107819. [Google Scholar] [CrossRef]
  32. Liu, L.; Shibasaki, R.; Zhang, Y.; Kosuge, N.; Zhang, M.; Hu, Y. Data-driven framework for extracting global maritime shipping networks by machine learning. Ocean Eng. 2023, 269, 113494. [Google Scholar] [CrossRef]
  33. Aarsnes, M. A Feasibility Study of Assessing Bunkering Operations through AIS Data. Master’s Thesis, Norwegian University of Science and Technology, Trondheim, Norway, 2018. Available online: https://ntnuopen.ntnu.no/ntnu-xmlui/handle/11250/2614960 (accessed on 4 August 2023).
  34. Fuentes, G. Generating bunkering statistics from AIS data: A machine learning approach. Transp. Res. Part E 2021, 155, 102495. [Google Scholar] [CrossRef]
  35. S&P Global. Market Intelligence Network (MINT). Available online: https://www.marketintelligencenetwork.com/ (accessed on 15 August 2023).
  36. Jia, H.; Prakash, V.; Smith, T. Estimating vessel payloads in bulk shipping using AIS data. Int. J. Ship. Trans. Log. 2019, 11, 25–240. [Google Scholar] [CrossRef]
  37. Shelmerdine, R.L. Teasing out the detail: How our understanding of marine AIS data can better inform industries, developments, and planning. Mar. Policy 2015, 54, 17–25. [Google Scholar] [CrossRef]
Figure 1. Target areas of this study.
Sustainability 15 16711 g001
Figure 2. Overview of bunkering operation extraction algorithm.
Sustainability 15 16711 g002
Figure 3. Anchored vessel and bunker barge rendezvous in bunkering position.
Sustainability 15 16711 g003
Figure 4. Estimated locations of refineries.
Sustainability 15 16711 g004
Figure 5. Estimated locations of bunker barge bases.
Sustainability 15 16711 g005
Figure 6. Estimated locations of bunkering operations.
Sustainability 15 16711 g006
Figure 7. Breakdown of the types of bunkered vessels.
Sustainability 15 16711 g007
Figure 8. Distribution of bunkering service time by vessel type and port area.
Sustainability 15 16711 g008
Figure 9. Distribution of LOA for bunkered vessels by vessel type and port area.
Sustainability 15 16711 g009
Figure 10. Relationship between bunker barges and bunkered vessels by port area.
Sustainability 15 16711 g010
Figure 11. Starting time of bunkering operations.
Sustainability 15 16711 g011
Figure 12. Service time distribution of quay and offshore bunkering of containerships.
Sustainability 15 16711 g012
Figure 13. Size distribution of quay and offshore bunkering of containerships in Singapore Port.
Sustainability 15 16711 g013
Figure 14. A trajectory of a bunker barge that had not anchored at refineries from 1 February to 30 April 2021.
Sustainability 15 16711 g014
Figure 15. Trajectories of the FSO tankers.
Sustainability 15 16711 g015
Table 1. The number of vessels and bunker barges navigating each area.
AreaNumber of VesselsNumber of Bunker Barges
Tokyo Bay285722
Busan Port331029
Singapore Port9569337
Table 2. Number of bunkering operations detected by MINT and our method.
AreaThis MethodMINT
Tokyo187182
Busan468207
Singapore838518,496
Table 3. Median bunkering service hours and LOA for three major vessel types.
AreaTankerContainershipBulk Carrier
Service Time (h)LOA (m)Service Time (h)LOA (m)Service Time (h)LOA (m)
Tokyo2.30651.082111.37225
Busan2.201132.081723.35200
Singapore2.681844.022232.43225
Table 4. Number of bunkering operations and service hours by vessels’ DWT class.
DWT Range of Bunkered VesselsTokyoBusanSingapore
nService Time (h)nService Time (h)nService Time (h)
Ave.Med.Ave.Med.Ave.Med.
0–10,0001017.242.321479.782.556224.612.18
10,000–20,000132.172.021023.632.019803.532.21
20,000–40,000151.721.40524.632.8411703.362.59
40,000–65,000173.862.33458.194.0219553.292.60
65,000–120,000131.421.22915.072.9019964.003.08
120,000–200,00030.891.00223.533.567944.493.32
200,000–300,000141.731.5932.942.074086.983.76
300,000–450,0000000004267.904.31
Table 5. Number of bunkering operations for fully cellular containerships by location.
LocationTokyoBusanSingapore
At quay8202875
Offshore06229
Table 6. Bunkering operations by refueling history at refineries.
AreaBunker Barges That Had Anchored at Refineries during the Survey Period (3 Months)Bunker Barges That Had Not Anchored at Refineries during the Survey Period (3 Months)
Number of BargesNumber of OperationsNumber of BargesNumber of Operations
Tokyo1818047
Busan2746721
Singapore2477194901191
Table 7. FSO tankers that rendezvoused with bunker barges more than ten times.
IMOLOA (m)DWTNumbers Matched
9102265340300,36185
9196618332.95298,64122
9116400330.26299,99916
9158886330.25299,88512
9133850340300,95511
Disclaimer/Publisher’s Note: The statements, opinions and data contained in all publications are solely those of the individual author(s) and contributor(s) and not of MDPI and/or the editor(s). MDPI and/or the editor(s) disclaim responsibility for any injury to people or property resulting from any ideas, methods, instructions or products referred to in the content.

