
Spatiotemporal Evolution and the Influencing Factors of China’s High-Tech Industry GDP Using a Geographical Detector


Abstract
:1. Introduction
- Comprehensive Assessment Indices of High-Tech Industries: There is no unified standard system for evaluating high-tech industries. Early studies like Rogers provided preliminary frameworks. He W. [7] emphasized the necessity of a comprehensive assessment of high-tech zones using factor analysis. Tang R. [8] established a comprehensive evaluation system for provincial high-tech industries from the dimensions of input, output, and development potential. Later, scholars refined the evaluation of high-tech industries. For instance, Fang Y. [9] constructed an evaluation system for the innovation capabilities of high-tech zones, and Dai Z. [10] analyzed the factors affecting the technological innovation capacity of high-tech industries.
- Spatial Development Analysis of High-Tech Industries: Spatial analysis plays a significant role in high-tech industry research. Scholars have compared the spatial patterns of high-tech industries across different regions of China [11,12] and explored the driving factors and growth processes of high-tech industries [13,14,15,16]. Yu Y. [16] used spatial lag and spatial error models to reveal the significant impacts of different factors on innovation outputs. Wu Y. [17] applied GIS and exploratory spatial analysis methods to analyze the spatial differences and dynamic imbalances in China’s regional scientific and technological layouts. Wang X. [18] discovered the characteristics of innovation capacity enhancement from the southeast coast to central and southwestern regions via spatial autocorrelation analysis from 2010 to 2023. Tu W. [19] used data envelopment analysis (DEA) and spatial econometric models to measure the innovation efficiency of high-tech enterprises in China and their influencing factors.
- Regional Economics: Regional economics also plays a critical role in high-tech industry research. Chen H. [20] explored the impact mechanisms of geographical and cognitive proximity on innovation in high-tech zones, finding an “S-shaped” variation in geographical proximity’s impact on innovation performance. Li L. [21] and others, using the DEA-Malmquist model and ESDA analysis methods, empirically analyzed the spatiotemporal evolution and inter-provincial differences in the development of China’s high-tech industries. They highlighted the importance of policies, infrastructure, and agglomeration effects in regional high-tech industry development.
- Sustainable Development of High-Tech Industries: Yang Q. [22] used the Delphi method to predict and quantify the sustainable development index of high-tech industries, analyzing the relationship between the index and the current development level of high-tech industries. Liu L. [23], using a grey dynamic evaluation model, evaluated China’s high-tech industry’s sustainable development capability, finding a high correlation between development level and high-tech industry. Xu J. [24] established a system dynamics model for sustainable development in high-tech zones, offering policy suggestions for the sustainable development of high-tech industries in Shenzhen.
- In addition to these areas, the research methods used in this article, i.e., spatial autocorrelation and geographical detectors, have also played a key role in industrial economics. Spatial autocorrelation and geographical detectors, as two spatial models, are often used together, covering a wide range of research fields, such as population aging, tourism geography, agricultural modernization, and soil heavy metal pollution [25,26,27,28]. Researchers first use spatial autocorrelation to assess whether the distribution of spatial variables exhibits clustering characteristics and then apply geographical detectors to examine the spatial differentiation of geographical phenomena and unveil the underlying driving forces. The combined use of these two approaches provides a powerful analytical framework for interpreting and understanding complex spatial phenomena, holding significant value in advancing spatial science research.
2. Data and Methods
2.1. Data Sources
- (1)
- China Torch Statistical Yearbook:
- (2)
- National Statistical Yearbook [34]:
- (3)
- The data used in this paper do not include data from Hong Kong, Macao, and Taiwan.
2.2. Research Methods
- (1)
- Spatial Autocorrelation: Spatial autocorrelation is bifurcated into global and local autocorrelation. Global autocorrelation acts as an indicator to discern the spatial distribution traits of a particular element or phenomenon throughout the designated research area [35,36]. The computation formula is as follows:
2.3. Geodetector
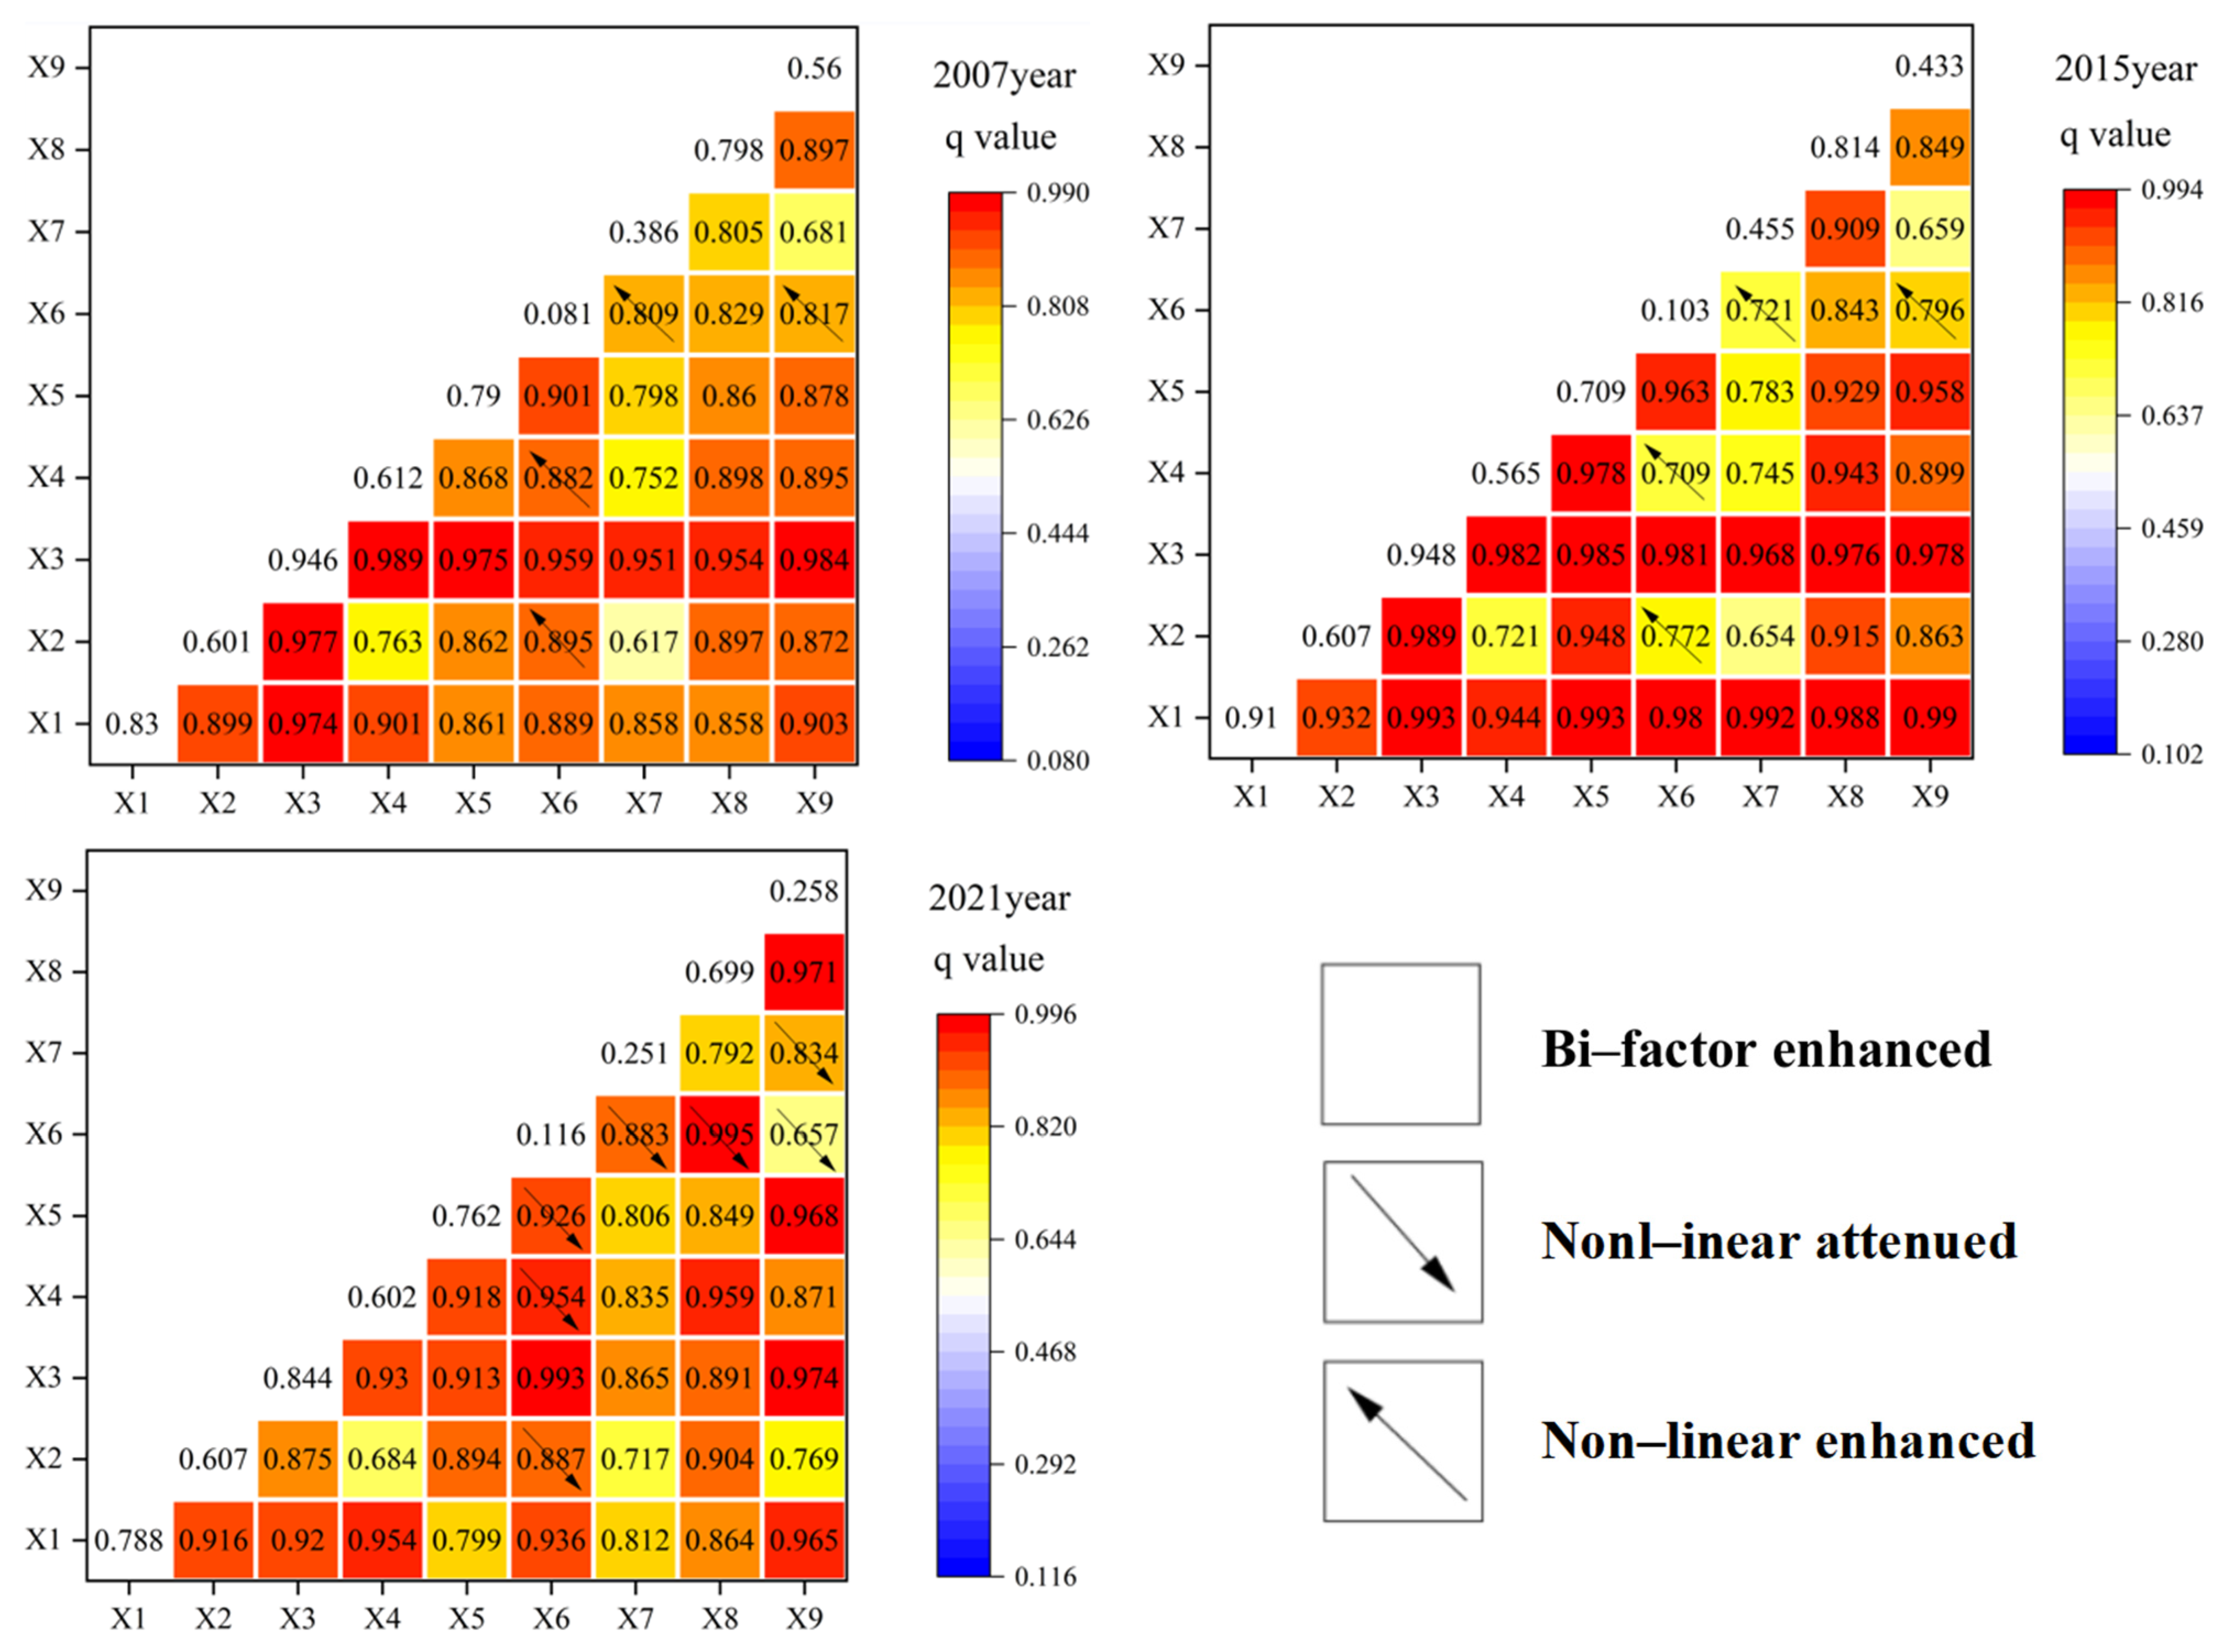
- Non-linear reduction: , the interaction between factors and , results in a non-linear reduction. In other words, their combined effect is less than the sum of their individual effects.
- Single-factor non-linear reduction: . One factor experiences a non-linear reduction in its influence, positively affecting the weaker factor but negatively impacting the stronger one.
- Bi-factor enhancement: . The interaction between two factors enhances both, where the combined effect on the dependent variable is stronger than the individual explanatory power of each factor.
- Independent: . Factors and are independent of each other, indicating no interaction or influence between them.
- Non-linear enhancement: . The interaction between factors and leads to a non-linear enhancement, where their combined explanatory power is greater than the simple sum of their individual powers.

| Index | Type | Driving Factor |
|---|---|---|
| R&D Internal Expenditure | Innovation | |
| Industry Agglomeration | ||
| Practitioner | ||
| Number of Integrated Enterprises | ||
| Total Investment in Fixed Assets | economic development | |
| Foreign Investment Operating Revenue | ||
| Road Density | ||
| Foreign Investment | ||
| Per Capita GDP | infrastructure |
| Interaction Type | q Value Relationship |
|---|---|
| Non-linear reduction | |
| Single-factor non-linear reduction | |
| Bi-factor enhancement | |
| Independent | |
| Non-linear enhancement |
3. Time Series Analysis
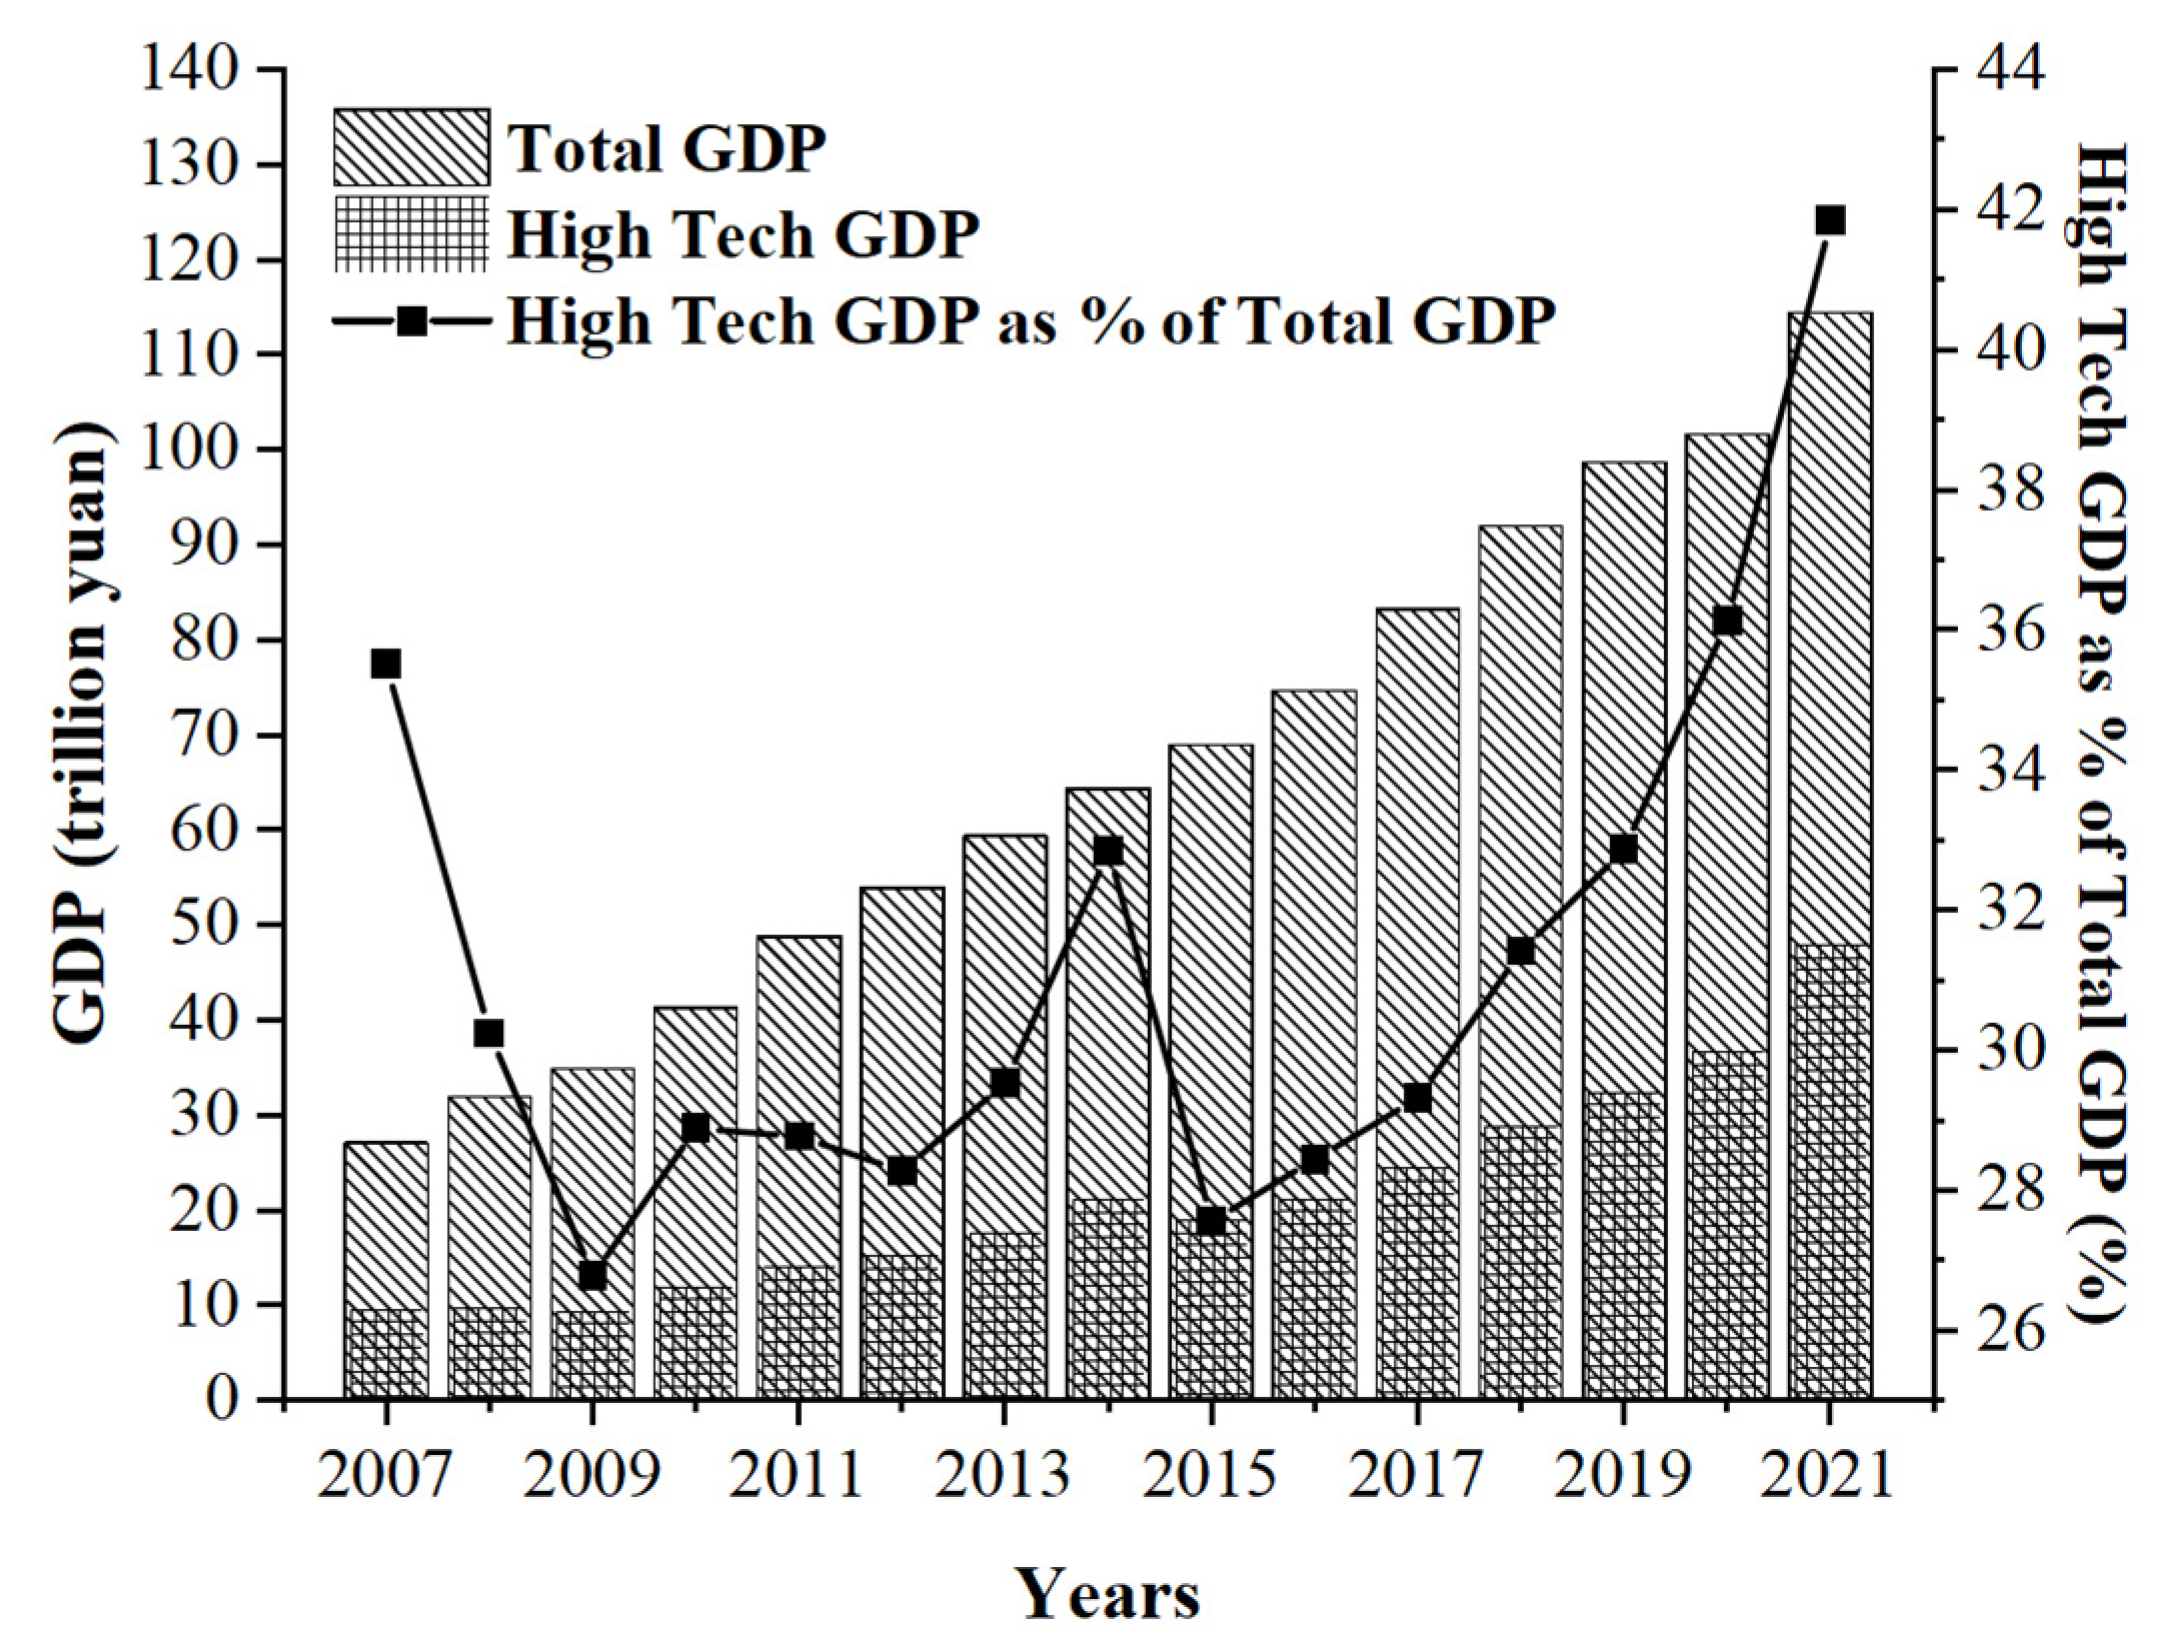
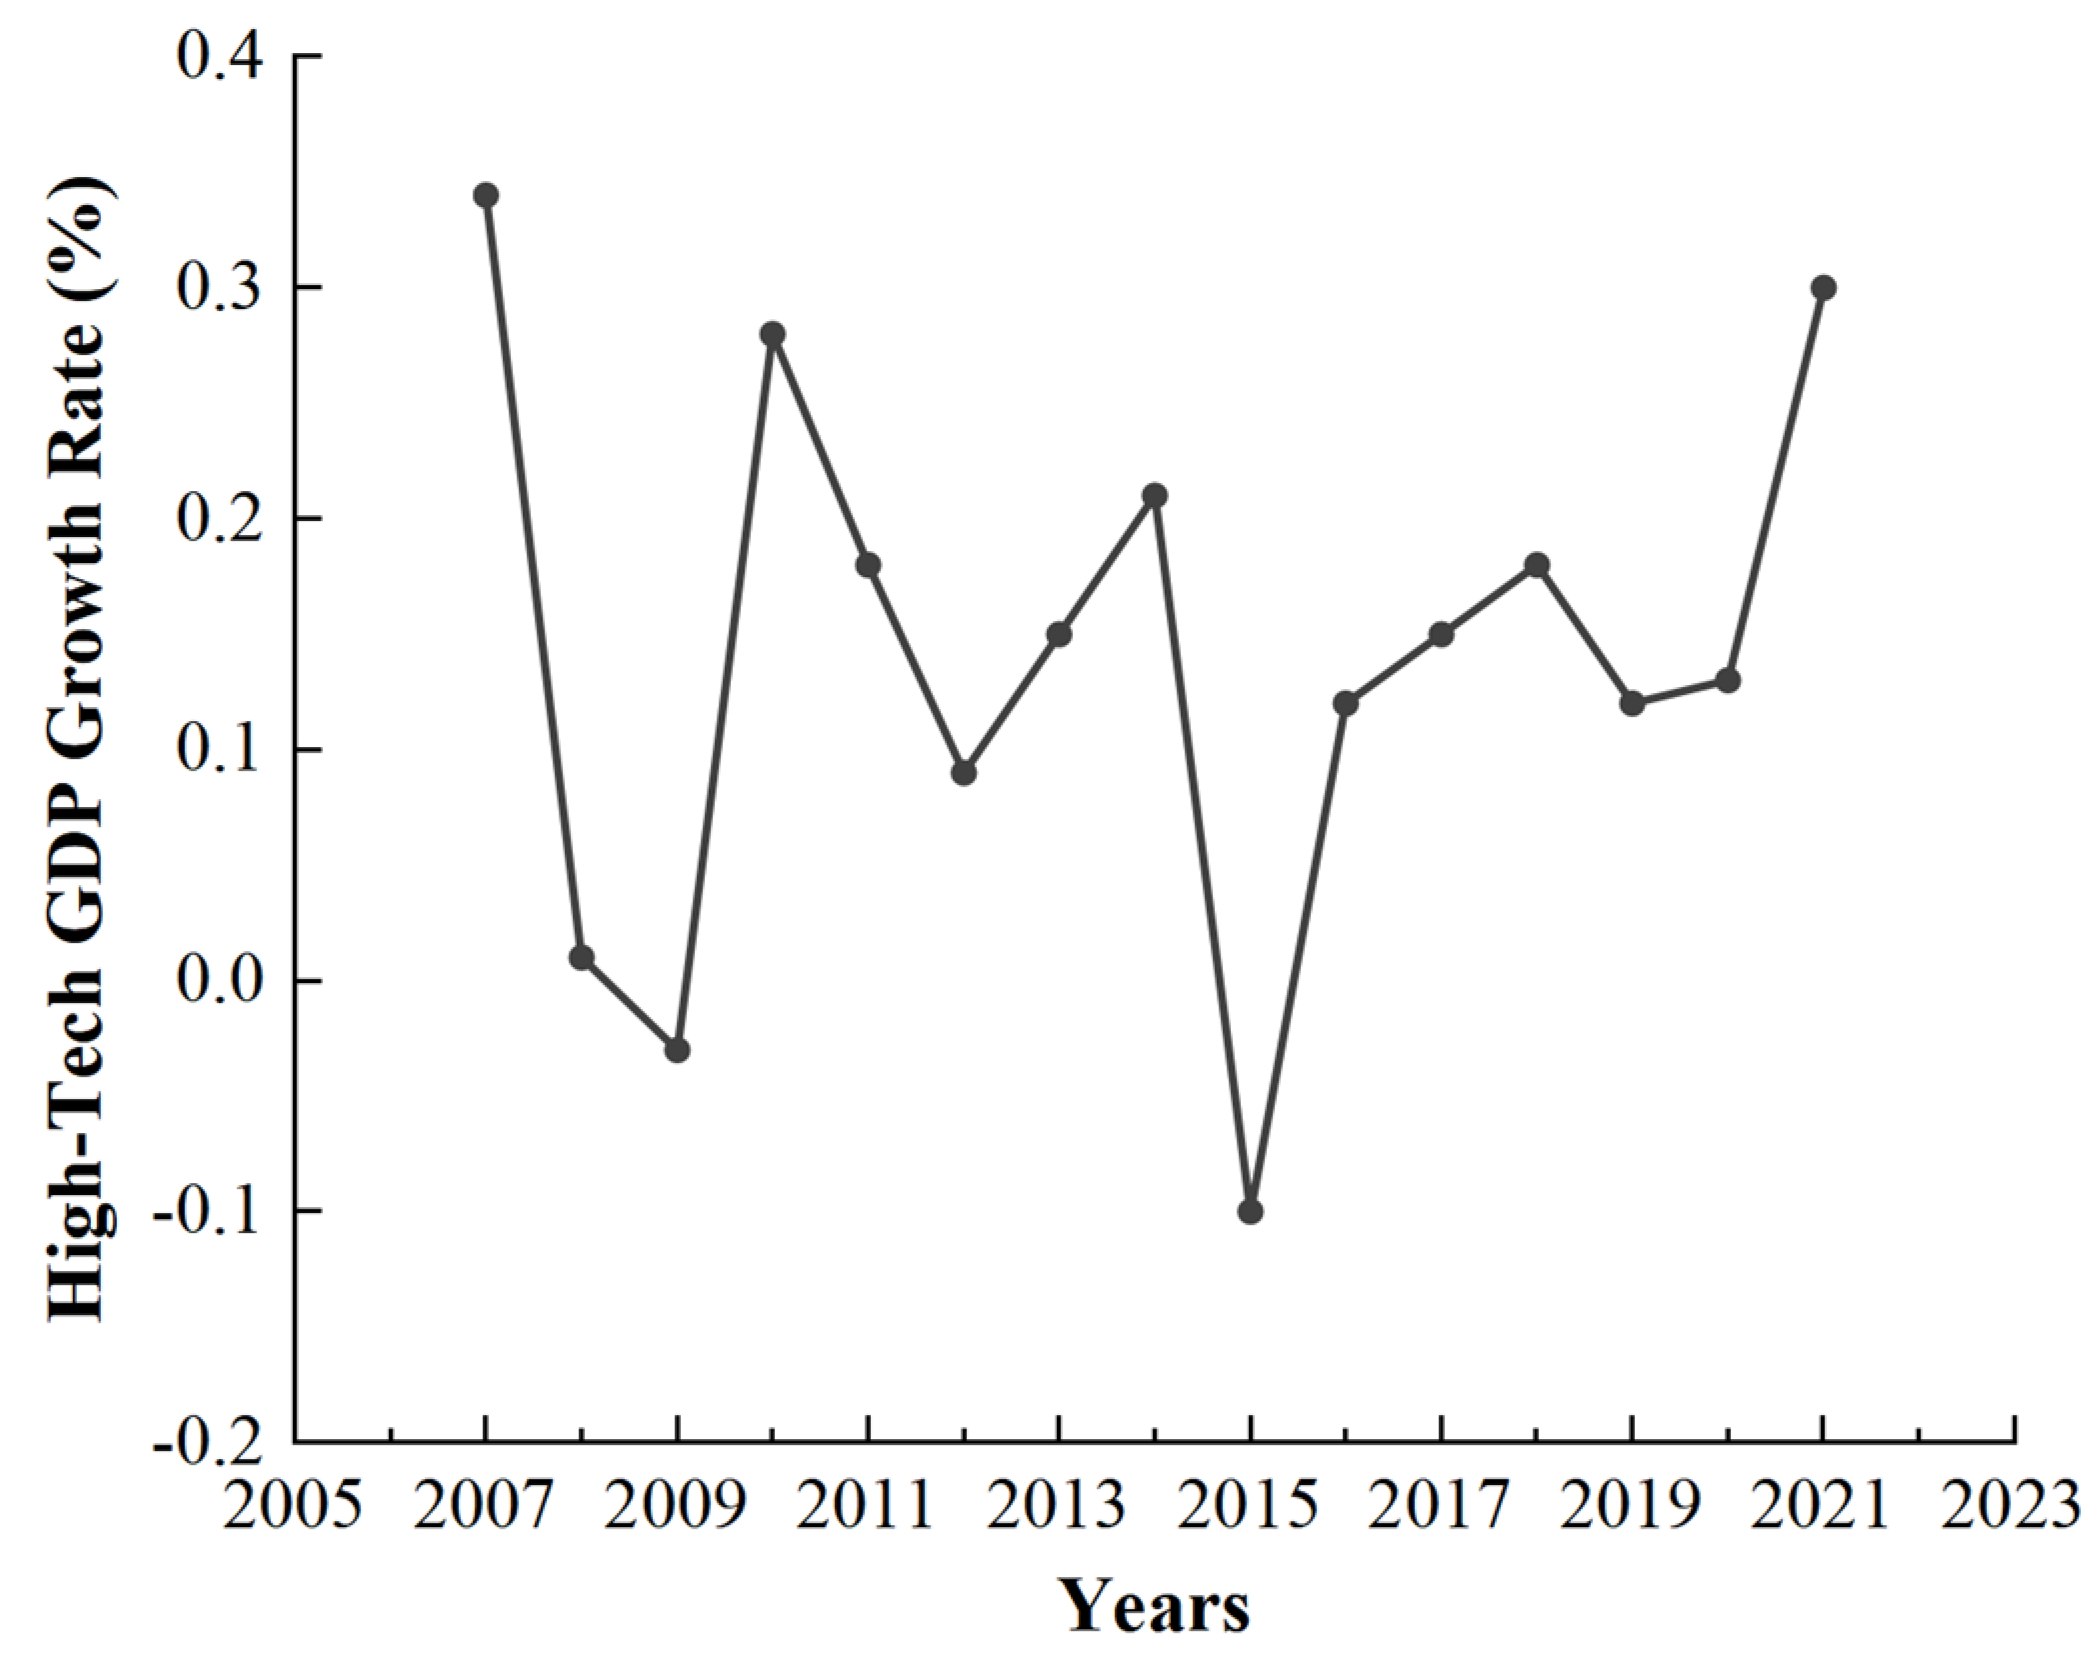
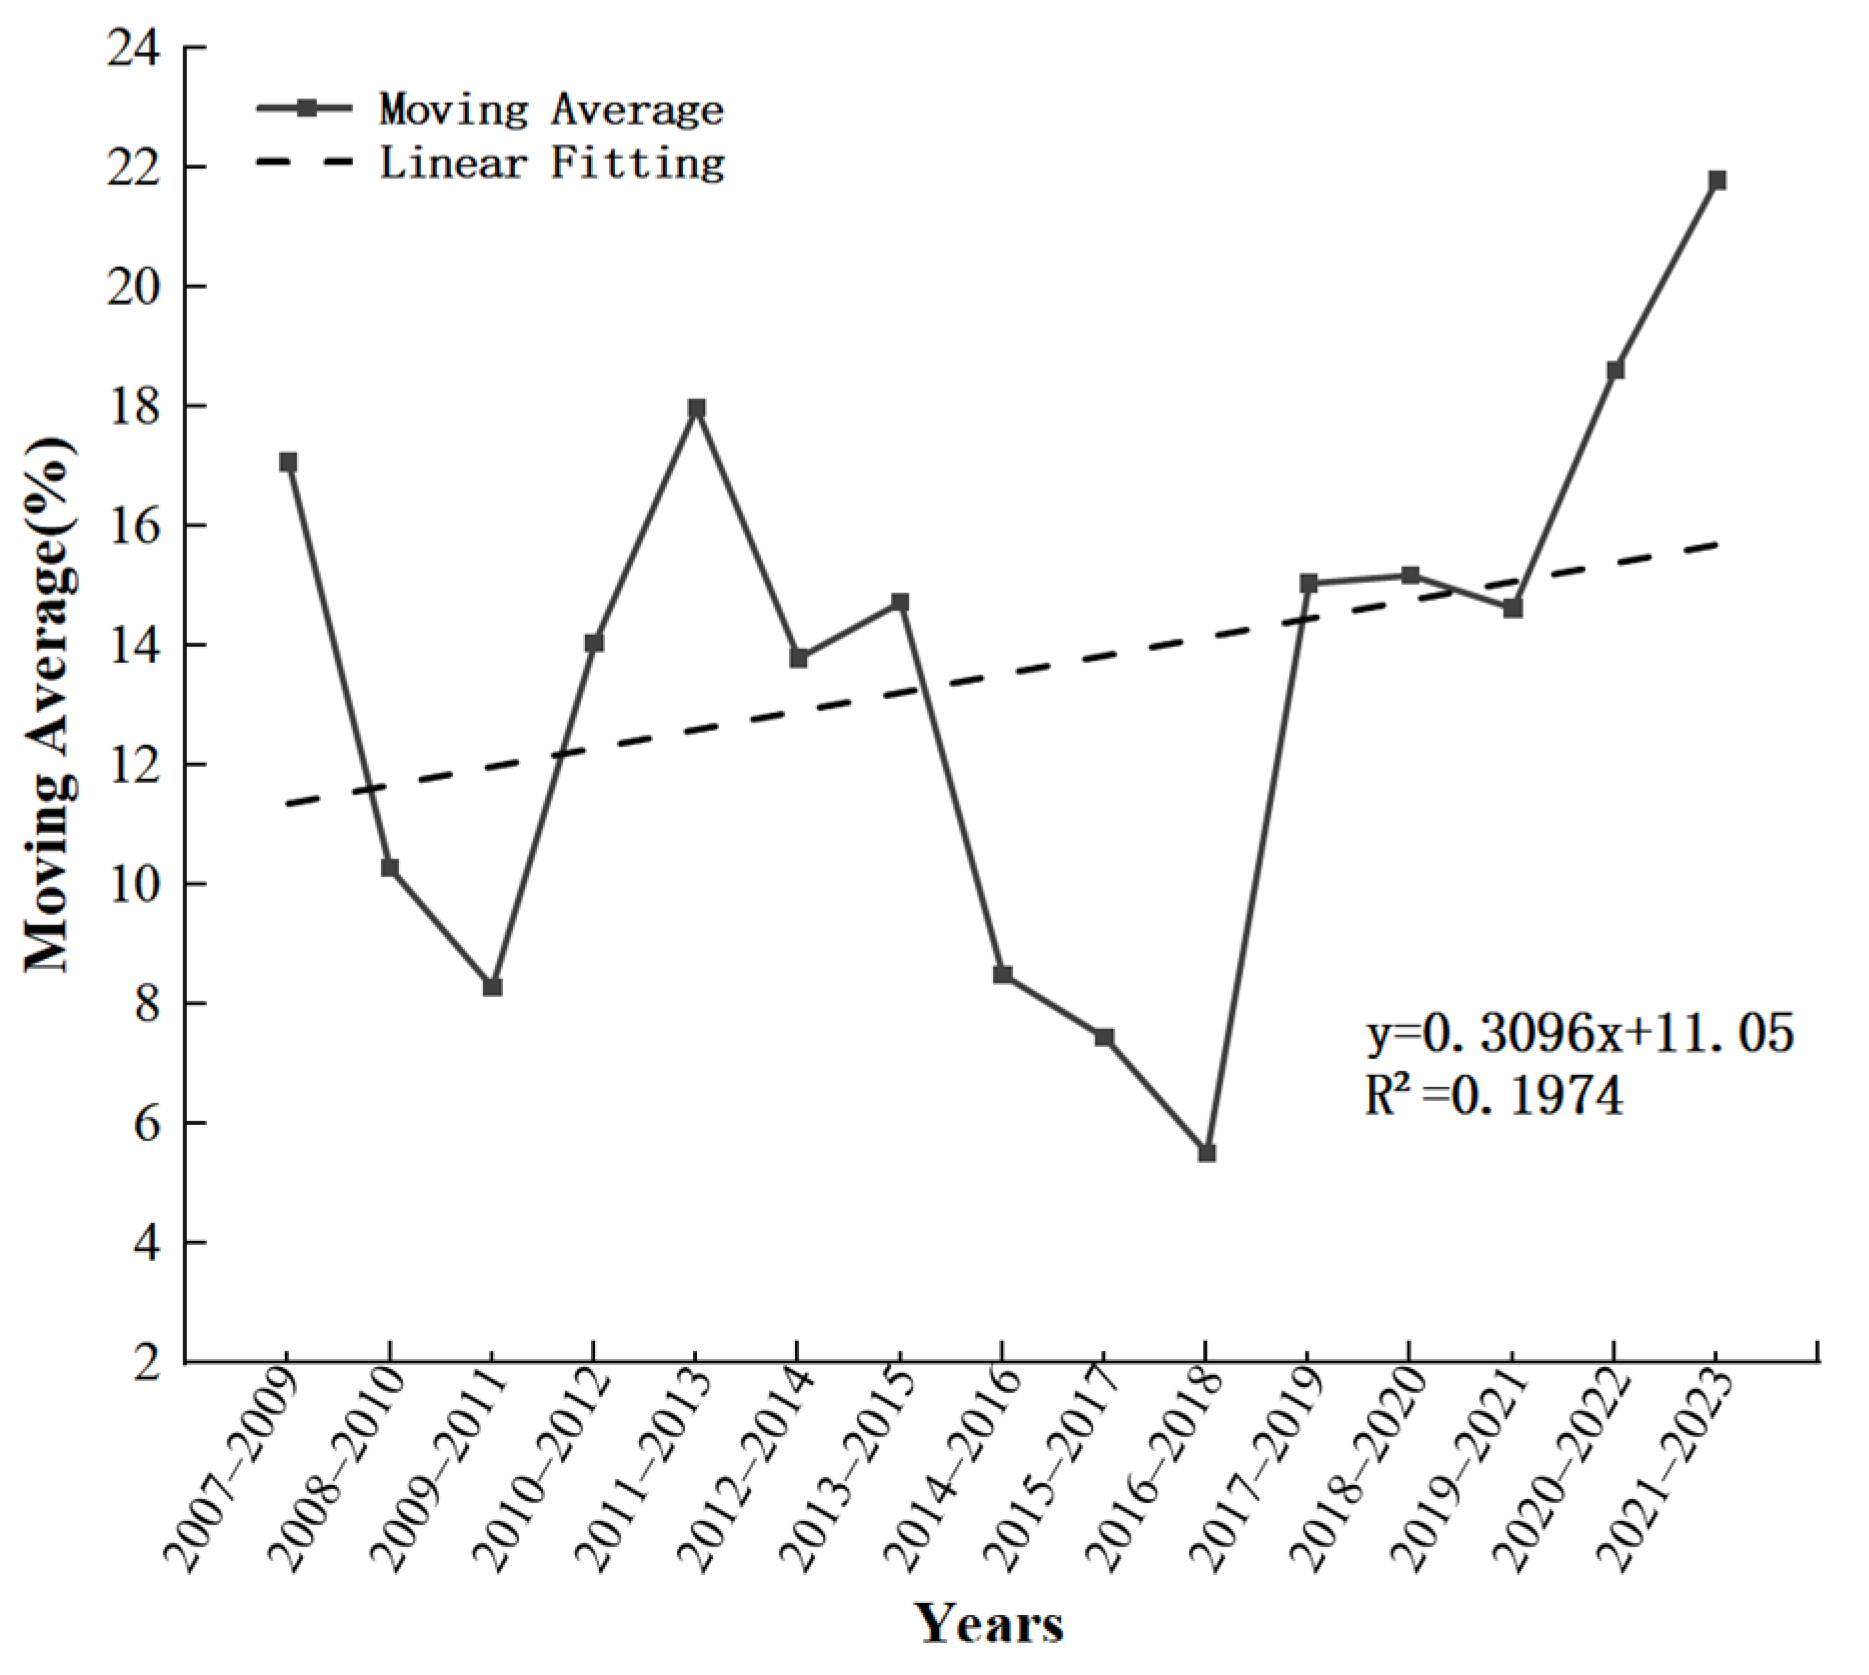
3.1. Rapid Growth of High-Tech Industry with Significant Fluctuations
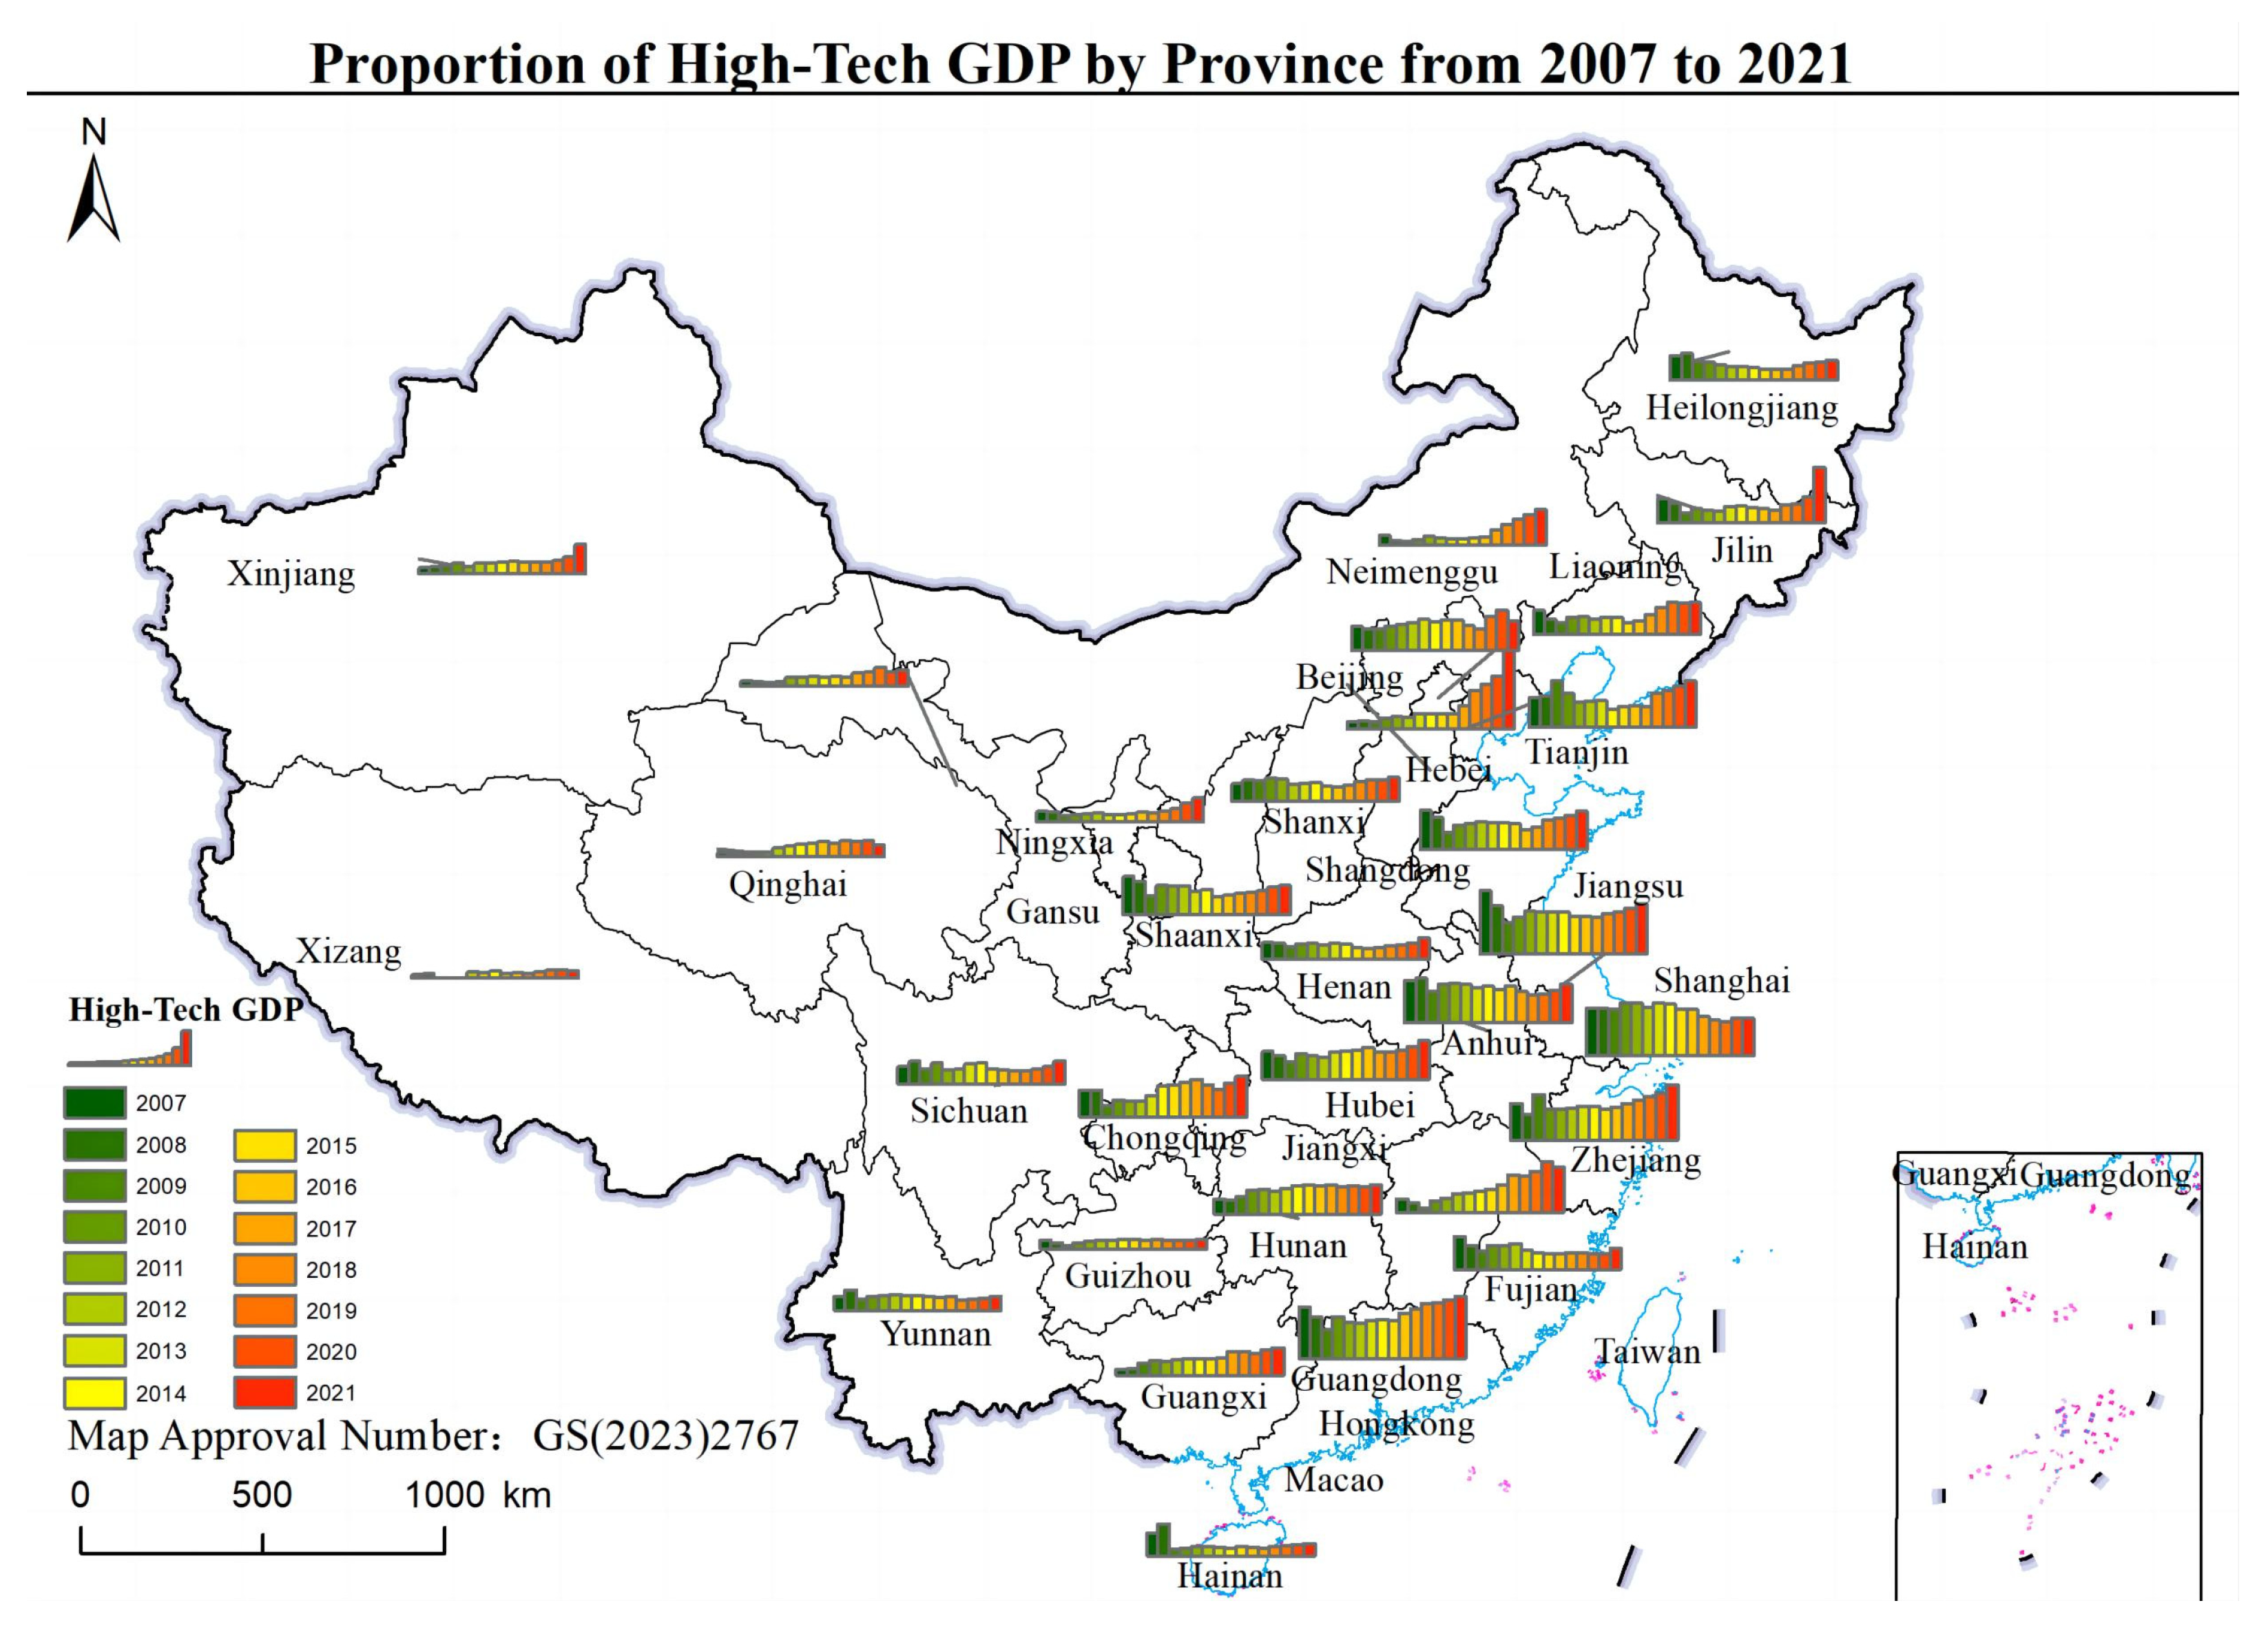
3.2. Provincial High-Tech Industries’ Share of National GDP Increases Annually
- (1)
- General upward trend: This likely reflects the significant outcomes of China’s active efforts in promoting high-tech industry development and implementing its technological innovation strategies.
- (2)
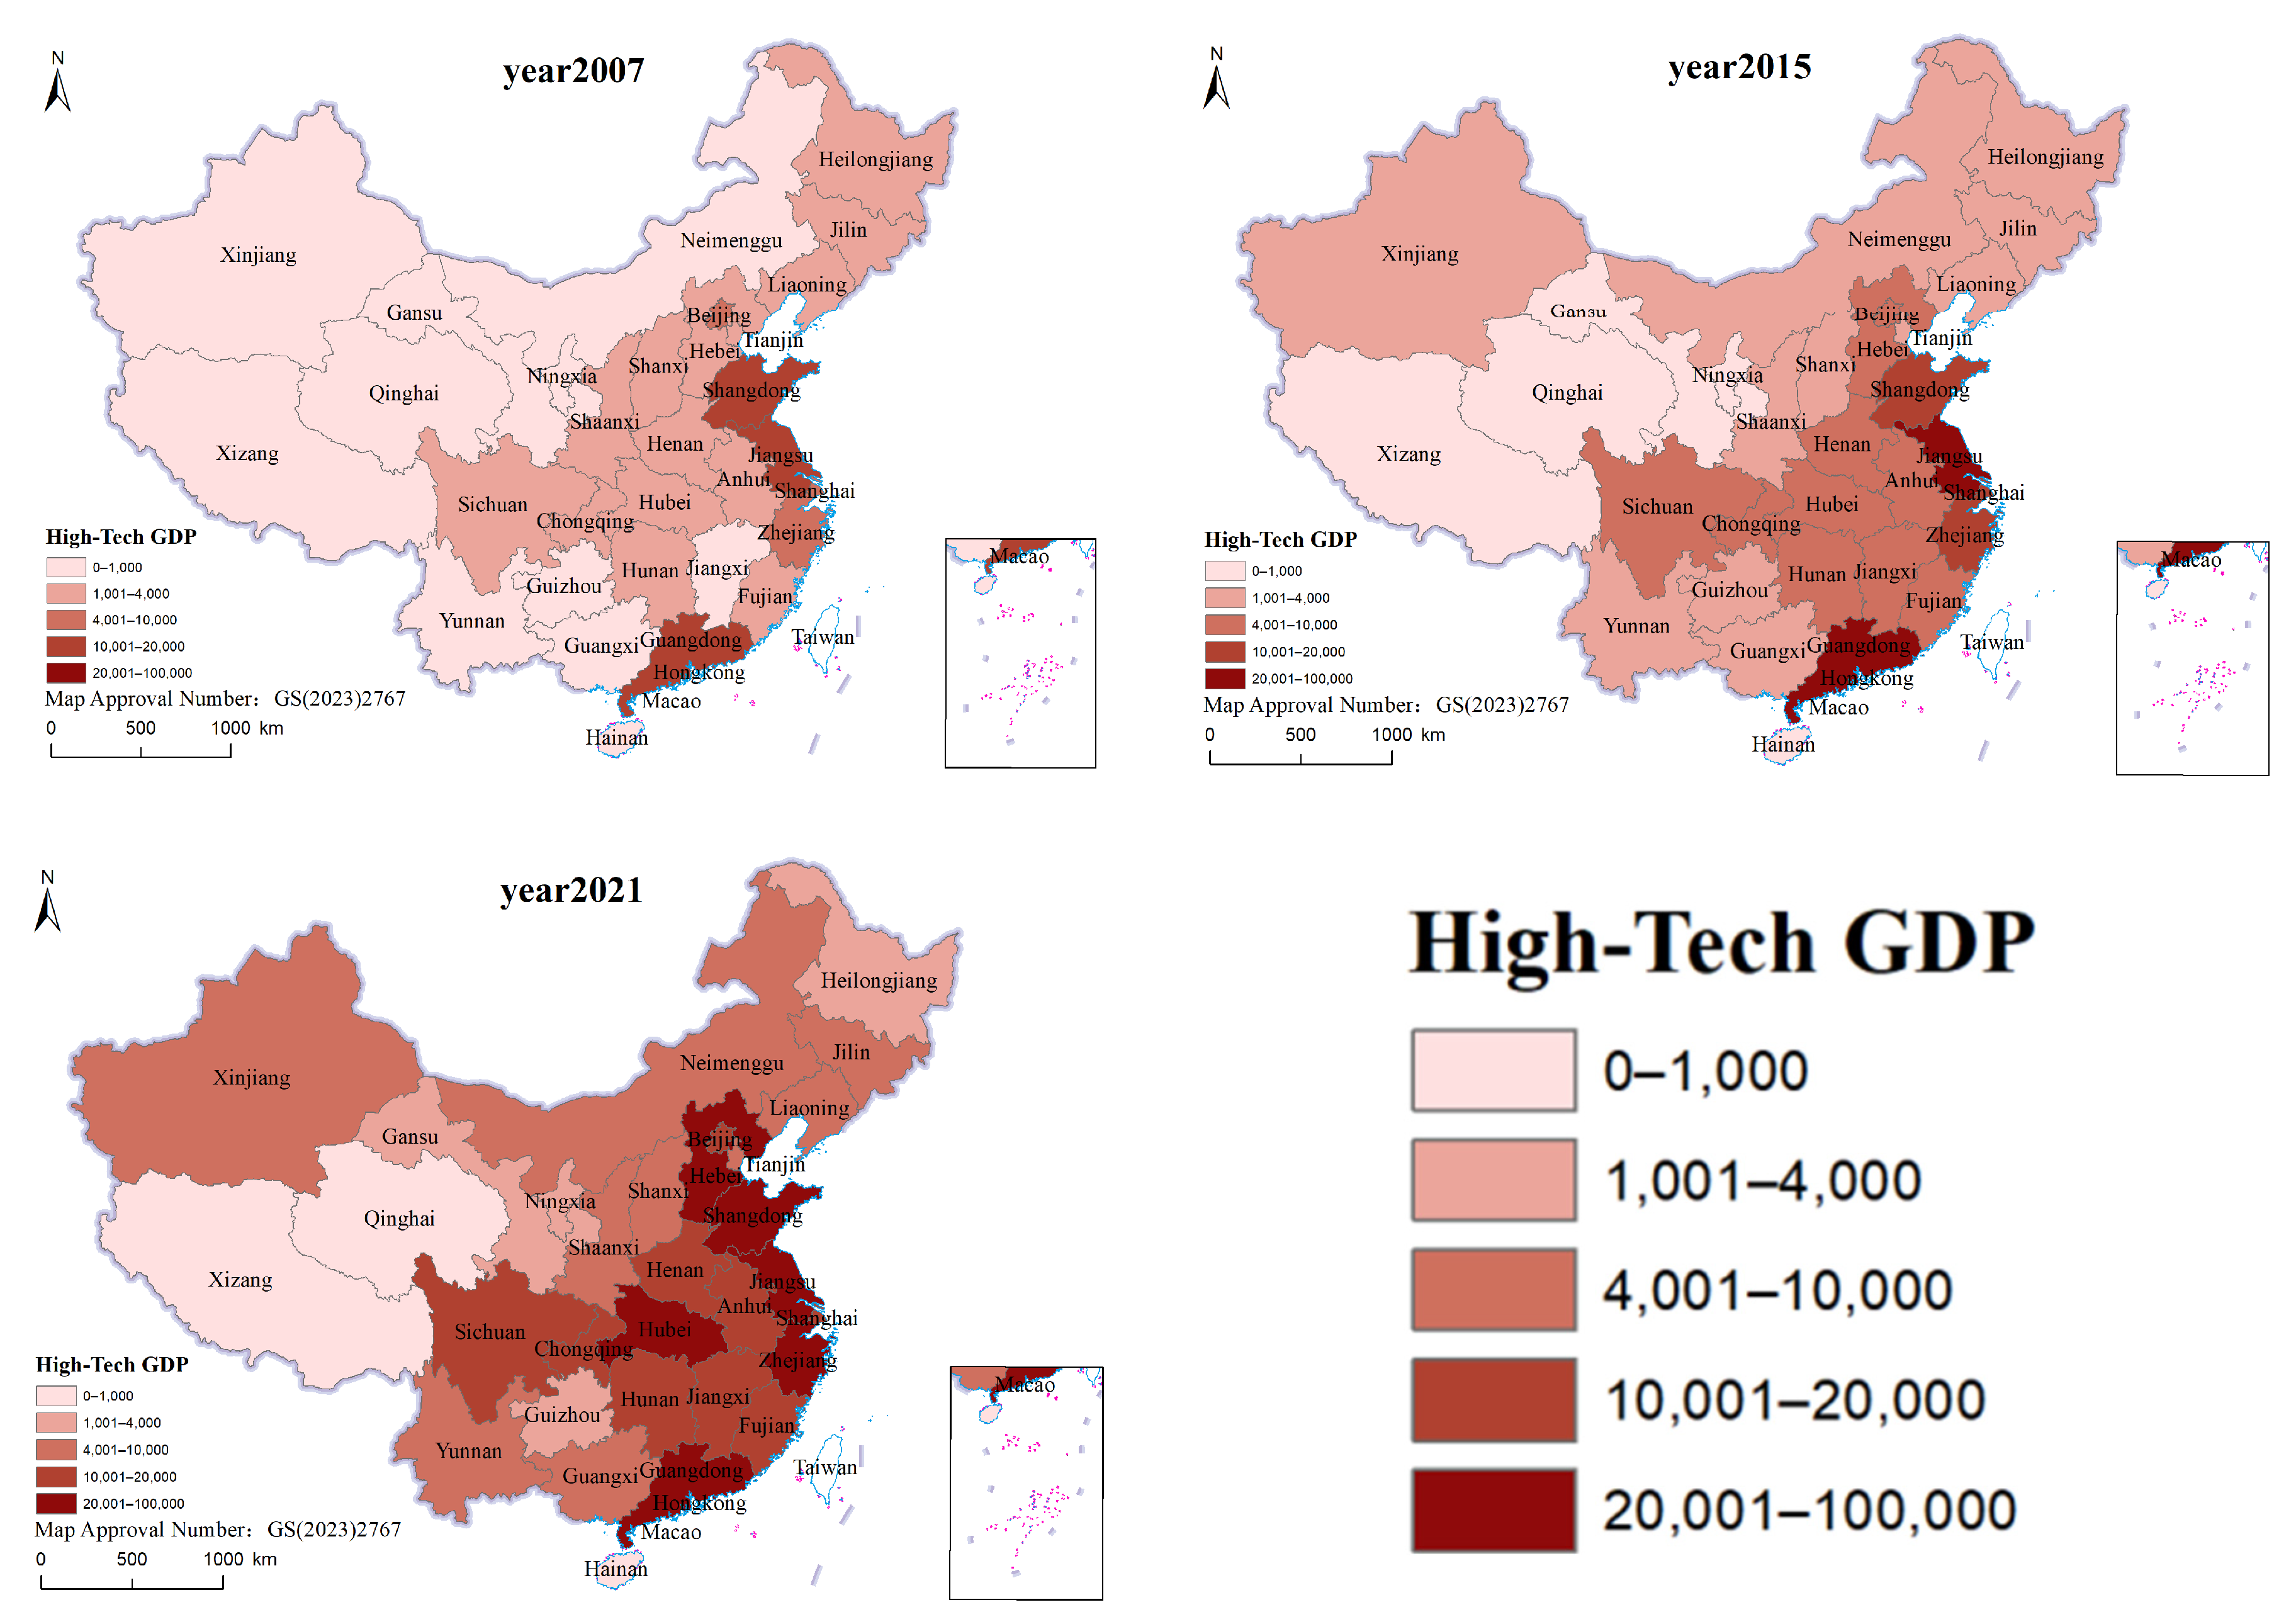
- Significant variations in growth speed and level among regions: To understand this phenomenon in depth, it can be examined from the perspectives of three major areas: the eastern, central, and western regions.
- Eastern Region: Comprises provinces like Zhejiang, Jiangsu, Fujian, Guangdong, Hainan, and Shandong and cities like Beijing, Shanghai, and Tianjin. Notably, Zhejiang and Jiangsu’s high-tech GDP proportions have steadily increased over the past 15 years. Shanghai and Jiangsu particularly experienced significant growth. Guangdong’s proportion showed minor fluctuations between 2012 and 2017 but predominantly trended upwards. In contrast, Fujian saw an uptick from 2007 to 2012 but a decline over the subsequent decade. Overall, with its advanced economic foundation and vast technological resources, the eastern region has consistently led in high-tech industry development.
- Central Region: Mainly includes provinces like Henan, Hubei, Hunan, and Anhui. These provinces generally witnessed an increase in their high-tech GDP proportions from 2007 to 2012. Over the subsequent decade, Hunan and Hubei largely maintained stable proportions, Henan’s increased, and Anhui’s remained stable from 2012 to 2017 and ascended from 2017 to 2020. Despite the central region trailing the eastern region in economic advancements, the growth momentum of its high-tech industry has been steadily strengthening.
- Western Region: Constituted by provinces such as Inner Mongolia, Ningxia, Qinghai, Gansu, and Xinjiang. These provinces maintained stable high-tech GDP proportions from 2007 to 2012. Between 2012 and 2017, Inner Mongolia and Gansu observed a rise, which stabilized from 2017 to 2020. In contrast, Ningxia, Qinghai, and Xinjiang maintained stability from 2007 to 2012 but saw consistent growth in the subsequent decade. Though the western region started its economic endeavors later than the eastern and central regions, under the “Western Development Strategy”, its high-tech industry’s proportion has been steadily increasing.
4. Spatial Pattern Analysis
4.1. Overall Growth with a Predominance in the East and South
4.2. Spatial Autocorrelation Shows Significance, but Correlation Is Decreasing
- (1)
- Global Autocorrelation:
- From 2007 to 2009, the Moran index rose from 0.169 to 0.293, indicating that the spatial relationship between the high-tech GDP of various regions became closer during this period.
- From 2010 to 2016, the Moran index decreased from 0.172 to 0.163, a change of only 0.009, indicating little change in the spatial relationship among regions and a more stable spatial distribution.
| Variables | I | E(I) | sd(I) | z | p Value |
|---|---|---|---|---|---|
| 2007 | 0.169 | −0.033 | 0.107 | 1.889 | 0.029 |
| 2008 | 0.178 | −0.033 | 0.109 | 1.949 | 0.026 |
| 2009 | 0.293 | −0.033 | 0.113 | 2.880 | 0.002 |
| 2010 | 0.172 | −0.033 | 0.108 | 1.905 | 0.028 |
| 2011 | 0.270 | −0.033 | 0.110 | 2.767 | 0.003 |
| 2012 | 0.288 | −0.033 | 0.110 | 2.918 | 0.002 |
| 2013 | 0.244 | −0.033 | 0.110 | 2.519 | 0.006 |
| 2014 | 0.228 | −0.033 | 0.110 | 2.370 | 0.009 |
| 2015 | 0.216 | −0.033 | 0.109 | 2.282 | 0.011 |
| 2016 | 0.163 | −0.033 | 0.105 | 1.874 | 0.030 |
| 2017 | 0.117 | −0.033 | 0.102 | 1.480 | 0.069 |
| 2018 | 0.083 | −0.033 | 0.100 | 1.159 | 0.123 |
| 2019 | 0.075 | −0.033 | 0.102 | 1.067 | 0.143 |
| 2020 | 0.081 | −0.033 | 0.104 | 1.098 | 0.136 |
| 2021 | 0.055 | −0.033 | 0.107 | 0.823 | 0.205 |
- (2)
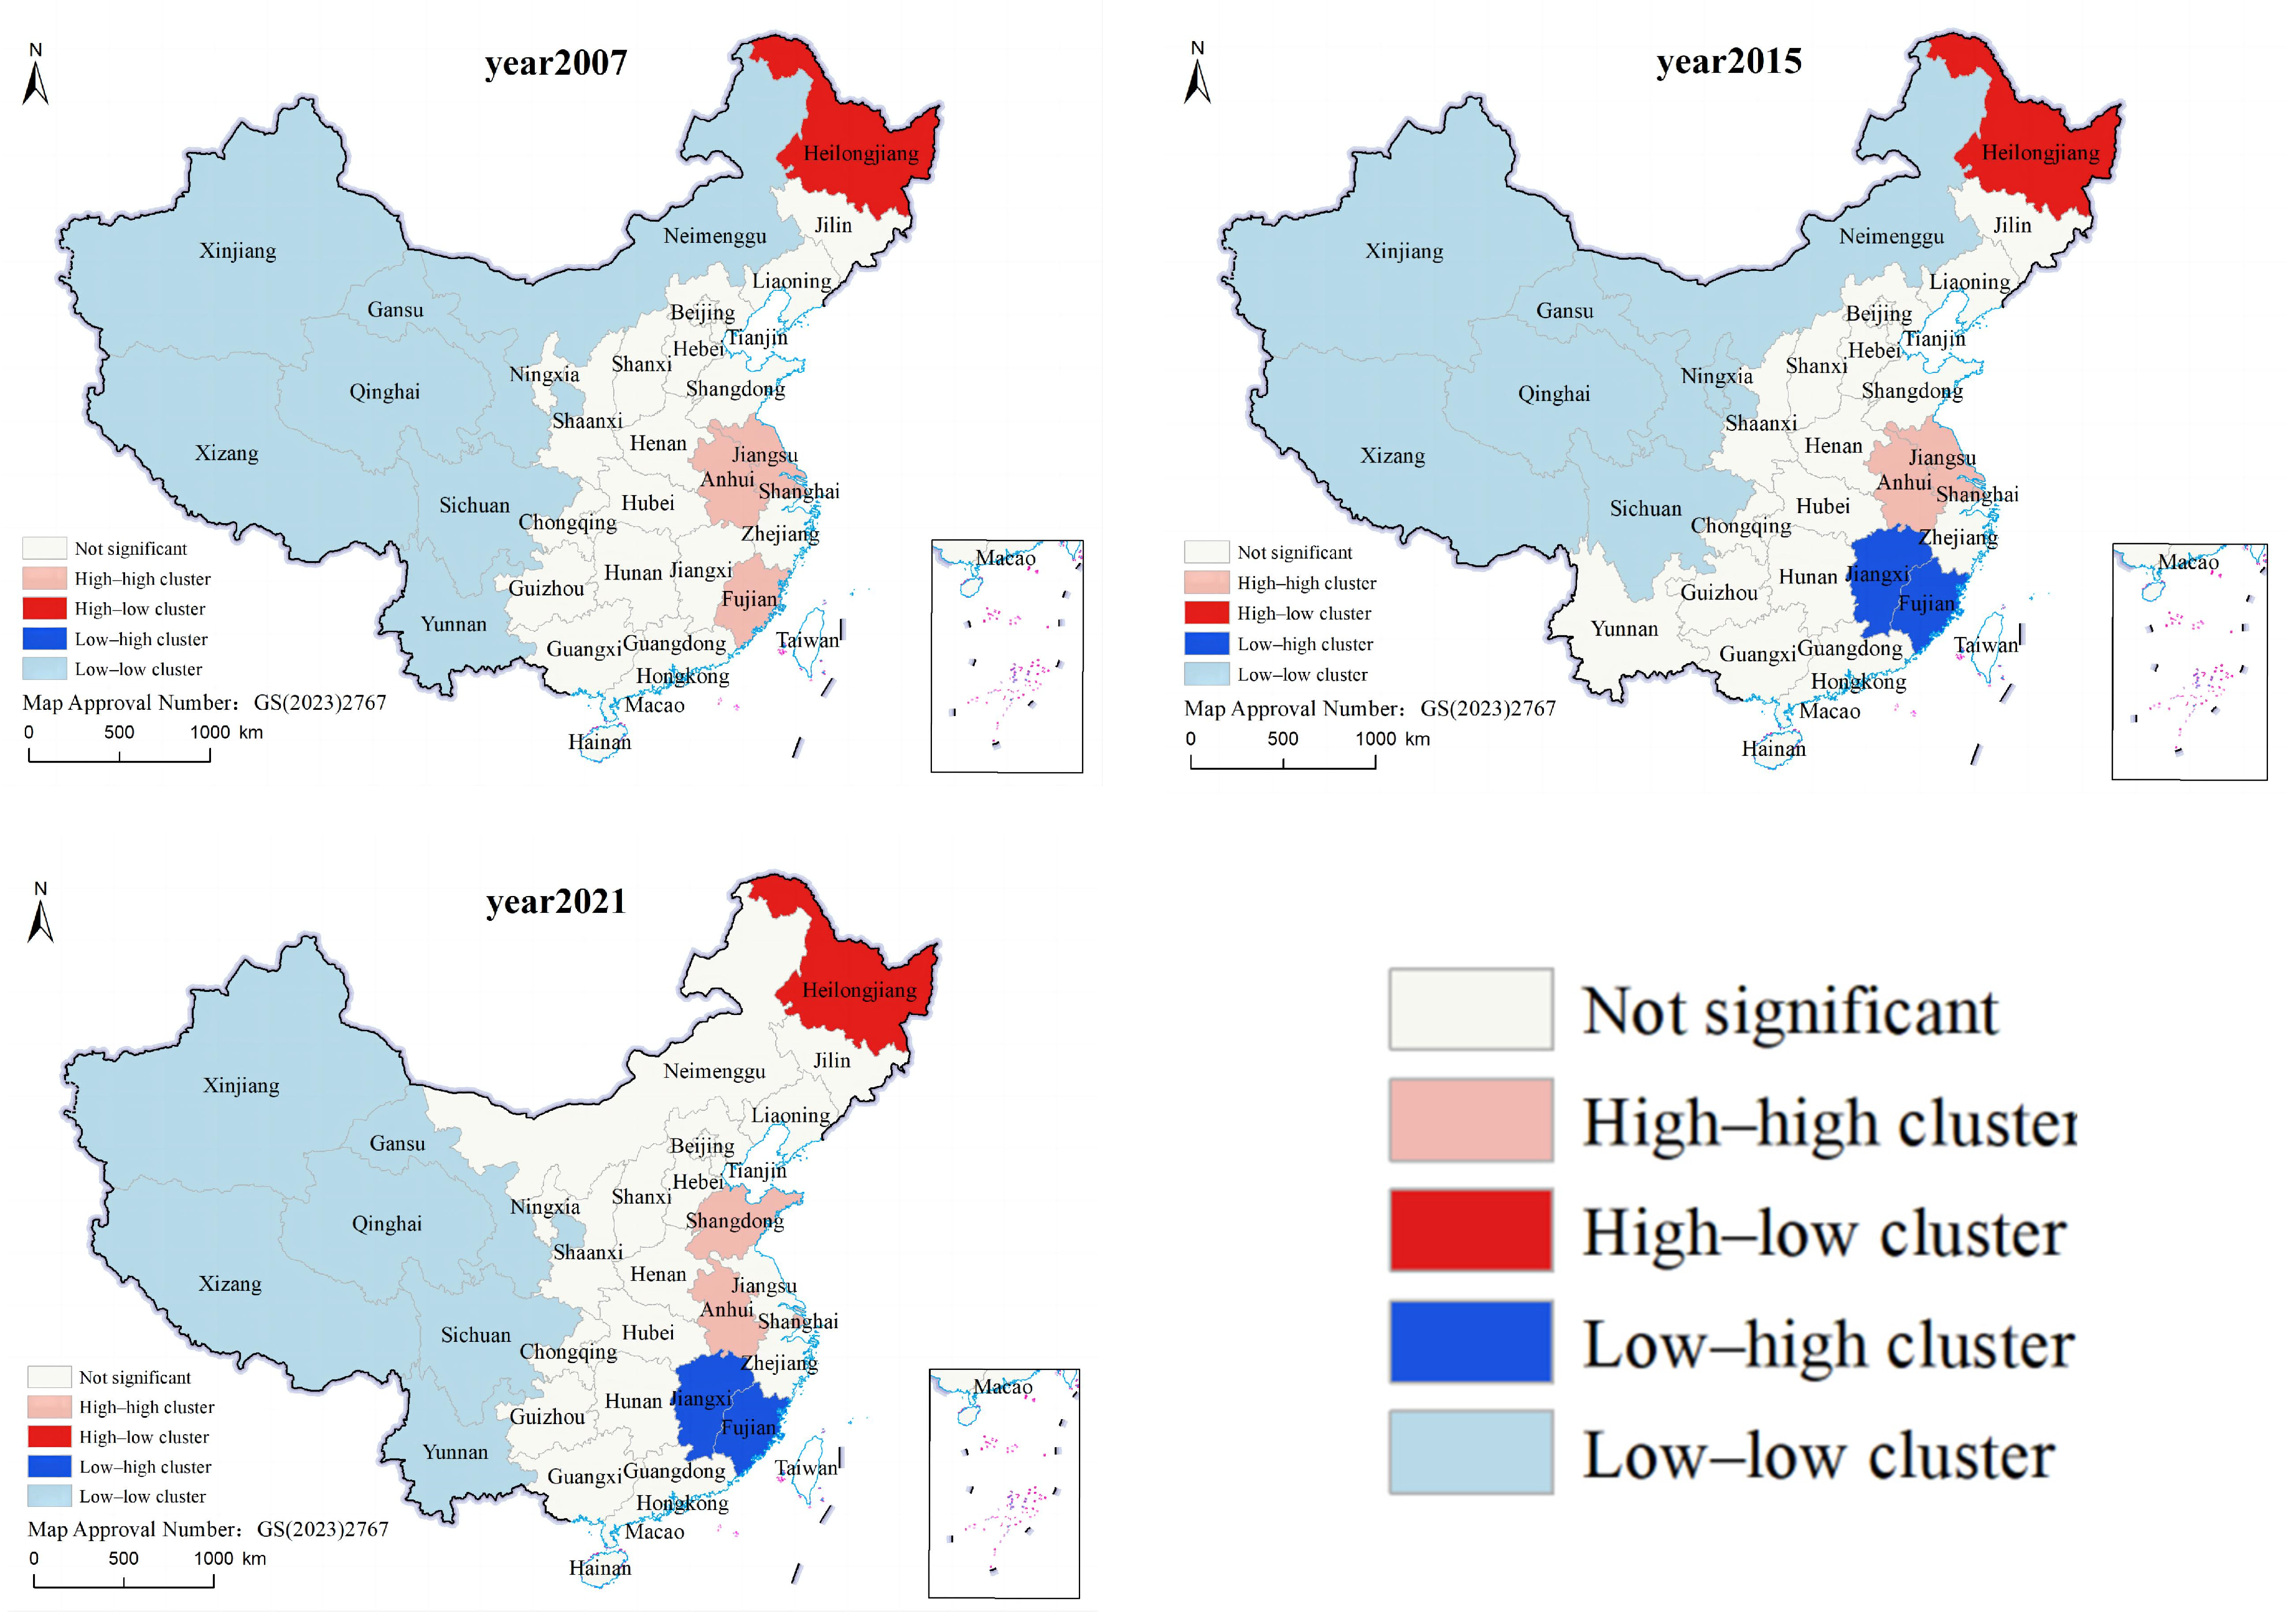
- Local Autocorrelation:
- From 2007 to 2016, the “high-high” areas, where the GDP of high-tech industries is high and the inter-regional correlation is strong, were mainly concentrated in coastal areas such as Jiangsu, Anhui, Zhejiang, and Shanghai. These results are consistent with Moran’s index during the same period, showing strong spatial autocorrelation. Meanwhile, the “low-low” areas, where the GDP of high-tech industries is low and the inter-regional correlation is also strong, were primarily located in western regions such as Inner Mongolia, Xinjiang, Gansu, and Sichuan. Additionally, Beijing frequently appeared in the “high-low” areas, possibly indicating a lower spatial correlation with other regions.
- However, starting in 2017, there was a noticeable change in the geographical distribution of the “high-high” areas: regions like Jiangsu and Zhejiang along the coast no longer appeared in the “high-high” category. In contrast, inland areas such as Jiangxi began to be featured in the “high-high” category, while Beijing and Shanghai consistently appeared in this category. During the same period, the geographical distribution of the “low-low” areas remained relatively stable, still mainly concentrated in Inner Mongolia, Xinjiang, Gansu, and Sichuan. Additionally, regions like Fujian and Jiangxi frequently appeared in the “low-high” areas, suggesting that although the GDP of high-tech industries in these regions is low, their spatial correlation with other high-GDP areas began to strengthen. Previously, the “high-high” areas were mainly concentrated in coastal regions such as Jiangsu and Zhejiang, where the high–tech industry GDP is high, and the inter-regional correlation is strong.
- Conclusion: The analysis reveals that the results of the two models are generally consistent. From 2007 to 2021, the more developed high-tech industries remained concentrated in the eastern coastal areas. However, starting in 2017, the agglomeration effect of the high-tech industry began to shift towards the central and western regions. While the high-tech industry in the western region is less developed than in the eastern region, it exhibits a significant agglomeration effect and strong interrelatedness (Figure 6).
5. Analysis of the Driving Factors of Temporal and Spatial Differences in High-Tech Industry
5.1. Factor Detection Analysis
5.2. Interaction Detection Analysis
6. Conclusions and Recommendations
6.1. Limitations and Future Prospects
- Time Series Analysis: Future studies could pay more attention to the developmental characteristics of the high-tech industry over time, including industry growth trajectories, cyclical fluctuations, and long-term trends, as well as the driving factors behind these characteristics.
- 2.
- Detailed Analysis of Regional Characteristics: Focus on the unique characteristics of different provinces in the development of high-tech industries, including regional policy differences, resource allocation, and market potential, to reveal the heterogeneity in the development of high-tech industries between regions.
6.2. Policy Recommendations
- (1)
- Strengthening Technology R&D and Innovation Capability:
- (2)
- Enhancing Balanced Regional Development of High-Tech Industries:
- Coastal Eastern Regions: Although these areas are leading in high-tech industry development, they also face the challenges of industrial over-concentration and increased resource and environmental carrying pressures. Therefore, solutions should focus on promoting industry diversification and improving resource efficiency, such as encouraging investment in green technologies and sustainable development projects through policies.
- Central Regions: The main challenge in these areas is to enhance innovation capabilities and attract high-tech investments. It is recommended that the government support local universities and research institutions to cooperate with enterprises by establishing innovation platforms and providing R&D funding to facilitate technology transfer and industrial upgrading.
- Western Regions: Challenges in these areas include insufficient infrastructure and talent shortages. Addressing these issues requires government investment in infrastructure development and providing education and career development opportunities to retain and attract talents.
- Increase Investment in Western and Northern Regions: Central and local governments should increase financial investment in the high-tech industries of these regions, especially in infrastructure construction, educational resources, and technology R&D centers.
- Promote the Construction of High-Tech Industrial Parks: The establishment of high-tech industrial parks in the western and northern regions should be encouraged to attract domestic and foreign enterprise investments, providing tax incentives and other support measures to promote economic development and technological innovation in these areas.
- Facilitate Technology and Talent Exchange Between Eastern and Northwestern Regions: Special projects or funds should be established to support cooperation between enterprises and research institutions in developed coastal areas and western and northern regions, strengthen technology transfer and talent exchange, and jointly promote the development of high-tech industries.
- (3)
- Enhancing Achievement Transformation and Developing Diversified Industries:
Author Contributions
Funding
Institutional Review Board Statement
Informed Consent Statement
Data Availability Statement
Conflicts of Interest
References
- Li, Z. Does American QE Monetary Policy Affect China’s Inflation?—An Empirical Analysis Based on SVAR Model. Monet. J. Theory Policy 2013, 13–21. [Google Scholar]
- Xiao, S. Research on the Shock Effect of US Quantitative Easing Monetary Policy on Chinese Economy. J. Guangdong Univ. Financ. Econ. 2012, 27, 12–19. [Google Scholar]
- Bloom, N. The Impact of Uncertainty Shocks. J. Econom. 2009, 77, 623–685. [Google Scholar]
- Huang, Q. On the Development of China’s Real Economy at the New Stage. J. China Ind. Econ. 2017, 9, 5–24. [Google Scholar]
- Brown, L. Six Steps to a Sustainable Society; World Watch Institute: Washington, DC, USA, 1982. [Google Scholar]
- Torch High Technology Industry Development Center, Ministry of Science & Technology. China Torch Statistical Yearbook, 2007–2021; China Statistics Press: Beijing, China, 2021; p. 65.
- He, W. The Comprehensive Evaluation of Economic Strength of High Technology Industrial Development Areas. J. Sci. Technol. Prog. Policy 2002, 19, 66–68. [Google Scholar]
- Tang, R.; Li, C.; Feng, X. The Impact of Spatial Characteristics of Hi-tech Industry on R&D Efficiency—Based on the Empirical Study of Static and Dynamic Concentration Index and DEA Panel Tobit of 16 Prefecture-level Cities in Anhui Province. J. East China Econ. Manag. 2018, 32, 22–29. [Google Scholar]
- Fang, Y. Evaluation of the Innovation Capacity of the National High-Tech Industrial Development Zones in China. J. Dalian Univ. Technol. (Soc. Sci.) 2014, 35, 26–32. [Google Scholar]
- Dai, Z. An Analysis on the Spillover Effects of High-tech Industries with Feder Model—A Case of Jiangxi Province. J. East China Econ. Manag. 2016, 30, 26–30. [Google Scholar]
- Qin, C. An Analysis of the Allocation Characteristics of Hi-tech Industries. J. Hum. Geogr. 2003, 18, 38–41+74. [Google Scholar]
- Wang, C.; Zhang, C. Spatial-temporal Pattern of Prefecture-level Innovation Outputs in China: An Investigation Using the ESDA. J. Sci. Geogr. Sin. 2014, 34, 1438–1444. [Google Scholar]
- Jia, J.; Bai, S.; Wang, X.; Li, S. Evaluation of Industry-City Integration Measure about National Hi-tech Zones of Henan Province. J. Areal Res. Dev. 2019, 38, 30–34. [Google Scholar]
- Zhang, T. The Study on the Development and Its Influencing Factors of China’s High Tech Industry. Doctoral Dissertation, Northeast University of Finance and Economics, Dalian, China, 2012. [Google Scholar]
- Bai, R. Spatial Patterns and Influencing Factors of Innovative Enterprises in Anhui Province Based on Subdivision Industry. J. World Reg. Stud. 2020, 29, 1190–1201. [Google Scholar]
- Yu, Y. The Spatial Evolution of Shenzhen High-tech Electronic Information Technology Agglomeration Pattern and Locational Determinants. J. World Reg. Stud. 2020, 29, 557–567. [Google Scholar]
- Wu, Y. Analysis of China’s Provincial Industrial Total Factor Productivity Based on Geographical Weighted Regression Model. J. Econ. Geogr. 2006, 26, 748–752. [Google Scholar]
- Wang, X. Spatial Autocorrelation Analysis of C2C E-Business in China. J. Econ. Geogr. 2011, 31, 1064–1069+1106. [Google Scholar]
- Tu, W.; Zhang, L. Evaluating High-Tech Industries Technological Innovation Capability and Spatial Pattern Evolution Characteristics: Evidence from China. J. Innov. Knowl. 2023, 8, 100287. [Google Scholar] [CrossRef]
- Chen, H.; Lin, H.; Zou, W. Research on the Regional Differences and Influencing Factors of the Innovation Efficiency of China’s High-Tech Industries. Sustainability 2020, 12, 3284. [Google Scholar] [CrossRef]
- Li, L. The Impacts of Geographical Proximity and Cognitive Proximity on Innovation Performance of Hi-tech Zone—Based on Social Network Analysis. J. East China Econ. Manag. 2014, 28, 32–37. [Google Scholar]
- Yang, Q.; Duan, X. Spatial Evolution Of High-tech Industry Development Level In China And Analysis Of The Influencing Factors. J. Resour. Environ. Yangtze Basin 2014, 23, 1649–1658. [Google Scholar]
- Liu, L. Study on High-Tech Industry Sustainable Development Mode. Doctoral Dissertation, Harbin University of Science and Technology, Harbin, China, 2012. [Google Scholar]
- Xu, J. Research on the Sustainable Development Capability of China’s High-tech Industries Based on the Grey Dynamic Evaluation Model. J. Jiangsu Sci. Technol. Inf. 2017, 30, 4–9. [Google Scholar]
- Sha, X. A Study on Sustainable Development of High and New Technology Industrial Zone. Doctoral Dissertation, Tianjin University, Tianjin, China, 2010. [Google Scholar]
- Chen, S. Study on the Spatial Pattern of Population Ageing and the Influencing Factors in Shandong Province. J. Shaanxi Univ. Technol. 2023, 39, 83–92. [Google Scholar]
- Sun, Z. Influence Factors of Spatial Differentiation of Tourism Development Level in Chongqing Based on Geographical Detector. J. Southwest China Norm. Univ. 2019, 44, 57–63. [Google Scholar]
- Zhang, J. Research on Spatial-temporal Pattern and Influencing Factors of Agricultural Modernization in Northeast China Region. J. Anhui Agric. Sci. 2023, 51, 230–237. [Google Scholar]
- Zeng, H. Spatial Differentiation Characteristics and Influencing Factors of Surface Soil Cd in Karst Plateau Area of Guiyang City. J. Environ. Sci 2023, 1–12. [Google Scholar] [CrossRef]
- Xia, Y.; Zhao, S. Made in China 2025: Industrial Internet Opens a New Industrial Revolution; Mach Industrial Press: Beijing, China, 2016; Volume 53. [Google Scholar]
- Xinhua News Agency. The Outline of the 14th FiveYear Plan (2021–2025) for National Economic and Social Development and the Long-Range Objectives Through the Year 2035 of P. R. China. China Water Resour. 2021, 1–38. [Google Scholar]
- Chen, F. An Analysis on the Factors of Guangdong Province’s High-Tech Industry Growth. Master’s Thesis, South China Univiversity of Technology, Guangzhou, China, 2013. [Google Scholar]
- National Bureau of Statistics. China Statistical Yearbook 2007–2021; China Statistics Press: Beijing, China, 2022; pp. 4–5. [CrossRef]
- Anselin, L. Local Indicators of Spatial Association—LISA. J. Geogr. Anal. 1995, 27, 93–115. [Google Scholar] [CrossRef]
- Anselin, L. The Moran Scatter Plot as an ESDA Tool to Assess Local Instability in Spatial Association. In Spatial Analytical Perspectives on GIS; Fischer, M., Scholten, H.J., Unwin, D., Eds.; Taylor & Francis: London, UK, 1996; pp. 111–125. [Google Scholar]
- Wang, J.; Xu, C. Geographical Detector: Principle and Prospect. J. Geogr. 2017, 72, 116–134. [Google Scholar]
- Xie, W.; Hu, W.; Xia, S. Study on R&D Efficiency and Its Determinants of Chinese High-Tech Industry. Sci. Sci. Technol. Manag. 2008, 29, 144–149. [Google Scholar]
- Yang, Q.; Duan, X. The Time-Space Measurement of Efficiency of Development of High-Technology Industry and Provincial Differences Based on the DEA-Malmquist TFP Index. J. Econ. Geogr. 2014, 34, 103–110. [Google Scholar]
- Tang, Z.; Ren, X. Integrated Evaluation and Demonstration Analysis of the Development Level of Hi-tech Industry. J. China Univ. Geosci. 2004, 4, 11–15. [Google Scholar]
- Li, X.; Zhou, Q. A Multivariate Nonlinear Regression Model Based on the Improvement of Moving Average. J. Cap. Norm. Univ. 2017, 38, 9–12. [Google Scholar]
- Cortes, G.S.; Gao, G.P.; Silva, F.B.; Song, Z. Unconventional Monetary Policy and Disaster Risk: Evidence from the Subprime and COVID–19 Crises. J. Int. Money Financ. 2022, 122, 102543. [Google Scholar] [CrossRef] [PubMed]
- Ellison, G.; Glaeser, E.L. Geographic Concentration in US Manufacturing Industries: A Dartboard Approach. J. Polit. Econ. 1997, 105, 889–927. [Google Scholar] [CrossRef]
- Ellison, G.; Glaeser, E.L.; Kerr, W.R. What Causes Industry Agglomeration? Evidence from Coagglomeration Patterns. Am. Econ. Rev. 2010, 100, 1195–1213. [Google Scholar] [CrossRef]
| Years | High-Tech GDP (Billion Yuan) | High-Tech GDP Growth Rate | Total GDP (Billion Yuan) | Total GDP Growth Rate |
|---|---|---|---|---|
| 2007 | 95,911.5 | 33.5% | 270,092.3 | 0.18 |
| 2008 | 96,546.2 | 0.7% | 319,244.6 | 0.09 |
| 2009 | 93,319.1 | −3.4% | 348,517.7 | 0.18 |
| 2010 | 119,022 | 27.5% | 412,119.3 | 0.18 |
| 2011 | 140,338.9 | 17.9% | 487,940.2 | 0.10 |
| 2012 | 152,235.3 | 8.5% | 538,580 | 0.10 |
| 2013 | 175,106.4 | 15.0% | 592,963.2 | 0.09 |
| 2014 | 211,335.9 | 20.7% | 643,563.1 | 0.07 |
| 2015 | 189,757.5 | −10.2% | 688,858.2 | 0.08 |
| 2016 | 212,268.8 | 11.9% | 746,395.1 | 0.11 |
| 2017 | 243,898 | 14.9% | 832,035.9 | 0.10 |
| 2018 | 288,706.3 | 18.4% | 919,281.1 | 0.07 |
| 2019 | 324,137.4 | 12.3% | 986,515.2 | 0.03 |
| 2020 | 367,111.6 | 13.3% | 1,015,986.2 | 0.13 |
| 2021 | 478,489.1 | 30.3% | 1,149,237 | 0.18 |
| Geodetector | 2007 | 2015 | 2021 | |||
|---|---|---|---|---|---|---|
| q Statistic | p Value | q Statistic | p Value | q Statistic | p Value | |
| R&D Internal Expenditure | 0.8301 | 0.000 | 0.9095 | 0.000 | 0.7876 | 0.000 |
| Industry Agglomeration | 0.6013 | 0.0033 | 0.6074 | 0.0036 | 0.6073 | 0.0028 |
| Practitioner | 0.9460 | 0.000 | 0.9475 | 0.000 | 0.8436 | 0.000 |
| Total Investment in Fixed Assets | 0.6116 | 0.0132 | 0.5653 | 0.0244 | 0.6020 | 0.0035 |
| Number of Integrated Enterprises | 0.7902 | 0.000 | 0.7093 | 0.000 | 0.7618 | 0.0031 |
| Foreign Investment Operating Revenue | 0.0811 | 0.7158 | 0.1029 | 0.6515 | 0.1164 | 0.5951 |
| Road Density | 0.3856 | 0.0139 | 0.4548 | 0.0209 | 0.2511 | 0.1055 |
| Foreign Investment | 0.7977 | 0.000 | 0.8142 | 0.000 | 0.6986 | 0.000 |
| Per Capita GDP | 0.5598 | 0.0111 | 0.4326 | 0.0490 | 0.2581 | 0.2500 |
Disclaimer/Publisher’s Note: The statements, opinions and data contained in all publications are solely those of the individual author(s) and contributor(s) and not of MDPI and/or the editor(s). MDPI and/or the editor(s) disclaim responsibility for any injury to people or property resulting from any ideas, methods, instructions or products referred to in the content. |
© 2023 by the authors. Licensee MDPI, Basel, Switzerland. This article is an open access article distributed under the terms and conditions of the Creative Commons Attribution (CC BY) license (https://creativecommons.org/licenses/by/4.0/).
Share and Cite
Shan, Y.; Wang, N. Spatiotemporal Evolution and the Influencing Factors of China’s High-Tech Industry GDP Using a Geographical Detector. Sustainability 2023, 15, 16678. https://doi.org/10.3390/su152416678
Shan Y, Wang N. Spatiotemporal Evolution and the Influencing Factors of China’s High-Tech Industry GDP Using a Geographical Detector. Sustainability. 2023; 15(24):16678. https://doi.org/10.3390/su152416678
Chicago/Turabian StyleShan, Yuan, and Ninglian Wang. 2023. "Spatiotemporal Evolution and the Influencing Factors of China’s High-Tech Industry GDP Using a Geographical Detector" Sustainability 15, no. 24: 16678. https://doi.org/10.3390/su152416678
APA StyleShan, Y., & Wang, N. (2023). Spatiotemporal Evolution and the Influencing Factors of China’s High-Tech Industry GDP Using a Geographical Detector. Sustainability, 15(24), 16678. https://doi.org/10.3390/su152416678