
Examining Changes in Consumer Spatial Structure and Sustainable Development Issues in Beijing before and after the Outbreak of COVID-19


Abstract
:1. Introduction
2. Data and Method
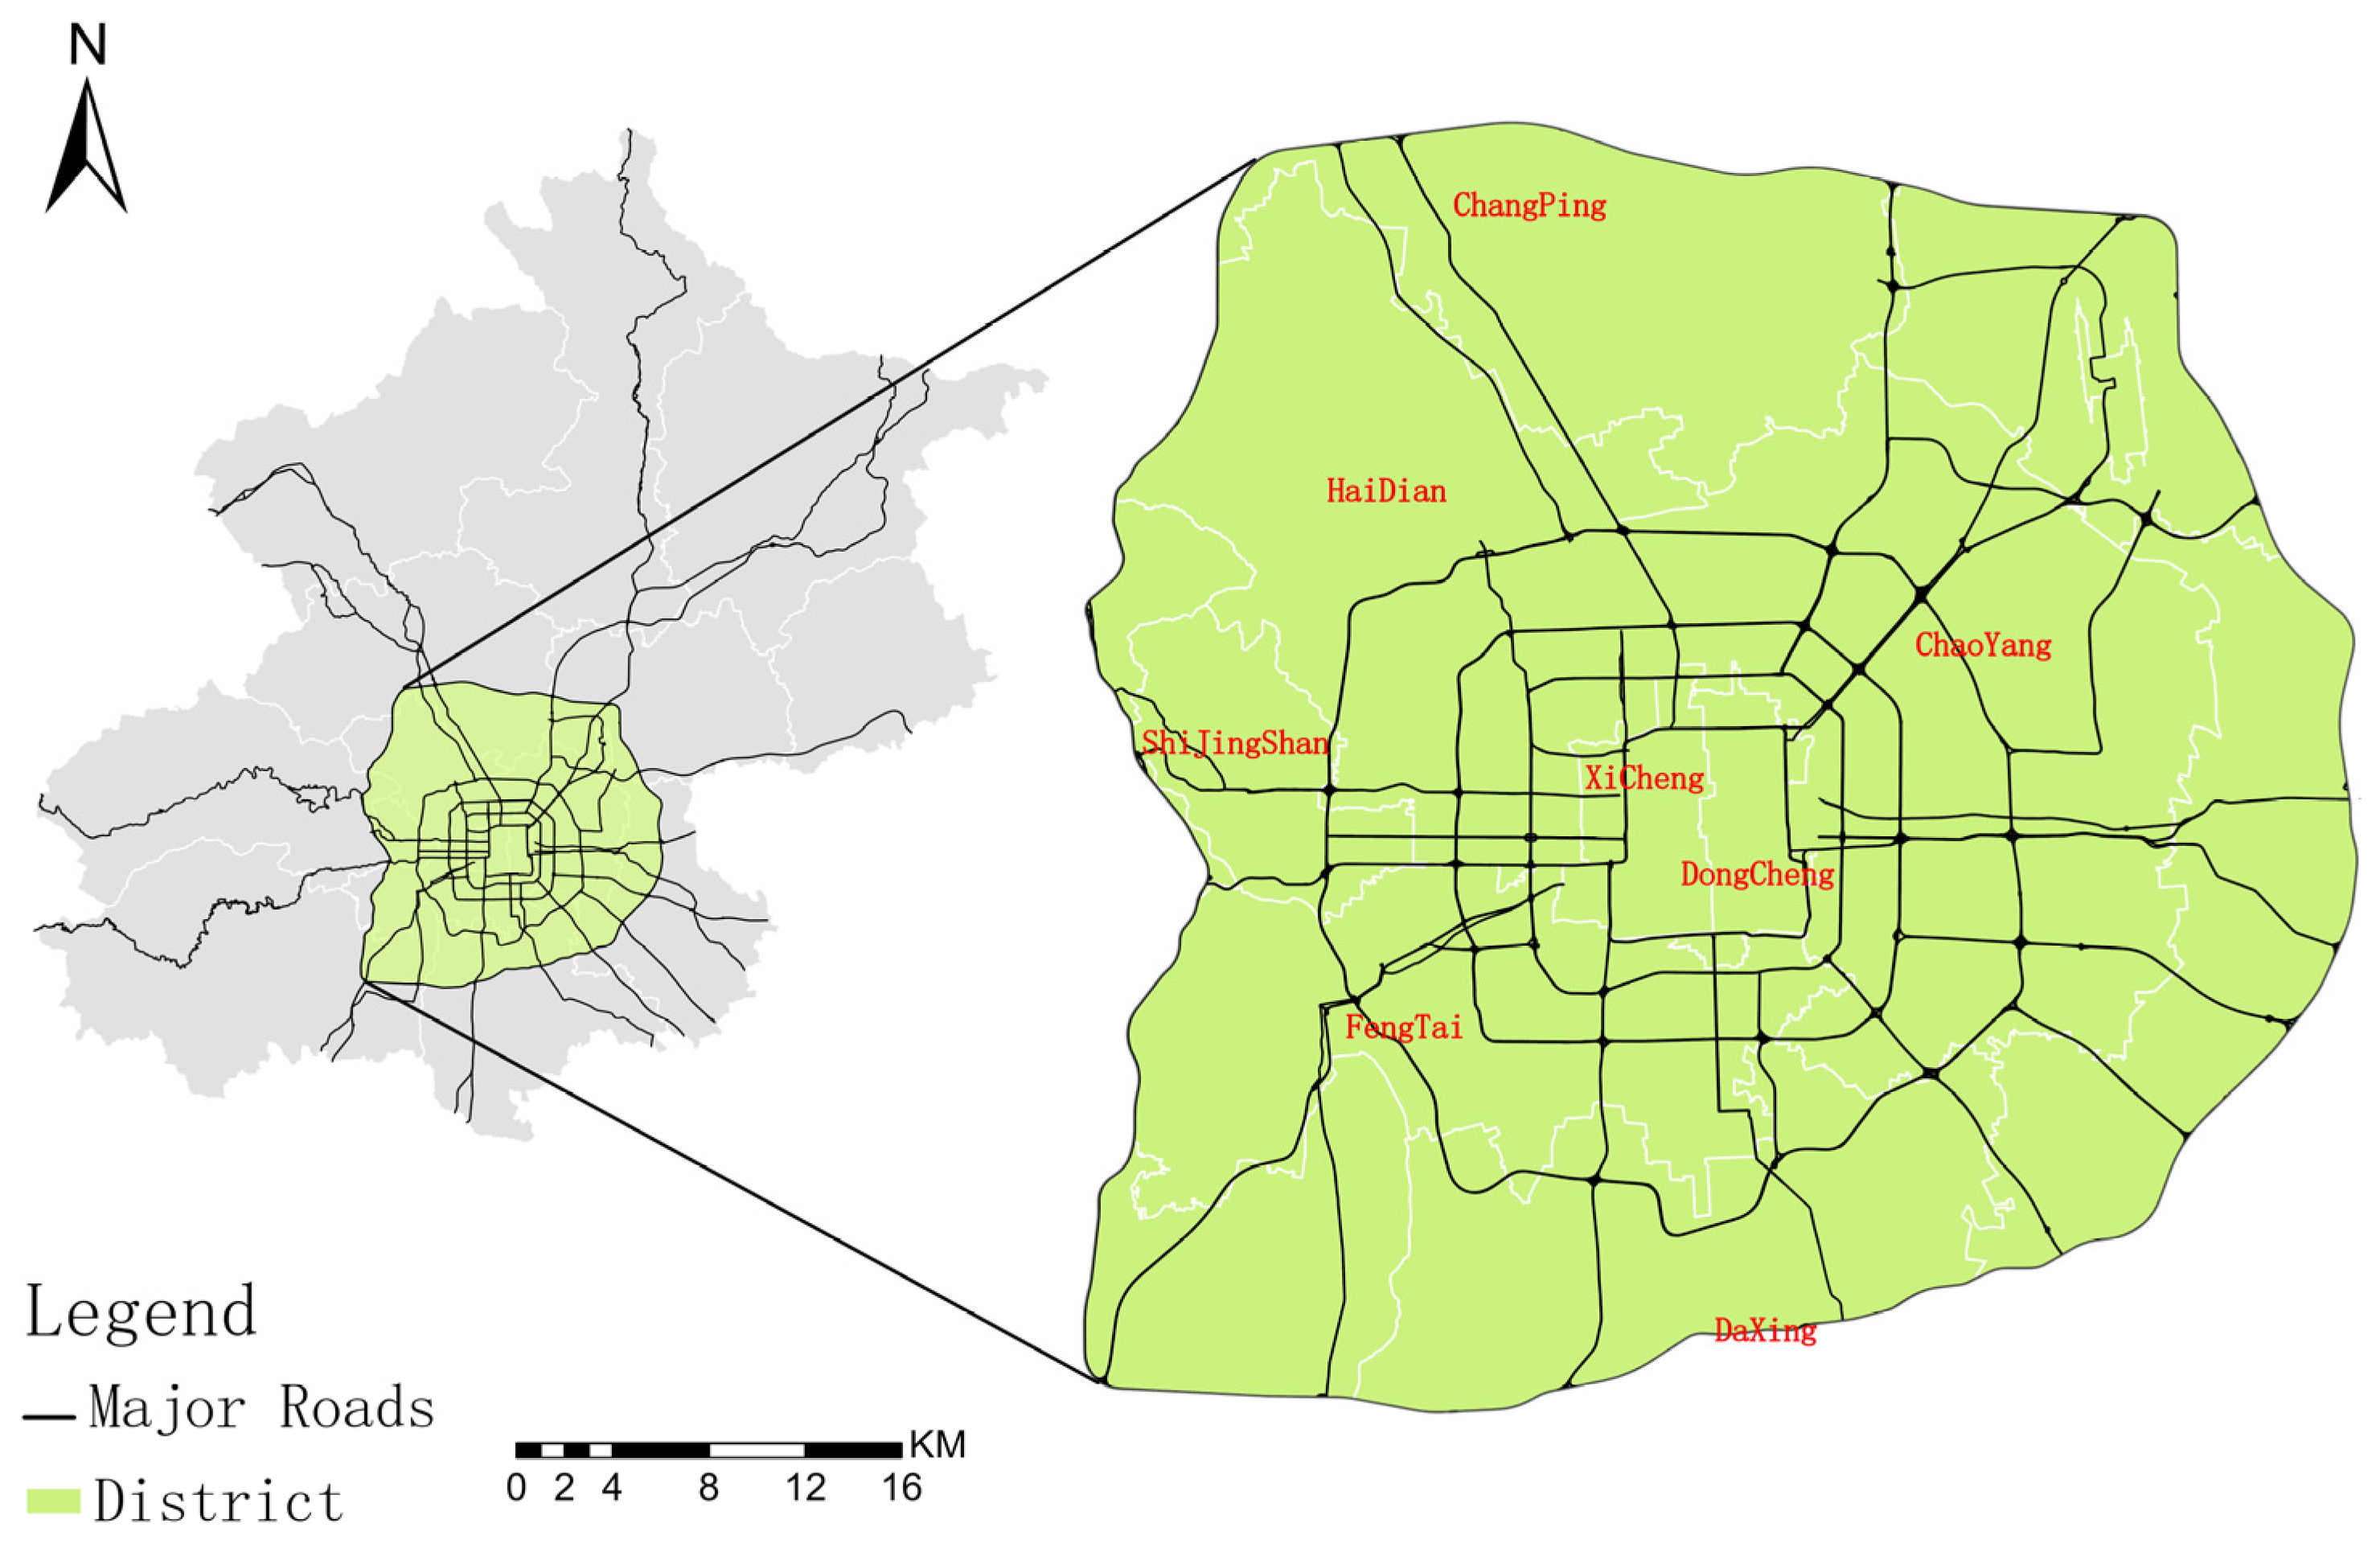
2.1. Study Area
2.2. Data
2.2.1. UnionPay Data
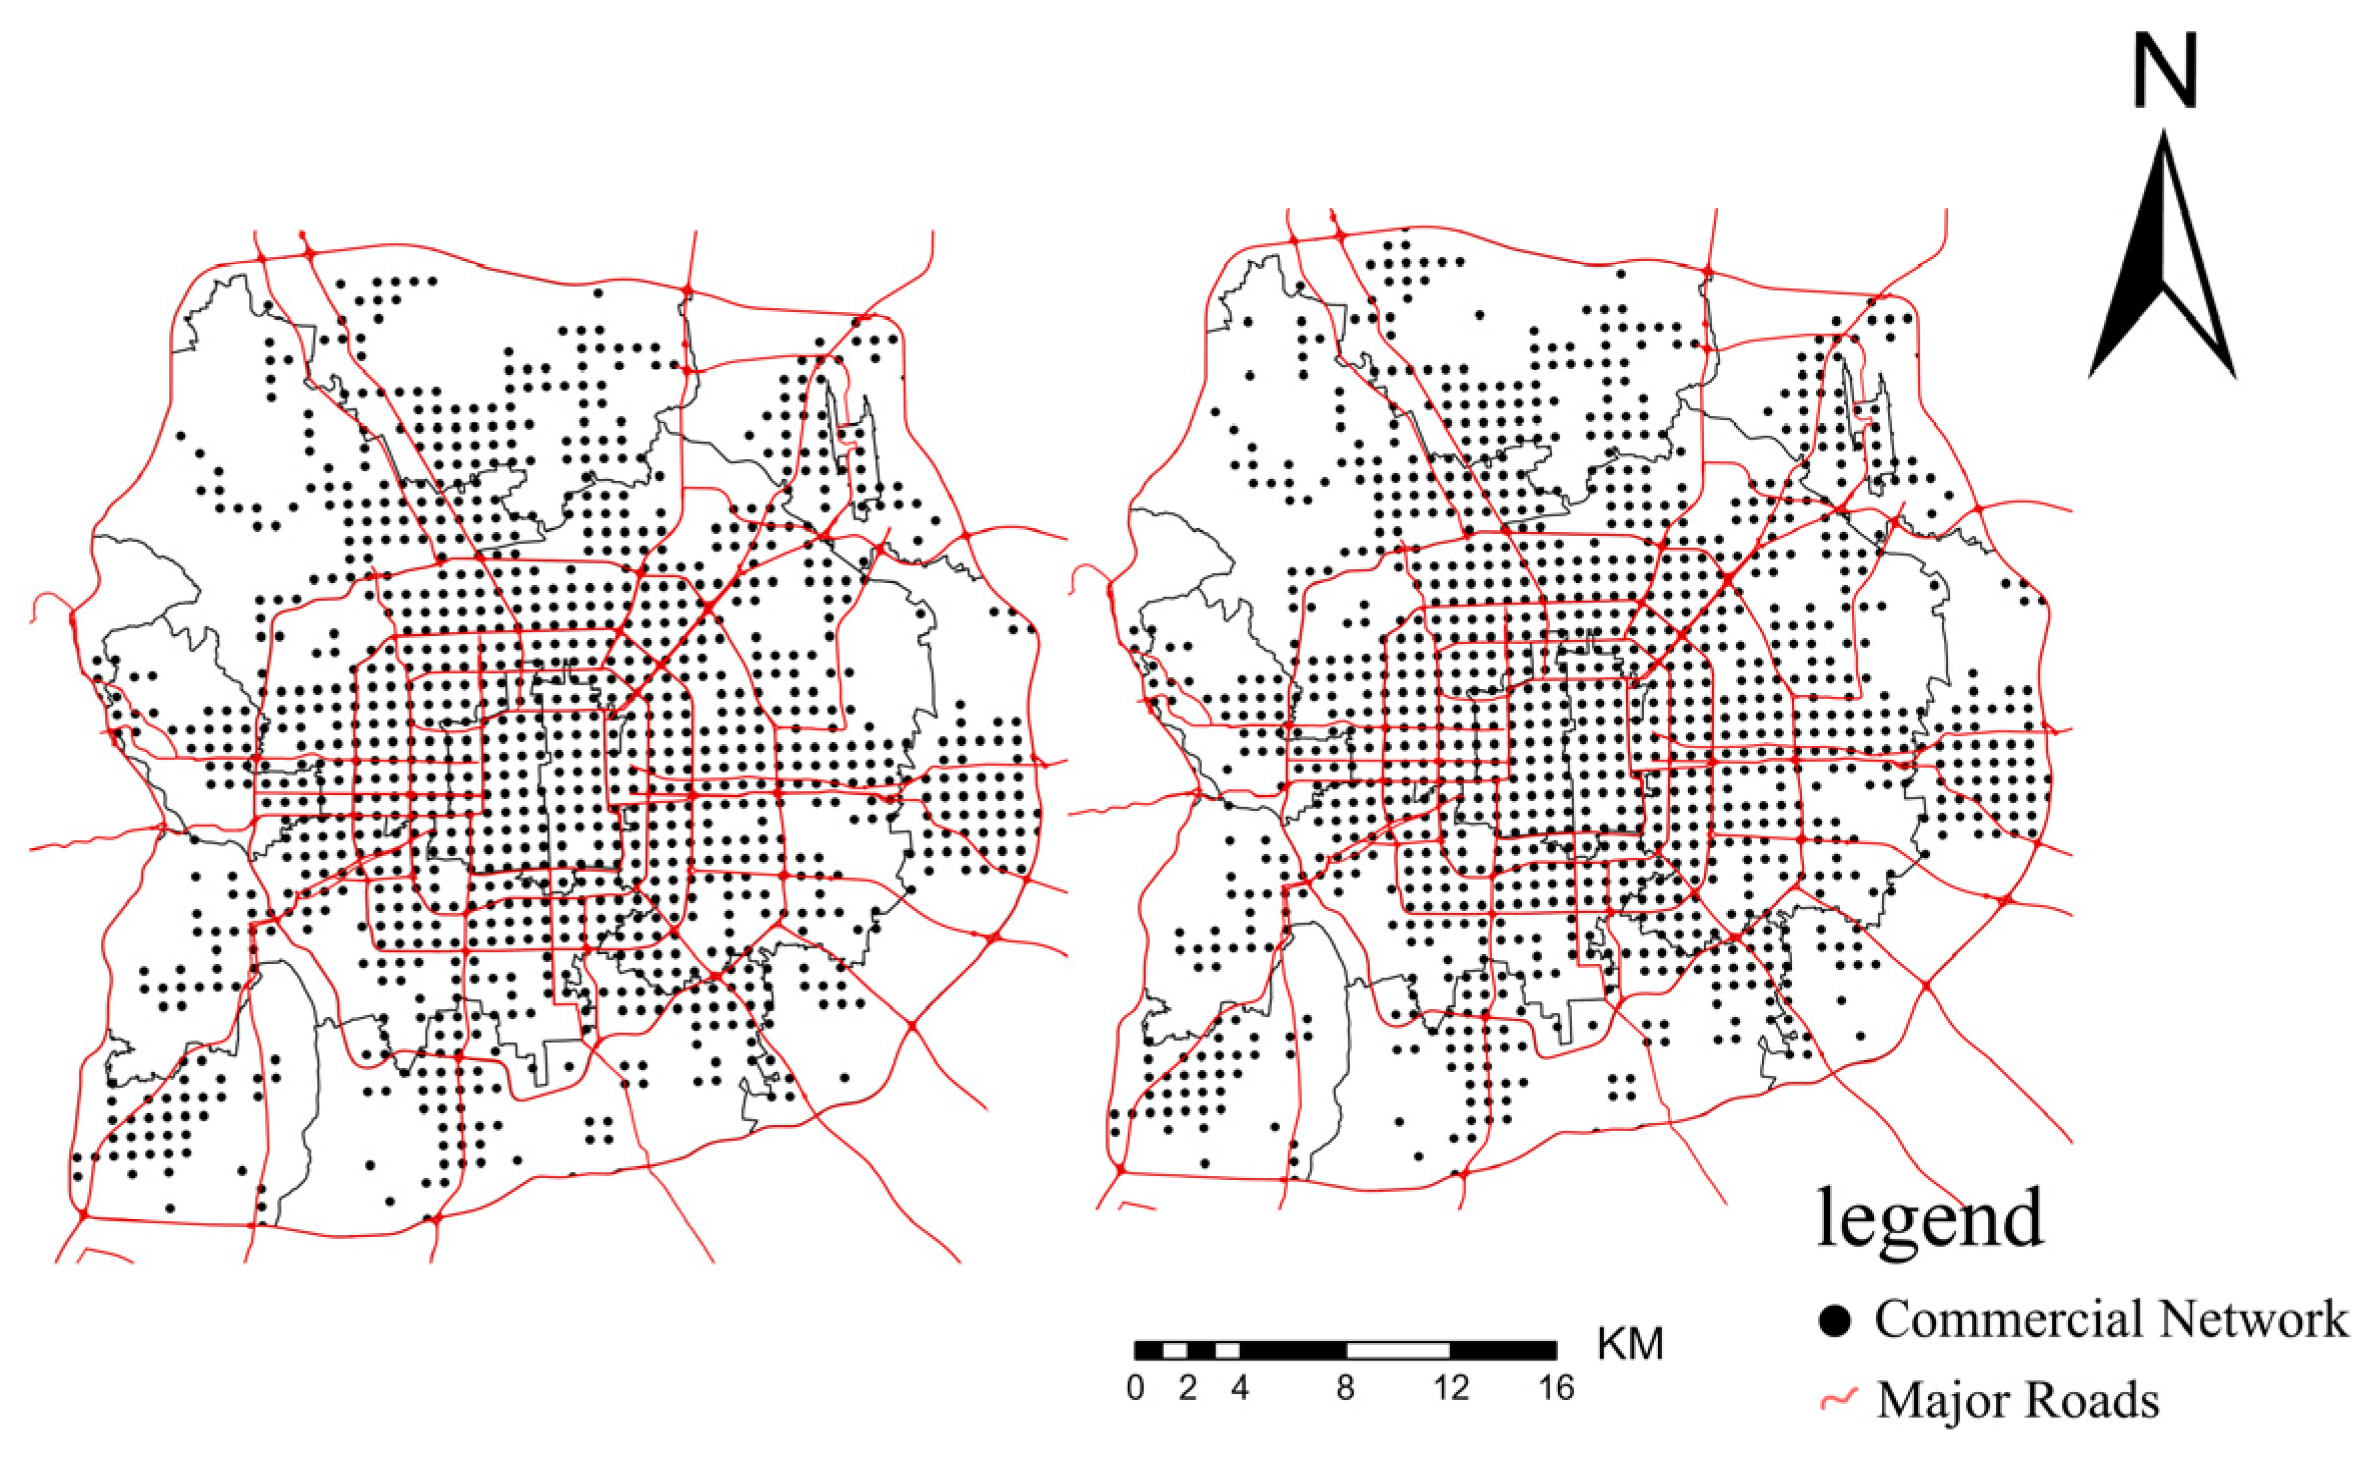
2.2.2. Commercial POI Data of Beijing
2.3. Method
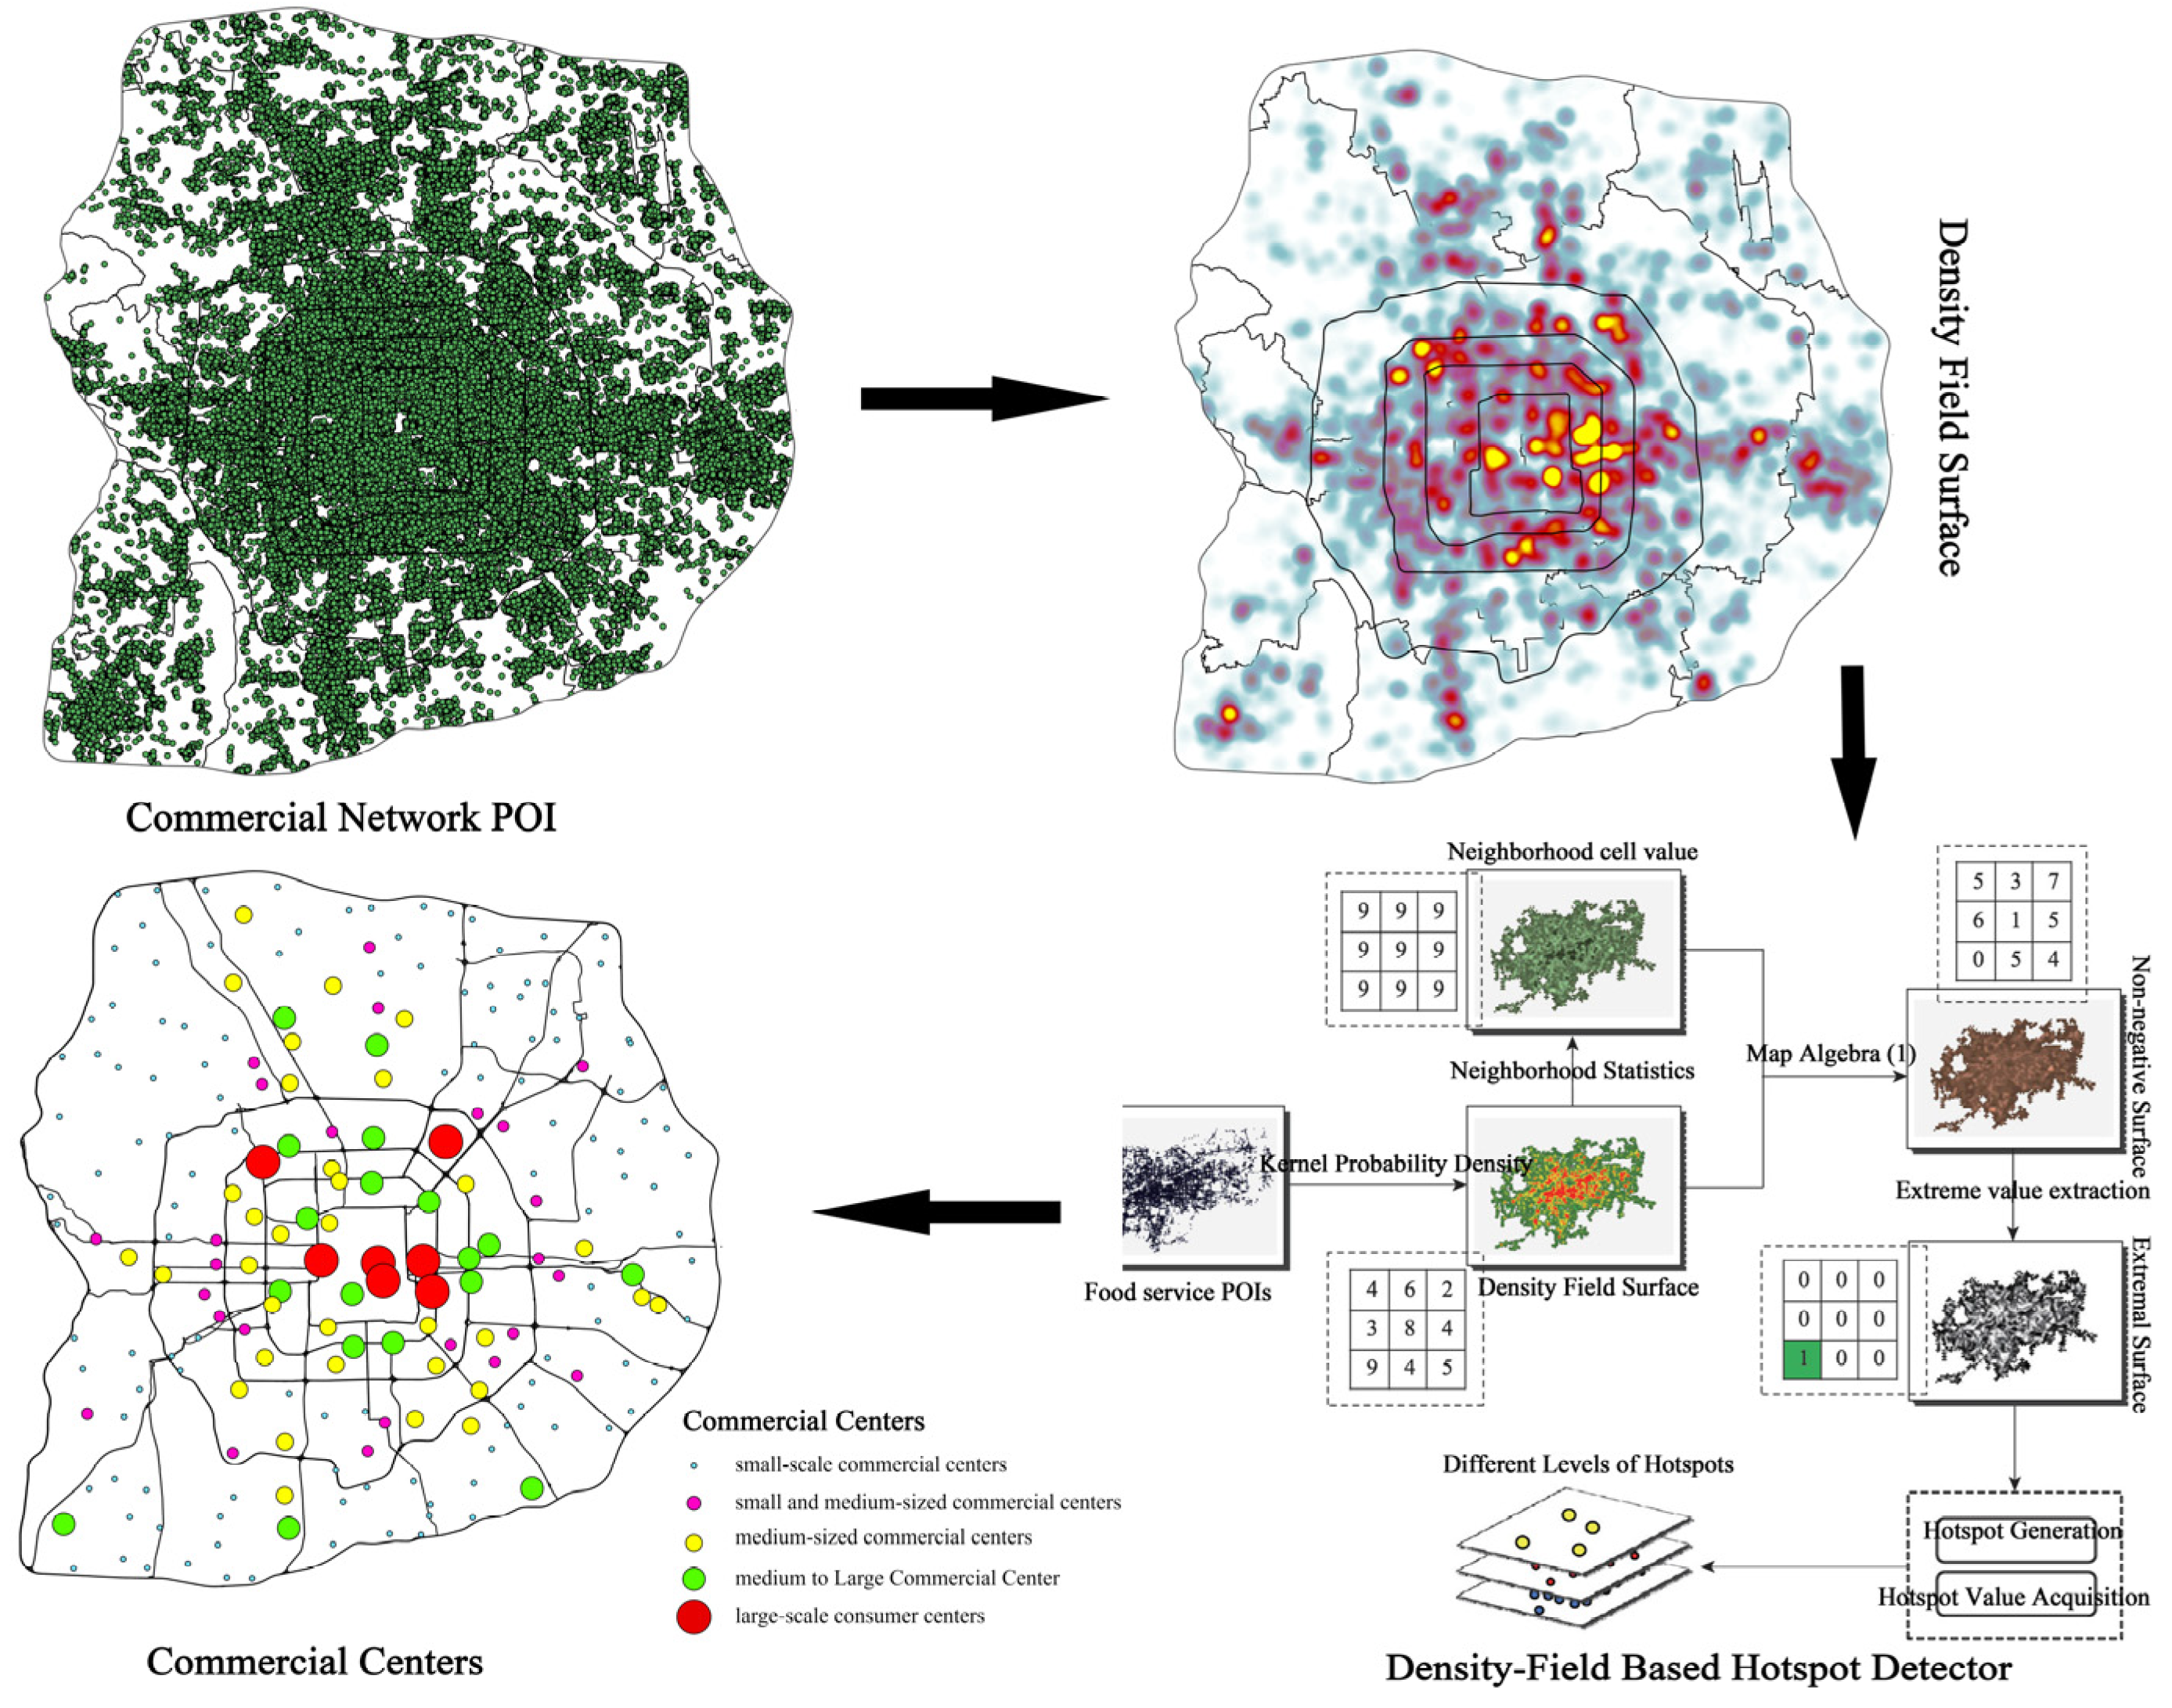
2.3.1. Spatial Hotspot Analysis
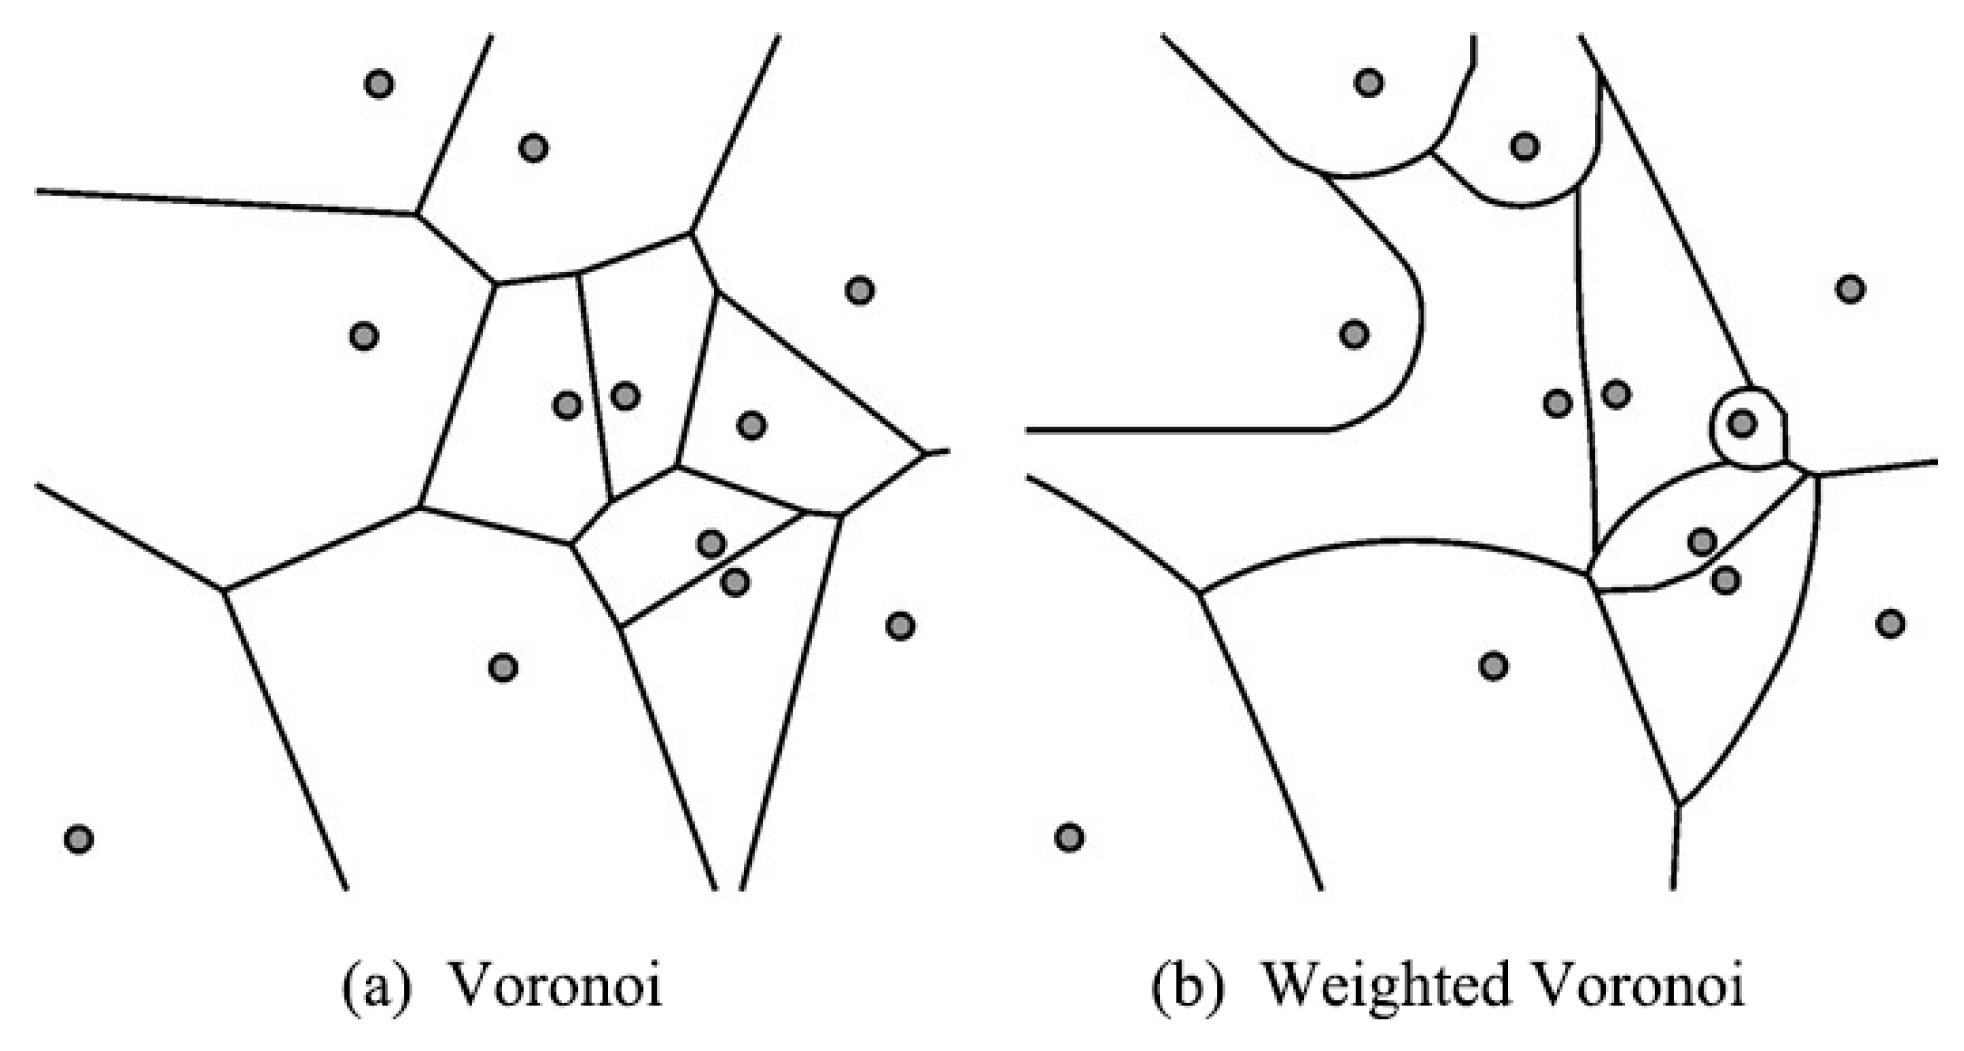
2.3.2. Weighted Voronoi Diagram
3. Results and Analysis
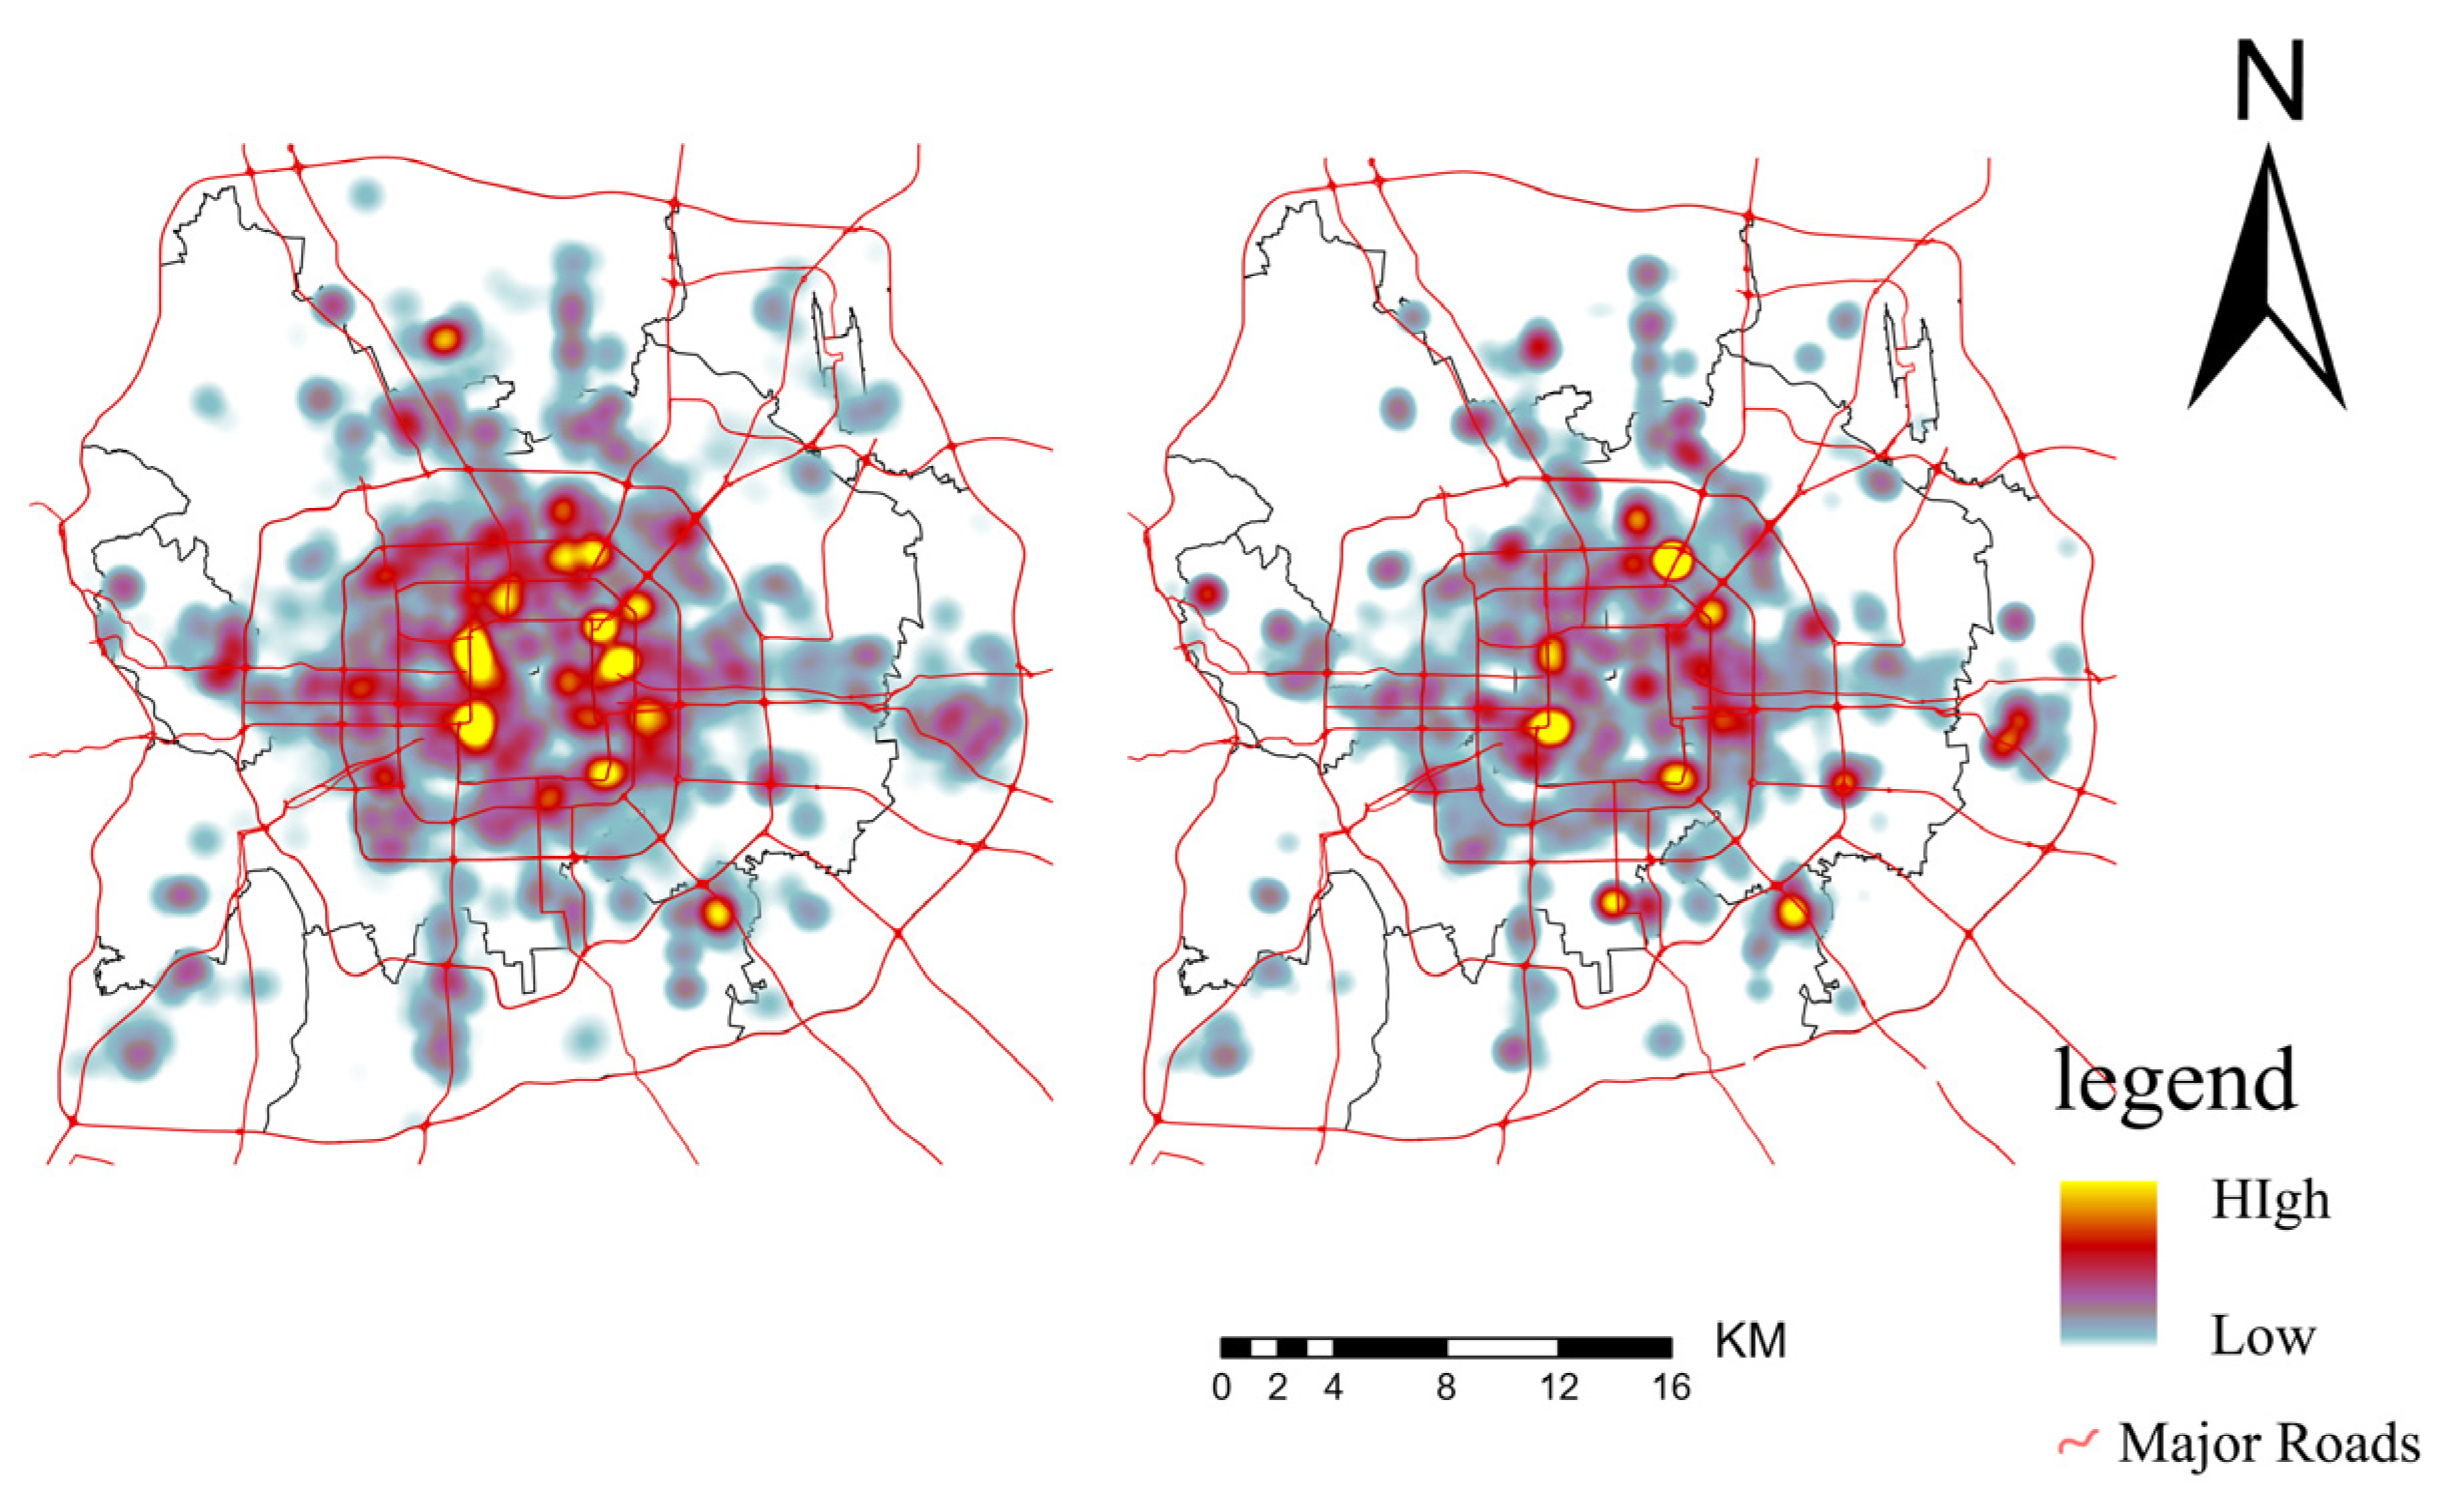
3.1. Spatial Pattern of Consumption Hotspots
3.2. Changes in Consumption Pattern
3.2.1. Attenuation Ratio of UnionPay Card Expenditure
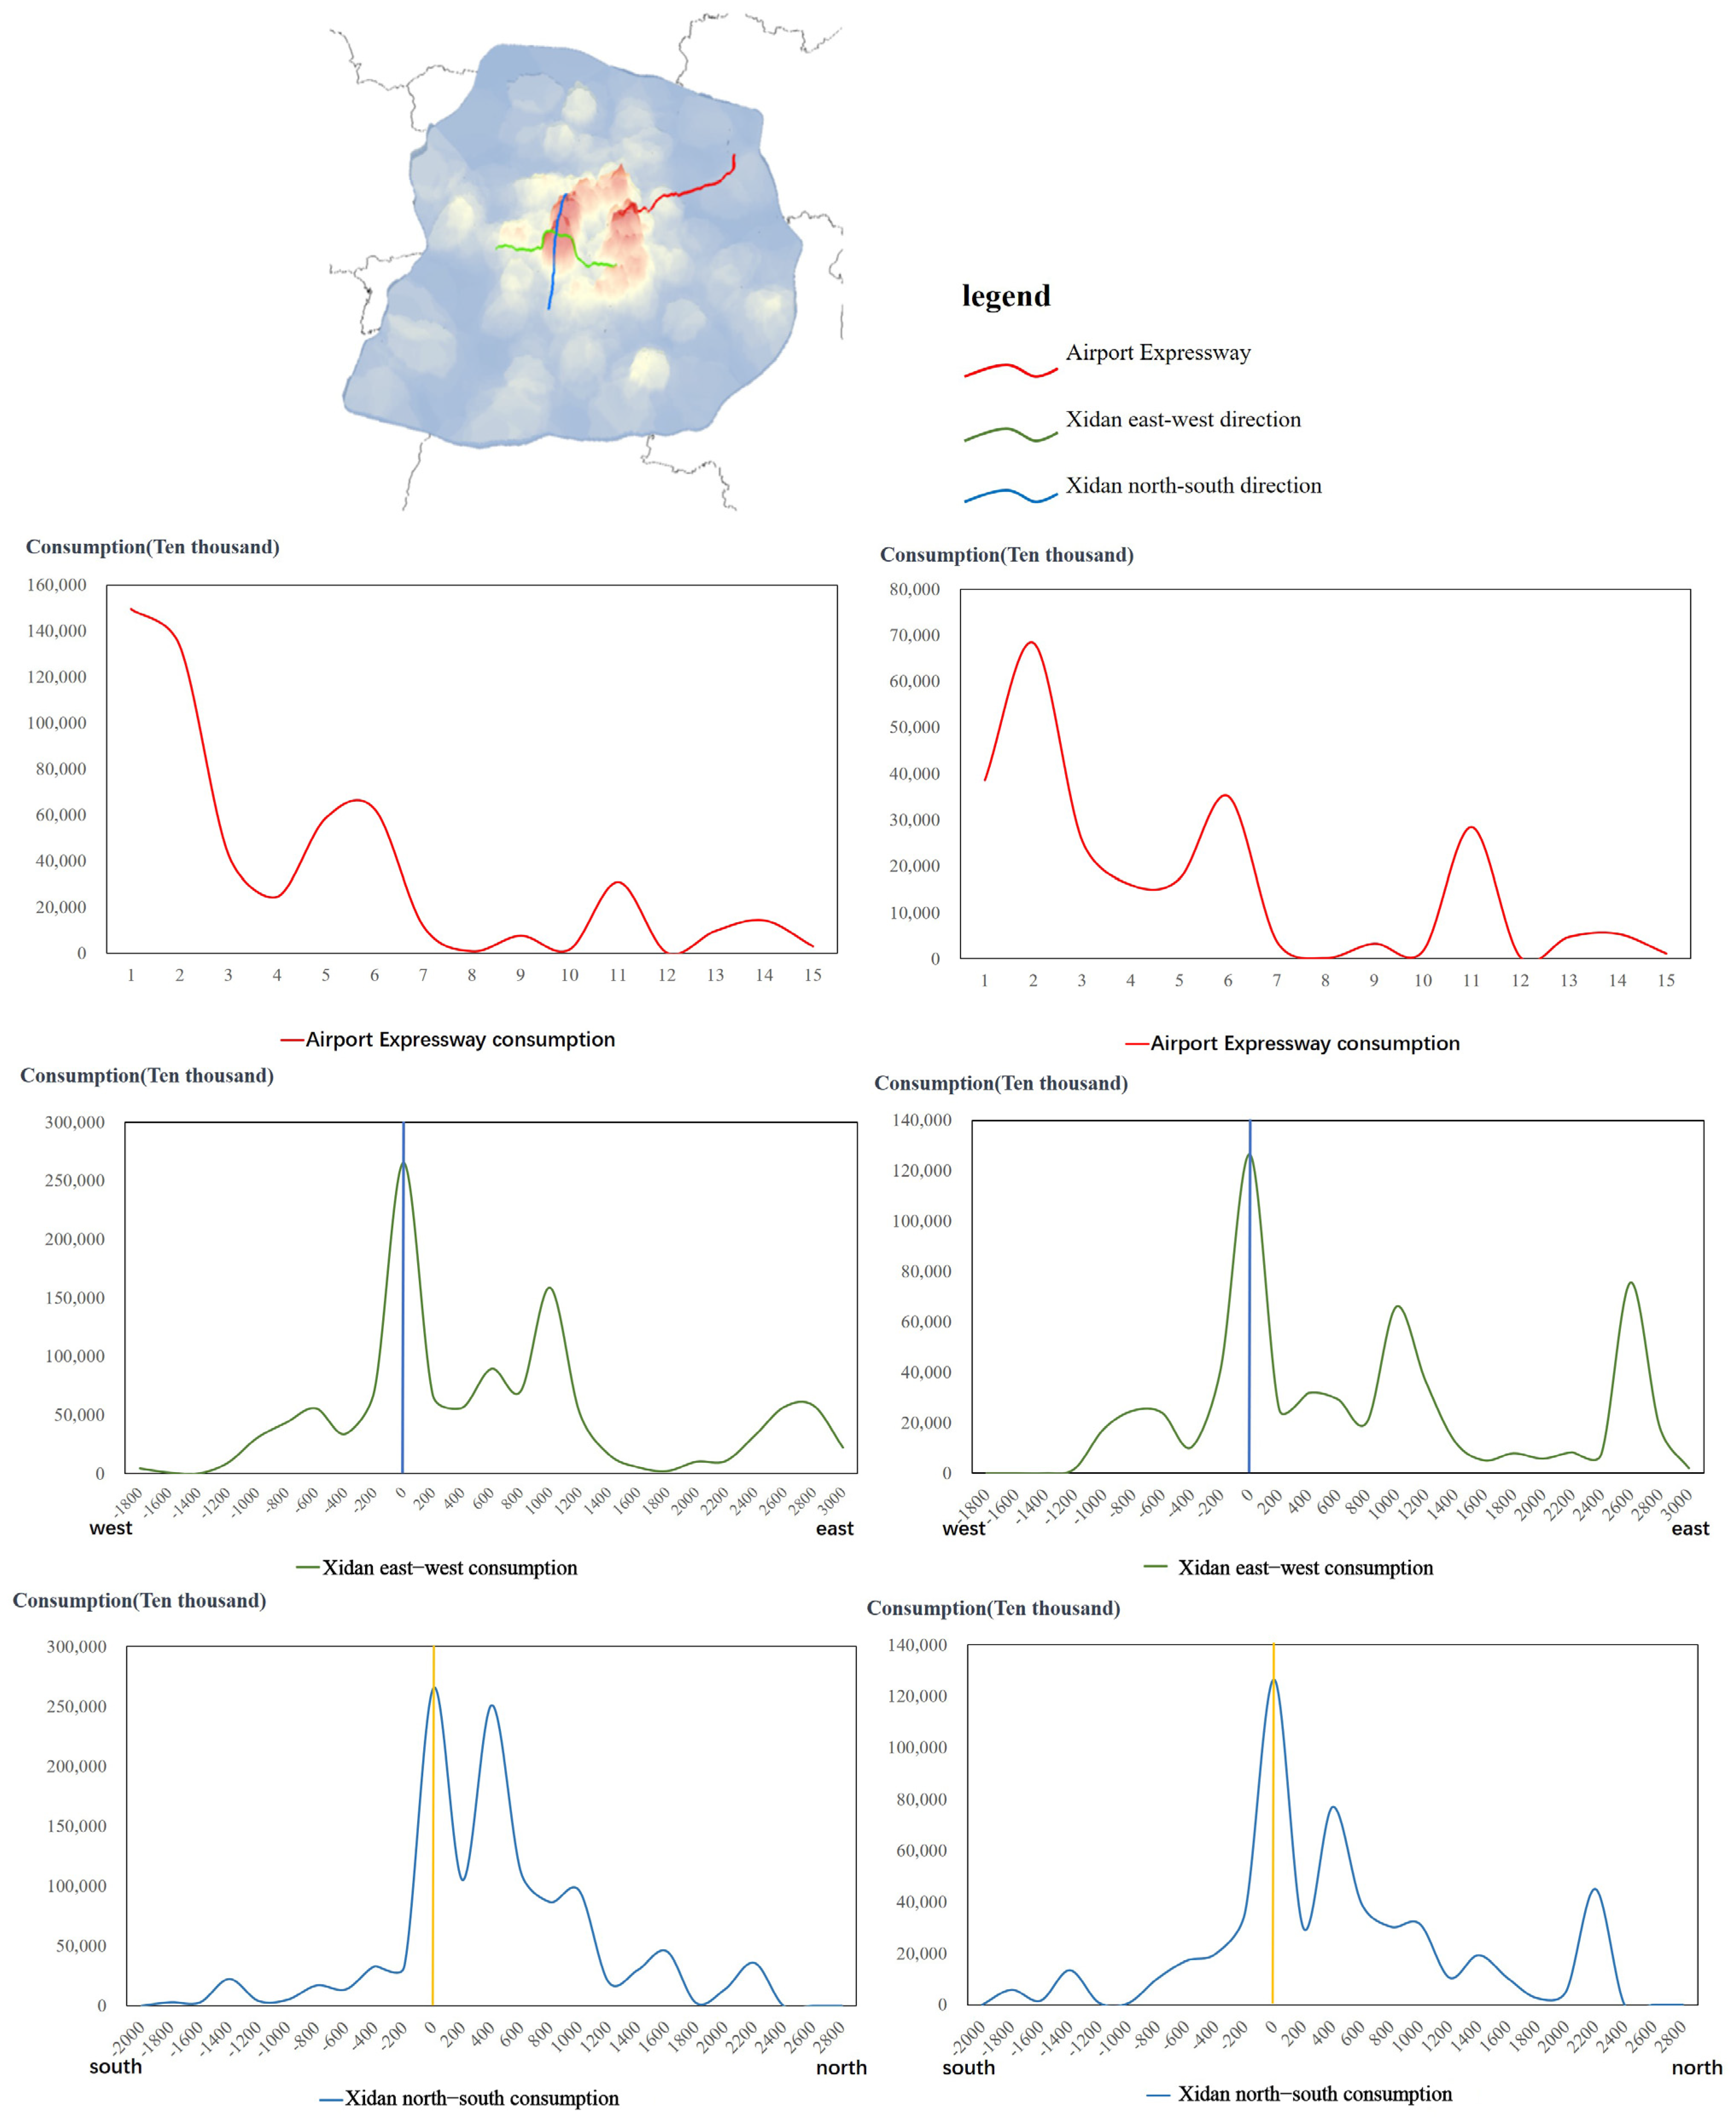
3.2.2. Attenuation Ratio of Street-Level Consumer Expenditure
3.3. Changes in the Radiation Range of the Consumption Hotspots
4. Discussion
4.1. Key Findings
4.2. Practical Implications
5. Conclusions
Author Contributions
Funding
Institutional Review Board Statement
Informed Consent Statement
Data Availability Statement
Conflicts of Interest
References
- Xie, Y.Q. Analysis of Urban Spatial Structure on Sustainable Development. Areal Res. Dev. 2002, 01, 31–34. (In Chinese) [Google Scholar]
- Wu, Z.Q.; Chai, Y.W. Concerns of study on spatial structure of urban commercial activity. Econ. Geogr. 2000, 1, 115–120. (In Chinese) [Google Scholar]
- UNWTO. COVID-19: Putting People First; UNWTO: Madrid, Spain, 2020. [Google Scholar]
- Tang, S.Y.; Chen, X.Y. An Empirical Study on the impact of the Digital Economy on the Real Economy under the impact of the COVID-19. Rev. Econ. Res. 2021, 3, 58–71. (In Chinese) [Google Scholar]
- Yang, W.Y. The retailing and services center and network of Beijing—Then, now, and long before. Acta Geogr. Sin. 1994, 49, 9–17. (In Chinese) [Google Scholar]
- Wu, Z.Q.; Dai, X.Z. The study on the spatial structure of Beijing’s commercial centers. City Plan. 2001, 10, 15–19. (In Chinese) [Google Scholar]
- Zhang, J.Q.; Cai, J. Analyzing on development stages of Beijing center business district. J. Beijing Union Univ. 2002, 1, 114–117. (In Chinese) [Google Scholar]
- Lin, Q.; Sun, F.; Wang, X.M.; Liao, C.; Zhang, W.X. Hierarchical system of Beijing commercial center judged from POI data. J. Beijing Norm. Univ. (Nat. Sci.) 2019, 55, 415–424. (In Chinese) [Google Scholar]
- Hou, J.N.; Wang, Y. Research on the Spatial Structure of Shanghai’s Commercial Space. Coop. Econ. Sci. Technol. 2020, 23, 4–7. (In Chinese) [Google Scholar]
- Wang, L.Y.; Hou, X.; Wang, K. Spatial and Temporal Characteristics and Impact Mechanisms of Urban Internet Celebrity Culture Consumption Spaces: A Case Study of Internet Celebrity Restaurants in Tianjin; China Urban Planning Society: Chengdu, China, 2021. (In Chinese) [Google Scholar]
- Li, L.Y.; Wu, J.T. The influence and formation mechanism of COVID-19 epidemic on residents’ consumption behavior. Consum. Econ. 2020, 36, 19–26. (In Chinese) [Google Scholar]
- Eger, L.; Komárková, L.; Egerová, D.; Mičík, M. The Effect of COVID-19 on Consumer Shopping Behavior: Generational Cohort Perspective. J. Retail. Consum. Serv. 2021, 61, 102542. [Google Scholar] [CrossRef]
- Zhang, H.; Li, P.; Zhang, Z.; Li, W.; Chen, J.; Song, X.; Shibasaki, R.; Yan, J. Epidemic versus Economic Performances of the COVID-19 Lockdown: A Big Data Driven Analysis. Cities 2022, 120, 103502. [Google Scholar] [CrossRef]
- Lu, T. Research on the Optimization Path of Consumer Structure in Suzhou Under the Normalization of Epidemic Prevention and Control. Stat. Sci. Pract. 2021, 5, 46–49. (In Chinese) [Google Scholar]
- Zhang, J.Q. On “the centre of economy” reorientating the urban function of Beijing. J. Beijing Union Univ. 2000, 1, 46–49. (In Chinese) [Google Scholar]
- Wang, F.; Gao, X.L.; Xu, Z.N. Identification and classification of urban commercial districts at block scale. Geogr. Res. 2015, 34, 1125–1134. (In Chinese) [Google Scholar]
- Wang, F.; Gao, X.L. Structure of commercial space and its coupling relationship with population distribution in Beijing. City Plan. 2015, 39, 23–29. (In Chinese) [Google Scholar]
- Main Data of the Seventh National Population Census of Beijing in 2021. Available online: http://tjj.beijing.gov.cn/zt/bjsdqcqgrkpc/qrpbjjd/202105/t20210519_2392982.html (accessed on 19 May 2021).
- Wang, J.M. Making Payments More Convenient and Benefiting the People with Warmth: China UnionPay Joins Hands with Various Industries to Build a Digital Payment Scene Ecology. China Credit Card 2022, 2, 7–9. (In Chinese) [Google Scholar]
- Shao, F.J.; Cai, J.B. Promoting the high-quality development of payment industry. China Financ. 2022, 973, 11–13. (In Chinese) [Google Scholar]
- Rosenblatt, M. Remarks on Some Nonparametric Estimates of a Density Function. Ann. Math. Stat. 1956, 27, 832–837. [Google Scholar] [CrossRef]
- Parzen, E. On Estimation of a Probability Density Function and Mode. Ann. Math. Stat. 1962, 33, 1065–1076. [Google Scholar] [CrossRef]
- Zhang, H.P.; Zhou, X.X.; Tang, G.A.; Zhou, L.; Ye, X.Y. Hotspot discovery and its spatial pattern analysis for catering service in cities based on field model in GIS. Geogr. Res. 2020, 39, 354–369. (In Chinese) [Google Scholar]
- Thiessen, A.H. Precipitation Averages for Large Areas. Mon. Weather Rev. 1911, 39, 1082–1089. [Google Scholar] [CrossRef]
- Chakroun, H.; Benie, G.B.; O’Neill, N.T.; Desilets, J. Spatial Analysis Weighting Algorithm Using Voronoi Diagrams. Int. J. Geogr. Inf. Sci. 2000, 14, 319–336. [Google Scholar] [CrossRef]
- Guo, L.M.; Zhou, T.G.; Su, Y.C. Definition of urban hinterlands of Chengdu-Chongqing economic circle based on weighted Voronoi diagram. J. Geo-Inf. Sci. 2014, 16, 411–417. (In Chinese) [Google Scholar]
- Zhang, Y.; Wang, Q.; Wu, W.Z.; Su, F.Z. A weighted Voronoi diagram-based retrieval approach for point-like toponym information. Acta Geod. Cartogr. Sin. 2017, 46, 1919–1926. [Google Scholar]
- Beijing Municipal Bureau of Statistics. Total Retail Sales of Social Consumer Goods in Beijing in May 2020. Available online: http://tjj.beijing.gov.cn/tjsj_31433/yjdsj_31440/sy_31814/2020/202006/t20200616_1925478.html (accessed on 16 June 2020).
- Petrovič, F.; Maturkanič, P. Urban-Rural Dichotomy of Quality of Life. Sustainability 2022, 14, 8658. [Google Scholar] [CrossRef]


| Field | Type | Length | Description |
|---|---|---|---|
| id | Int4 | 32 | Commercial Network ID. |
| Lon | Float8 | 53 | Longitude of the Commercial Network. |
| Lat | Float8 | 53 | Latitude of the Commercial Network. |
| Total consumption amount | Float8 | 53 | Total Daily Expenditure at the Commercial Network. |
| Entertainment_amount | Float8 | 53 | Daily Expenditure on Entertainment at the Commercial Network. |
| Daily necessities_amount | Float8 | 53 | Daily Expenditure on Daily Necessities at the Commercial Network. |
| Catering Category_Amount | Float8 | 53 | Daily Expenditure on Dining at the Commercial Network. |
| General service category_Amount | Float8 | 53 | Daily Expenditure on General Services at the Commercial Network. |
| Entertainment_number of entries | Float8 | 53 | Number of Entertainment Expenditure Transactions at the Commercial Network. |
| Daily necessities_number of transactions | Float8 | 53 | Number of Daily Necessities Expenditure Transactions at the Commercial Network. |
| Catering Category_Number of Transactions | Float8 | 53 | Number of Dining Expenditure Transactions at the Commercial Network. |
| General services_Number of transactions | Float8 | 53 | Number of General Services Expenditure Transactions at the Commercial Network. |
| Item | 2020/05 | Year-on-Year Ratio (%) |
|---|---|---|
| Retail Sales of Consumer Goods | 10,441,834 | −9.3 |
| Including: Online retail sales of wholesale and retail businesses, accommodation and catering businesses | 2,928,183 | 24.1 |
| By Commodity Use | ||
| Food Products | 2,054,977 | −12.8 |
| Clothing | 542,453 | −30.9 |
| Consumer Goods | 7,481,242 | −3.5 |
| Durable Goods | 363,162 | −41.5 |
| By Industry | ||
| Wholesale | 1,392,971 | −4.5 |
| Retail | 8,471,491 | −7.2 |
| Accommodation | 37,584 | −70.7 |
| Catering | 539,788 | −32.7 |
| By Region | ||
| Urban | 9,921,962 | −9.5 |
| Rural | 519,872 | −5.5 |
| By Consumption Form | ||
| Dining Revenue | 577,372 | −38 |
| Retail Sales of Goods | 9,864,462 | −6.8 |
Disclaimer/Publisher’s Note: The statements, opinions and data contained in all publications are solely those of the individual author(s) and contributor(s) and not of MDPI and/or the editor(s). MDPI and/or the editor(s) disclaim responsibility for any injury to people or property resulting from any ideas, methods, instructions or products referred to in the content. |
© 2023 by the authors. Licensee MDPI, Basel, Switzerland. This article is an open access article distributed under the terms and conditions of the Creative Commons Attribution (CC BY) license (https://creativecommons.org/licenses/by/4.0/).
Share and Cite
Shi, C.; Meng, B.; Yuan, Y.; Ou, Z.; Li, X. Examining Changes in Consumer Spatial Structure and Sustainable Development Issues in Beijing before and after the Outbreak of COVID-19. Sustainability 2023, 15, 16451. https://doi.org/10.3390/su152316451
Shi C, Meng B, Yuan Y, Ou Z, Li X. Examining Changes in Consumer Spatial Structure and Sustainable Development Issues in Beijing before and after the Outbreak of COVID-19. Sustainability. 2023; 15(23):16451. https://doi.org/10.3390/su152316451
Chicago/Turabian StyleShi, Changsheng, Bin Meng, Yuting Yuan, Zhiyuan Ou, and Xiaohang Li. 2023. "Examining Changes in Consumer Spatial Structure and Sustainable Development Issues in Beijing before and after the Outbreak of COVID-19" Sustainability 15, no. 23: 16451. https://doi.org/10.3390/su152316451
APA StyleShi, C., Meng, B., Yuan, Y., Ou, Z., & Li, X. (2023). Examining Changes in Consumer Spatial Structure and Sustainable Development Issues in Beijing before and after the Outbreak of COVID-19. Sustainability, 15(23), 16451. https://doi.org/10.3390/su152316451