Article

A Novel Process for the On-Site Preparation and Application of Polyferric Chloride (PFC) for Surface Water Treatment

by
Petros Gkotsis
1,
Manassis Mitrakas
2 and
Anastasios Zouboulis
1,*
1
Laboratory of Chemical and Environmental Technology, Department of Chemistry, Faculty of Sciences, Aristotle University of Thessaloniki, GR-54125 Thessaloniki, Greece
2
Analytic Chemistry Laboratory, Department of Chemical Engineering, School of Engineering, Aristotle University of Thessaloniki, GR-54124 Thessaloniki, Greece
*
Author to whom correspondence should be addressed.
Sustainability 2023, 15(23), 16416; https://doi.org/10.3390/su152316416
Submission received: 29 September 2023 / Revised: 10 November 2023 / Accepted: 27 November 2023 / Published: 29 November 2023
(This article belongs to the Section Bioeconomy of Sustainability)

Abstract

:
This is the first study to describe a novel, patented process for the on-site synthesis and subsequent direct utilisation of Polyferric Chloride (PFC) at low Fe concentration dosing, which aims to facilitate the potential replacement of Polyaluminium Chloride (PAC) during surface water treatment (e.g., from reservoirs) for drinking water production. For this purpose, the PFC was synthesised and subsequently used as a coagulant in simulated surface water samples under different synthesis and coagulation/flocculation conditions, namely for different pre-hydrolysed Fe concentrations, pre-hydrolysis pH, coagulation pH, and flocculation times. The effectiveness of PFC was examined mainly in terms of total organic carbon (TOC) removal and the residual Fe concentration. The obtained results showed that the pre-hydrolysed Fe concentration at 0.5 ± 0.25%, pre-hydrolysis at pH 2.5 ± 0.25, coagulation at pH 5.5–7.0 and a flocculation time of 5 min could result in the highest TOC removal (i.e., residual values < 0.60 mg/L) and the lowest residual Fe concentration (<5 μg Fe/L), which is acceptable for a water quality assessment. These values are also substantially lower when compared to the respective TOC and residual metal concentrations using PAC (usually, the relevant obtained values are around TOC > 1 mg/L and Al > 50 μg/L).

1. Introduction

Water from surface reservoirs (e.g., lakes, rivers, etc.) is used increasingly for the production of drinking water worldwide since the requirement for higher supplies of drinking water to serve larger population communities cannot be covered by the older (common) practice of well drilling processes. In Greece, more than 50% of the country’s population receives drinking water from surface reservoirs after proper treatment. The surface water can meet the quantitative quality requirements; however, it may present relatively higher concentrations of suspended solids and of Natural Organic Matter (NOM), even seasonally, which can result in bad odour and taste problems for the treated water [1,2]. For this reason, various treatment technologies have been applied to remove effectively suspended solids and organic compounds (mainly NOM) from surface waters. Conventional water treatment technologies include coagulation/flocculation, sedimentation, filtration (with simple filter media, e.g., sand filters), and disinfection processes, while advanced treatment technologies usually refer to the application of membrane separation processes, such as microfiltration or ultrafiltration [3,4]. The latter presents the advantages of superior effluent quality and easy operation; however, their widespread application is still limited due to membrane fouling and high membrane costs. Coagulation/flocculation is a mature technology that continues to present a critical role in the removal of colloidal particles, such as NOM [5,6].
Until around 2000, aluminium sulphate (Al2(SO4)3) was mostly used as the main coagulant agent, as well as some iron salts (e.g., Fe2(SO4)3, FeCl3), though to a lesser extent, for the treatment of surface waters. The effectiveness of aluminium or iron coagulants for the sufficient removal of suspended particles and colloids can be explained mainly by two subsequent mechanisms: (i) the charge neutralisation of negatively charged colloids by the products of metal salt hydrolysis and (ii) the entrapment of impurities in the amorphous precipitates of metal hydroxides (“sweep flocculation”) [7]. However, these coagulants have been replaced during recent decades mainly by pre-polymerised aluminium chloride (PAC), which presents a superior performance mainly in terms of NOM removal. When simple aluminium or iron salts, such as Al2(SO4)3 or Fe2(SO4)3, are employed, rapid precipitation can occur, and the formation of corresponding metal hydroxides, namely Al(OH)3 and Fe(OH)3, results in a reduction in positive surface charges and, consequently, decreases the adsorption of negatively charged organic colloids which initially occurs. On the contrary, during the application of pre-polymerised coagulants, such as PAC, the respective precipitation process is delayed; therefore, a better adsorption and removal of NOM can be achieved [8,9,10].
The addition of PAC improves the removal of organic colloids, but the residual aluminium concentrations can be higher than 50 µg Al/L (the stricter imposed limit for the permissible Al concentration) due to the formation of A l ( O H ) 4 (Figure 1). Although this is much lower than the maximum allowable potable limit (200 µg Al/L), it may still contribute to the gradual bioaccumulation of aluminium in the brain, which has been associated with several neurodegenerative diseases, such as Alzheimer’s disease (AD), Parkinson’s disease, amyotrophic lateral sclerosis, and dialysis encephalopathy [11]. Al-mediated neurodegeneration resulting in cognitive dysfunction has been linked with elevated amyloid precursor protein (APP) expression, amyloid b deposition, impaired cholinergic projections, and apoptotic neuronal death [12,13]. Apart from health-related issues, the occurrence of Al in treated waters, or as a precipitate/deposit in the distribution system, has also been associated with several operational problems, such as increased turbidity, reduced disinfection efficiency, and the loss of hydraulic capacity [14,15,16]. Furthermore, Khaneghah et al. [17] reported studies on leachate treatment with Fe- and Al-based coagulants, where the utilisation of Fe salts in a lower dose and wider pH range exhibited improved coagulation and flocculation results compared to Al salts [18,19]. Finally, the commercially produced PAC, which can be maintained and applied for larger periods of time, e.g., for 1–2 months, contains relatively higher concentrations of dissolved Al (typically 8 ± 1%) and may result in the degradation of coagulation efficiency due to the lower pre-hydrolysis achieved and reduced surface charges.
For these reasons, pre-polymerised iron has recently attracted more attention in the field of water treatment. During the last decade, Polyferric Chloride (PFC), which contains a range of pre-hydrolysed Fe(III) species with a high positive surface charge, has been increasingly considered because it is more effective than the conventional Fe-based coagulants for water treatment [20,21,22,23]. PFC contains a range of pre-hydrolysed Fe(III) species with high positive surface charges. The aqueous Fe(III) ion undergoes a series of complex oligomerisation reactions. As a result, although a simple iron compound/salt (e.g., FeCl3) can be used as a coagulant agent, several Fe(III) species can possibly form following its dissolution, depending on the applied pH and Fe3+ concentration (Figure 2). As shown in Figure 2a, at a low Fe3+ concentration (i.e., 10−5 M), the following species can identified: F e ( H 2 O ) 6 3 + (abbreviated as Fe3+), F e H 2 O 5 ( O H ) 2 + (abbreviated as F e ( O H ) 2 + ), F e H 2 O 4 ( O H ) 2 + (abbreviated as F e ( O H ) 2 + ), F e H 2 O 3 ( O H ) 3 (abbreviated as Fe ( O H ) 3 ) and F e H 2 O 2 ( O H ) 4 (abbreviated as F e ( O H ) 4 ). The distribution of different Fe(III) forms contains mainly mononuclear species, but multiple species can also be formed depending on the pH value of the solution. At higher Fe3+ concentrations (e.g., 0.1 M), a few oligomeric species containing three or four iron atoms can also be observed (Figure 2b). These species include mainly Fe3+, F e ( O H ) 2 + , F e 2 ( O H ) 2 4 + , F e 3 ( O H ) 4 5 + , F e ( O H ) 2 + , Fe ( O H ) 3 , F e ( O H ) 4 . The species with increased positive charges can enhance the removal of negatively charged organic colloids and, thus, can result in better coagulation performance [24,25]. Additionally, the PFC has shown improved performance when compared to pre-polymerised aluminium in several cases; Zhan et al. [26] employed PFC and PAC to treat the Yellow River water and showed that the removal efficiency of UV254nm, Dissolved Organic Carbon (DOC) and permanganate index parameters were found to be 29.2%, 26.1%, and 27.9%, respectively, after coagulation with PAC, whereas they were 32.3%, 23.3%, and 32.9% after coagulation with PFC. Li et al. [27] utilised pyrite cinders to prepare three PFC products and showed how some of them exhibited improved coagulation characteristics when compared to PAC during municipal wastewater treatment.
Figure 1. Distribution of aluminium hydrolysis products (Al3+)x(OH)y for the commonly applied 1.85·10−6 M Al(III) concentration (the observed main species are Al3+, A l ( O H ) 2 + , A l ( O H ) 2 + , A l ( O H ) 3 , A l ( O H ) 4 and A l ( O H ) 5 2 ) [24].
Sustainability 15 16416 g001
Based on these aforementioned findings, there is a need to further investigate PFC, especially regarding synthesis and application as a coagulant in wastewater and water treatment, with a view to potentially replacing the conventional PAC. This is beneficial not only for the efficiency of the coagulation process but also for its overall impact on the environment and its long-term sustainability. To the author’s best knowledge, this is the first study to demonstrate a novel, patented process for the on-site synthesis and subsequent, direct use of Polyferric Chloride (PFC) with a low Fe concentration, facilitating the possible replacement of PAC in surface water treatment for potable use. In order to achieve this, the effect of four main sets of operating parameters was studied regarding the total organic carbon (TOC) removal (through the UV254nm determination) and the residual Fe by examining simulated surface water samples, i.e., (i) pre-hydrolysis pH (values: 2.25, 2.50, 2.75 or 3.00), (ii) coagulation pH (values: 5.5, 6.0, 6.5, 7.0, 7.5 or 8.0), (iii) pre-hydrolysed Fe concentration (values: 2500, 5000, 7500 or 10,000 mg/L, or 0.045, 0.09, 0.134 or 0.179 M, respectively), and (iv) flocculation time (5, 10, 15, 30, 60 or 120 min). This is the first systematic study to establish an integrated, standardised methodology for the on-site preparation and direct utilisation of PFC by applying a low pre-hydrolysed iron concentration for drinking water treatment, aiming to replace PAC in its respective use.

2. Materials and Methods

2.1. Preparation of Simulated Surface Water

The simulated surface water samples are prepared after the addition of humic acid (HA), which is the main component of NOM [28], and kaolin fine powder (commercial clay, Al2Si2O5(OH)4), both at concentrations of 10 mg/L in tap water, which is then pre-filtered (1 μm) using a Granular-Activated Carbon (GAC) dichlorination column (Figure S1, see Supplementary Materials). The produced surface water samples simulate, in terms of NOM and turbidity, the surface water of the Aliakmon River reservoir, which has been treated using the Thessaloniki Water Treatment Plant (TWTP) since 2003 with an overall capacity of 150,000 m3/d [29].

2.2. Preparation of Polyferric Chloride (PFC)

2.2.1. Preparation of PFC at Laboratory Scale

Polyferric Chloride (PFC) is prepared after the addition of 1 N of NaOH to different aqueous Fe(III) solutions (2500, 5000, 7500, and 10,000 mg/L), which are prepared by dissolving the appropriate amount of the solid salt FeCl3∙6H2O in deionised water. NaOH is added dropwise via a burette under mild stirring at room temperature (~20 °C) (Figure S2, see Supplementary Materials). When the desired pH value is achieved (i.e., 2.25, 2.50, 2.75, and 3.00), the addition of NaOH is interrupted, and the mixture is stirred for 2 h. After magnetic stirring, the mixture is allowed to remain for 24 h at room temperature; if no phase separation is observed, it can be described as suitable for application in the coagulation process.

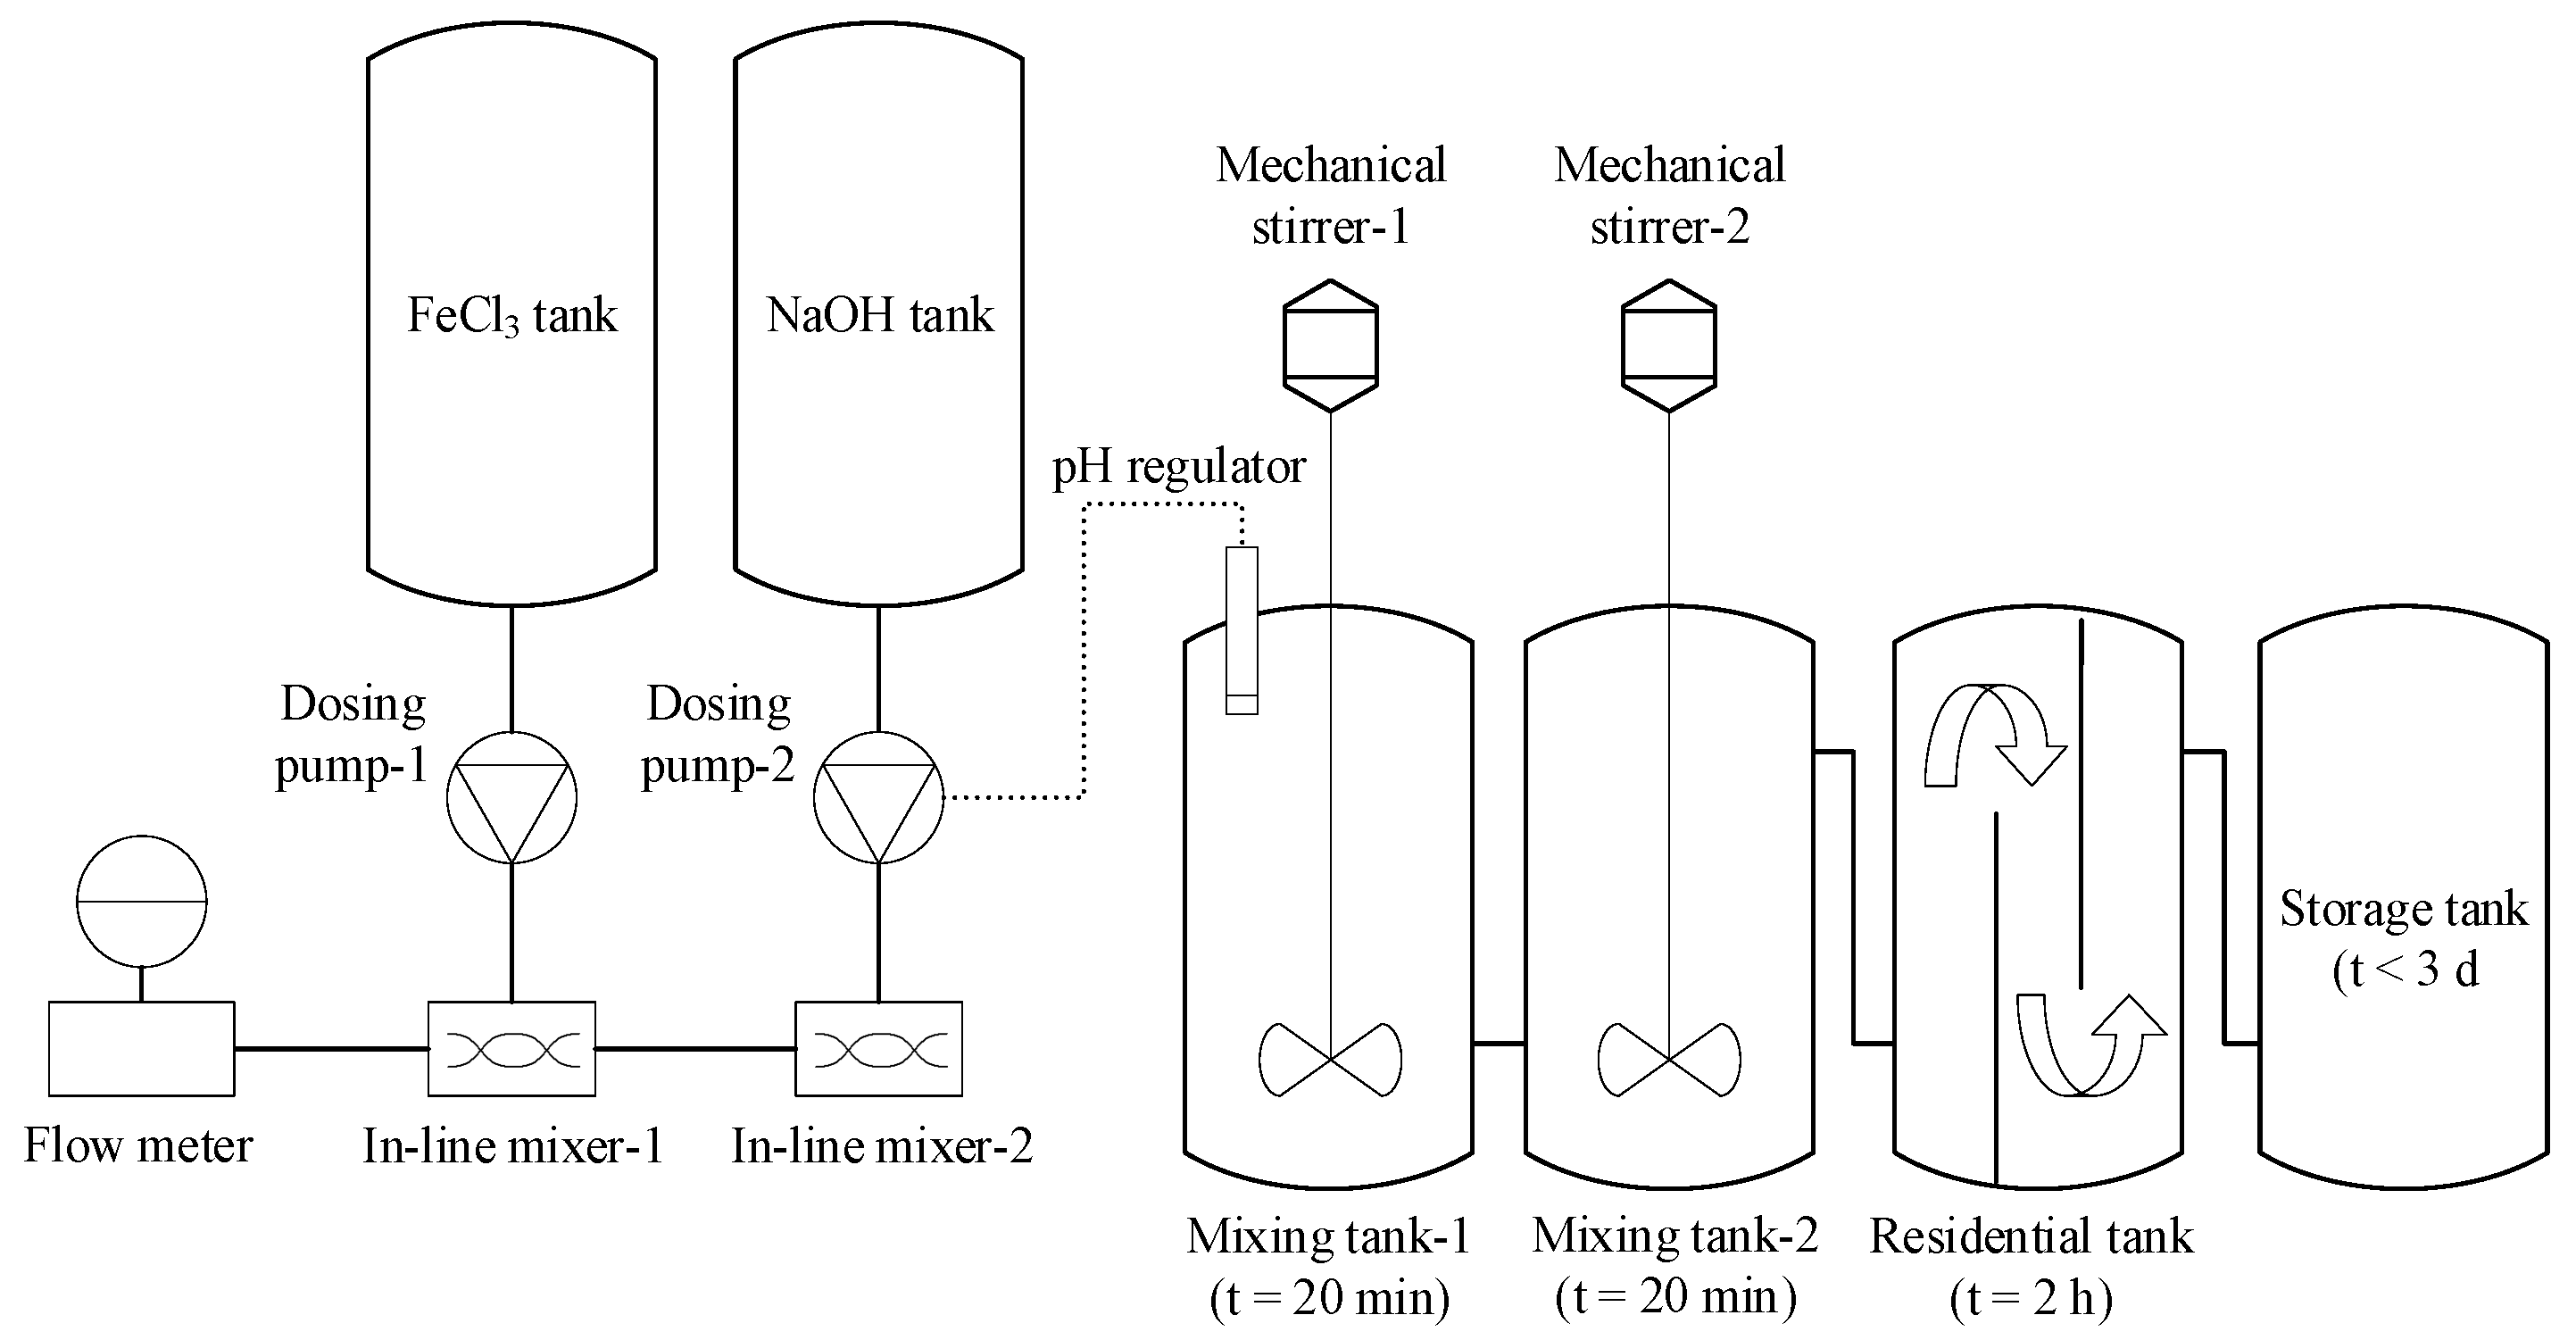
2.2.2. Patented Process for the Pilot-Scale Production and Utilisation of PFC

Figure 3 shows the proposed method for the on-site preparation and direct utilisation of Polyferric Chloride (PFC) as a coagulation reagent for surface water treatment at the pilot scale. For the registration of this invention/method, a patent application with reference no. 20230100369 has been filed to the Industrial Property Organization of Greece [30]. Water is supplied at a constant flow rate and mixed in series with FeCl3 and NaOH solutions, which are transferred via dosing pumps. After adjusting the flow rates to achieve an iron concentration of 0.5 ± 0.25% w/v and pH of 2.5 ± 0.25, the acquired solution is mechanically mixed in consecutive mixing tanks for 20 min. The prepared PFC solution is left for 2 h in a residential tank, and then it is stored for a maximum time of 3 days before application on surface water treatment. To the author’s best knowledge, the aforementioned operating conditions are applied for the first time in a novel process that aims to achieve the synthesis and direct, on-site (pilot- or industrial-scale) use of pre-polymerised coagulants at low metal concentrations. By contrast, commercially produced pre-polymerised coagulants contain relatively high concentrations of dissolved metal (typically 8 ± 1%) and are usually maintained and applied after large periods of time, e.g., 1–2 months; as a result, coagulation efficiency is degraded due to the lower level of pre-hydrolysis achieved and reduced surface charges.

2.3. Coagulation/Flocculation Process

Before the coagulation/flocculation process, the simulated surface water samples (prepared according to the procedure as described in Section 2.1) are stirred slowly for 24 h in order to achieve the effective dissolution and uniform dispersion of humic acid and kaolin powder. Following this 24 h period, the process of coagulation/flocculation is conducted at six pH values (5.5, 6.0, 6.5, 7.0, 7.5, and 8.0) in a common jar test apparatus (Aqualytic) with a six-place gang stirrer, driven by a common electric motor (Figure S3, see Supplementary Materials). Firstly, the PFC is added to (simulated) surface water at 2.5 mg/L under rapid mixing conditions (160 rpm for 2 min and 15 s—coagulation stage). Then, a commonly used water-soluble organic polymer/flocculant is added to the surface water at a 0.05 mg/L concentration under slow mixing conditions (45 rpm for 10 min—flocculation stage). The same flocculant is also applied in the full-scale facilities of the Thessaloniki Water Treatment Plant (TWTP), which treats surface water from the last reservoir of the Aliakmon River. After the flocculation step, slow mixing is extended for 2 h; during this 2h period, samples are obtained at regular time intervals, i.e., after 5, 10, 15, 30, 60, and 120 min in order to examine the effect of excess flocculation time on the removal of humics and on the residual Fe.
To summarise, the examined parameters, regarding their influence on the removal of humics and on residual Fe, are the following:
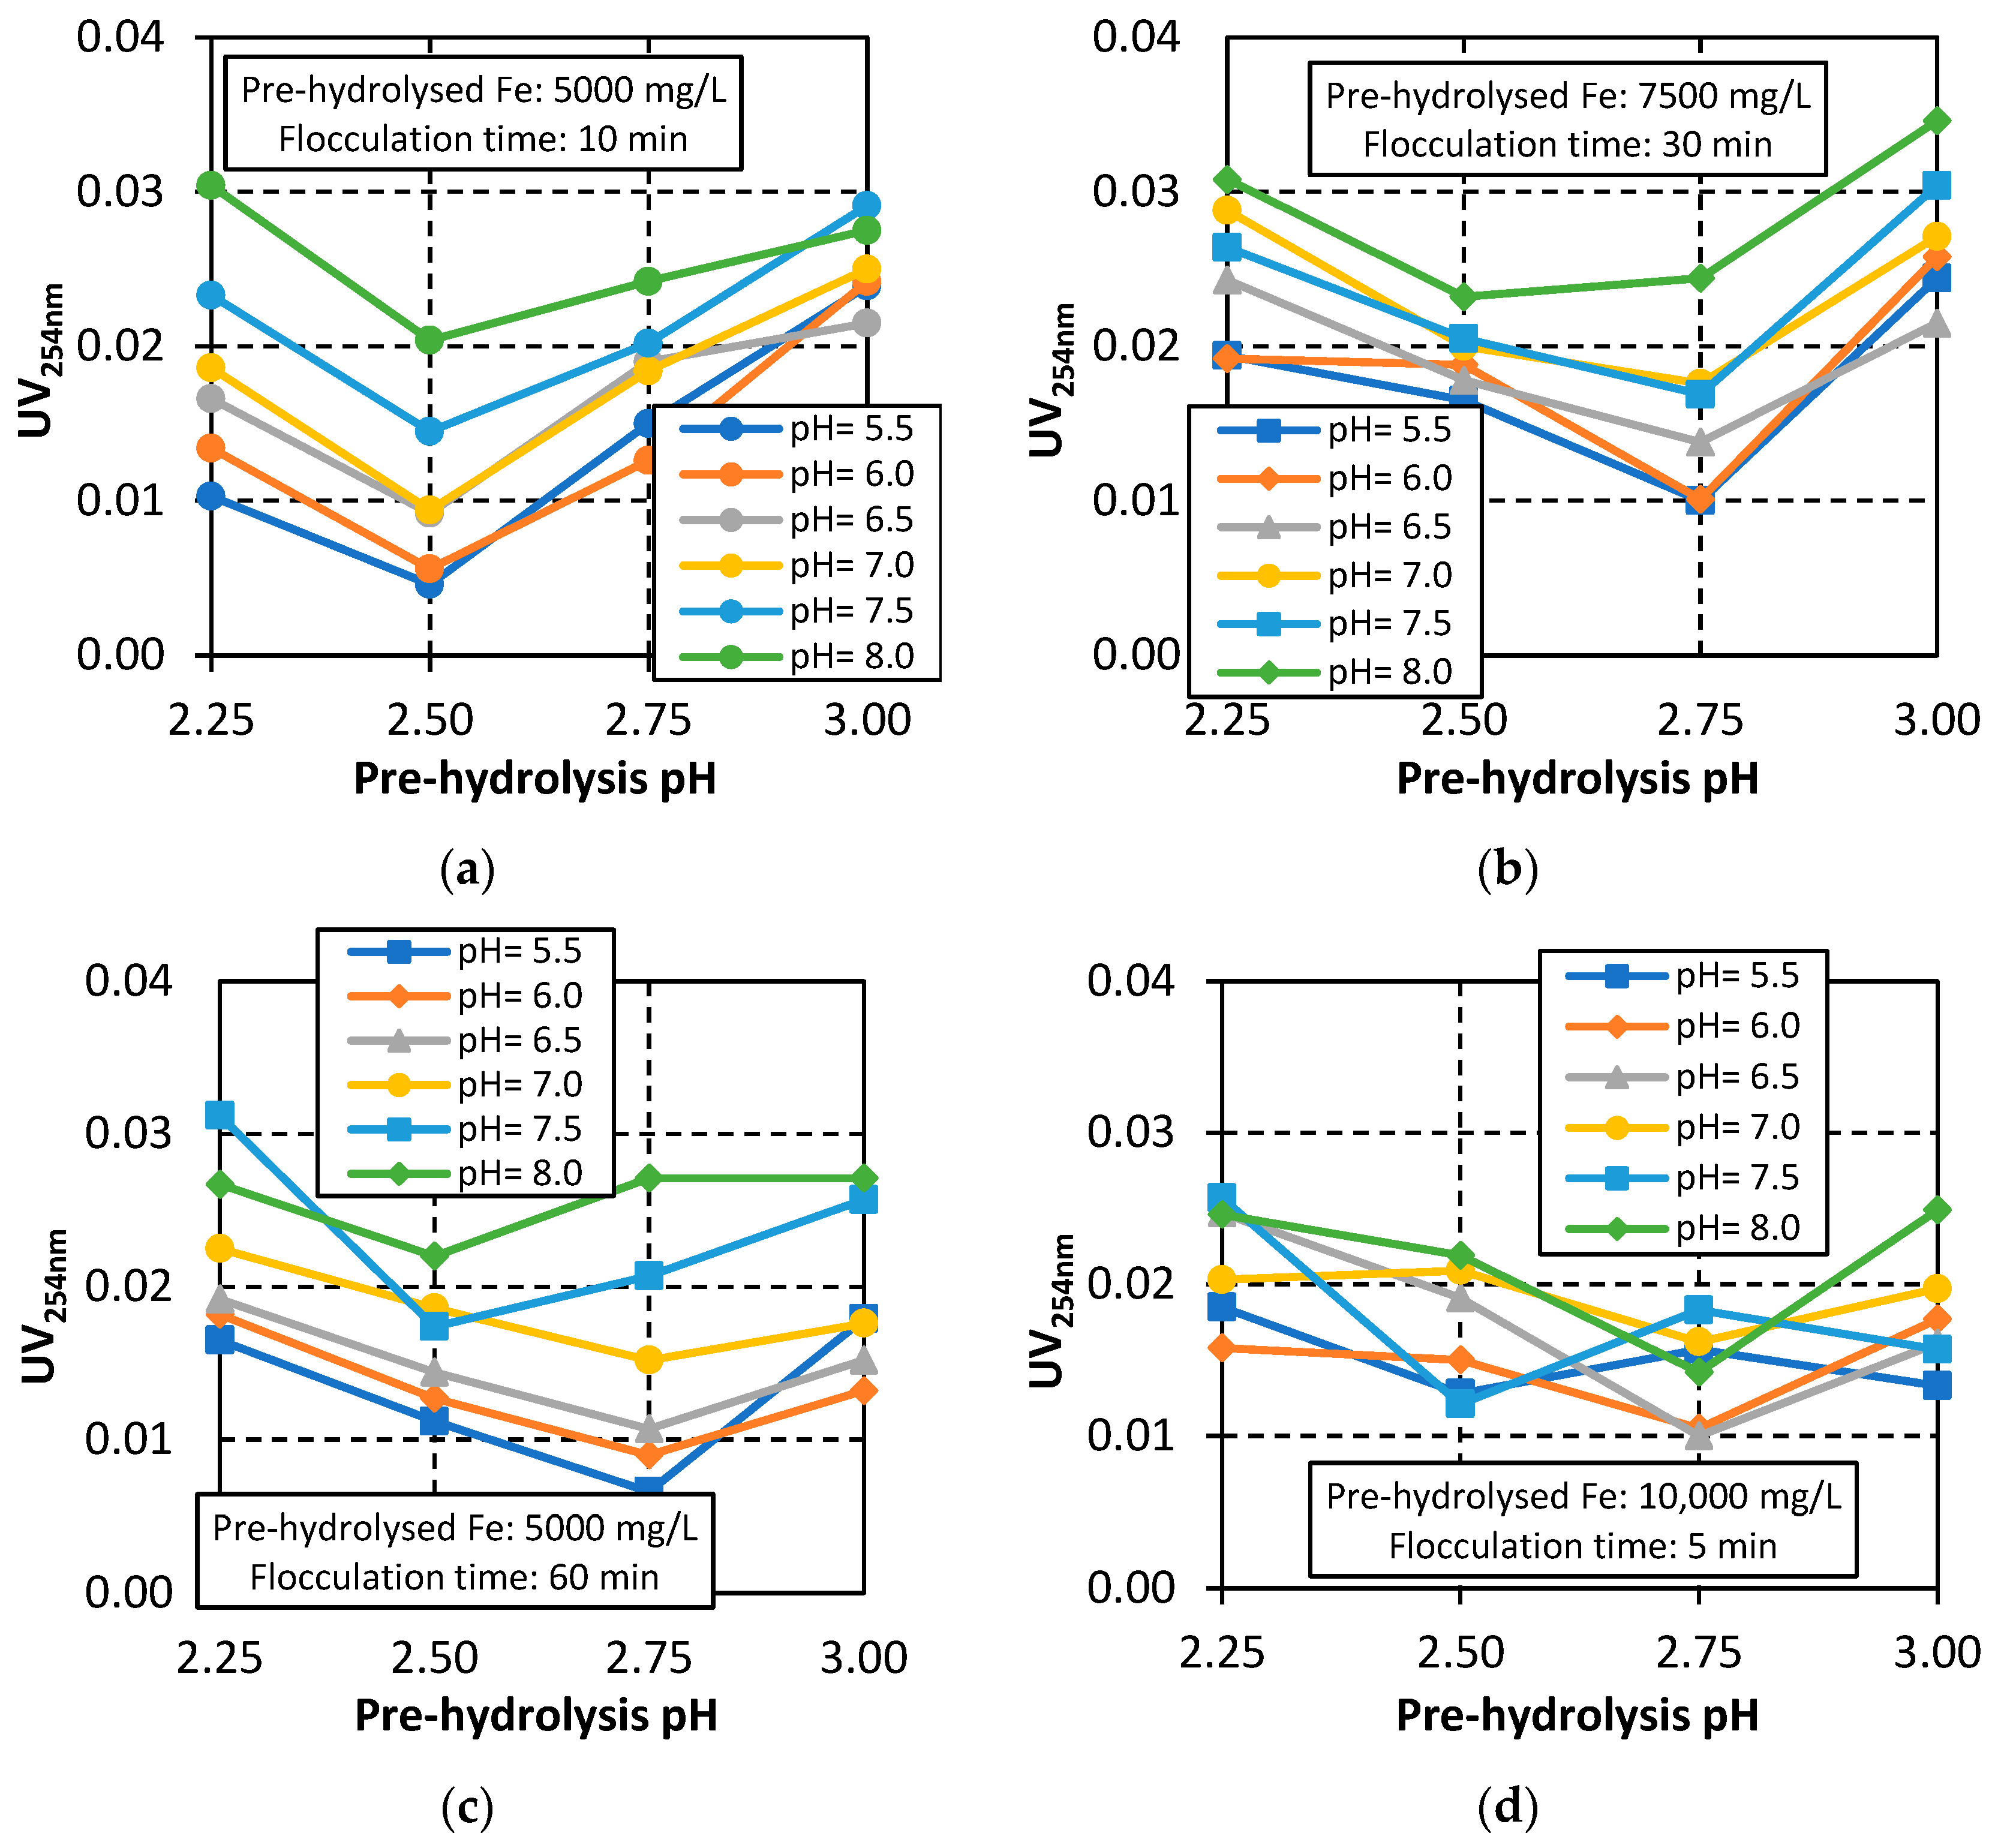
  • Pre-hydrolysis pH (values: 2.25, 2.50, 2.75, and 3.00).
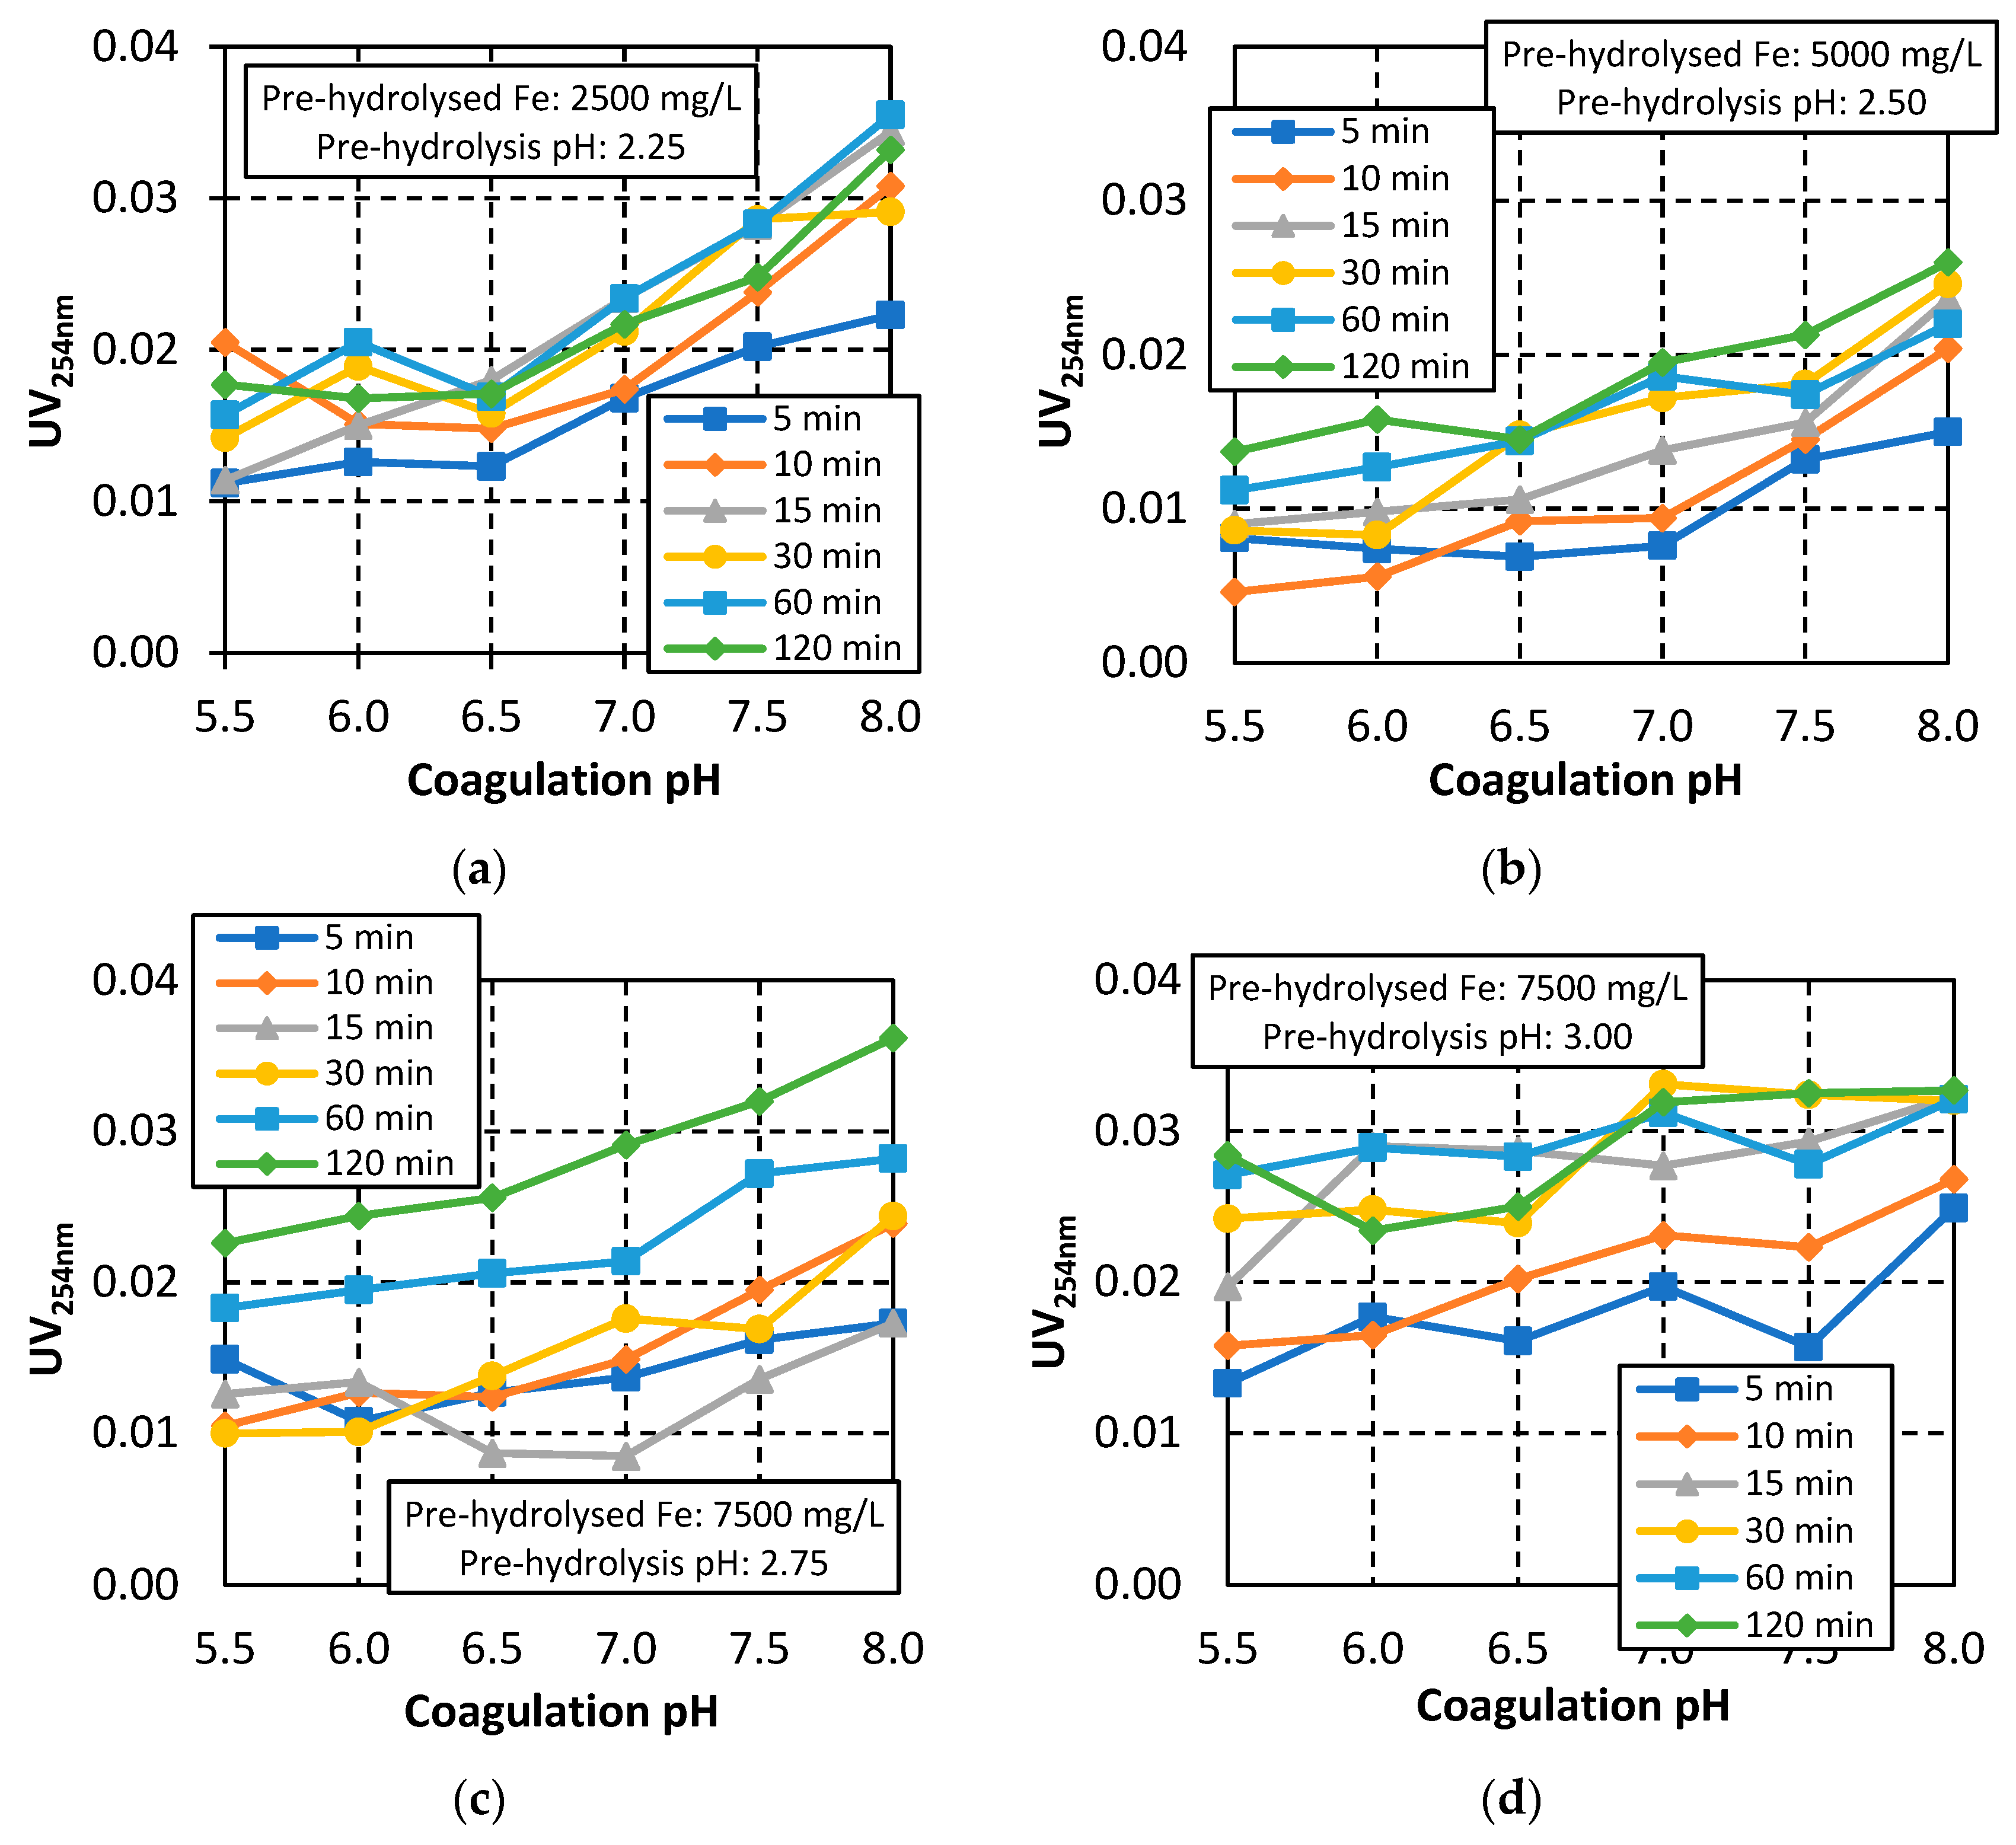
  • Coagulation pH (values: 5.5, 6.0, 6.5, 7.0, 7.5, and 8.0).
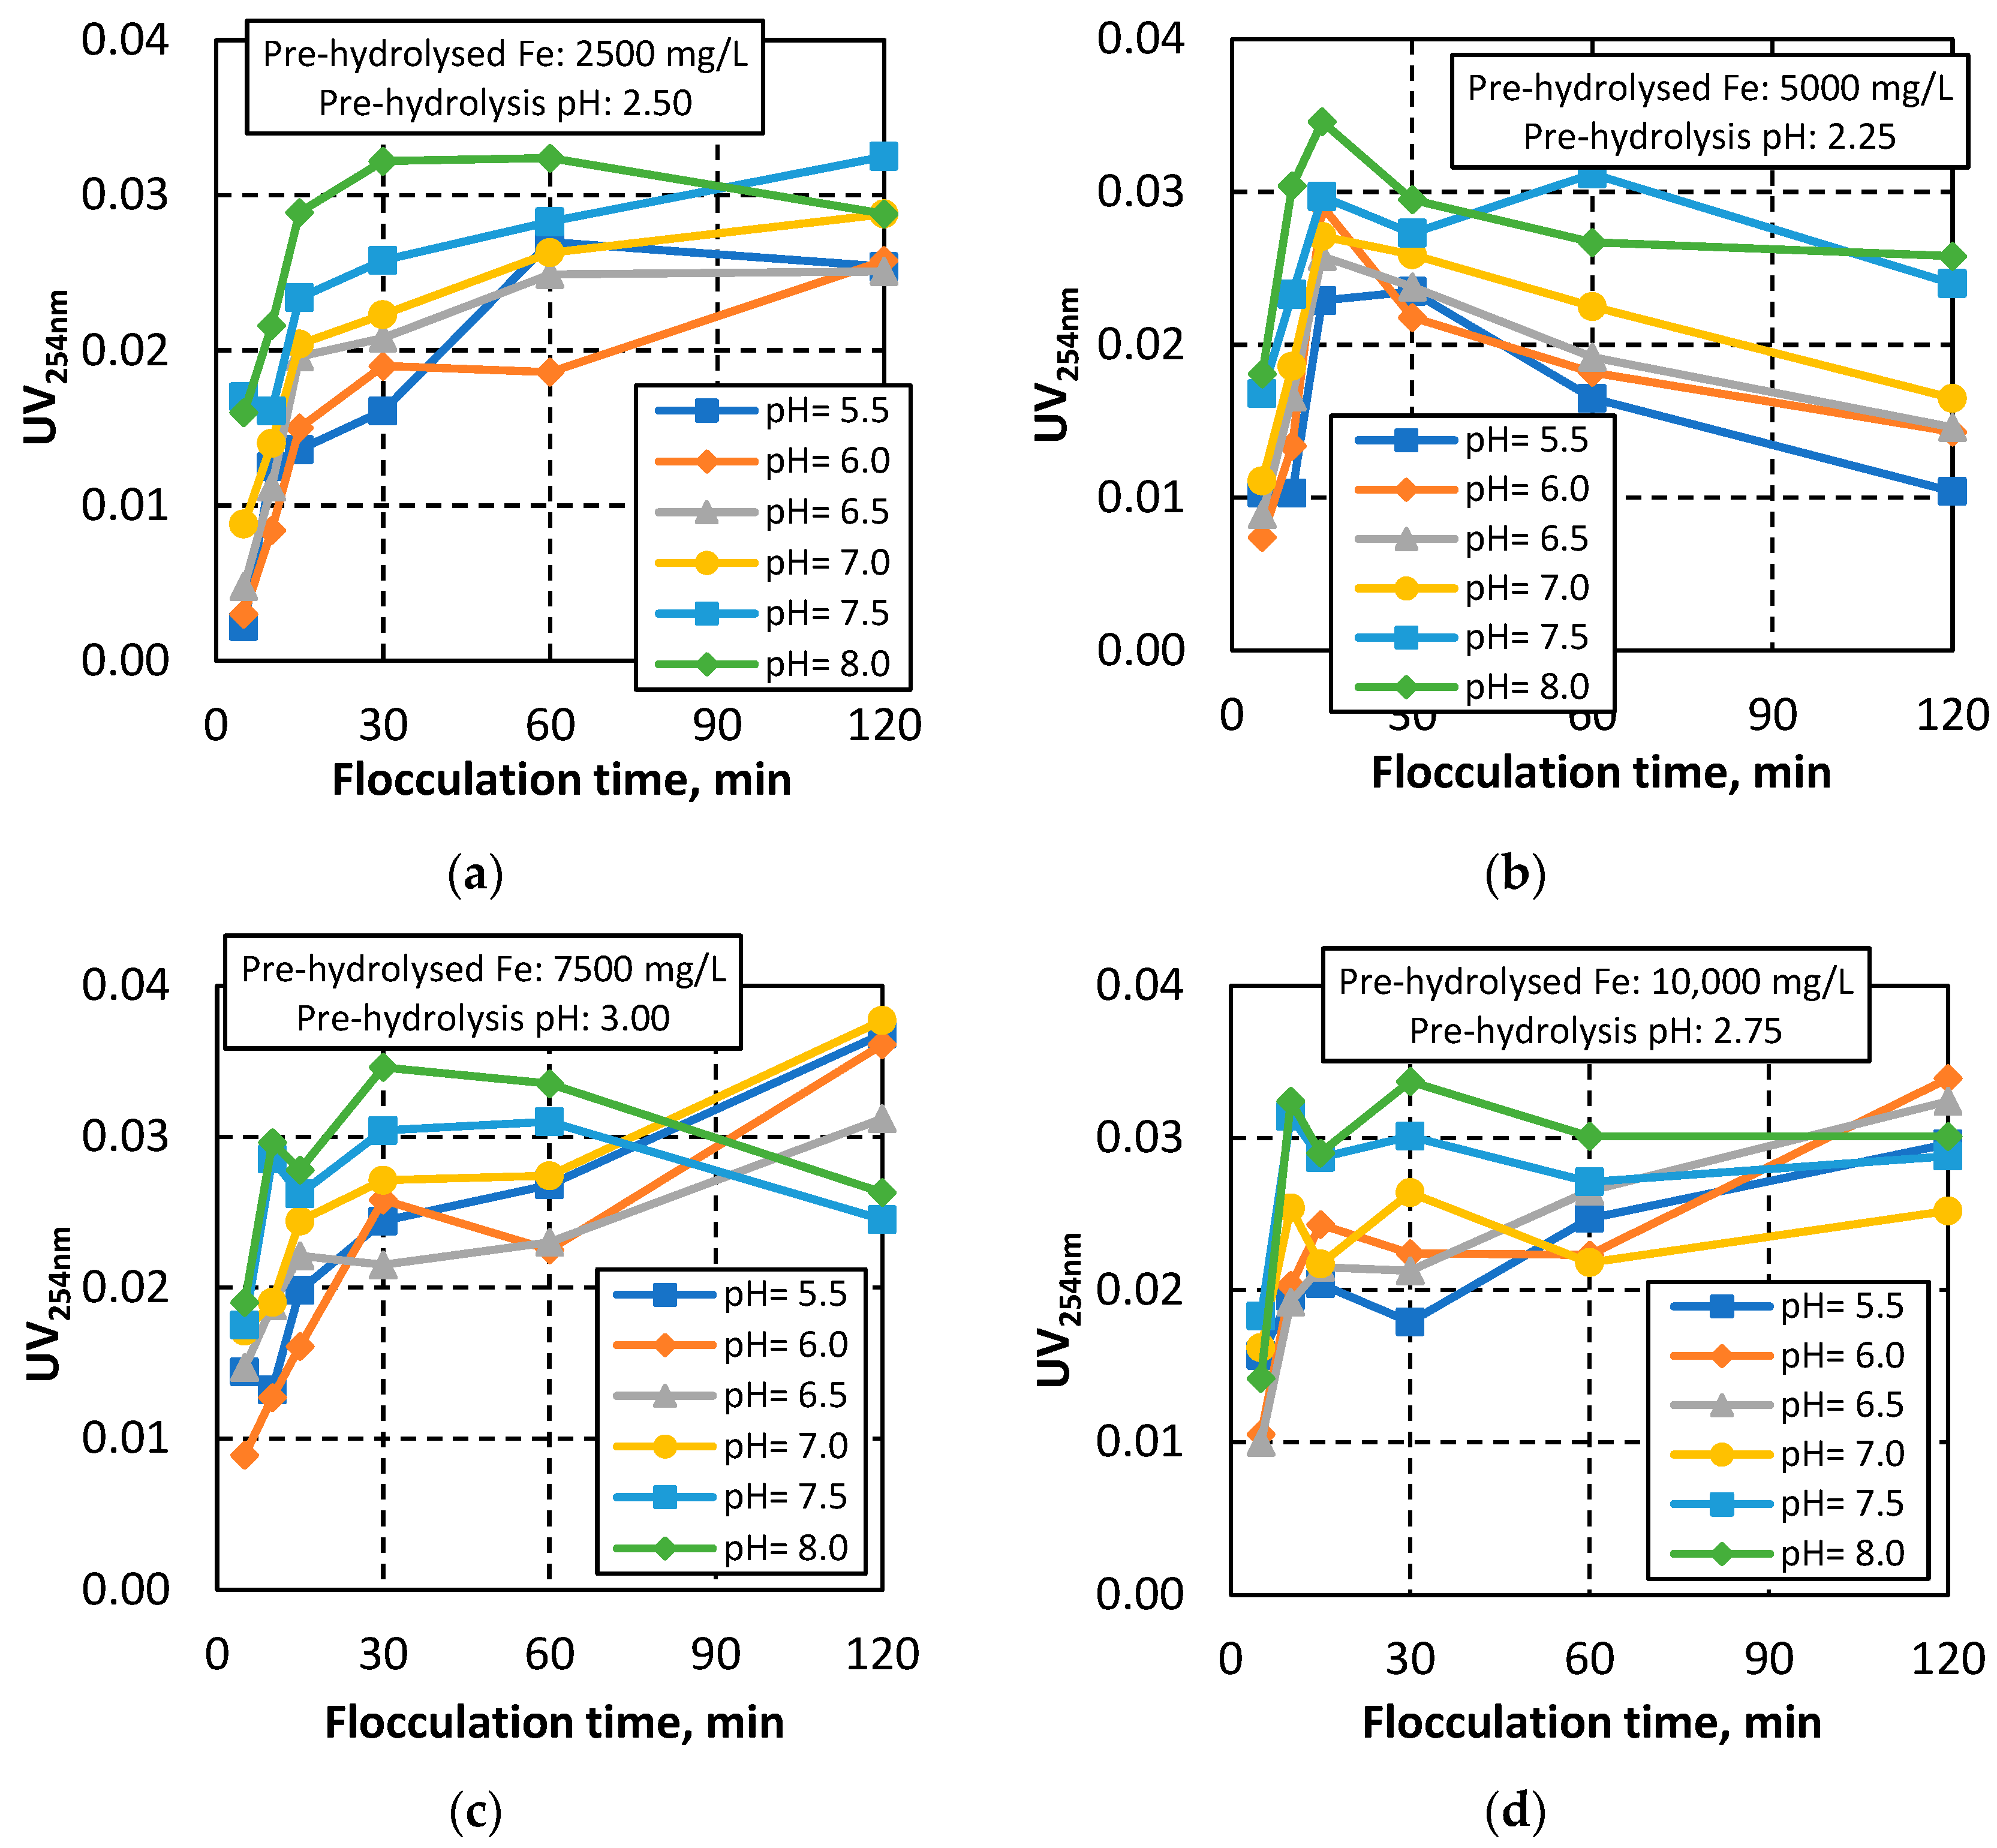
  • Concentration of pre-hydrolysed Fe (values: 2500, 5000, 7500, and 10,000 mg/L).
  • Flocculation time (values: 5, 10, 15, 30, 60, and 120 min).
The removal of NOM (humics) is examined in terms of total organic carbon (TOC) removal, which is calculated after measuring the UV254nm in a Perkin Elmer Lambda 25UV/Vis spectrophotometer and correlating the UV254nm value with the TOC from the respective standard curve (Figure S4, see Supplementary Materials). Similarly, the calculation of residual Fe was based on the measurement of absorbance at 510 nm in a Hach Lange DR3900 Vis spectrophotometer (Figure S5, see Supplementary Materials).

3. Results and Discussion

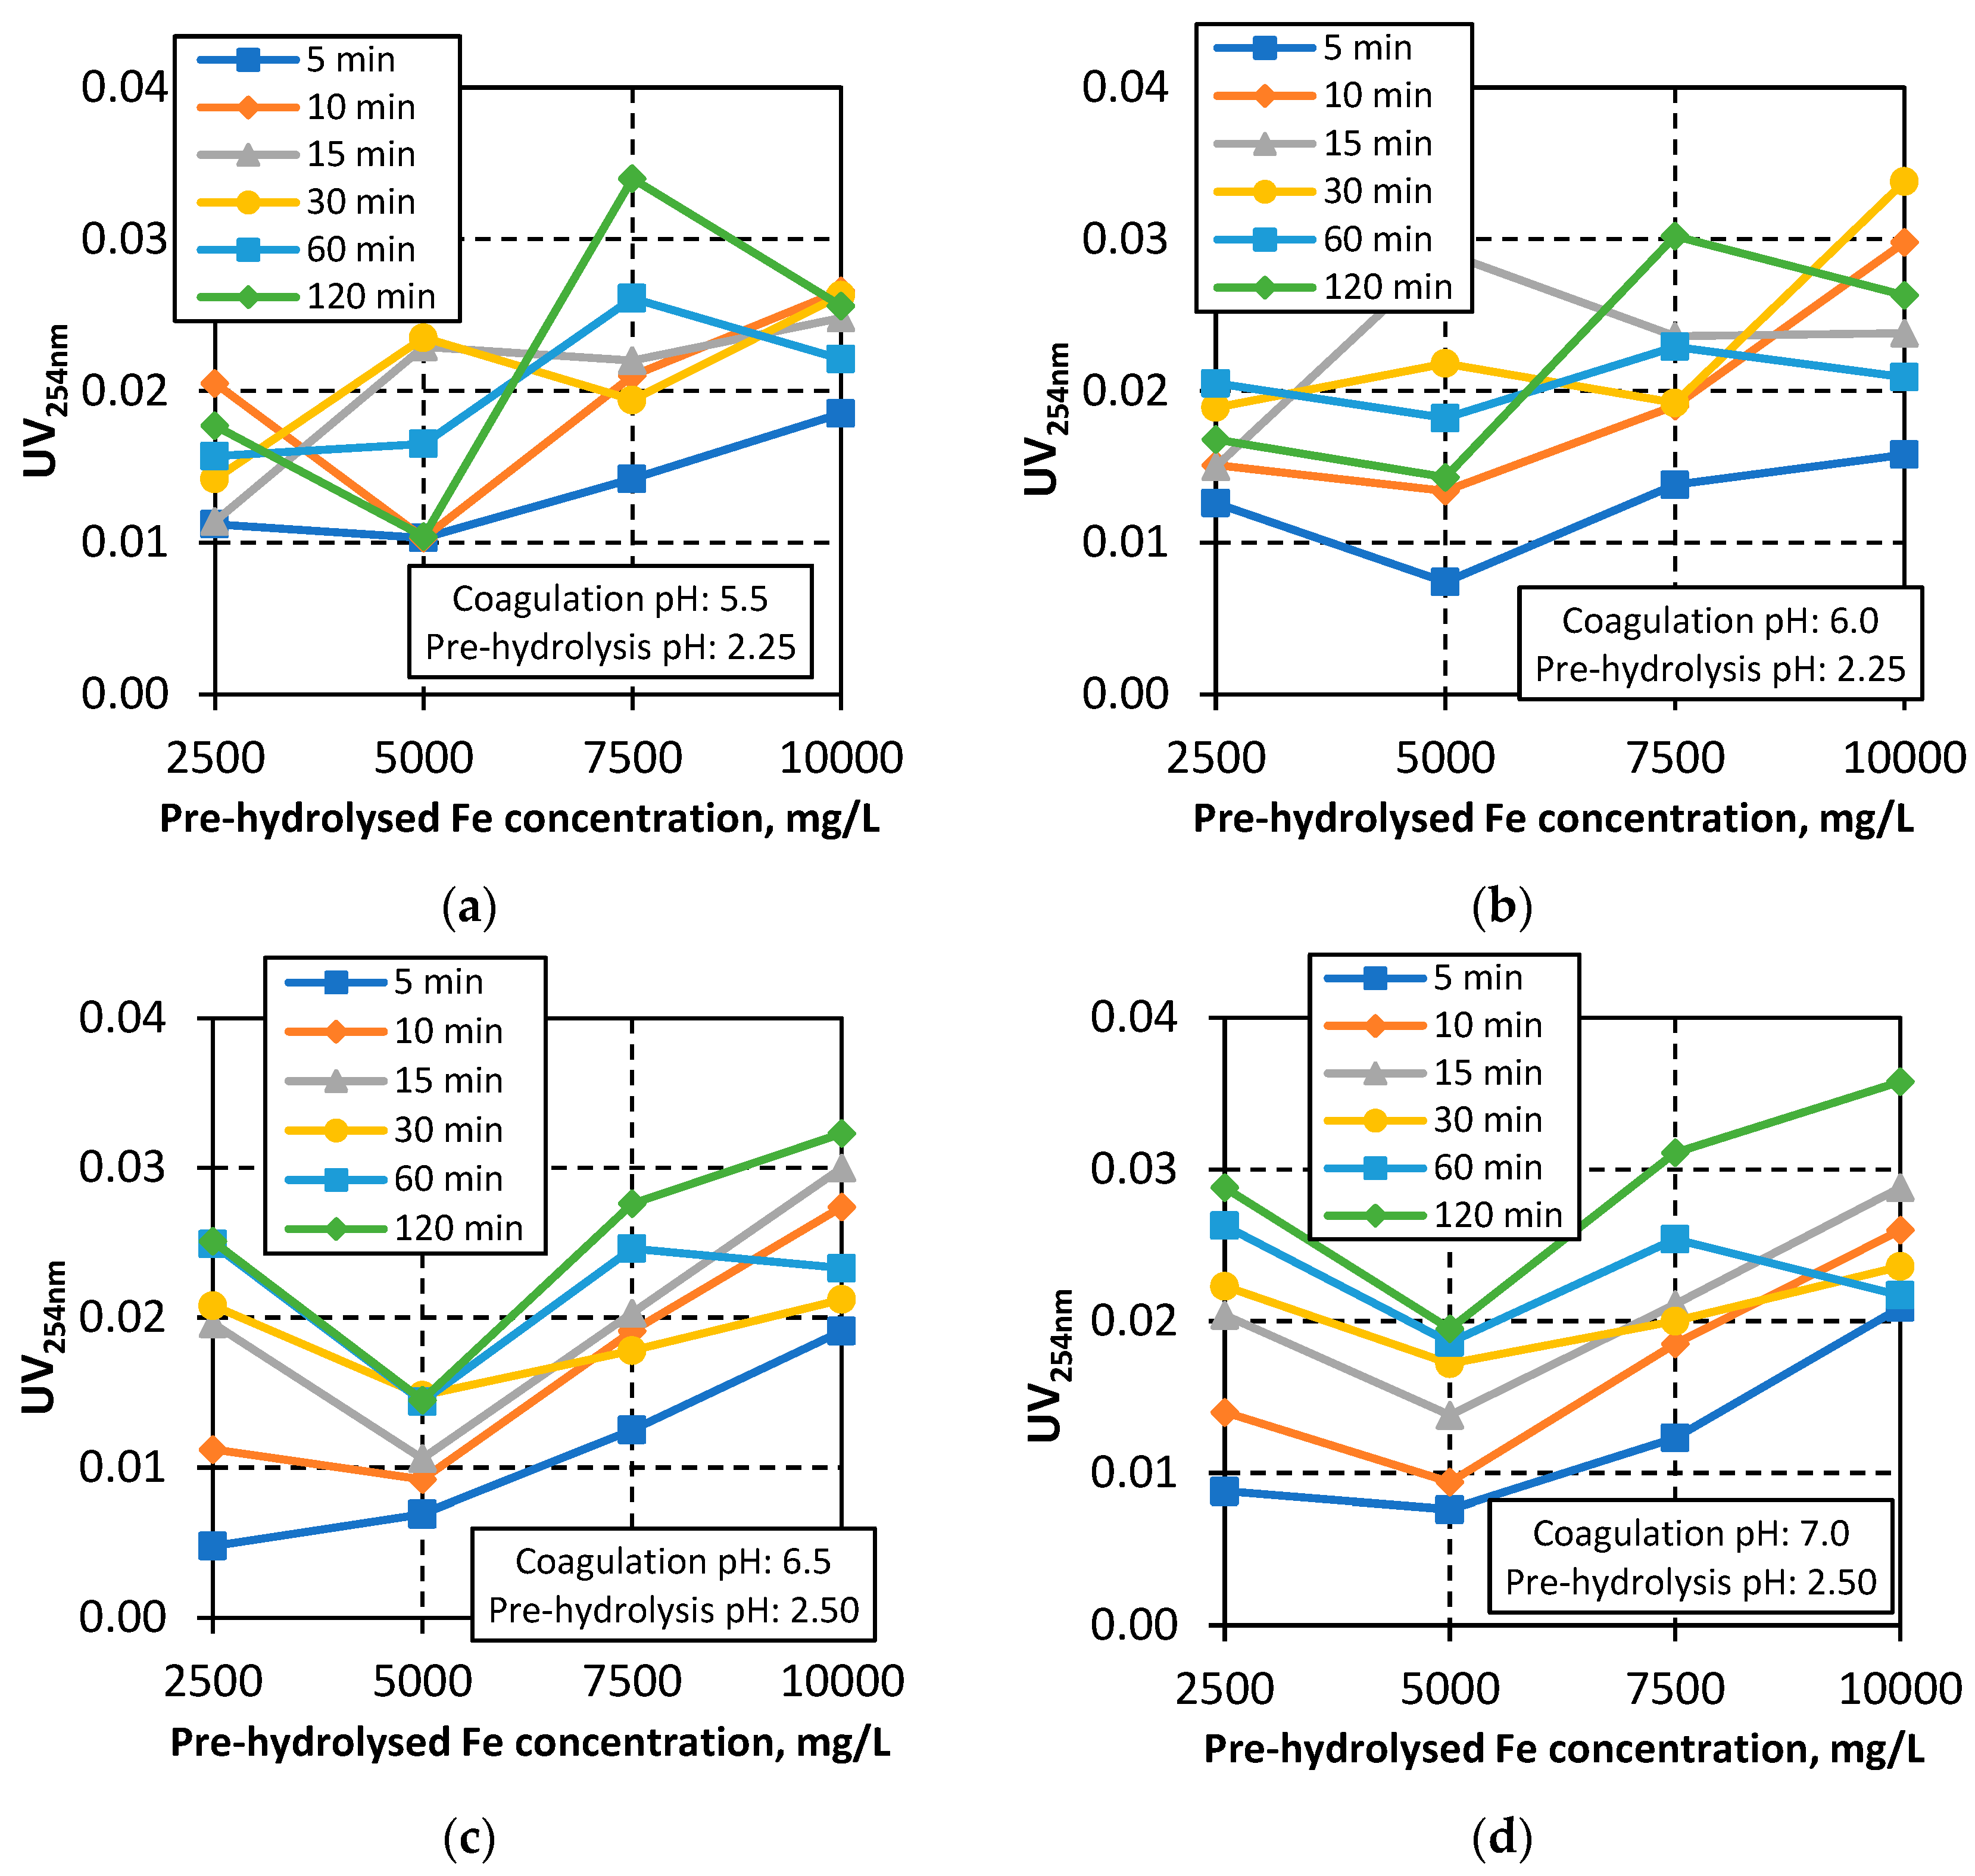
3.1. Study of UV254nm Removal

The removal of humics was studied in terms of UV254 nm measurements. In this section, the effect of the examined parameters (i.e., pre-hydrolysis pH, coagulation pH, pre-hydrolysis Fe concentration, and flocculation time) on the UV254nm changes was investigated.

3.1.1. Effect of Pre-Hydrolysis pH on UV254nm

Figure 4 shows the effect of pre-hydrolysis pH on the UV254nm measurements for all examined coagulation pH values, including indicatively for various combinations of pre-hydrolysed Fe concentrations and flocculation times. In general, the higher removal of humics is observed at the pre-hydrolysis pH values of 2.50 and 2.75. Specifically, regarding the pre-hydrolysed Fe concentration at 5000 mg/L and the flocculation time of 10 min (Figure 4a), as the pre-hydrolysis pH increases, the UV254nm value initially decreases, reaching its lowest value at the pre-hydrolysis pH of 2.50 before increasing and reaching the highest value at a pre-hydrolysis pH of 3.00. The same trend is observed for the pre-hydrolysed Fe concentration at 7500 mg/L and the flocculation time of 30 min (Figure 4b), as well as for the pre-hydrolysed Fe concentration at 5000 mg/L and flocculation time of 60 min (Figure 4c); however, the lowest UV254nm values are observed for the pre-hydrolysis pH of 2.75. Although the aforementioned trend is not as clear, when concerning the pre-hydrolysed Fe concentration at 10,000 mg/L and flocculation time of 5 min (Figure 4d), in most cases, UV254nm still achieves its lowest value either at the pre-hydrolysis pH of 2.50 or 2.75. For these pre-hydrolysis pH values, the ionisation of iron is higher, leading to the (partial or complete) neutralisation of the negatively charged humics. As a result, the flocculation of particles and, consequently, their removal is enhanced. Regarding total organic carbon, TOC remained <0.85 mg/L for all examined pre-hydrolysis pH values, while the lowest TOC value (0.56 mg/L), corresponding to UV254nm = 0.004, was obtained for the following conditions: a pre-hydrolysis pH of 2.50, a coagulation pH of 7.5, a pre-hydrolysed Fe concentration of 5000 mg/L and a flocculation time of 10 min.

3.1.2. Effect of Coagulation pH on UV254nm

Figure 5 presents the effect of the coagulation pH on UV254nm measurements for all examined flocculation times and indicatively for various combinations of pre-hydrolysed Fe concentrations and pre-hydrolysis pH values. As shown, the UV254nm generally increases as the coagulation pH increases and the lowest values of UV254nm are usually observed for the coagulation pH values of 5.5–7.0. When the pH of the coagulation is lower than 7.0, the positively charged iron can almost completely neutralise the negative surface charge of humics, hence, increasing their destabilisation and enhancing their flocculation/removal. When the coagulation pH is close to 7.0 (which is the isoelectric point of dissolved Fe), the amorphous precipitate of insoluble Fe(OH)3 can be formed, which incorporates and, thus, also removes (partly) the particle content. However, a further increase in coagulation pH (i.e., >7.0) results in the formation of soluble anionic iron forms, which do not favour the neutralisation charge and, consequently, the flocculation and particle removal. The effect of coagulation pH on UV254nm measurements is particularly evident for the low pre-hydrolysed Fe concentrations and the low pre-hydrolysis pH values (Figure 5a,b), where the rate of increasing UV254nm values is relatively high, as the coagulation pH increases, while the UV254nm values at the higher pre-hydrolysed Fe concentrations and pre-hydrolysis pH values (Figure 5c,d) also increase, but at a lower rate. Regarding total organic carbon, TOC remained <0.85 mg/L throughout all the examined coagulation pH values, while the lowest TOC value (0.56 mg/L) was obtained for the following conditions: a coagulation pH of 5.50, a flocculation time of 10 min, a pre-hydrolysed Fe concentration of 5000 mg/L and pre-hydrolysis pH of 2.50.

3.1.3. Effect of Pre-Hydrolysed Fe Concentration on UV254nm

Figure 6 shows the effect of the pre-hydrolysed Fe concentration on UV254nm measurements for all examined flocculation times and indicatively for various combinations of coagulation pH and pre-hydrolysis pH values. In general, the lowest UV254nm values are observed for the lower pre-hydrolysed Fe concentrations, namely at 2500 mg/L or 5000 mg/L. At these concentrations, the complete ionisation of iron enhances the destabilisation, accumulation, and, consequently, the removal of humics. Specifically, for the lower coagulation pH values (Figure 6a,b), the UV254nm value is higher at the higher pre-hydrolysed Fe concentrations (7500 mg/L and 10,000 mg/L), although the evolution of UV254nm does not follow a strict pattern with the respective increase in pre-hydrolysed Fe concentrations. By contrast, a distinct pattern is observed for the higher coagulation pH and pre-hydrolysis pH values (Figure 6c,d); as shown, the UV254nm initially decreases as the pre-hydrolysed Fe concentration increases from 2500 mg/L to 5000 mg/L, and then it increases for the higher pre-hydrolysed Fe concentrations, i.e., for 7500 mg/L and 10,000 mg/L. Regarding the total organic carbon measurements, TOC remained <0.85 mg/L for all the examined pre-hydrolysed Fe concentrations, while the lowest TOC value (0.56 mg/L) was obtained for the following operating conditions: a pre-hydrolysed Fe concentration of 2500 mg/L, a flocculation time of 5 min, a coagulation pH of 6.5 and pre-hydrolysis pH of 2.50.

3.1.4. Effect of Flocculation Time on UV254nm

Figure 7 presents the effect of the flocculation time on UV254nm measurements for all the examined coagulation pH values as well as indicatively for various combinations of pre-hydrolysed Fe concentrations and pre-hydrolysis pH values. As shown, the UV254nm initially increases as the flocculation time increases from 5 to 15 min and then follows a different pattern depending on the applied combination of the pre-hydrolysed Fe concentration and pre-hydrolysis pH value. For the pre-hydrolysed Fe concentration at 2500 mg/L and pre-hydrolysis pH of 2.50 (Figure 7a), the UV254nm continues to increase after 30 min of flocculation but at a lower rate of increase. By contrast, for the pre-hydrolysed Fe concentration of 5000 mg/L and pre-hydrolysis pH value of 2.25 (Figure 7b), the UV254nm decreases as the flocculation time increases from 15 to 120 min. For the pre-hydrolysed Fe concentration of 7500 mg/L and pre-hydrolysis pH of 3.00 (Figure 7c), both aforementioned trends are observed; after 15 min of flocculation, the UV254nm continues increase at the coagulation pH of 5.5–7.0, while, at the coagulation pH of 7.5 and 8.0, the UV254nm remains constant for 30–60 min of flocculation and then decreases for higher flocculation times (120 min). Finally, for the pre-hydrolysed Fe concentration of 10,000 mg/L and pre-hydrolysis pH of 2.75 (Figure 7d), the UV254nm value initially increases during the first 10–15 min of flocculation and then remains practically constant for most other cases. However, for all the examined combinations of pre-hydrolysed Fe concentrations and pre-hydrolysis pH values, the lowest UV254nm value is observed for the lowest flocculation time (5 min). As the flocculation time increases (>5 min), the iron precipitation increases, resulting in a lower neutralisation efficiency and, thus, the lower removal of humics. The lowest TOC value (0.54 mg/L) was obtained for the following conditions: a flocculation time of 5 min, a coagulation pH of 7.5, a pre-hydrolysed Fe concentration of 2500 mg/L, and a pre-hydrolysis pH of 2.50.

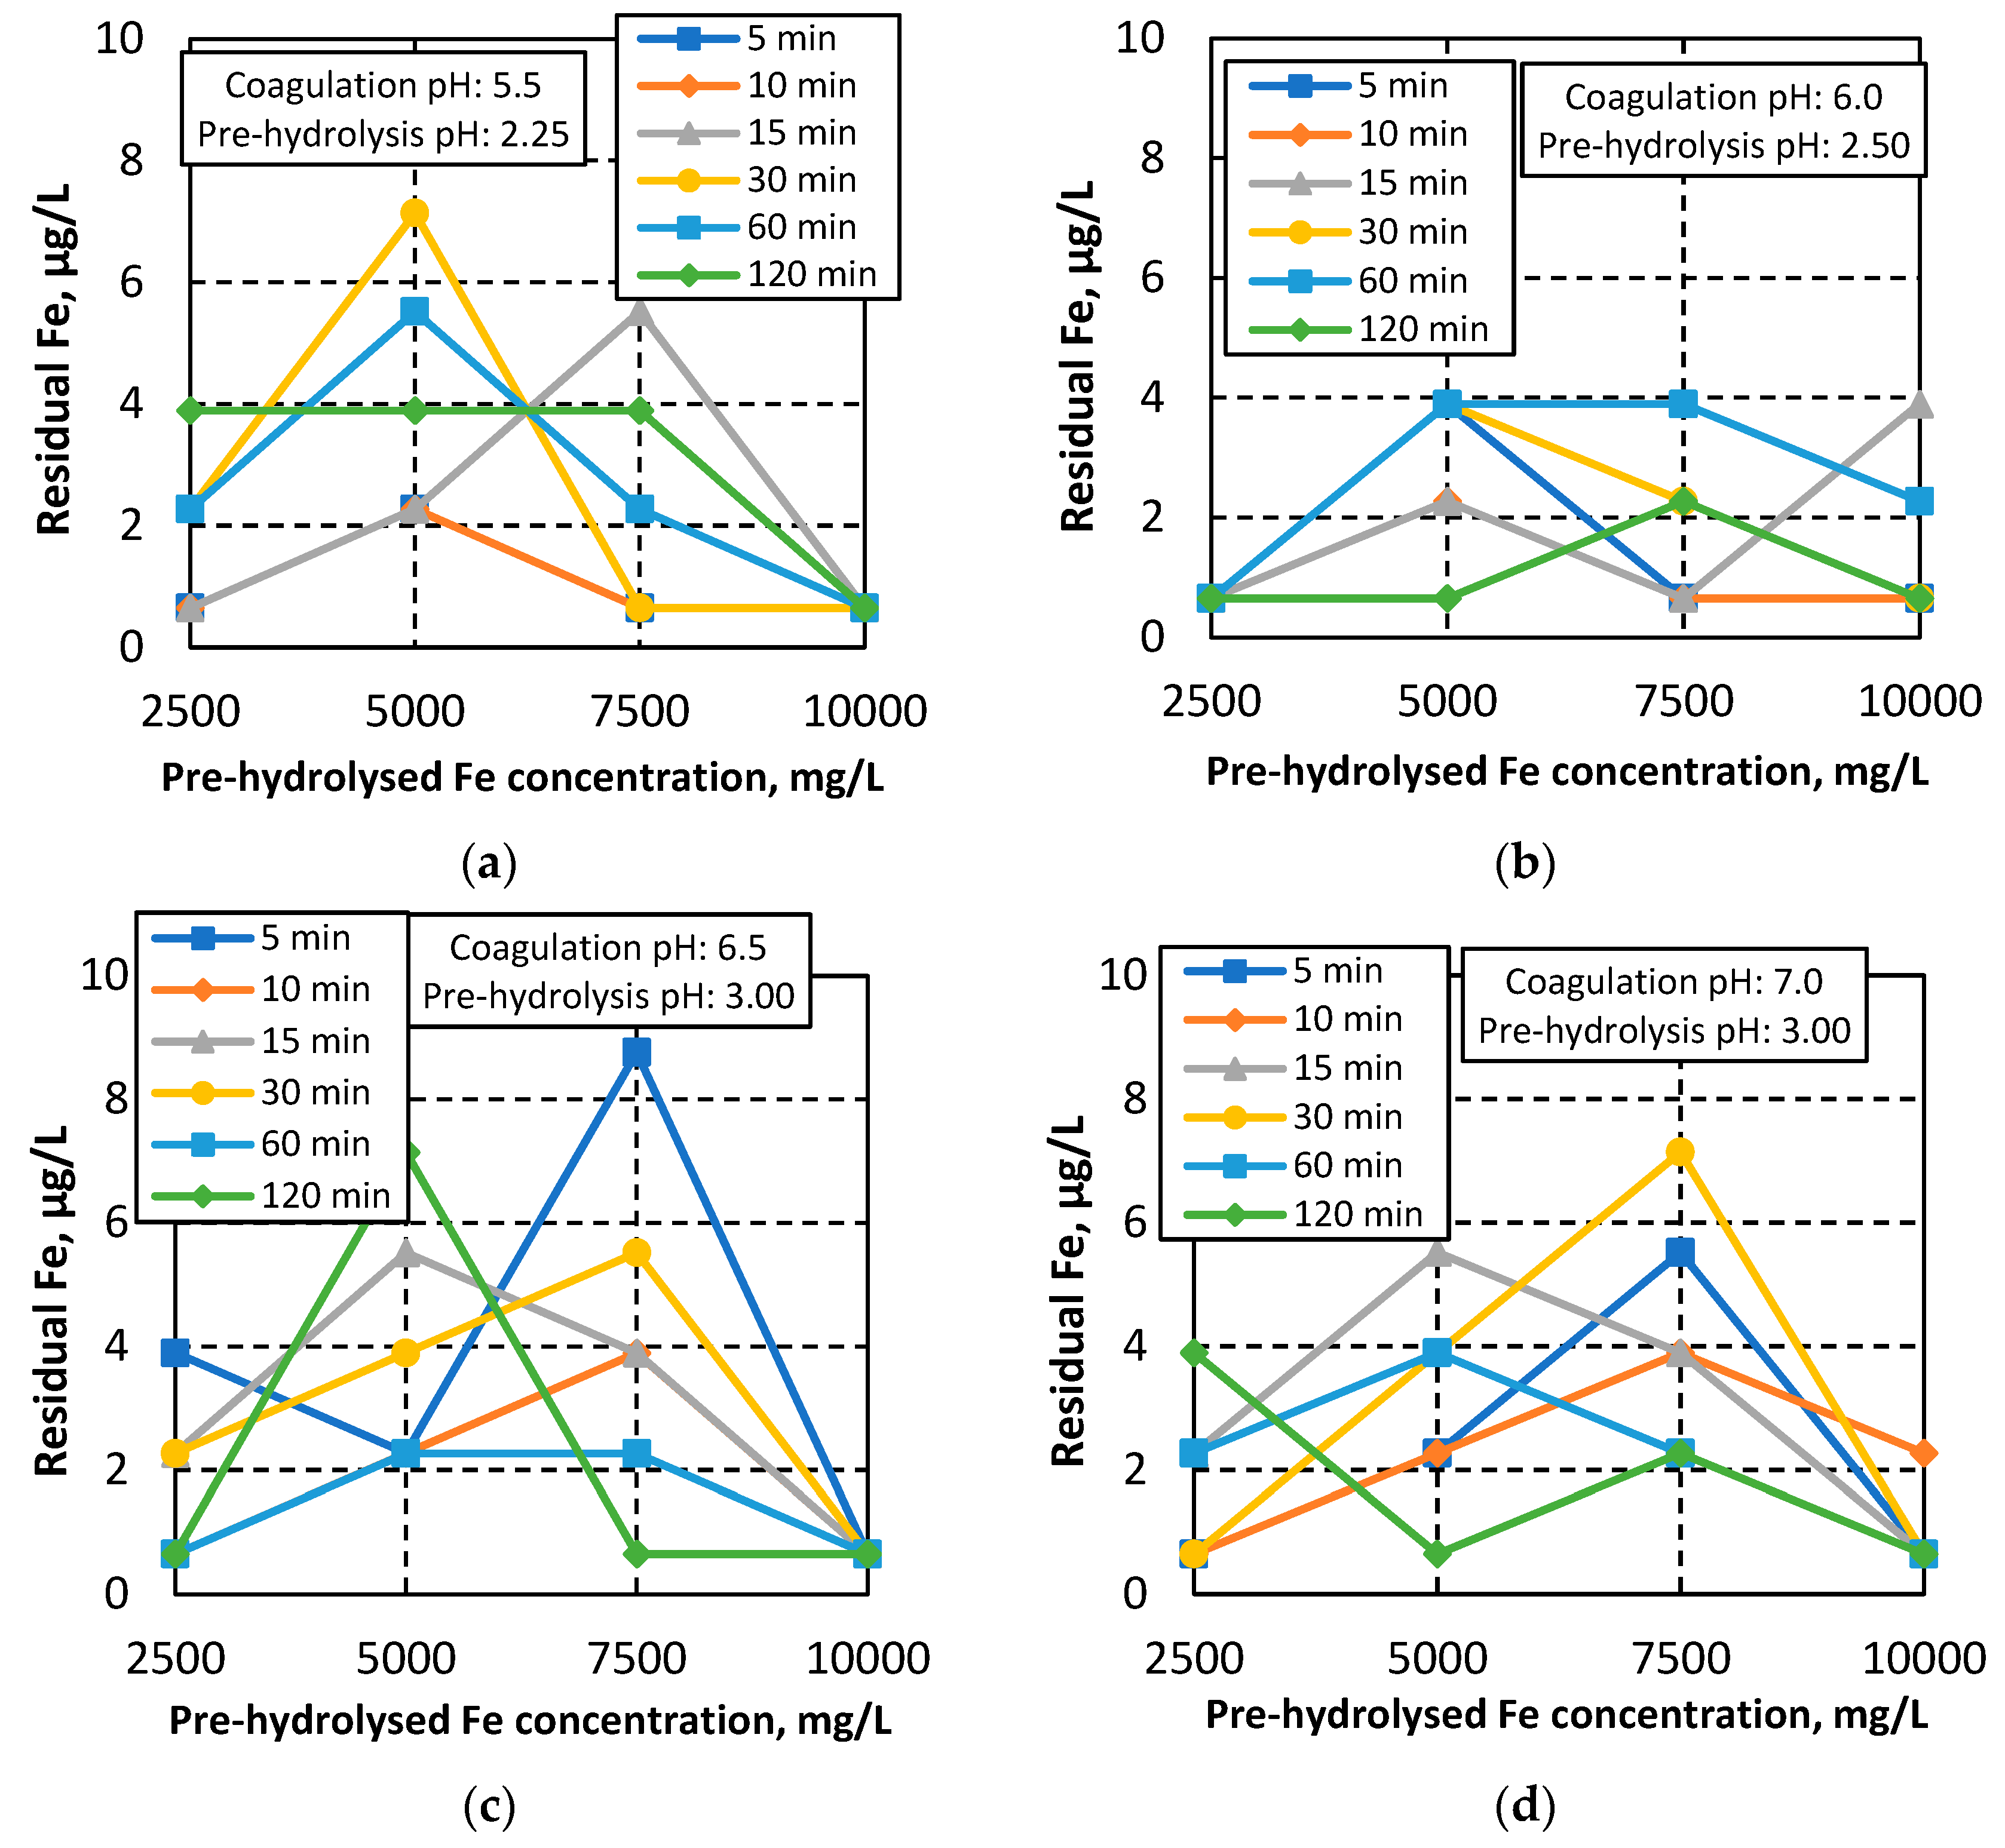
3.2. Study of Residual Fe Concentration

In this section, the effect of the main examined parameters (i.e., pre-hydrolysis pH, coagulation pH, pre-hydrolysed Fe concentration and flocculation time) on the residual Fe concentration was examined.

3.2.1. Effect of Pre-Hydrolysis pH on Residual Fe

Figure 8 shows the effect of the pre-hydrolysis pH on the residual Fe concentrations for all coagulation pH values and indicatively for various combinations of pre-hydrolysed Fe concentrations and flocculation times. For the pre-hydrolysed Fe concentration at 7500 mg/L and flocculation time of 5 min (Figure 8a), the residual Fe decreases slightly when the pre-hydrolysis pH value increases from 2.25 to 2.50 and then gradually increases as the pH value of pre-hydrolysis increases from 2.50 to 3.00. The same pattern (initial decrease and subsequent increase) is observed for all other combinations of pre-hydrolysed Fe concentrations, and flocculation times (Figure 8b–d), but for the pre-hydrolysis pH of 3.00, the residual Fe decreases again. In most cases, however, the residual Fe presents the lowest value at the pre-hydrolysis pH of 2.50.

3.2.2. Effect of Coagulation pH on Residual Fe

Figure 9 presents the effect of the coagulation pH on residual Fe concentrations for all examined flocculation times and indicatively for various combinations of pre-hydrolysed Fe concentrations and pre-hydrolysis pH values. As shown, strong residual Fe variations are observed for all cases; however, it is generally observed that the higher coagulation pH (i.e., >7.0 or 7.5) results in higher residual Fe concentrations. This is expected since the coagulation/flocculation process when applying iron-based reagents, is more effective for the treatment of water with pH values ranging between 5.5 and 7.0. This behaviour is particularly evident for the pre-hydrolysed Fe concentrations 2500 or 10,000 mg/L and the pre-hydrolysis pH values 3.00 or 2.50 (Figure 9a and Figure 9b, respectively), where the residual Fe remains <4 μg/L, as the coagulation pH increases from 5.5 to 7.0. However, higher residual Fe concentrations are observed for the other combinations of the pre-hydrolysed Fe concentration and pre-hydrolysis pH (Figure 9c,d).

3.2.3. Effect of Pre-Hydrolysed Fe Concentration on Residual Fe

Figure 10 shows the effect of pre-hydrolysed Fe concentrations on residual Fe for all examined flocculation times and indicatively for various combinations of coagulation pH and pre-hydrolysis pH values. As shown, there is no general trend that can depict the evolution of residual Fe with the increase in the pre-hydrolysed Fe concentration, both for low coagulation and pre-hydrolysed pH values (Figure 10a,b), as well as for high coagulation and pre-hydrolysed pH values (Figure 10c,d). For most cases, however, the lowest residual Fe values were observed for the pre-hydrolysed Fe concentration of 2500 mg/L.

3.2.4. Effect of Flocculation Time on Residual Fe

Figure 11 presents the effect of the flocculation time on residual Fe for all examined coagulation pH values and indicatively for various combinations of pre-hydrolysed Fe concentrations and pre-hydrolysis pH values. The residual Fe concentrations generally increase as the flocculation time increases for the first 15–30 min and then changes abruptly. This is observed both for the lower pre-hydrolysed Fe concentrations (Figure 11a,b) and for the higher concentrations of pre-hydrolysed Fe (Figure 11c,d). Similar to what was observed for the effect of the flocculation time at UV254nm measurements, the lowest residual Fe concentrations were observed for the lowest flocculation time (5 min) for most studied cases.

4. Conclusions

The present study aims to establish an integrated and systematic methodology for the on-site synthesis and subsequent direct utilisation of Polyferric Chloride (PFC) by applying a low Fe concentration in order to facilitate the potential replacement of PAC in the treatment of surface water that is potable for use. For this purpose, PFC was synthesised and subsequently used as a coagulant agent for the treatment of simulated surface water samples under different synthesis and coagulation/flocculation conditions, i.e., different pre-hydrolysis pH values (2.25, 2.50, 2.75 and 3.00), coagulation pH (5.5, 6.0, 6.5, 7.0, 7.5 and 8.0), pre-hydrolysed Fe concentrations (2500, 5000, 7500 and 10,000 mg/L) and flocculation times (5, 10, 15, 30, 60 and 120 min). The results show that the lowest UV254nm values, i.e., the higher humics removal, were observed for the pre-hydrolysis pH values of 2.50 and 2.75, the coagulation pH of 5.5–7.0, the pre-hydrolysed Fe concentrations 2500 mg/L and 5000 mg/L and flocculation time of 5 min. For all these examined cases, TOC remained in the range 0–56−0.85 mg/L, which is acceptable for water quality assessment and significantly lower when compared to the obtained TOC by utilising PAC for water treatment (usually TOC >1 mg/L). Regarding the effect of the operating parameters on the residual Fe concentrations, the lowest residual Fe concentrations were observed for the following conditions: a pre-hydrolysis pH of 2.50, a coagulation pH of 5.5–7.0, a pre-hydrolysed Fe concentration of 2500 mg/L and the flocculation time 5 min. For most examined cases, the residual Fe concentration remained <5 µg/L, which is lower than the corresponding Al concentration (typically >50 μg/L when PAC is utilised for relevant water treatment). In conclusion, the optimal conditions for achieving a high TOC removal and low residual Fe concentration when using the on-site preparation and application of PFC were a pre-hydrolysis pH of 2.50 ± 0.25, a coagulation pH of 5.5–7.0, pre-hydrolysed Fe concentrations of 0.5 ± 0.25% and a flocculation time of 5 min. Finally, it should be stated that statistical analyses and examination of more parameters for an even broader range of values are required to promote the widespread implementation of PFC in water treatment and other practical applications, including sewage or industrial wastewater treatment. In addition, more in-depth analysis is still needed to elucidate the mechanisms that take place for different operating conditions and which affect the performance of PFC. Apart from PFC, further research is expected to be conducted regarding the potential use of alternative, eco-friendly coagulation agents in water and wastewater treatment. Future trends mainly include the utilisation of hybrid coagulants, i.e., coagulants that are synthesised by the combination of novel inorganic and organic materials and plant-based natural coagulants, which can address the drawbacks associated with using chemical coagulants.

5. Patents

For the registration of this invention/method, a patent application with the reference no 20230100369 was filed to the Industrial Property Organization of Greece.

Supplementary Materials

The following supporting information can be downloaded at: https://www.mdpi.com/article/10.3390/su152316416/s1, Figure S1: Granular-Activated Carbon (GAC) column for the dichlorination of tap water; Figure S2: Addition of NaOH for PFC synthesis on a laboratory scale; Figure S3: Jar test apparatus; Figure S4: Standard curve for the calculation of total organic carbon (TOC); Figure S5: Standard curve for calculating residual Fe concentration.

Author Contributions

Conceptualisation, M.M., A.Z. and P.G.; methodology, M.M.; software, P.G. and M.M.; validation, A.Z., M.M. and P.G.; formal analysis, A.Z. and M.M.; investigation, P.G. and M.M.; resources, A.Z.; data curation, A.Z. and M.M.; writing—original draft preparation, P.G.; writing—review and editing, A.Z., M.M. and P.G.; visualisation, P.G.; supervision, A.Z. and M.M.; project administration, A.Z.; funding acquisition, A.Z. and P.G. All authors have read and agreed to the published version of the manuscript.

Funding

This research is co-financed by Greece and the European Union (European Social Fund- ESF) through the Operational Program «Human Resources Development, Education and Lifelong Learning» in the context of the project “Reinforcement of Postdoctoral Researchers—2nd Cycle” (MIS-5033021), implemented by the State Scholarship Foundation (ΙΚΥ).

Institutional Review Board Statement

Not applicable.

Informed Consent Statement

Not applicable.

Data Availability Statement

All data are available upon request.

Conflicts of Interest

The authors declare no conflict of interest.

References

  1. Chen, L.; Liu, T.; Li, J.; Tian, P.; Zhang, H. Surface water changes in China’s Yangtze River Delta over the past forty years. Sustain. Cities Soc. 2023, 91, 104458. [Google Scholar] [CrossRef]
  2. Leão, S.; Roux, P.; Núñez, M.; Loiseau, E.; Junqua, G.; Sferratore, A.; Penru, Y.; Rosenbaum, R.K. A worldwide-regionalised water supply mix (WSmix) for life cycle inventory of water use. J. Clean. Prod. 2018, 172, 302–313. [Google Scholar] [CrossRef]
  3. Knap-Bałdyga, A.; Zubrowska-Sudoł, M. Natural Organic Matter Removal in Surface Water Treatment via Coagulation—Current Issues, Potential Solutions, and New Findings. Sustainability 2023, 15, 13853. [Google Scholar] [CrossRef]
  4. Castro-Jiménez, C.C.; Grueso-Domínguez, M.C.; Correa-Ochoa, M.A.; Saldarriaga-Molina, J.C.; García, E.F. A Coagulation Process Combined with a Multi-Stage Filtration System for Drinking Water Treatment: An Alternative for Small Communities. Water 2022, 14, 3256. [Google Scholar] [CrossRef]
  5. Wongcharee, S.; Aravinthan, V.; Erdei, L. Removal of natural organic matter and ammonia from dam water by enhanced coagulation combined with adsorption on powdered composite nano-adsorbent. Environ. Technol. Innov. 2020, 17, 100557. [Google Scholar] [CrossRef]
  6. Yu, H.; Huang, W.; Liu, H.; Li, T.; Chi, N.; Chu, H.; Dong, B. Application of Coagulation–Membrane Rotation to Improve Ultrafiltration Performance in Drinking Water Treatment. Water 2021, 11, 643. [Google Scholar] [CrossRef] [PubMed]
  7. Ghernaout, D.; Ghernaout, B. Sweep flocculation as a second form of charge neutralisation—A review. Desalination Water. Treat. 2012, 44, 15–28. [Google Scholar] [CrossRef]
  8. Smotraiev, R.; Nehrii, A.; Koltsova, E.; Anohina, A.; Sorochkina, K.; Ratnaweera, H. Comparison of wastewater coagulation efficiency of pre-polymerised zirconium and traditional aluminium coagulants. J. Water Proc. Eng. 2022, 47, 102827. [Google Scholar] [CrossRef]
  9. Gkotsis, P.K.; Mitrakas, M.M.; Tolkou, A.K.; Zouboulis, A.I. Batch and continuous dosing of conventional and composite coagulation agents for fouling control in a pilot-scale MBR. Chem. Eng. J. 2017, 311, 255–264. [Google Scholar] [CrossRef]
  10. Takaara, T.; Kurumada, K. Optimum Conditions for Enhancing Chitosan-Assisted Coagulation in Drinking Water Treatment. Sustainability 2023, 15, 14197. [Google Scholar] [CrossRef]
  11. Kandimalla, R.; Vallamkondu, J.; Corgiat, E.B.; Gill, K.D. Understanding aspects of aluminum exposure in Alzheimer’s disease development. Brain Pathol. 2015, 26, 139–154. [Google Scholar] [CrossRef] [PubMed]
  12. Bondy, S.C.; Campbell, A. Chapter 5—Aluminum and Neurodegenerative Diseases. In Advances in Neurotoxicology; Elsevier: Amsterdam, The Netherlands, 2017; pp. 131–156. [Google Scholar]
  13. Maya, S.; Prakash, T.; Das Madhu, K.; Goli, D. Multifaceted effects of aluminium in neurodegenerative diseases: A review. Biomed. Pharmacother. J. 2016, 83, 746–754. [Google Scholar] [CrossRef] [PubMed]
  14. Yang, Z.; Gao, B.; Yue, Q. Coagulation performance and residual aluminum speciation of Al2(SO4)3 and polyaluminum chloride (PAC) in Yellow River water treatment. J. Chem. Eng. 2010, 165, 122–132. [Google Scholar] [CrossRef]
  15. Van Benschoten, J.E.; Edzwald, J.K. Measuring aluminum during water treatment: Methodology and application. J. Am. Water Works Assoc. 1990, 82, 71–78. [Google Scholar] [CrossRef]
  16. Srinivasan, P.T.; Viraraghavan, T.; Surbramanian, K.S. Aluminium in drinking water: An overview. Water SA 1999, 25, 47–56. [Google Scholar]
  17. Khaneghah, E.B.; Mokhtari, M.; Eslami, H.; Jambarsang, S.; Ebrahimi, A.A. Comparison of polyferric chloride and polytitanium chloride in removal of organic and inorganic pollutants from young and old municipal solid waste leachate. Chem. Eng. Res. Des. 2022, 187, 397–412. [Google Scholar] [CrossRef]
  18. Ghafari, S.; Aziz, H.A.; Isa, M.H.; Zinatizadeh, A.A. Application of response surface methodology (RSM) to optimize coagulation–flocculation treatment of leachate using poly-aluminum chloride (PAC) and alum. J. Hazard. Mater. 2009, 163, 650–656. [Google Scholar] [CrossRef]
  19. Liu, X.; Li, X.-M.; Yang, Q.; Yue, X.; Shen, T.-T.; Zheng, W.; Luo, K.; Sun, Y.-H.; Zeng, G.-M. Landfill leachate pretreatment by coagulation–flocculation process using iron-based coagulants: Optimization by response surface methodology. Chem. Eng. J. 2012, 200, 39–51. [Google Scholar] [CrossRef]
  20. Dong, H.; Gao, B.; Yue, Q.; Rong, H.; Sun, S.; Zhao, S. Effect of Fe (III) species in polyferric chloride on floc properties and membrane fouling in coagulation—Ultrafiltration process. Desalination 2014, 335, 102–107. [Google Scholar] [CrossRef]
  21. Gao, B.Y.; Wang, Y.; Yue, Q.Y.; Wei, J.C.; Li, Q. The size and coagulation behavior of a novel composite inorganic–organic coagulant. Sep. Purif. Technol. 2008, 62, 544–550. [Google Scholar] [CrossRef]
  22. Gregory, J.; Duan, J. Hydrolyzing metal salts as coagulants. Pure Appl. Chem. 2001, 73, 2017–2026. [Google Scholar] [CrossRef]
  23. Yang, B.; Jiang, S.; Zhang, C.; Zhao, G.; Wu, M.; Xiao, N.; Su, P. Recovery of iron from iron-rich pickling sludge for preparing P-doped polyferric chloride coagulant. Chemosphere 2021, 283, 132216. [Google Scholar] [CrossRef] [PubMed]
  24. Lekhlif, B.; Oudrhiri, L.; Zidane, F.; Drogui, P.; Blais, J.F. Study of the electrocoagulation of electroplating industry wastewaters charged by nickel (II) and chromium (VI). J. Mater. Environ. Sci. 2014, 5, 111–120. [Google Scholar]
  25. Crans, D.C.; Woll, K.A.; Prusinskas, K.; Johnson, M.D.; Norkus, E. Metal speciation in health and medicine represented by iron and vanadium. Inorg. Chem. 2013, 52, 12262–12275. [Google Scholar] [CrossRef]
  26. Zhan, X.; Gao, B.Y.; Liu, B.; Xu, C.H.; Yue, Q.Y. Coagulation and adsorption on treating the Yellow River and the impact on chlorine decay during chlorination process. Huan Jing Ke Xue 2010, 31, 1198–1205. [Google Scholar] [PubMed]
  27. Li, W.; Hua, T.; Zhou, Q.X. Preparation, morphology and coagulation characteristics of a new polyferric chloride coagulant prepared using pyrite cinders. Environ. Technol. 2011, 32, 911–920. [Google Scholar] [CrossRef]
  28. Dong, H.; Gao, B.; Yue, Q.; Wang, Y.; Li, Q. Effect of pH on floc properties and membrane fouling in coagulation—Ultrafiltration process with ferric chloride and polyferric chloride. Chemosphere 2015, 130, 90–97. [Google Scholar] [CrossRef]
  29. Albanakis, C.; Tsanana, E.; Fragkaki, A.G. Modeling and prediction of trihalomethanes in the drinking water treatment plant of Thessaloniki, Greece. J. Water Process Eng. 2021, 43, 102252. [Google Scholar] [CrossRef]
  30. Gkotsis, P.; Mitrakas, M.; Zouboulis, A. Method of Fe(III) Pre-Hydrolysis for the Removal of Organic Content from Drinking Water. Patent number 20230100369, 30 August 2023. [Google Scholar]
Figure 2. Distribution of iron hydrolysis products (Fe3+)x(OH)y in (a) 10−5 M initial Fe(III) concentration (the observed species are Fe3+ (abbreviation for F e ( H 2 O ) 6 3 + ), F e ( O H ) 2 + , F e ( O H ) 2 + , F e ( O H ) 3 and F e ( O H ) 4 ), and (b) 0.1 M initial Fe(III) concentration (the observed species are Fe3+, F e ( O H ) 2 + , F e 2 ( O H ) 2 4 + , F e 3 ( O H ) 4 5 + , F e ( O H ) 2 + , F e ( O H ) 3 and F e ( O H ) 4 ) [25].
Sustainability 15 16416 g002
Figure 3. Patented process for pilot-scale PFC production [30].
Sustainability 15 16416 g003
Figure 4. Effect of pre-hydrolysis pH on UV254nm measurements (and removal of NOM) for different coagulation pH values and different operating sets: (a) pre-hydrolysed Fe concentration of 5000 mg/L and flocculation time of 10 min, (b) pre-hydrolysed Fe concentration of 7500 mg/L and flocculation time of 30 min, (c) pre-hydrolysed Fe concentration of 5000 mg/L and flocculation time of 60 min, and (d) pre-hydrolysed Fe concentration of 10,000 mg/L and a flocculation time 5 min.
Sustainability 15 16416 g004
Figure 5. Effect of coagulation pH on UV254nm measurements for different flocculation times and different operating sets: (a) pre-hydrolysed Fe concentration of 2500 mg/L and pre-hydrolysis pH value of 2.25, (b) pre-hydrolysed Fe concentration of 5000 mg/L and pre-hydrolysis pH of 2.50, (c) pre-hydrolysed Fe concentration of 7500 mg/L and pre-hydrolysis pH of 2.75, and (d) pre-hydrolysed Fe concentration of 7500 mg/L and pre-hydrolysis pH of 3.00.
Sustainability 15 16416 g005
Figure 6. Effect of pre-hydrolysed Fe on UV254nm measurements for different examined flocculation times and different operating sets: the values of (a) coagulation pH 5.5 and pre-hydrolysis pH 2.25, (b) coagulation pH 6.0 and pre-hydrolysis pH 2.25, (c) coagulation pH 6.5 and pre-hydrolysis pH 2.50, and (d) coagulation pH 7.0 and pre-hydrolysis pH 2.50.
Sustainability 15 16416 g006
Figure 7. The effect of flocculation time on UV254nm measurements for different coagulation pH values and different operating sets: (a) a pre-hydrolysed Fe concentration of 2500 mg/L and pre-hydrolysis pH value of 2.50, (b) a pre-hydrolysed Fe concentration of 5000 mg/L and pre-hydrolysis pH of 2.25, (c) a pre-hydrolysed Fe concentration of 7500 mg/L and pre-hydrolysis pH of 3.00, and (d) a pre-hydrolysed Fe concentration of 10,000 mg/L and pre-hydrolysis pH of 2.75.
Sustainability 15 16416 g007
Figure 8. Effect of pre-hydrolysis pH on residual Fe concentrations for different coagulation pH values and for different operating sets: (a) pre-hydrolysed Fe concentration of 7500 mg/L and flocculation time of 5 min, (b) pre-hydrolysed Fe concentration of 2500 mg/L and flocculation time of 15 min, (c) pre-hydrolysed Fe concentration of 5000 mg/L and flocculation time of 60 min, and (d) pre-hydrolysed Fe concentration of 2500 mg/L and flocculation time of 10 min.
Sustainability 15 16416 g008
Figure 9. Effect of coagulation pH on residual Fe concentrations for different flocculation times and different operating sets: (a) pre-hydrolysed Fe concentration of 2500 mg/L and pre-hydrolysis pH of 3.00, (b) pre-hydrolysed Fe concentration of 10,000 mg/L and pre-hydrolysis pH of 2.50, (c) pre-hydrolysed Fe concentration of 7500 mg/L and pre-hydrolysis pH of 2.75, and (d) pre-hydrolysed Fe concentration of 5000 mg/L and pre-hydrolysis pH of 2.25.
Sustainability 15 16416 g009
Figure 10. Effect of pre-hydrolysed Fe on residual Fe concentrations for different flocculation times and different operating sets: (a) coagulation pH 5.5 and pre-hydrolysis pH 2.25, (b) coagulation pH 6.0 and pre-hydrolysis pH 2.50, (c) coagulation pH 6.5 and pre-hydrolysis pH 3.00, and (d) coagulation pH 7.0 and pre-hydrolysis pH 3.00.
Sustainability 15 16416 g010
Figure 11. Effect of flocculation time on residual Fe concentrations for different coagulation pH values and different operating sets: (a) pre-hydrolysed Fe concentration of 2500 mg/L and pre-hydrolysis pH value of 3.00, (b) pre-hydrolysed Fe concentration of 5000 mg/L and pre-hydrolysis pH of 2.25, (c) pre-hydrolysed Fe concentration of 7500 mg/L and pre-hydrolysis pH of 2.50, and (d) pre-hydrolysed Fe concentration of 10,000 mg/L and pre-hydrolysis pH of 2.75.
Sustainability 15 16416 g011
Disclaimer/Publisher’s Note: The statements, opinions and data contained in all publications are solely those of the individual author(s) and contributor(s) and not of MDPI and/or the editor(s). MDPI and/or the editor(s) disclaim responsibility for any injury to people or property resulting from any ideas, methods, instructions or products referred to in the content.

