1. Introduction
1.1. Background: The Timed City Concept
As cities aim to overcome car dependency and put people and the human scale at the centre of spatial planning [
1], the Timed City concept is gaining ground as a potential planning approach. This idea is that basic daily services and amenities would be available to residents within the 15 to 30 min travel window, through active mobility. This would mean access to six essential functions, including living; working; commerce; healthcare; education; and entertainment. To carry this out, the urban fabric needs to ensure qualities such as proximity; diversity; density and digitalisation [
2].
The concept of proximity is an important aspect of Timed Cities as it provides opportunities to decrease the need to travel, thereby contributing to a reduction in emissions attributed to vehicular transportation. Diversity, on the other hand, involves the mixing of different uses but also provisions for different income groups or different housing types. Such aspects ensure a social mix which can have both social and economic gains potentially leading to increased social coherence. In terms of density, the compact city model is promoted, meaning that people can have easy access to their needs and resources. Additionally, the aim is also to achieve a more compact urban form. Lastly, the digitalisation aspect aims to support the other three qualities by integrating smart technologies [
3].
Furthermore, the concept of ubiquity is essential as is the need for such planning concepts to support environmental and equitable paths [
2]. In parallel, the aim is to ensure that urban neighbourhoods are attractive places for social activity, thus promoting liveability [
4]. In fact, alongside the four qualities outlined above, the use of space is an important consideration. The quality of pedestrian connections, walkability and simply the pleasantness of the urban environment, i.e., the public spaces in which we experience the system of networks and places, are seen as essential elements in supporting the Timed City concept [
5]. Moreover, the walkable distance, which in turn defines whether basic services are accessible or not, actually varies in relation to age as well as temporal variations [
6]. This is an important consideration when considering the applicability of the Timed City concept to different contexts.
It can be said that the Timed City concept originated in the 1920s through the work of Clarence Perry [
7], who developed the concept of a ‘Neighbourhood Unit’. It promoted a community-centric way of life in contrast to the realities of the industrial city. In the 1960s, Jane Jacobs [
8] also started advocating the importance of local residents, envisioning frequent streets, slow-moving communities, the use of short blocks and ultimately the ability to reach destinations within them using active mobility. The Timed City concept per se has, however, since been re-energised by Carlos Moreno [
2], who is promoting such ideas, and this is taking hold in Seattle, Paris, Melbourne and other cities worldwide.
In conclusion, the ultimate aim is to create a city planned for people and not their cars, where residents interact and social bonds are strengthened with character and trust, leading to healthy urban landscapes [
2]. Such concepts are seen as essential in contributing to Sustainable Development Goal 11 [
9] of the United Nations and overcoming car-dependent urban planning, which is at the core of unsustainable practices and their resulting negative environmental impacts. In fact, Allam et al. [
3] advocate that adopting a planning model which has the potential to reduce transport emission loads should no longer be simply an option but rather something that is considered necessary.
1.2. The Maltese Context
Since Timed City interventions address matters of land use and proximity, amongst others, they are necessarily context-specific. Additionally, demographics, temporal variations and socio-cultural aspects are important considerations [
6]. It is therefore of paramount importance that any interventions are directly inspired by the environment within which they are to be implemented and that a thorough study of the context underlies the planning and design of such interventions. Malta’s specific socio-spatial context suggests an interesting opportunity to analyse and understand whether the Timed City concept could be applied or potentially already exists. Malta is an Island State with a high population density. At the end of 2021, the population stood at 519,562, which implies a density of 1649 persons per km
2 [
10], which is the highest in the EU. Malta has also been defined as an entirely urban area [
11,
12], and its urban environment is characterised by a culture of car dependency. In fact, Malta has 601 passenger cars per 1000 inhabitants, a motorisation rate which is amongst the highest in the EU [
13]. This has been fuelled by an economy that prioritizes land development, exacerbated by the lack of integrated land use and transport planning as well as insufficient investment in sustainable transport modes. Transport policy still adopts the traditional predict and provide approach where road construction projects are constantly being implemented in attempts to meet ever-increasing demand. This is at the expense of space allocation for public transport and active forms of mobility, understood as regular physical activity undertaken for transportation such as walking, cycling or even kick scooters. In addition, the demand for car space is also impacting the availability of recreational green space and the quality of the urban environment [
14,
15,
16,
17,
18,
19].
This research is thus considered crucial as car dependency has infiltrated Malta’s mobility culture, with negative impacts on environmental, social and economic aspects. In particular environmental impacts can be linked to poor air quality and land congestion; social impacts can be linked to mobility injustice; and economic impacts can be linked to the cost of traffic congestion [
15,
20,
21,
22]. Society has adapted to the status quo, often not aware that there could be other alternatives. The Maltese conurbation interestingly provides a particular scale, since it functions both as a ‘city’ and as an agglomeration of multiple localities feeding off each other. However, to understand whether the conurbation could function as a Timed City and address some of the mobility challenges, an in-depth data gathering exercise, analysing the spatial distribution of services, active mobility opportunities and concurrently the needs of Maltese communities, is required.
The National Transport Masterplan (NTMP) 2025 [
15] provides data on local mobility within Malta’s Principal Urban Area (PUA) as designated in the Strategic Plan for the Environment and Development (SPED) [
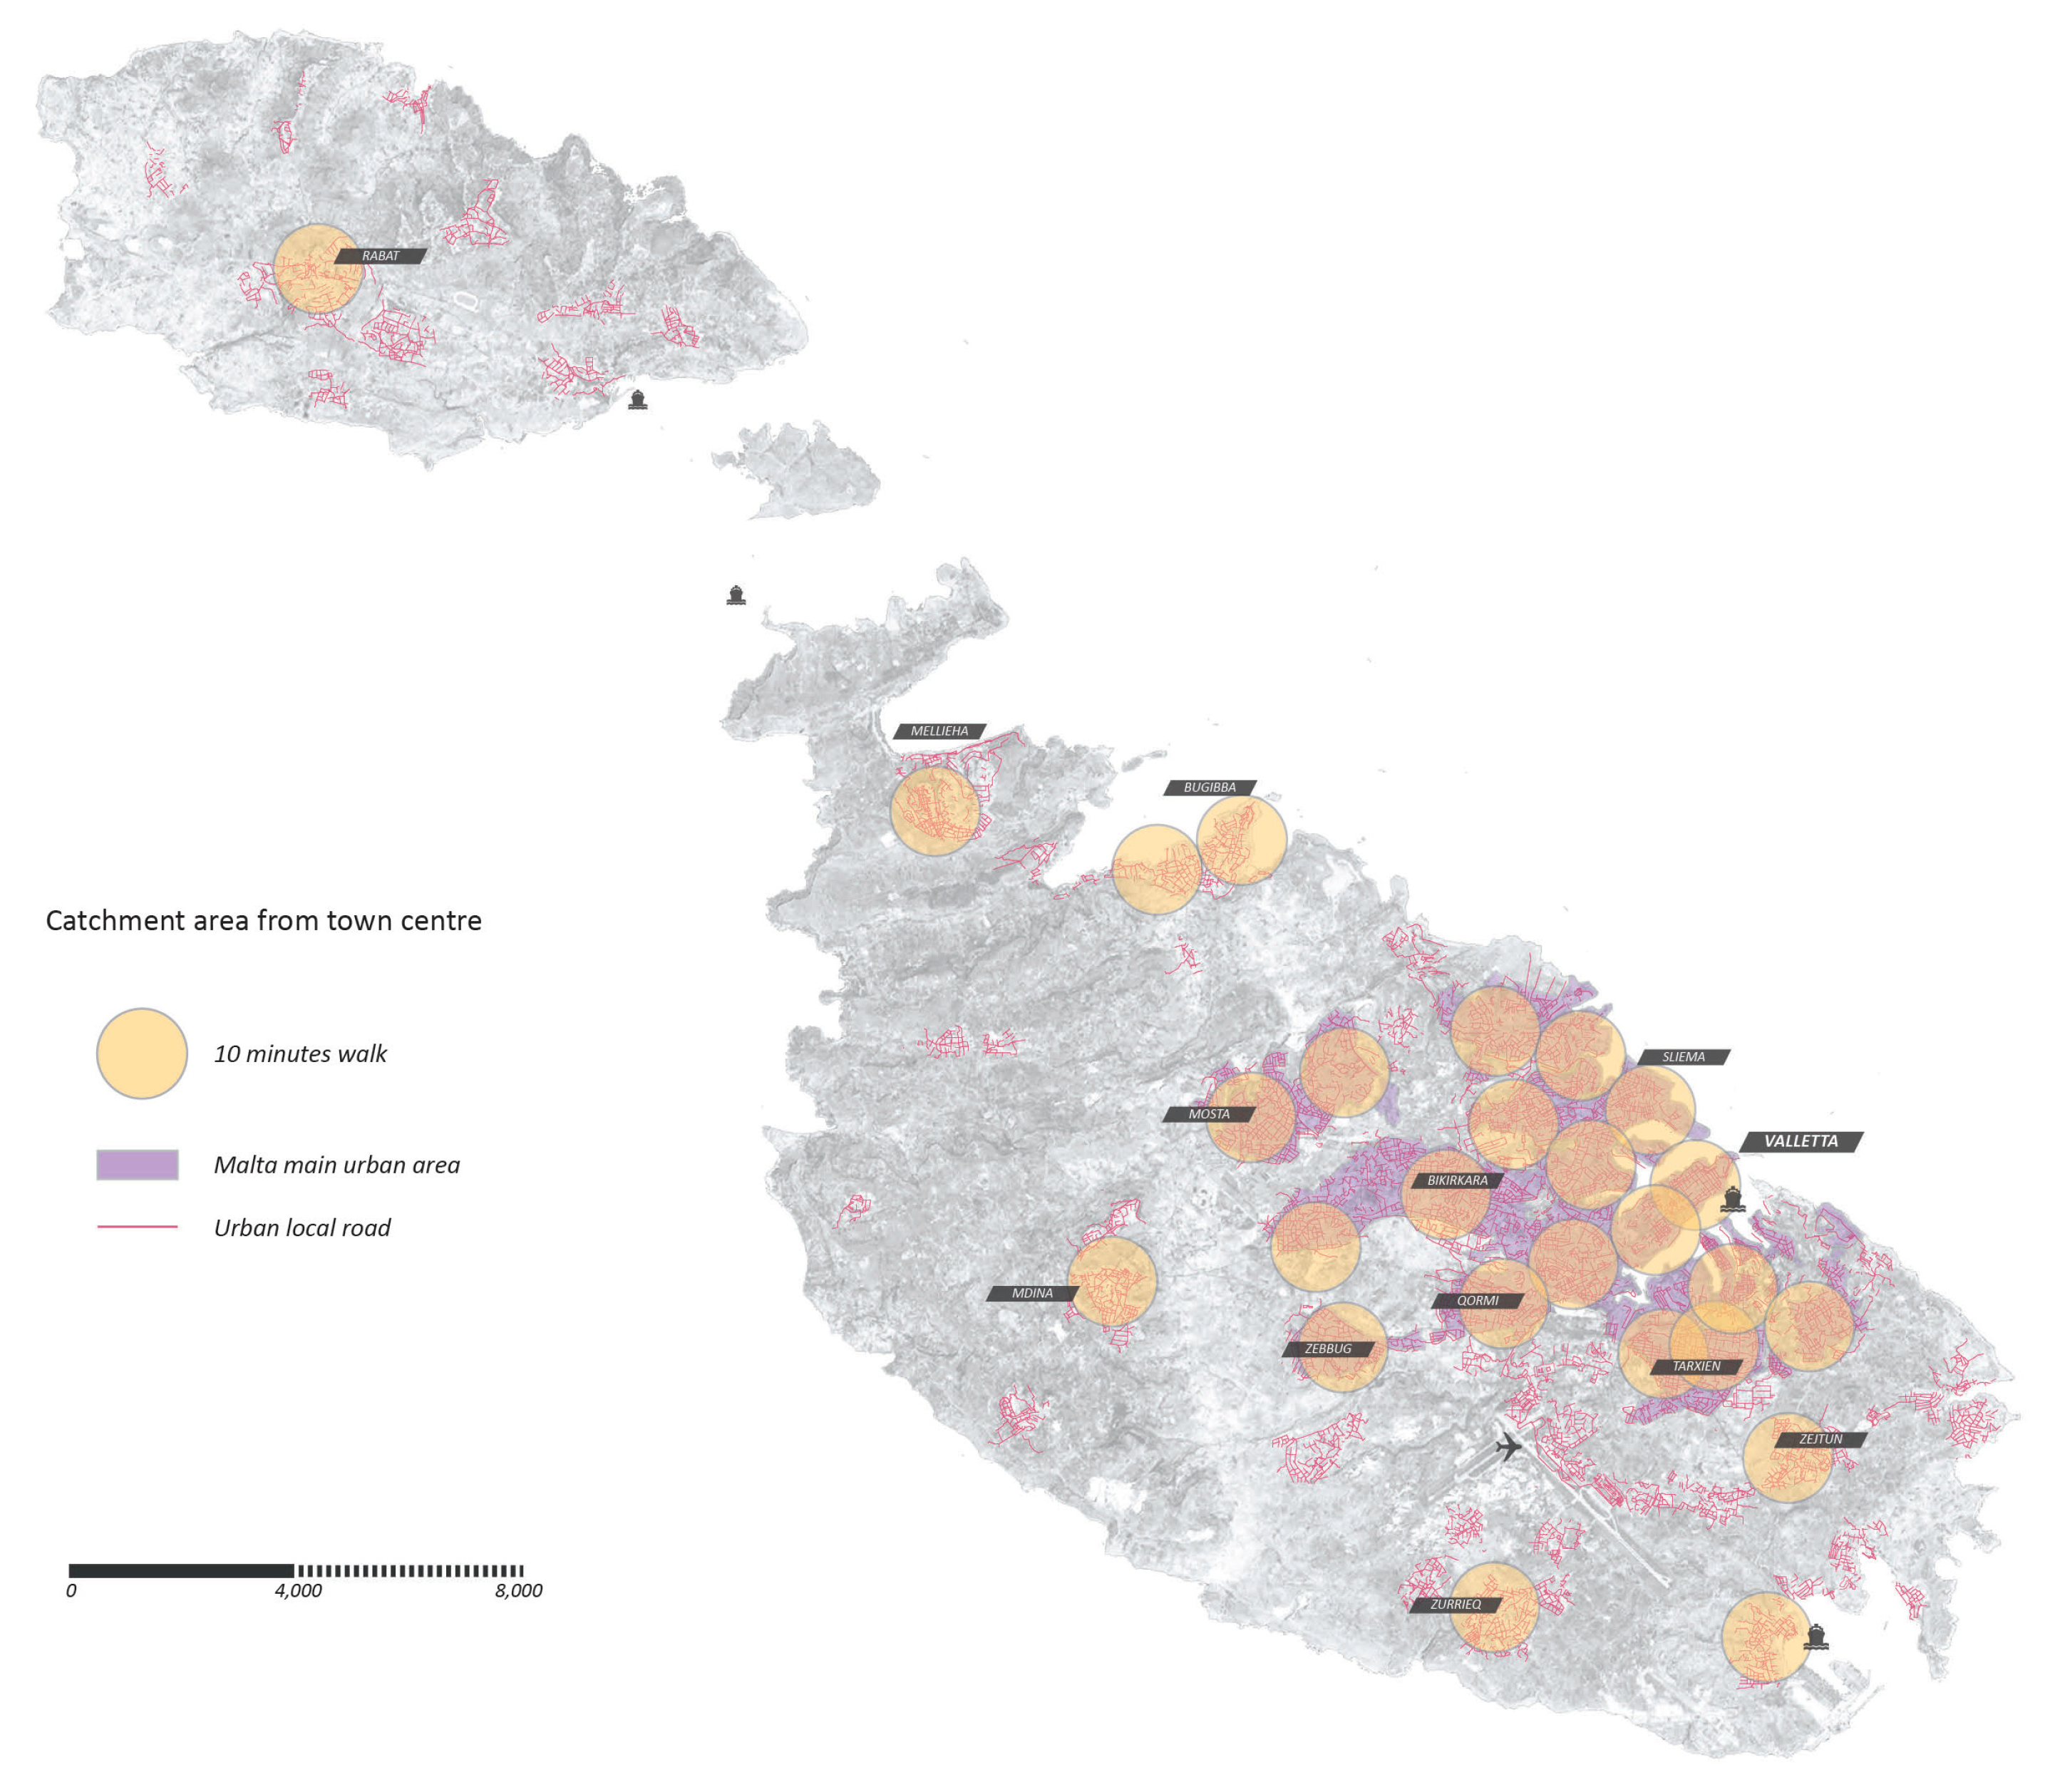
23]. Data based on the 2011 census and extrapolated for 2014 show that 50% of local trips are under 15 min long, showing that mobility is produced at a very local level and in very short paths. The plan suggests that this creates the opportunity to increase the modal share for walking and cycling. Furthermore, the spatial distribution of town centres across Malta (
Figure 1) suggests the possibility to access daily facilities using active travel modes as most of the urban areas are within walking distance of a town centre. This further reinforces the potential for the application of the Timed City concept locally.
1.3. Research Overview
The overall aim of this research is thus to test the applicability of the Timed City concept to the Maltese context. The University of Naples has developed a methodology [
4] to test whether and how existing cities such as Naples are in fact performing as Timed Cities. This established methodology has been adapted to Malta’s specific context to address this global and nationally pertinent issue. Using a case study mixed method approach, GIS (quantitative) and PGIS (qualitative) data are collected and integrated to understand spatial implications and develop recommendations for policy and spatial planning specific to Malta. Such studies usually focus on quantitative data; however, this research also explores new avenues through the integration of qualitative data to also understand user needs and perceptions relating to active travel and living locally. A specific locality in Malta, called Paola, is selected as a pilot case study. The first phase of the research establishes the GIS platform, populating it with existing data sets as well as collecting new primary data sets where relevant. The second phase deals with the qualitative PGIS component of the research and while the data have been collected, its analysis and interpretation are ongoing at the time of writing. This paper therefore presents the findings of the first phase, that is, the GIS quantitative part of the research method.
Paola Town Centre Case Study
A case study approach has been adopted for this research in order to focus the analysis on a specific area of reference from which conclusions can then be drawn [
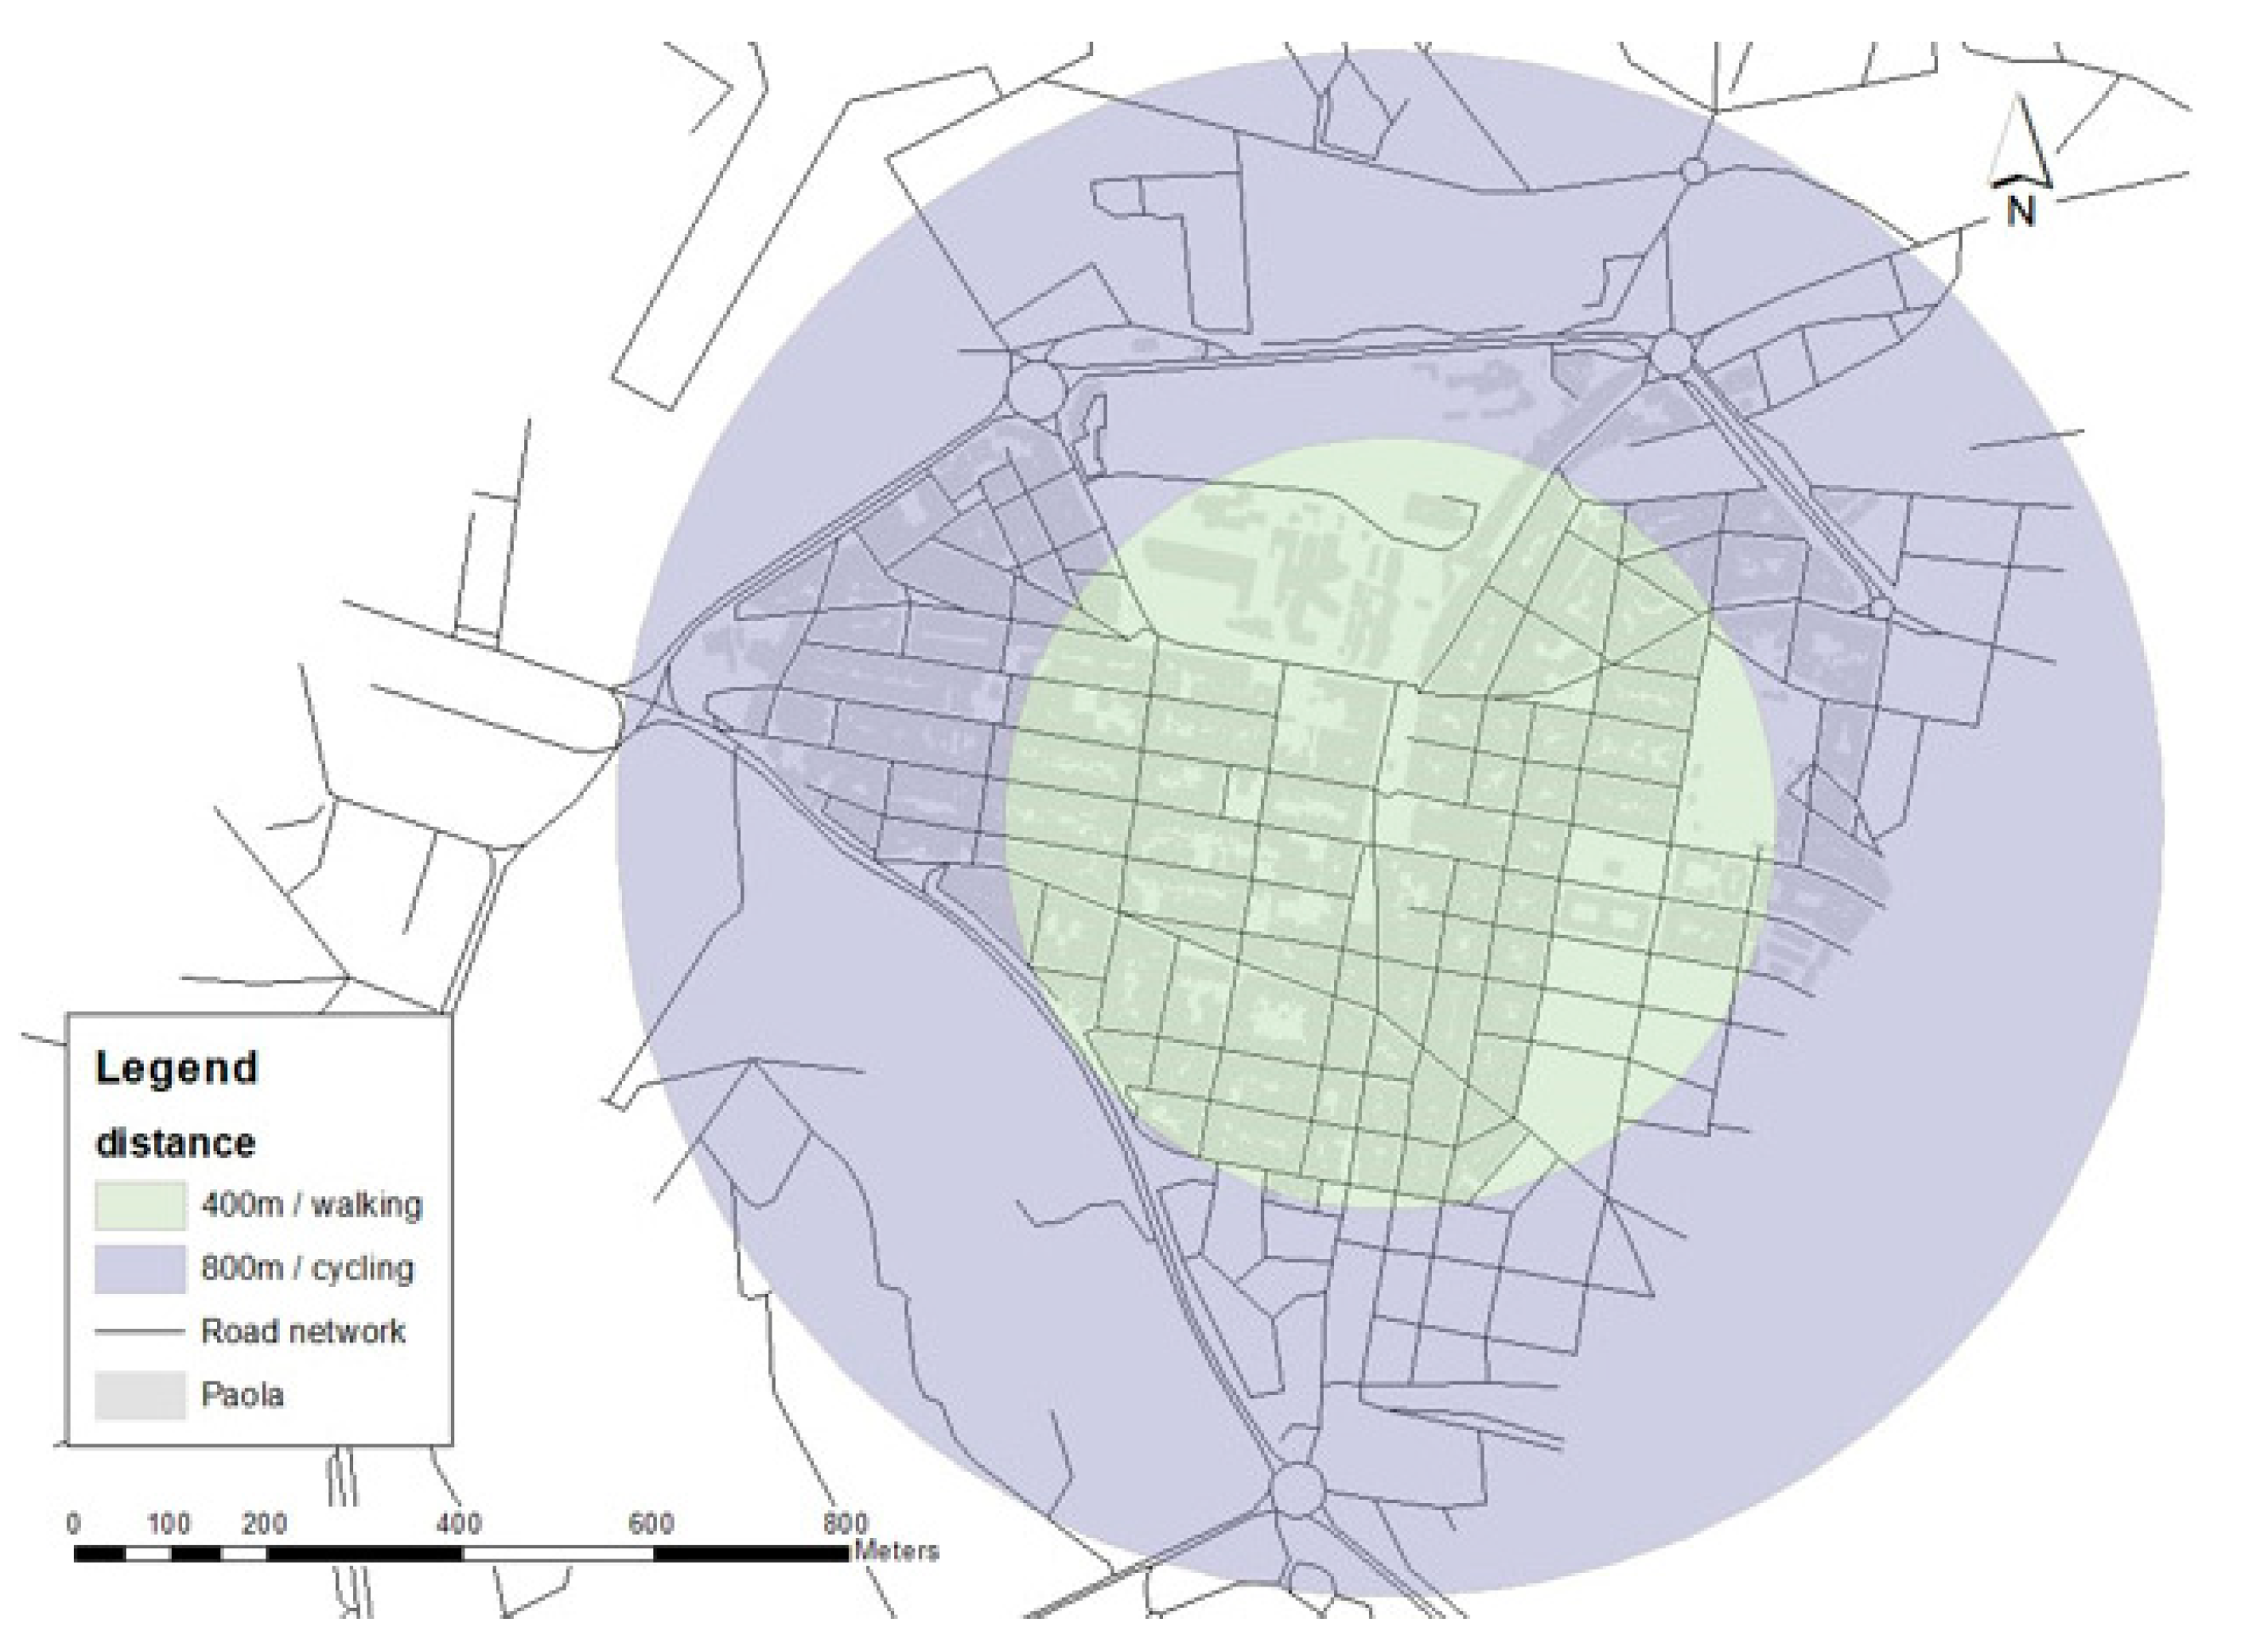
24]. The case study being considered is the Paola town centre since; as can be seen in
Figure 2, the extents of the locality are within a walking and cycling catchment of the town centre. The locality of Paola, ‘Raħal Ġdid’ (lit. new town) in Maltese, has several distinct characteristics that prompted its choice as a case study for this research. It is a town spanning over 2.5 km
2 with over 9000 residents, thus having a population density of 3739 persons per km
2 as of the 2021 census [
10]. Paola is characterized by a large residential area, both historic and contemporary, and an established town centre. Since it is within the PUA and almost immediately adjacent to Valletta, the capital city, Paola is very much at the heart of Malta’s conurbation. It was in fact laid out in the mid-17th century to alleviate development pressure from within Valletta, thus providing residential opportunities for the many people who worked in the service and industrial hub around the Grand Harbour. Valletta was taken as a model for the new town, this being designed on a strict gridiron plan across the sloping site. Since then, the town has been expanded several times, with streets continuing their trajectory towards the south and the east, from the original residential blocks [
25].
Now having a thriving commercial centre that is a Business Hub as designated in the SPED, Paola is facing contemporary pressures of its own. The Business Hub, located along the intersection of the original town and the later extension, is a linear zone that follows the trajectory of
Triq Ħal Luqa, a much-used through-route from the periphery of the PUA towards its core. The resulting conflict between a dense residential area, vital commercial centre and trafficked vehicular route brings to the fore many of the characteristics that research on the Timed City has focused on so far. These include proximity, density, diversity, digitalisation, human-scale urban design, connectivity and flexibility [
26]. Such issues, juxtaposed with the morphological characteristics of the gridiron plan and the sloping topography, have highlighted many challenges, as well as the opportunities related to active mobility and service provision that are in fact associated with a successful Timed City.
Considering the key criteria for the assessment of the Timed City concept in Paola, specific characteristics that have been considered are therefore the mix of land uses across the study area. This has a spillover effect on the population density across the locality as well as on the allowable building heights pertaining to the different designated areas. The research, therefore, tests the applicability of the Timed City concept to the specific locality of Paola as a case study approach. The findings illustrate undiscovered potential for such town centres in this regard. They also identify those aspects that are supporting the town centre of Paola as a Timed City as well as those requiring intervention.
2. Materials and Methods
Gaglione et al. [
4] developed a method to understand urban accessibility in Naples as a 15-minute city. Their work set out to identify the urban characteristics that define a 15-minute city. They gathered geomorphic, physical, functional, socio-economic and settlement data. Using this data, they assessed whether a neighbourhood is accessible in 15 min depending on access to services, walkability principles and the suitability of the urban fabric. Seventeen variables were mapped out in a GIS as a basis for the spatial analysis. Through a collaboration with the researchers from Naples, the method used was adapted to the Paola case study.
Table 1 sets out the final list of variables that were collected. Additionally, the daily services available in the study areas were mapped out according to the following land use categories: recreational open spaces; local services (post office, bank, etc.); sports facilities; religious institutions; transit (bus stops); living; work (offices); commercial retail; grocery stores; healthcare; education and entertainment.
The secondary data were obtained from the various national entities. Transportation data were obtained from Transport Malta, the Regulator for Transport in Malta. A National Transport Model was developed by Transport Malta, in 2015, and an extract of the network model was obtained as a basis for the GIS platform. Additionally, the data of ID 13 (
Table 1) were sourced from the attributes of the network model. The National Statistics Office also provided data from the 2011 Census, specifically on the Enumeration Zones and ID 1 in
Table 1. ID 2 and 3 were obtained from the Planning Authority, the National Authority for Spatial and Land Use Planning in Malta. The other variable sets were gathered as primary data sets through field or desktop measurements as outlined below.
Spatial data were gathered over a year (between the years 2022 and 2023). The data were recorded on a tablet using the application Map Maker V3.0.0 [
27] and then transferred on ArcMap version 10.8 [
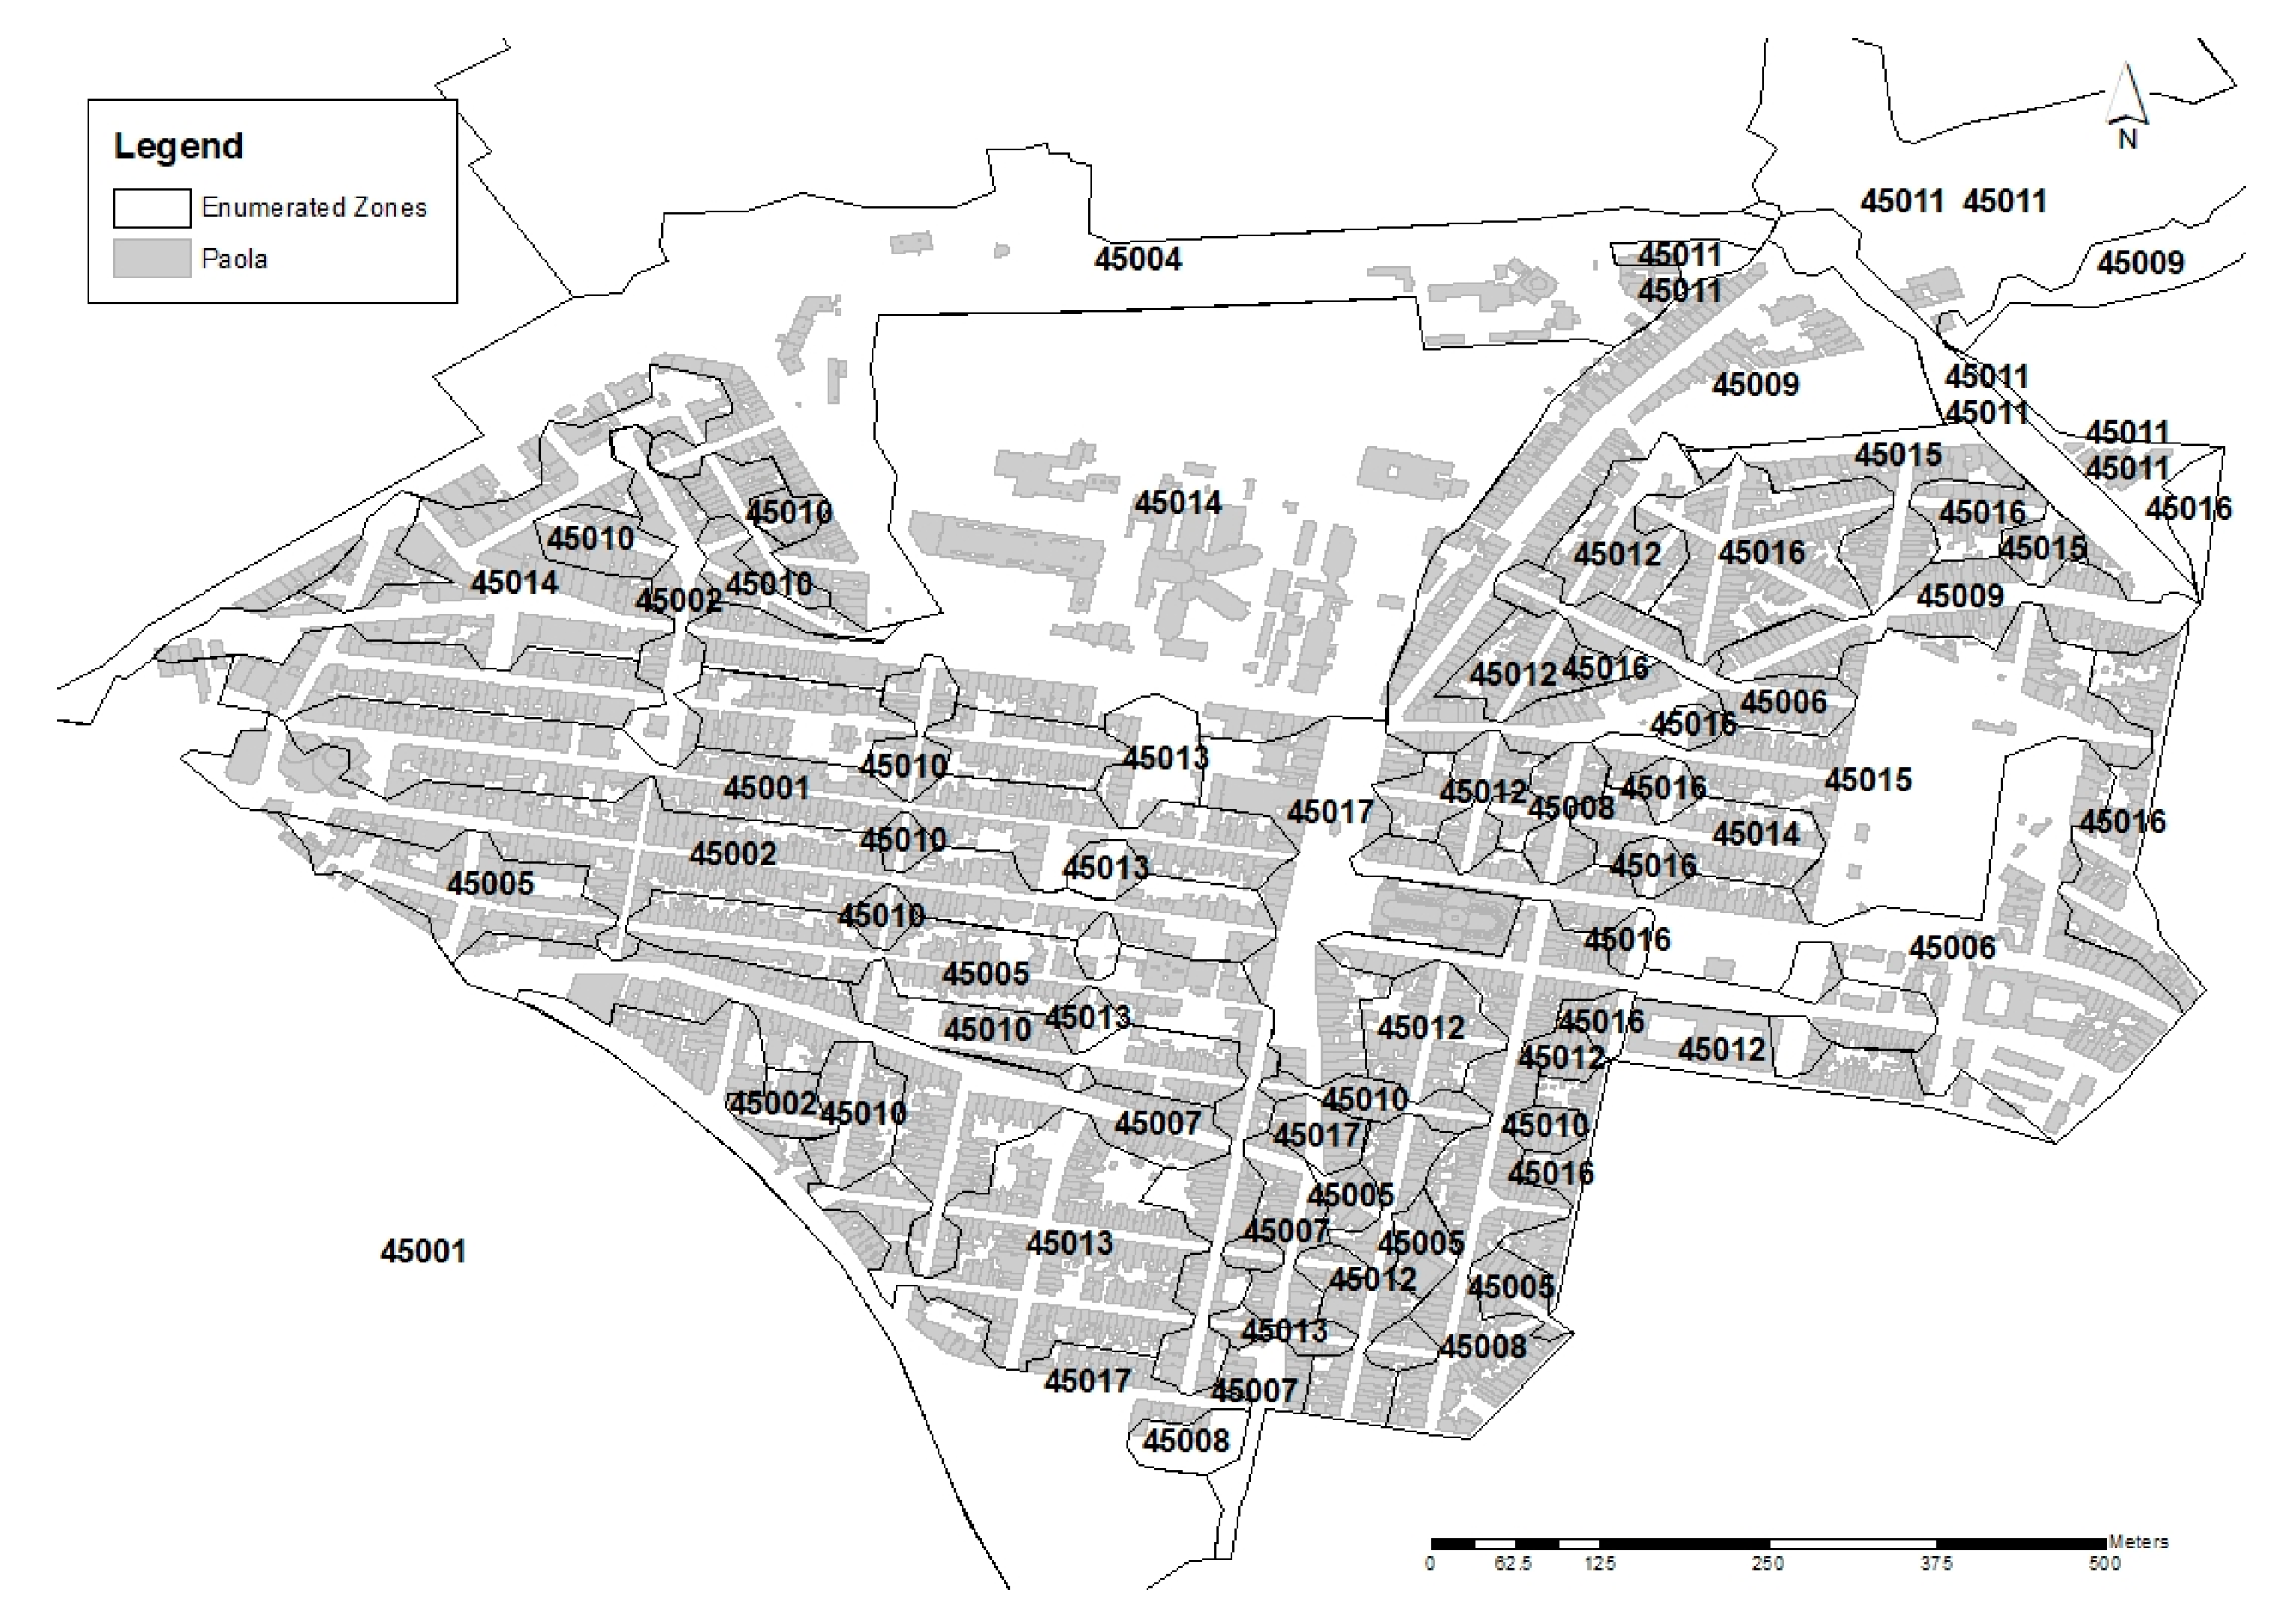
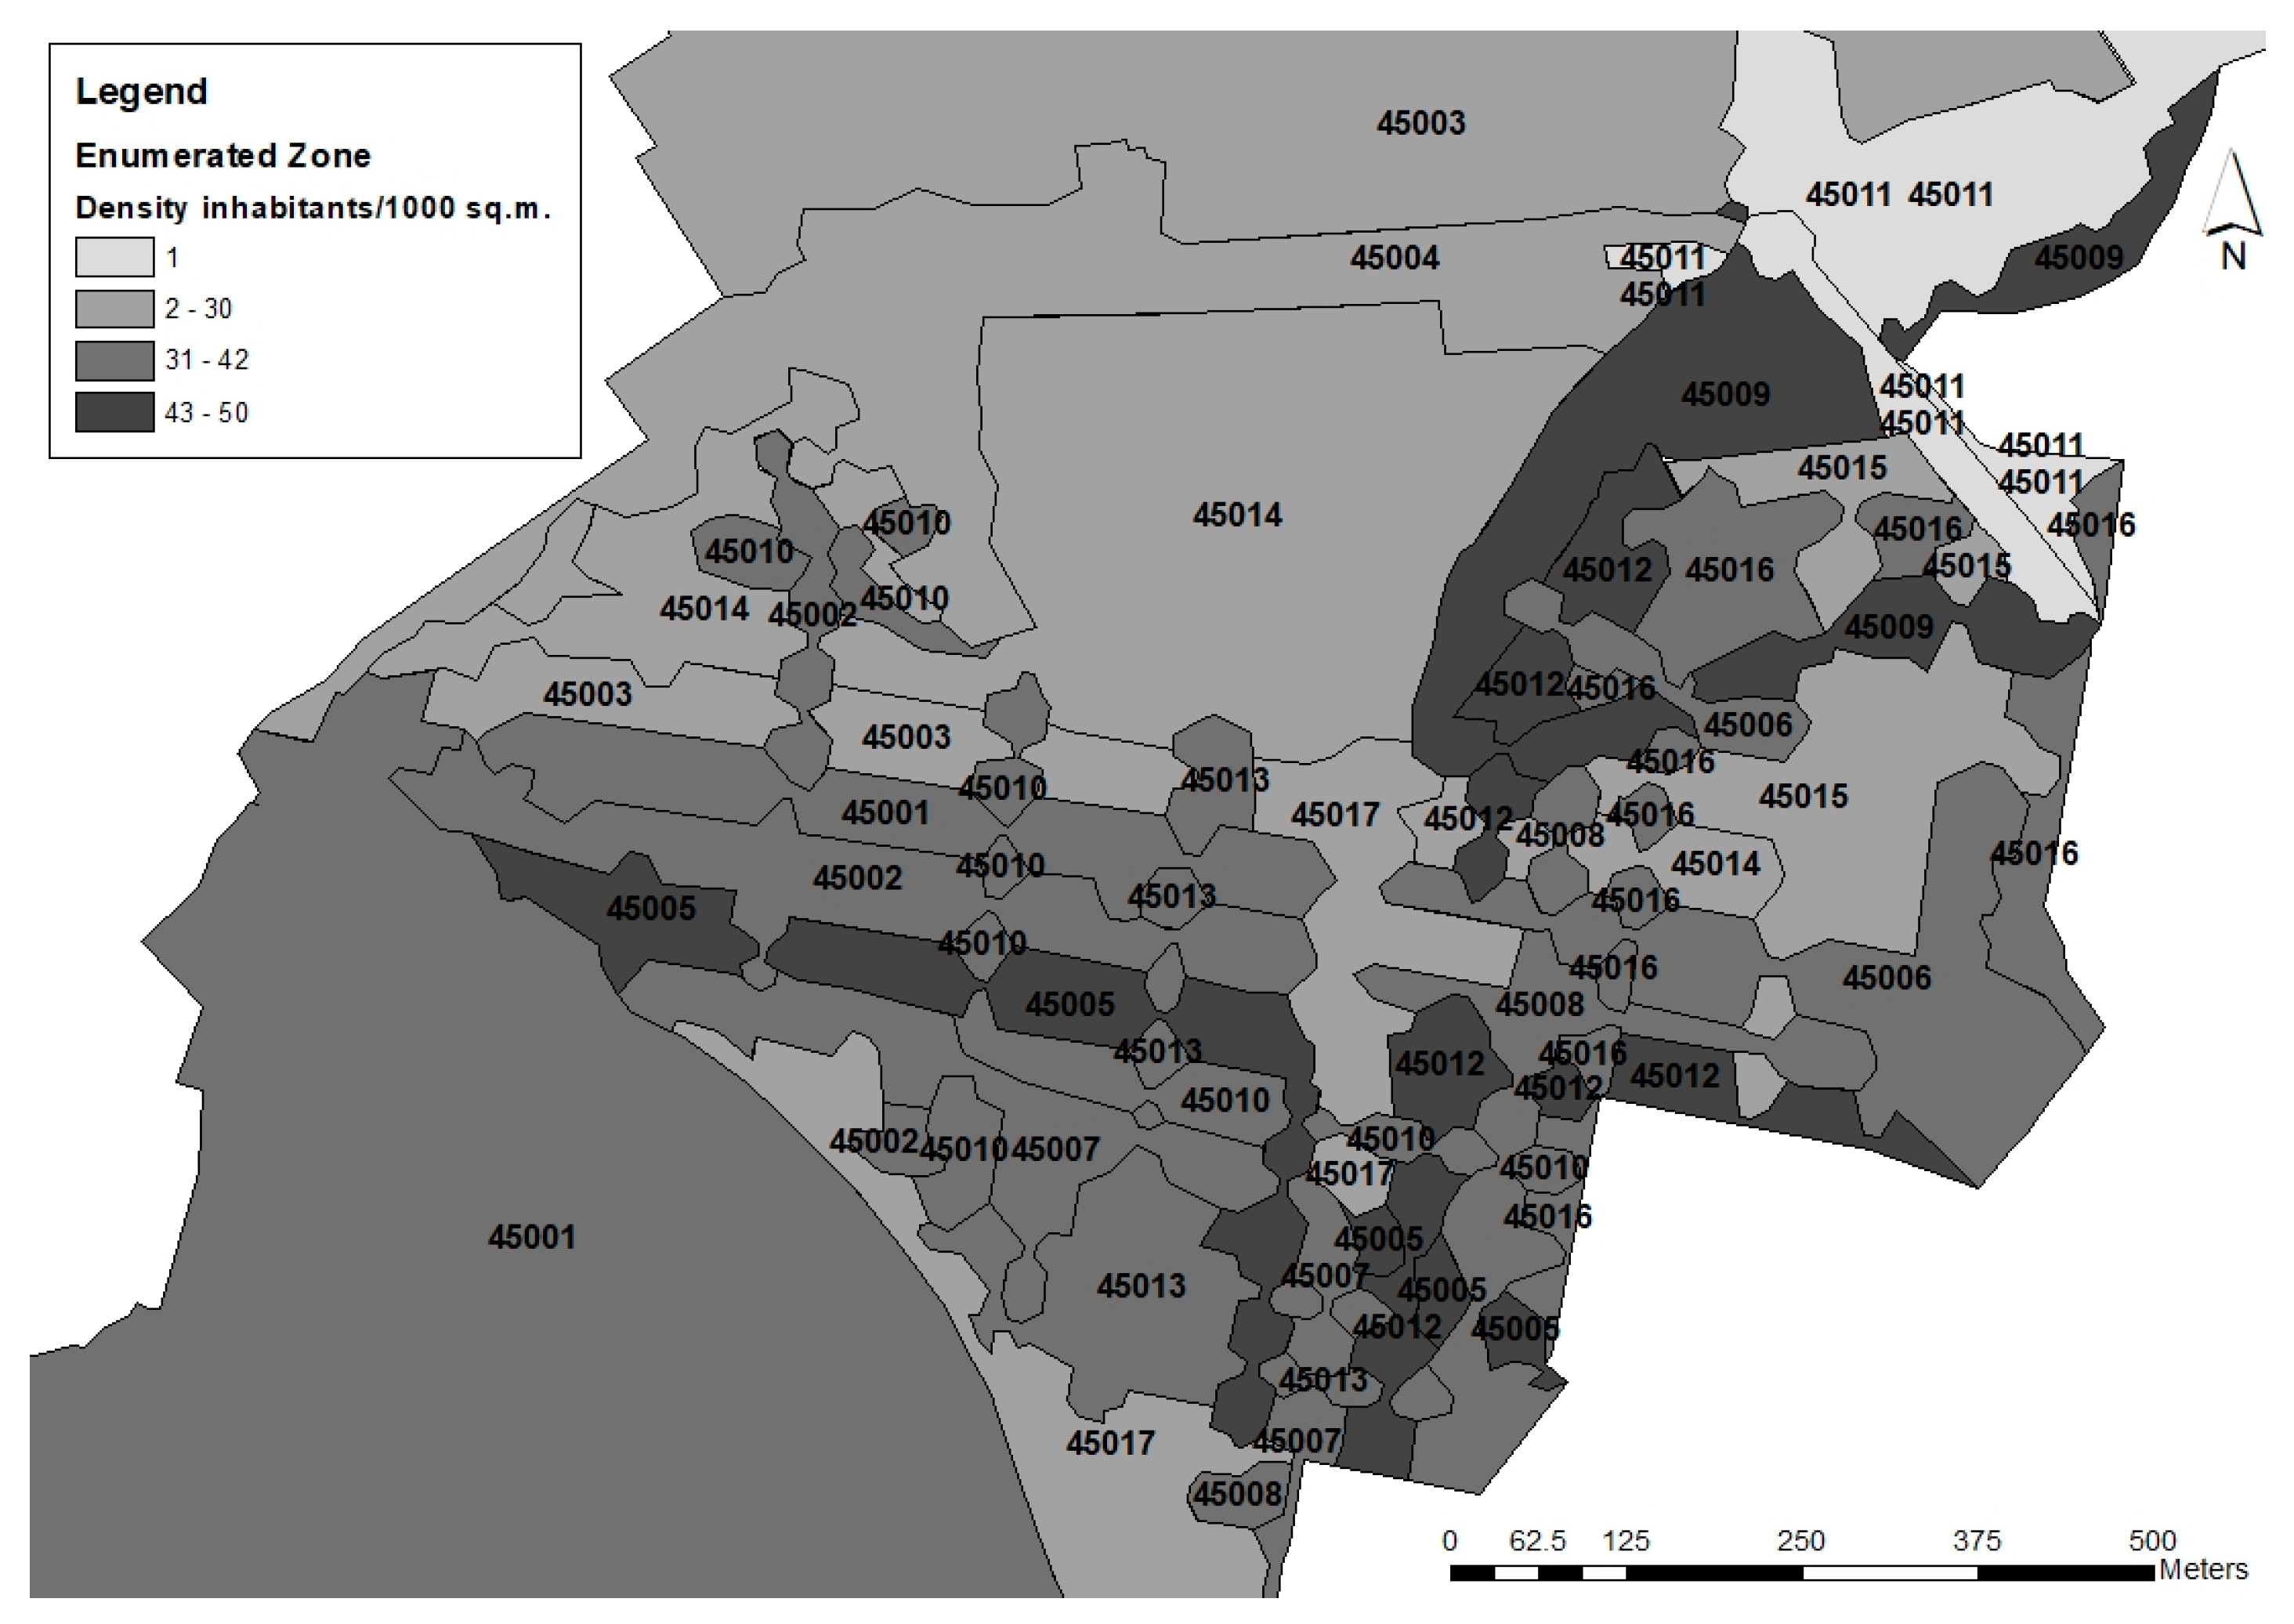
28]. The Geographic Coordinate System (GCS) used was WGS1984 and the Universal Transverse Mercator (UTM Zone 33 N) was applied at a later stage for analytical purposes. The whole area of Paola was divided into enumerated zones as assigned by the National Statistics Office (NSO) (
Figure 3). The zones were used to gather relevant data, which are available in
Table 1, for example, height, road lengths and density. It is useful to note that zones 45001, 45014, and 45004 were not used because the first one is the state-owned Santa Maria Addolorata Cemetery, the second is the Corradino Correctional Facility and the third includes the premises of a Higher Education Institution.
The street data were obtained in digital format (shapefiles) with a polyline feature class from Transport Malta (TM). Each street section was selected and exported according to the enumerated zones. Speed data were provided through the TM Transport Model according to each street section. The theoretical speed was used, this being the speed used for the purposes of calculating the link capacity, in relation to the street classification and design characteristics. Slope points were collected using LIDAR data, and the gradient was calculated for each street section and mapped accordingly.
Sidewalks were measured on-site using a measuring tape. There were instances where there was no sidewalk, which were coded as ‘0’. The rest of the widths varied between 0.3 m and 6.3 m. The state of the flooring was observed on-site and was classified using a Likert scale labelled as follows: None, Poor, Fair, Good, Very Good, and Excellent. Crossroads and pedestrian crossings were collected on-site and marked on the GIS using point data. The same procedure was applied for the mapping of benches. Shaded areas were marked with the location of trees, also using the feature class point.
Land use data were also collected during field surveys for each enumeration zone. Each land use was coded according to its category (healthcare, grocery, local services, education, commercial, parking, recreational, residential, retail, garage, offices, religious, vacant, petrol station, transit, sport, culture, food and church).
The spatial analytical methodology included basic spatial analysis by category in order to categorise the land uses. Symbology was used for trees, benches and traffic lights; graduated symbols were used to represent maximum speeds and sidewalk widths. Slope point data were analysed using kernel density estimation (KDE), which allowed the geo-visualisation of the spots that have the highest slope points in Paola.
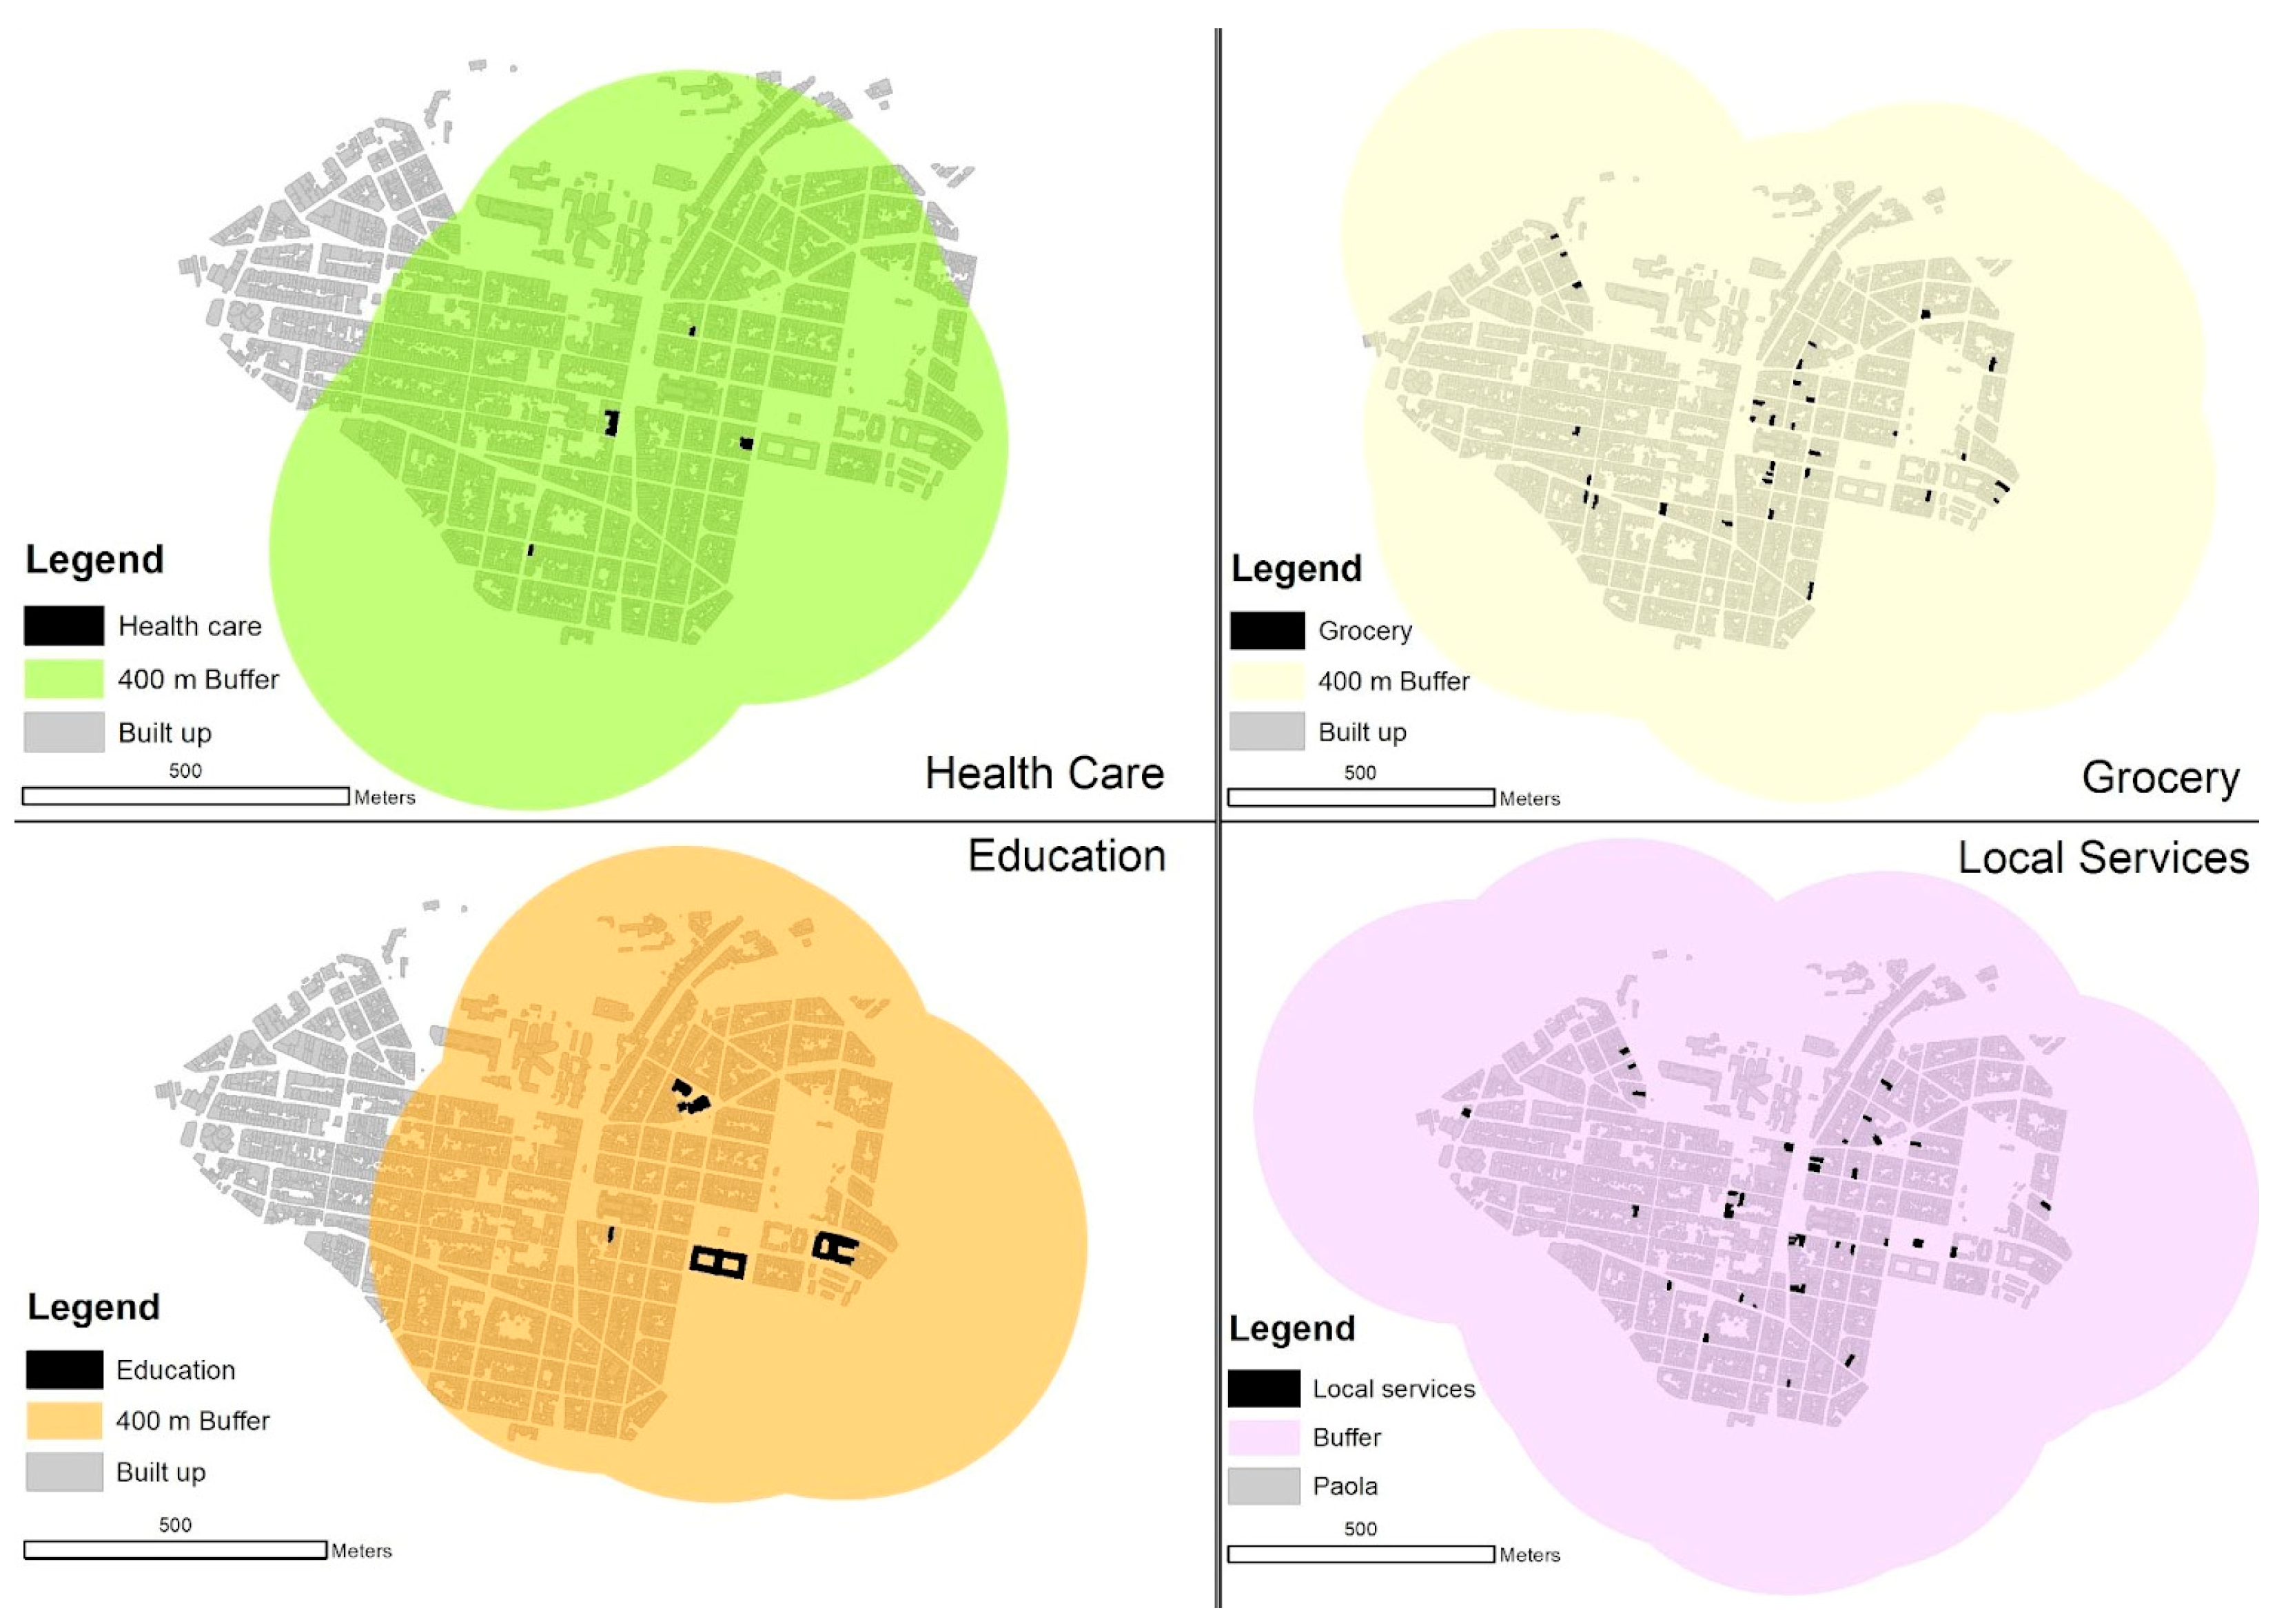
Proximity is another important component for the Timed City concept. Proximity to services, including healthcare, education, groceries and local services was analysed with the buffer tool. A 400 m buffer representing the Euclidian distance (as the crow flies) was applied to show the area covered if people were to walk from the particular service.
3. Results
In this section, a description of the various data sets is provided together with a spatial analysis comparing some of the datasets. In particular, there is a focus on those data sets that illustrate interesting results and the ensuing interpretation.
3.1. Proximity to Services
The buffer analysis (
Figure 4) shows that groceries and local services have a good catchment area for pedestrians. This means that there are enough of these services in Paola and that their distribution provides the opportunity for them to be accessed on foot. Health care and education also have good pedestrian catchments in the upper part of Paola (
Figure 4). The lower parts of Paola do not fall within the buffer of these two services, thus marginalising the communities found in these areas, with respect to walking as a transport mode.
3.2. Land Uses and Density
The density for each enumeration zone was calculated using the ground floor area and the number of persons residing in each enumeration zone.
Figure 5 geo-visualises the densities of each enumeration zone. The analysis was conducted using graduated colours; the darker the colour, the higher the resident density. The enumeration zones in the central area have the highest densities. EZs 45009 and 45012 also have high densities.
3.3. Access to Open Spaces
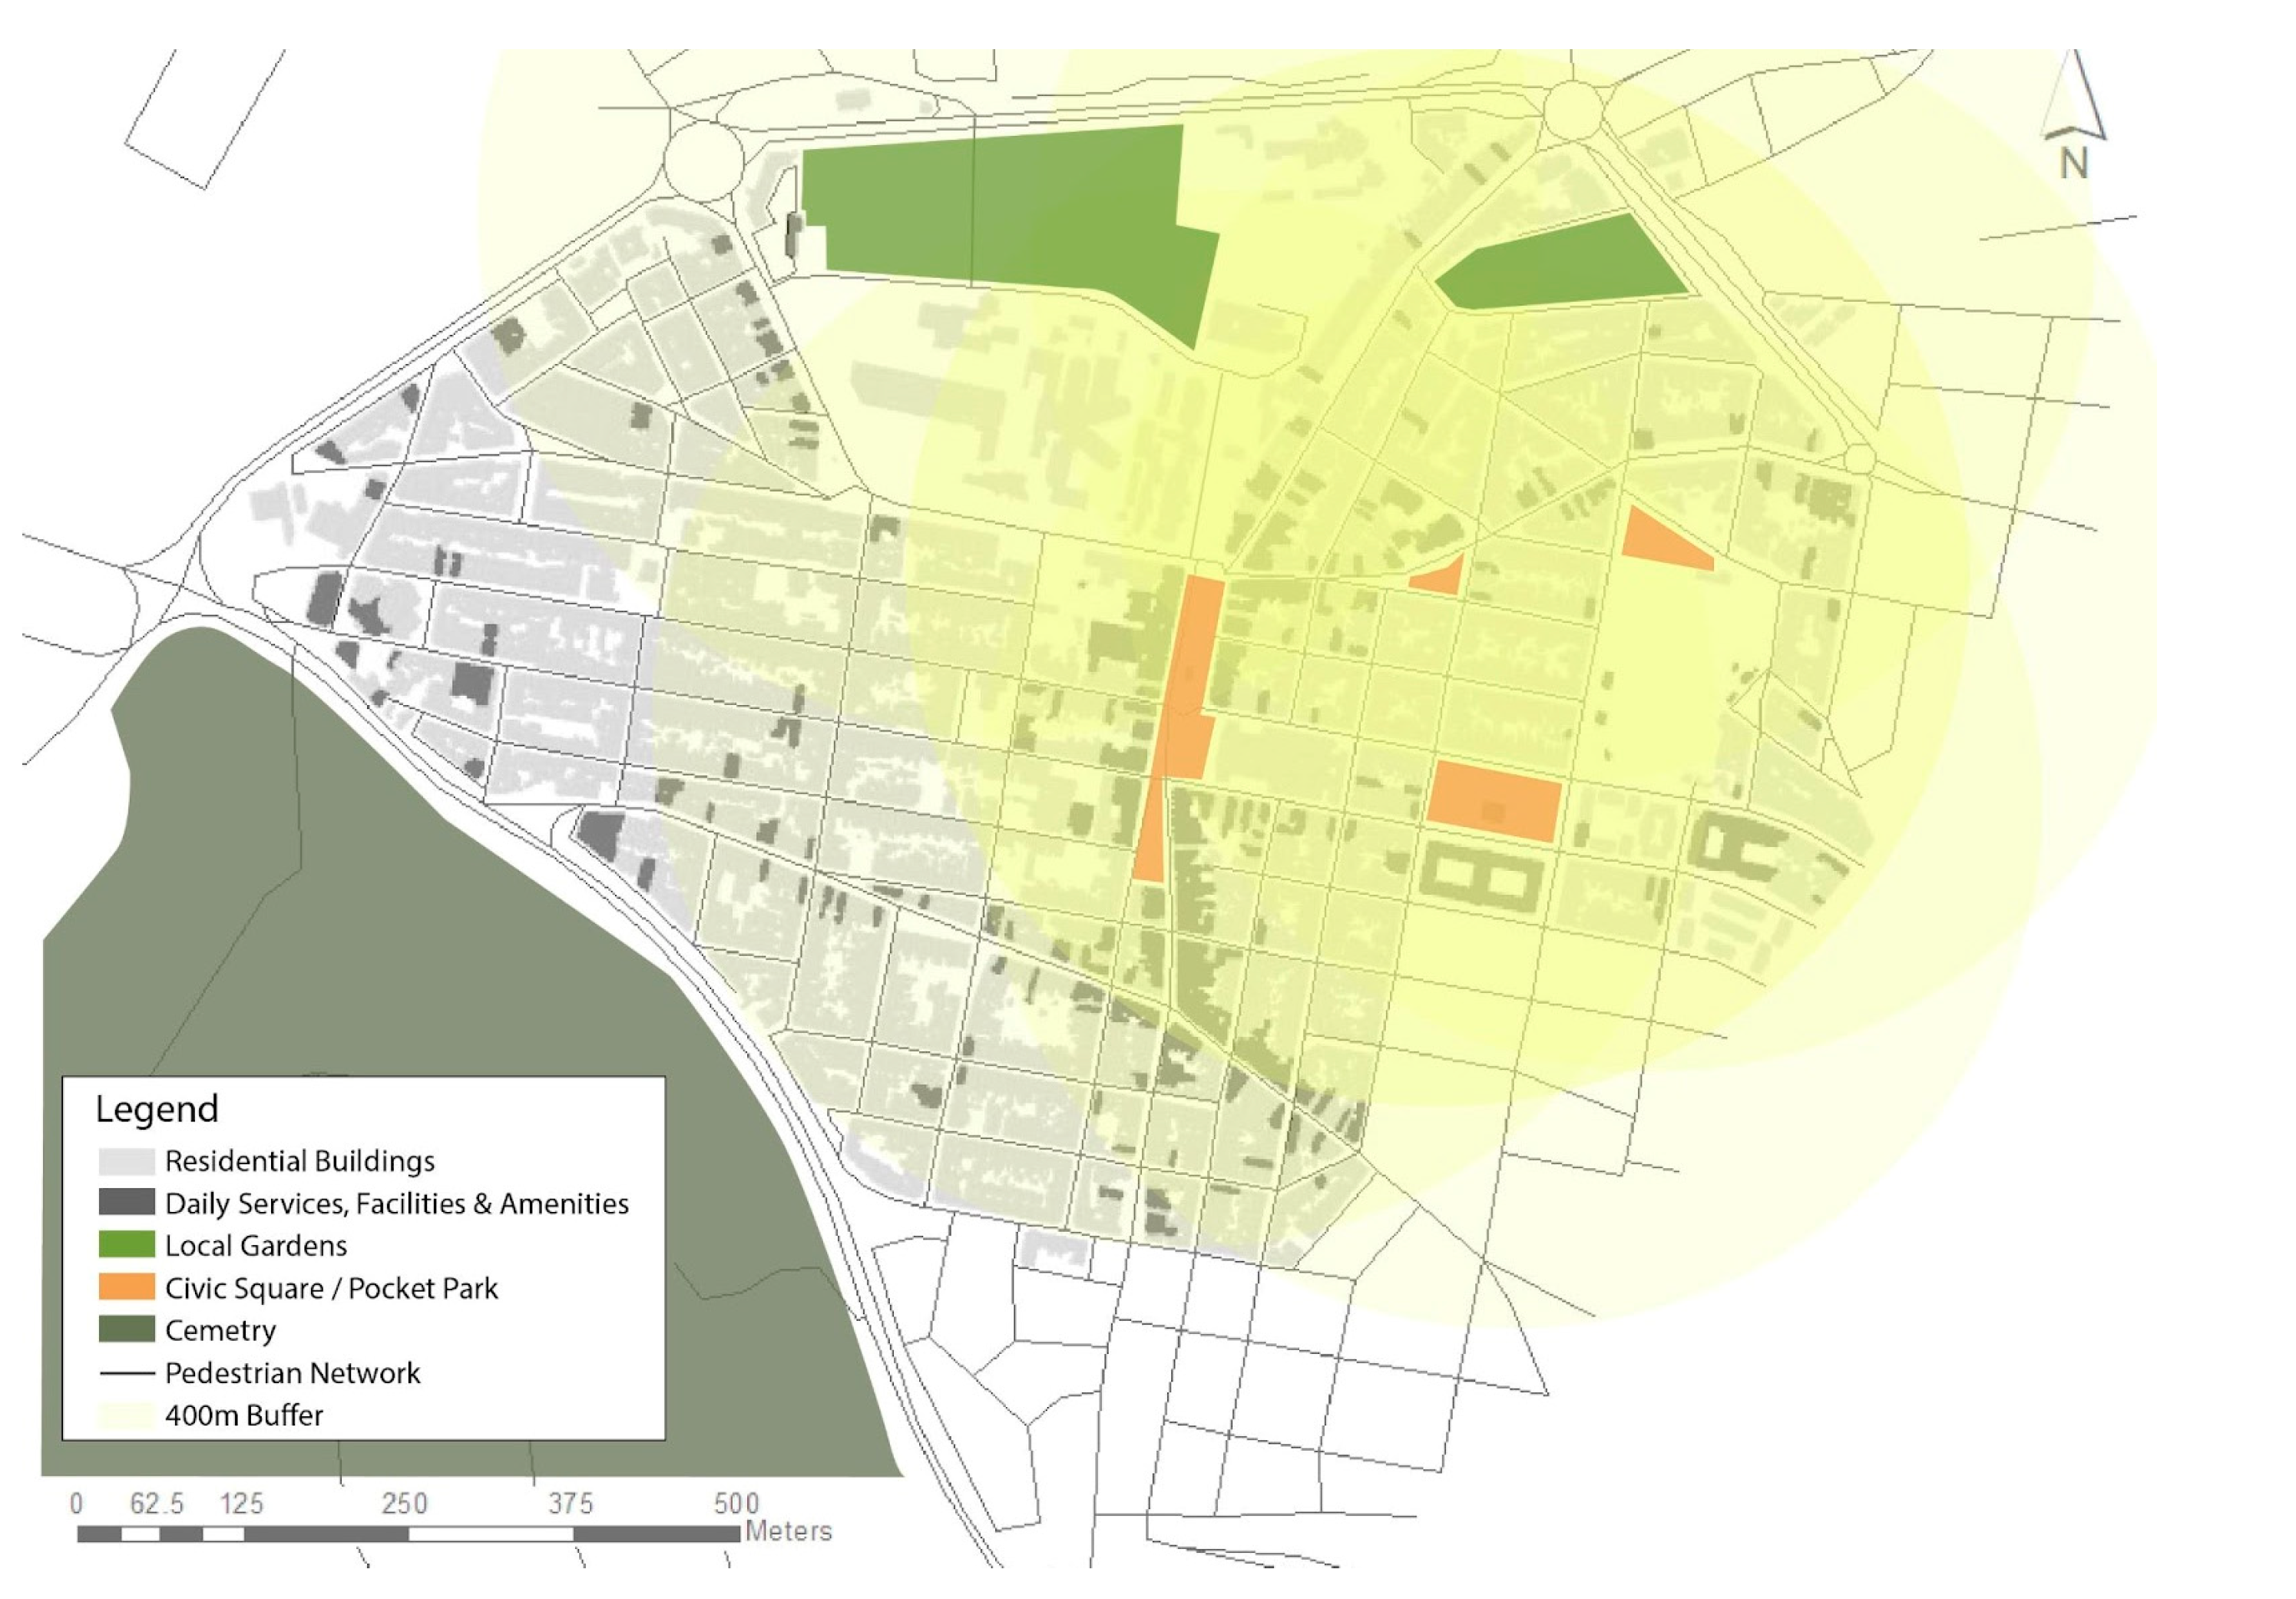
The recreational open spaces were mapped and a 400 m buffer was used to identify their catchment area for pedestrians.
Figure 6 shows that most of the Paola locality is within walking distance of a recreational open space; however, some residential areas to the west of the locality fall outside this catchment area.
3.4. Land Uses and Vehicular Speed Analysis
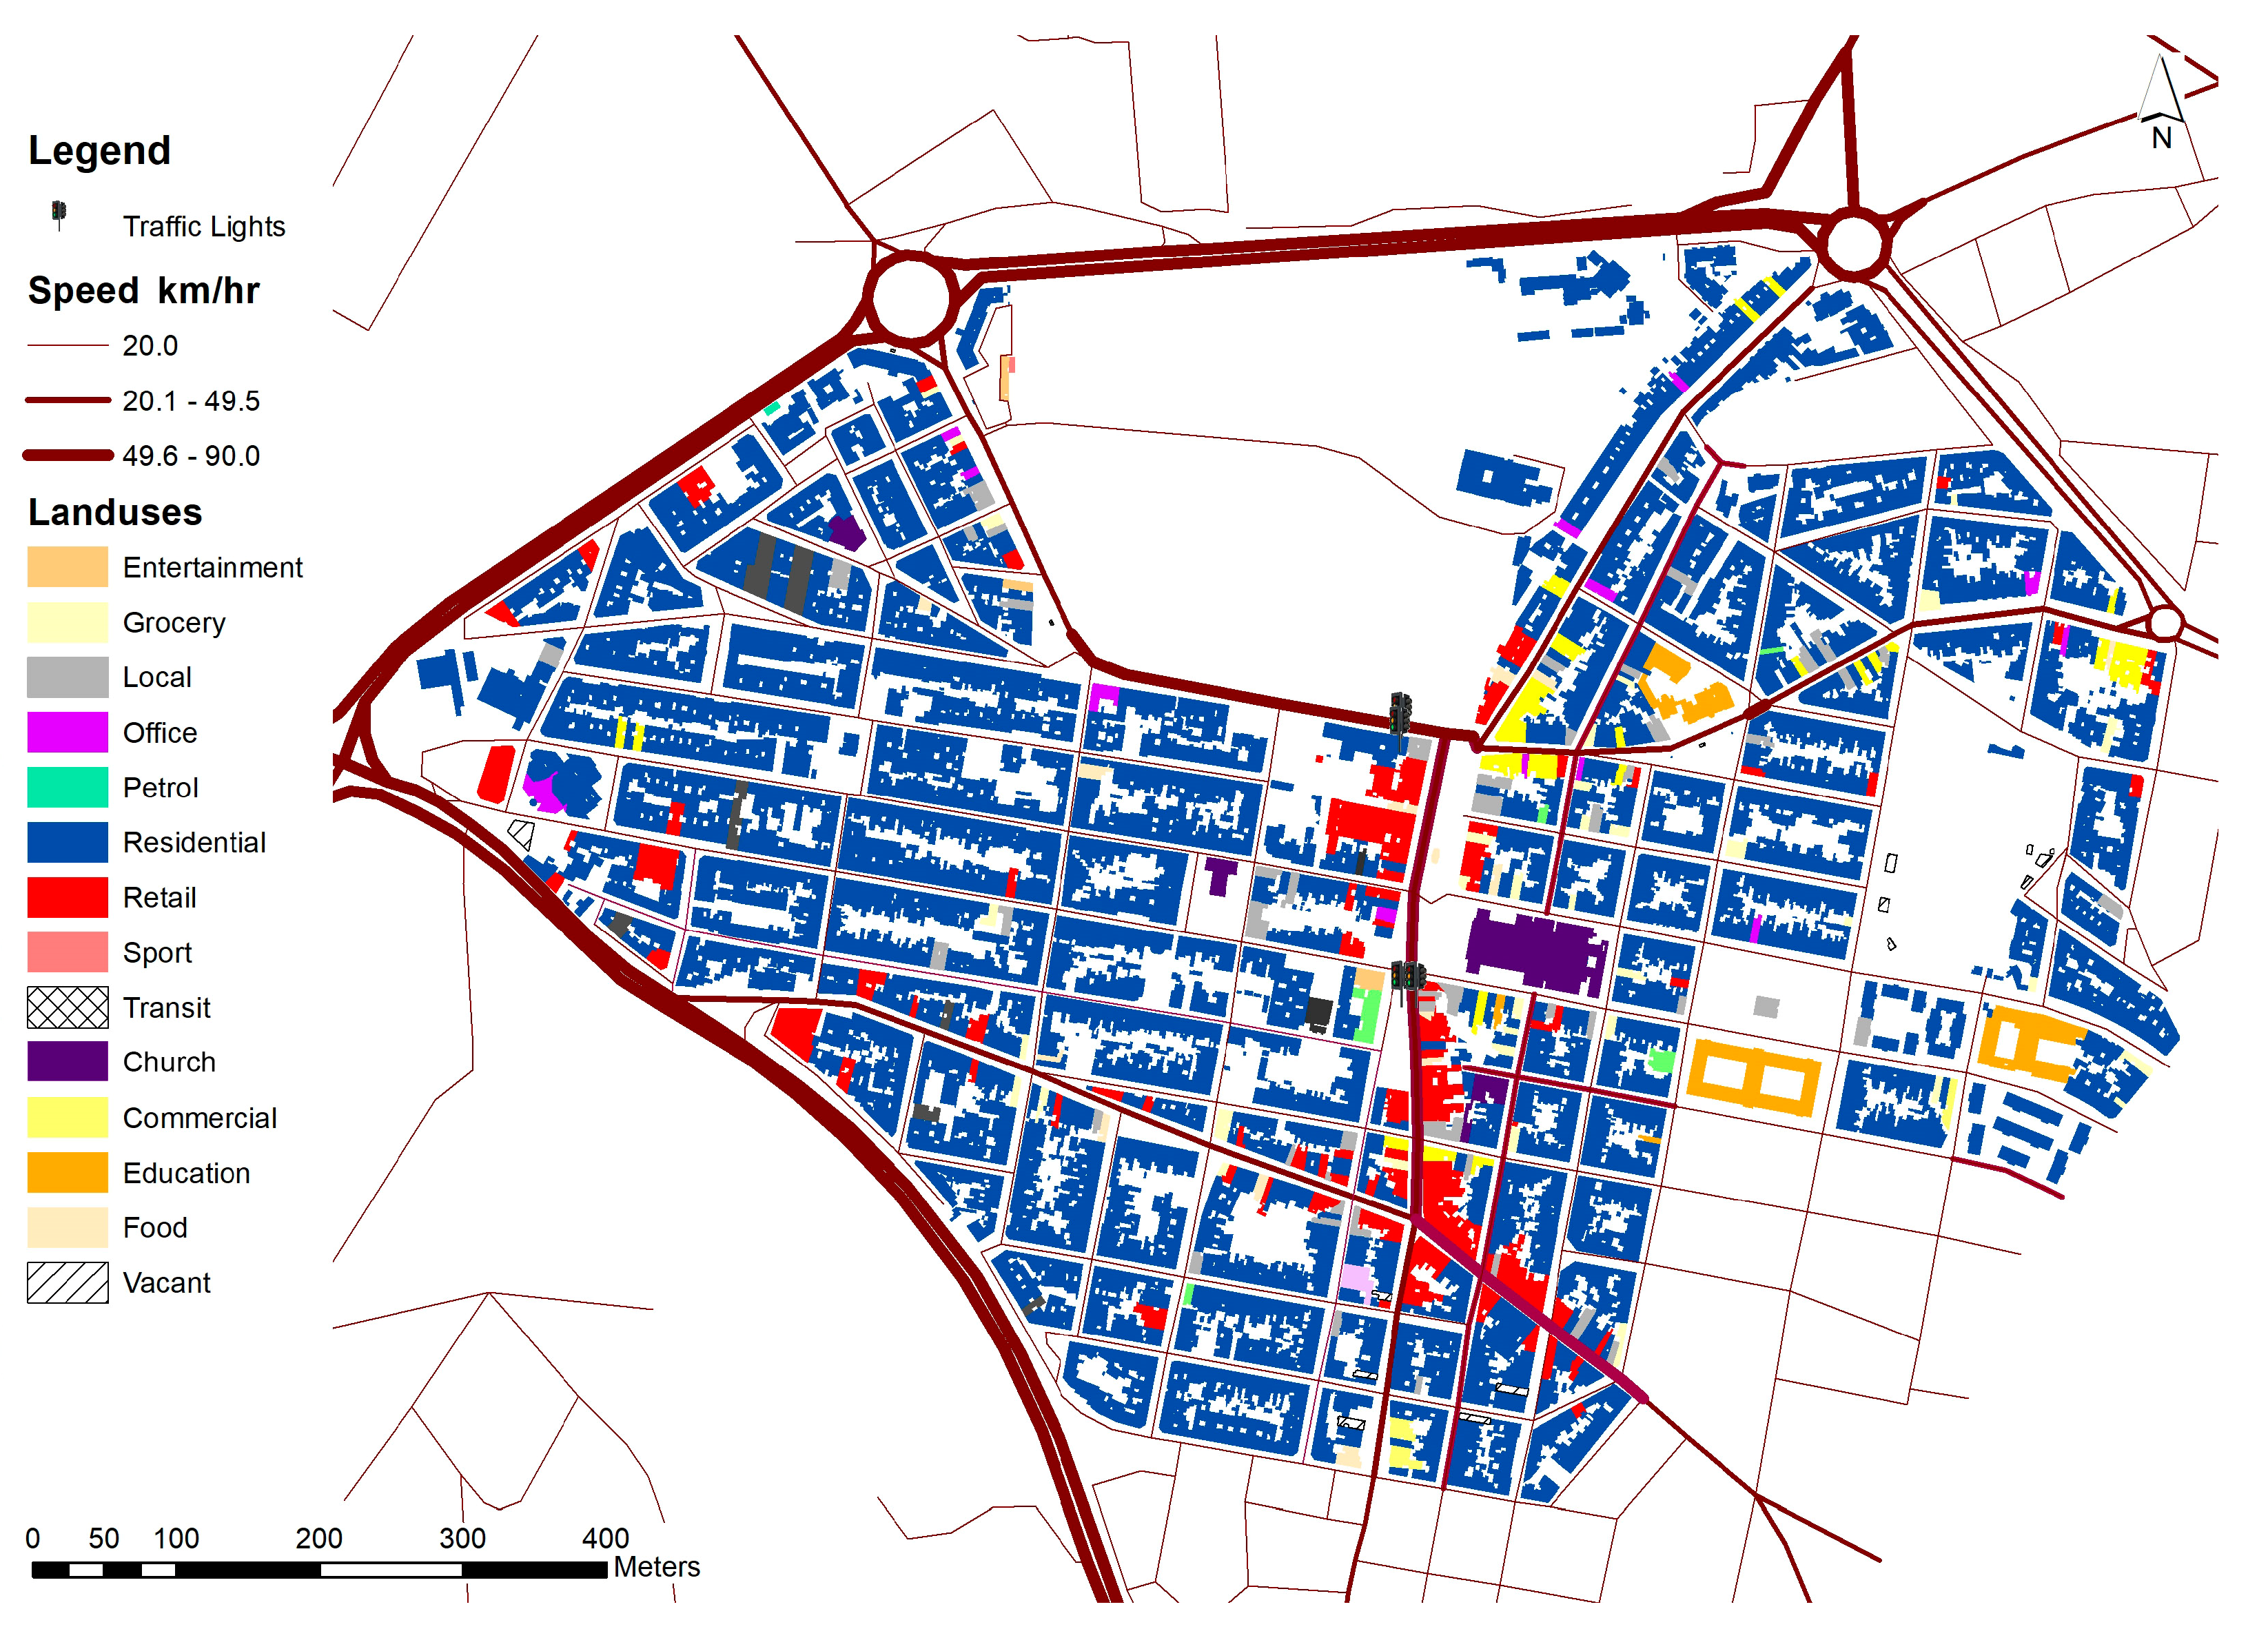
The land use map (
Figure 7) shows that Paola is a highly residential area. The retail outlets are mainly clustered along one of the main roads. On this road, the maximum speed linked to the street design capacity is 50 km/h. Land uses linked with education are located behind the main church (marked in dark purple). The educational land uses to the east of the church are situated next to streets where the maximum speed is 20 km/h. To the north of the church, however, an educational land use is situated next to a street where the maximum speed is 50 km/h. Most of the commercial outlets are clustered north of the main church and are also situated on streets with a high maximum speed (50 km/h).
3.5. Vehicular Speed Analysis and Pavement Widths
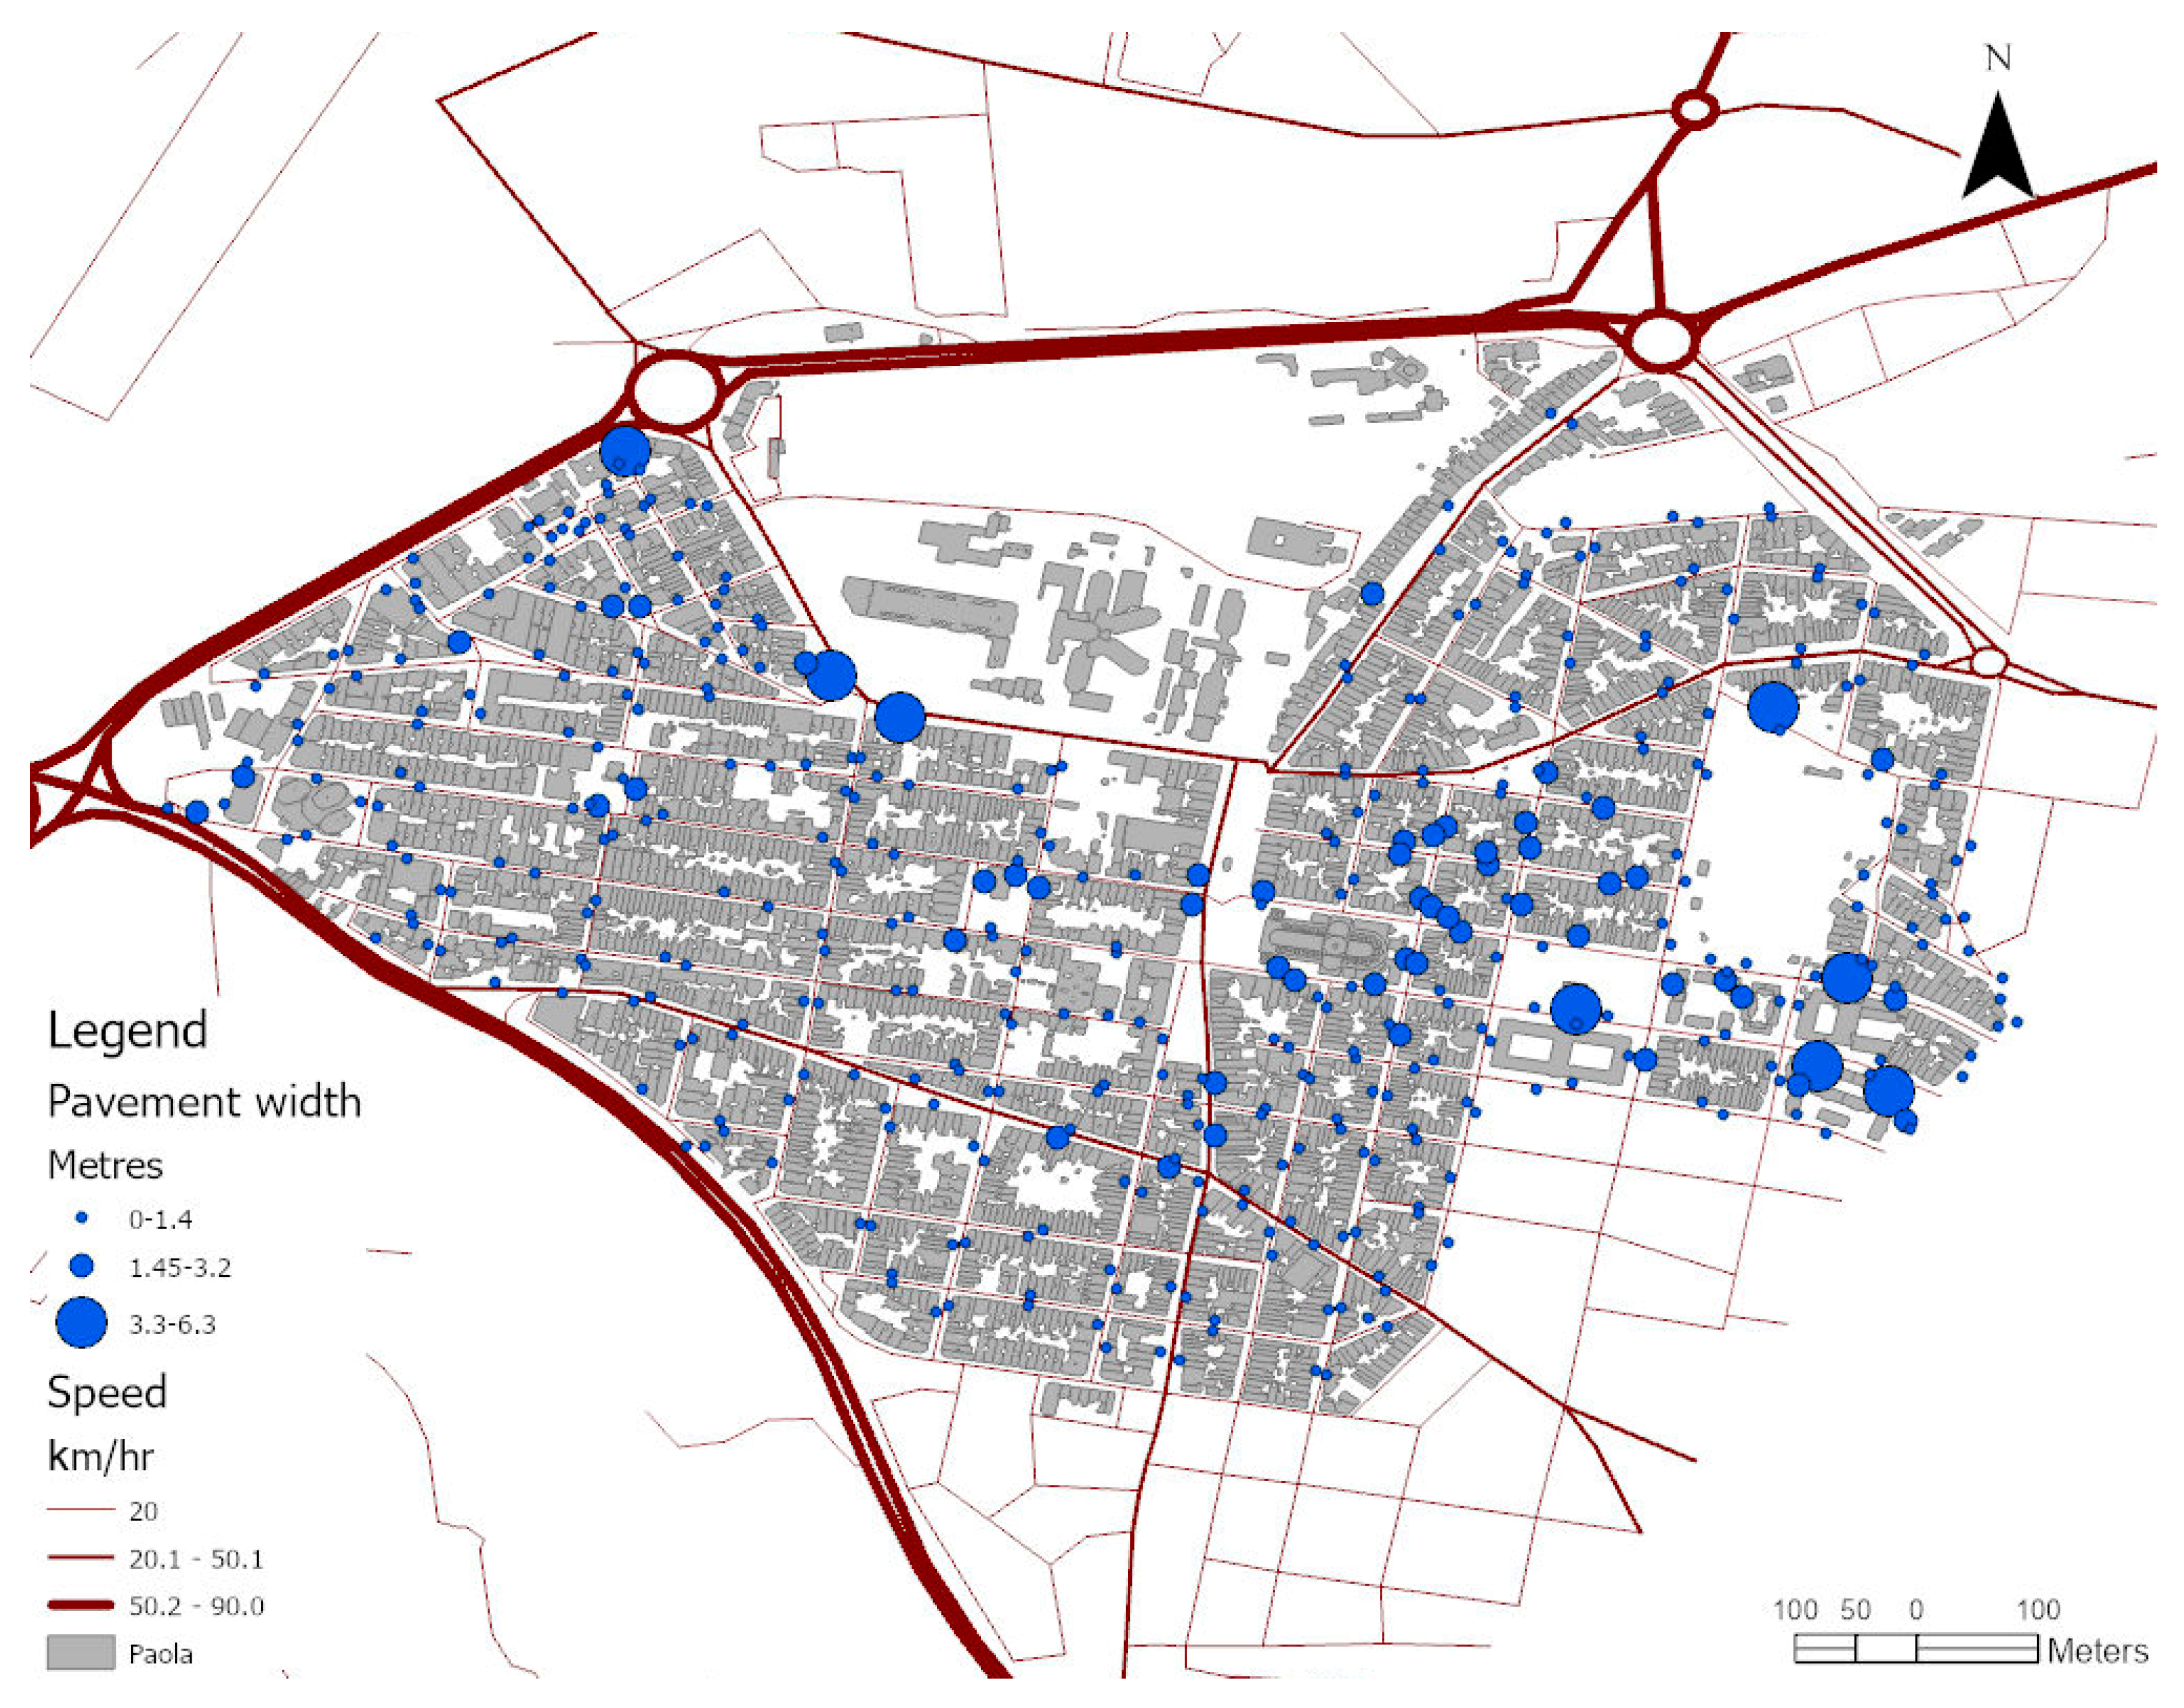
Figure 8 shows the maximum speeds and pavement widths in Paola. Both speeds and pavement widths are represented with graduated symbology, the larger or thicker the symbol the wider the pavement or the higher the speed. It is worth noting that there are streets where pavements are absent, therefore pedestrians have to walk in the carriageway of the street. The lack of pavements or narrow widths therefore results in unsafe access for pedestrians. Initial observations do not suggest that the lack of pavements results in slower speeds particularly from a policy perspective. Meaning, that no reduced maximum speed limits are set to compensate for reduced infrastructural provision for pedestrians. Another issue that should be considered is where there is the cluster of retail outlets (indicated in
Figure 7) and the maximum speed is high (50 km/h) the pavement width is narrow (
Figure 8). This situation leads to safety issues in the area.
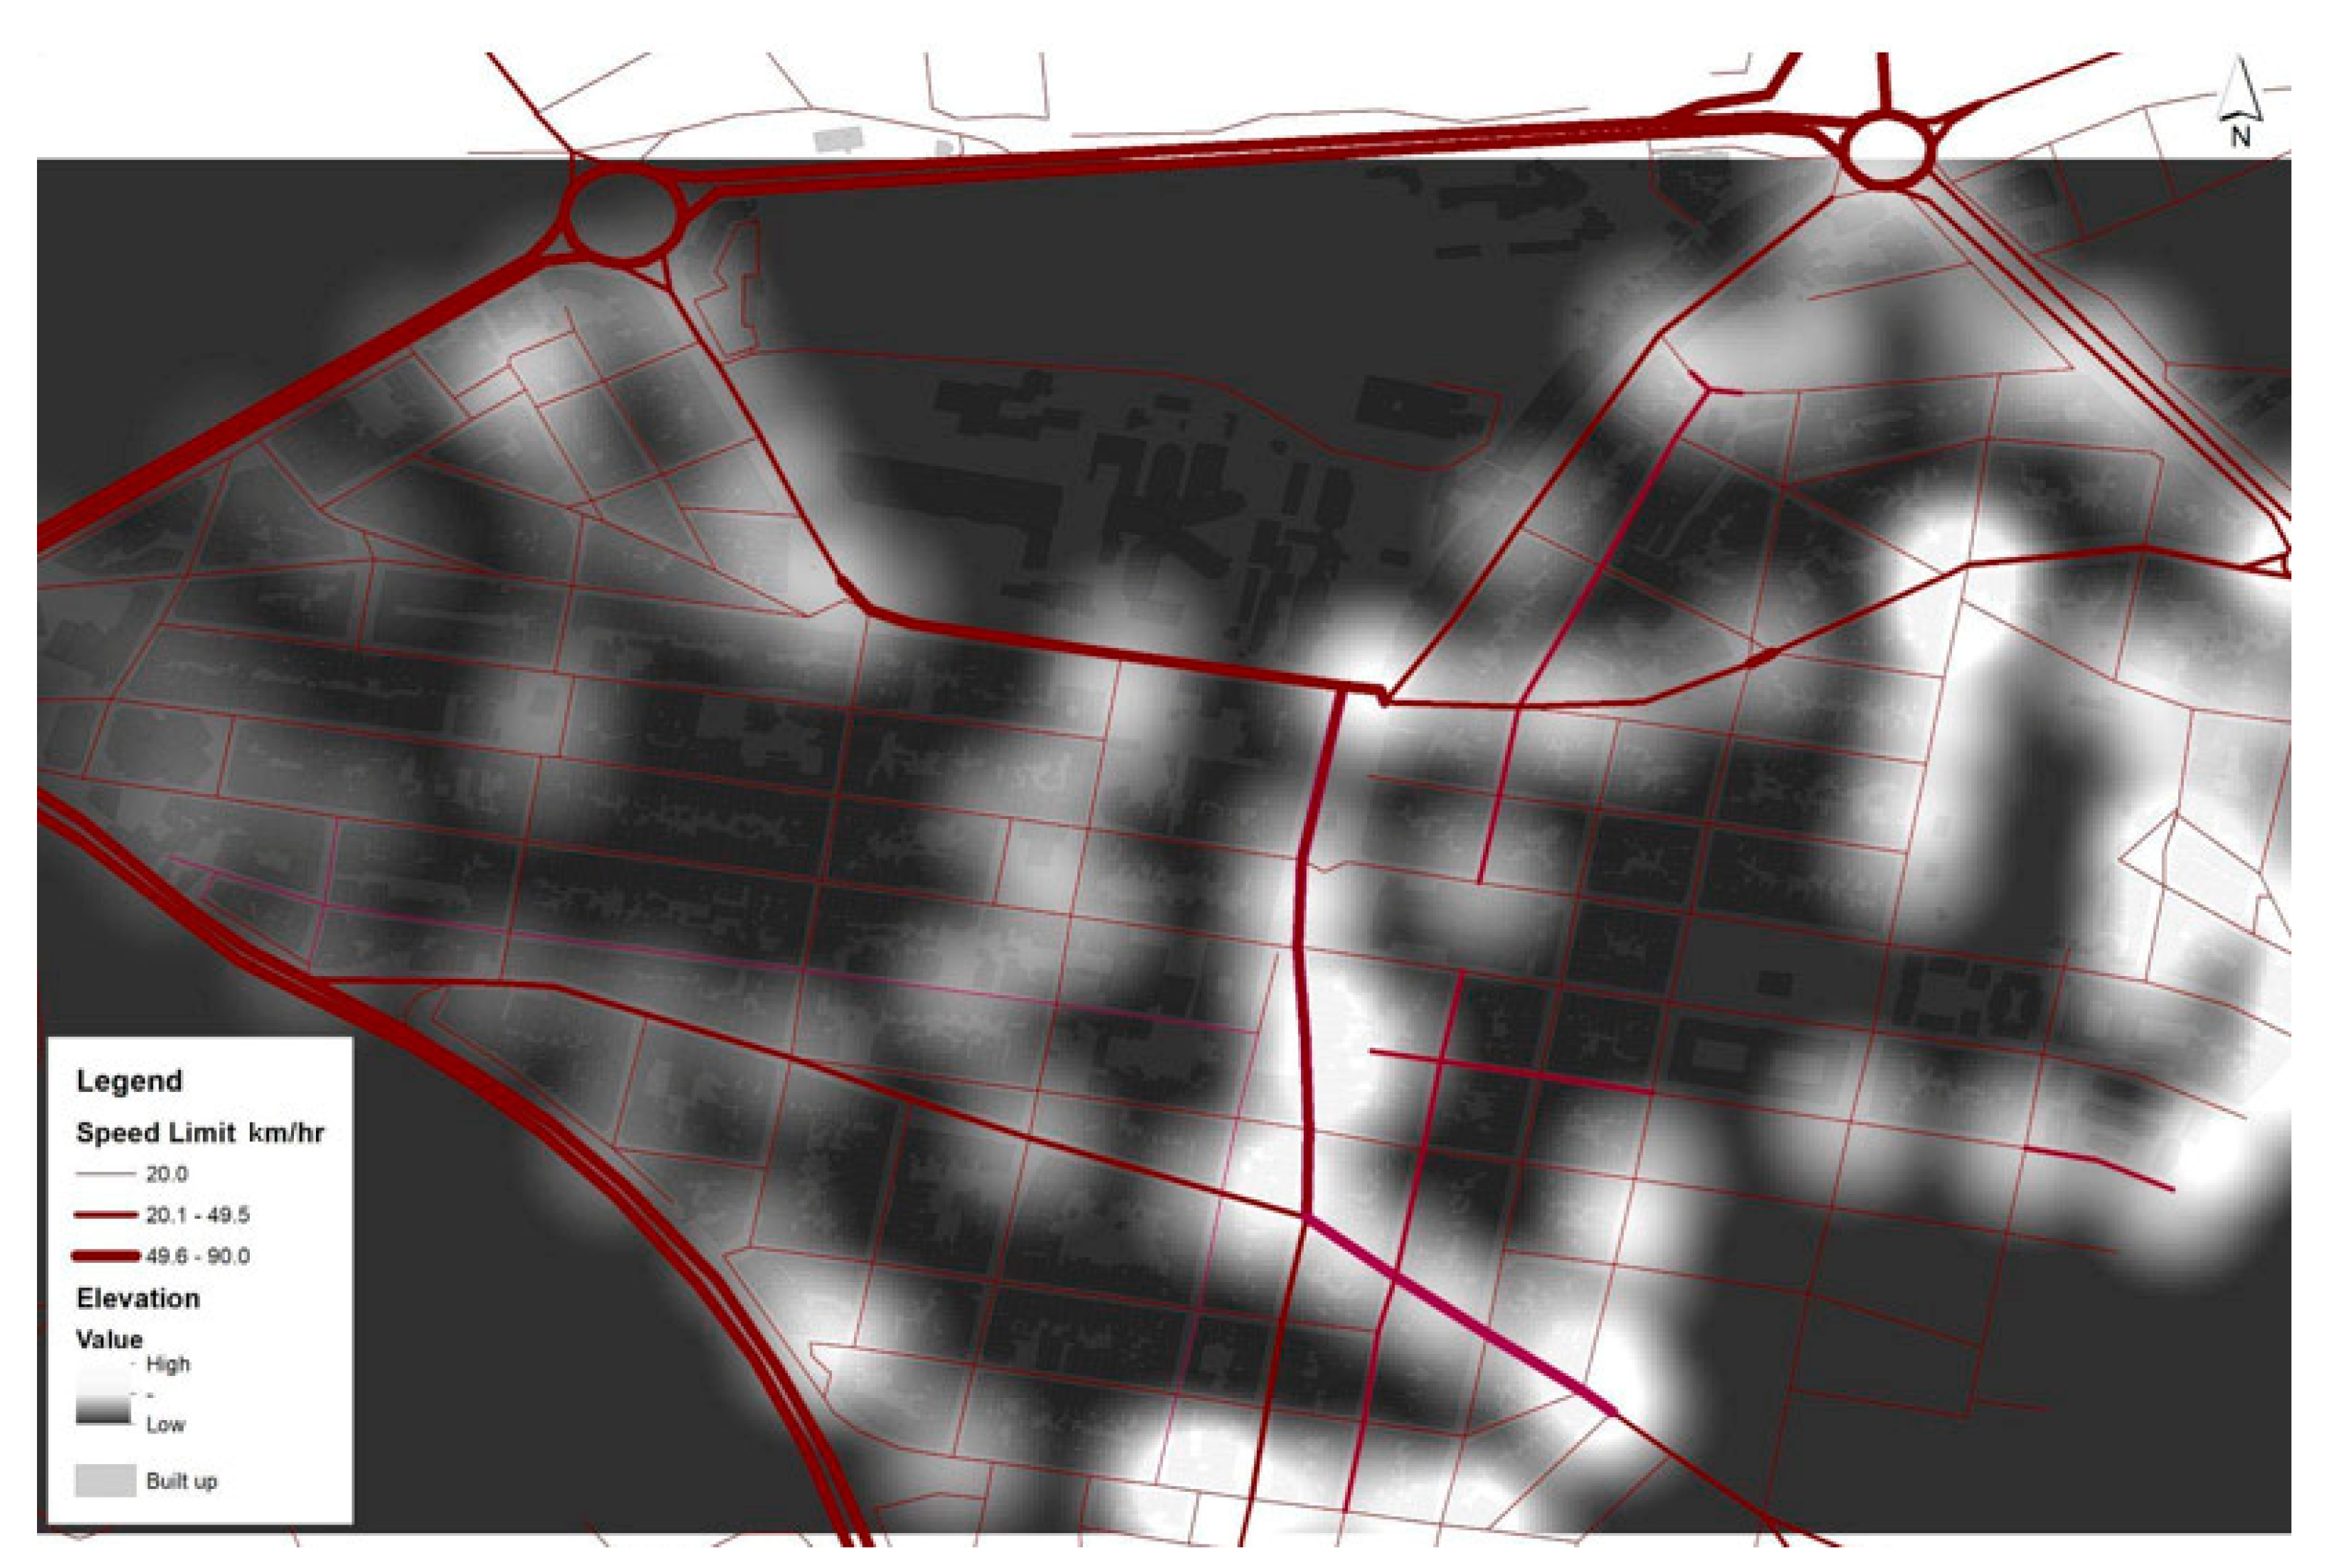
3.6. Elevation and Maximum Speeds
The highest elevation lies along streets that have maximum speeds of 50 km/h (
Figure 9). A change in elevation within the same street section leads to increased force and, therefore, greater speeds. As indicated in
Figure 8, the pavement widths along these street segments are narrow, which means that the environment is not conducive to a feeling of safety along these areas.
3.7. Connectivity and Permeability
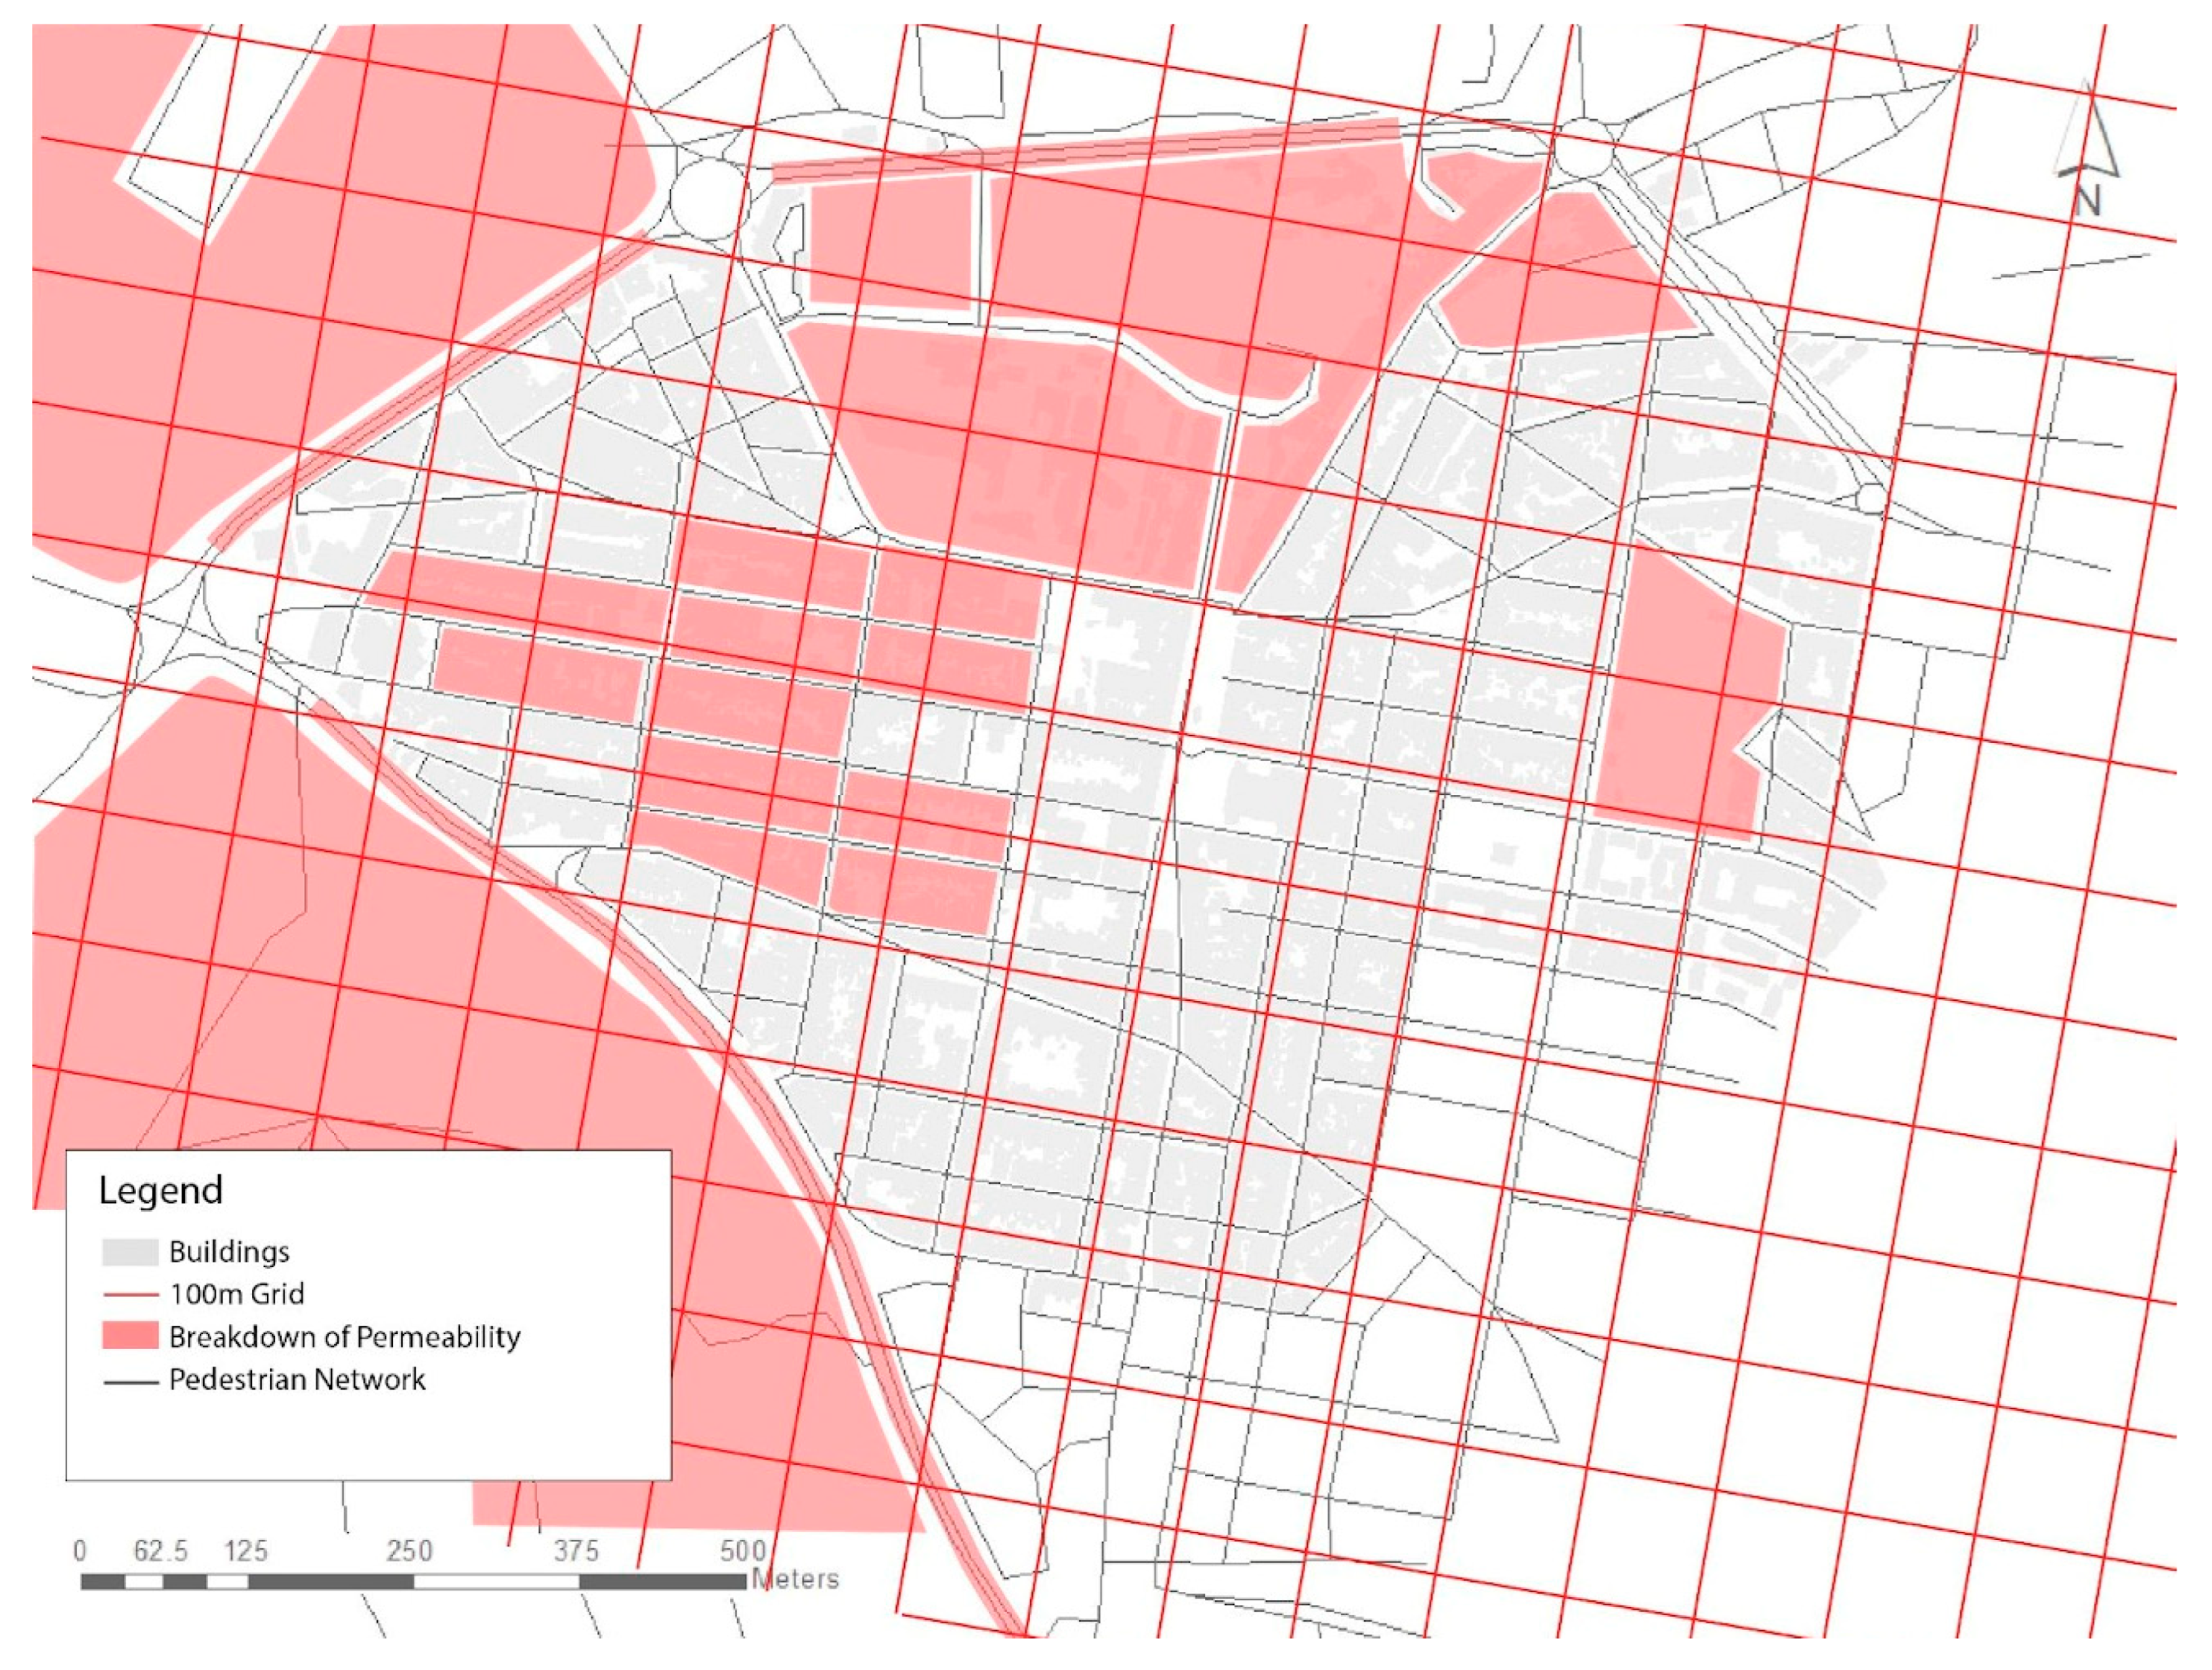
A connectivity analysis was carried out to understand the permeability of the locality in relation to morphological aspects. The pedestrian network was mapped based on the road network as well as the additional mapping of any pedestrian paths (
Figure 10). This was then overlaid with an optimal grid spacing that provides a suitable level of permeability to facilitate walking.
The size of urban blocks may vary depending on land uses, building types and city context. However, 50–70 m of spacing is considered optimal for intensive pedestrian activity, while larger urban blocks may be over 100 m. Typically, a grid spacing of 80–100 m is considered to provide an optimum network to facilitate pedestrian movement in most circumstances [
29]. A 100 m grid was therefore taken as the maximum limit and overlaid with the pedestrian network so as to identify any breakdown in permeability as a result of the urban grain. These areas are highlighted in red. This spatial analysis shows that while the locality is mostly permeable for pedestrians, this breaks down in some areas due to some blocks which are longer than 100 m. The Corradino Correctional Facility and a local garden to the north and the Santa Maria Addolorata Cemetery to the south also create a breakdown in permeability. Additionally, the locality is bounded to the north, northwest, and southwest with through-traffic routes which create a physical barrier due to limited safe pedestrian crossing points, thereby also hindering permeability.
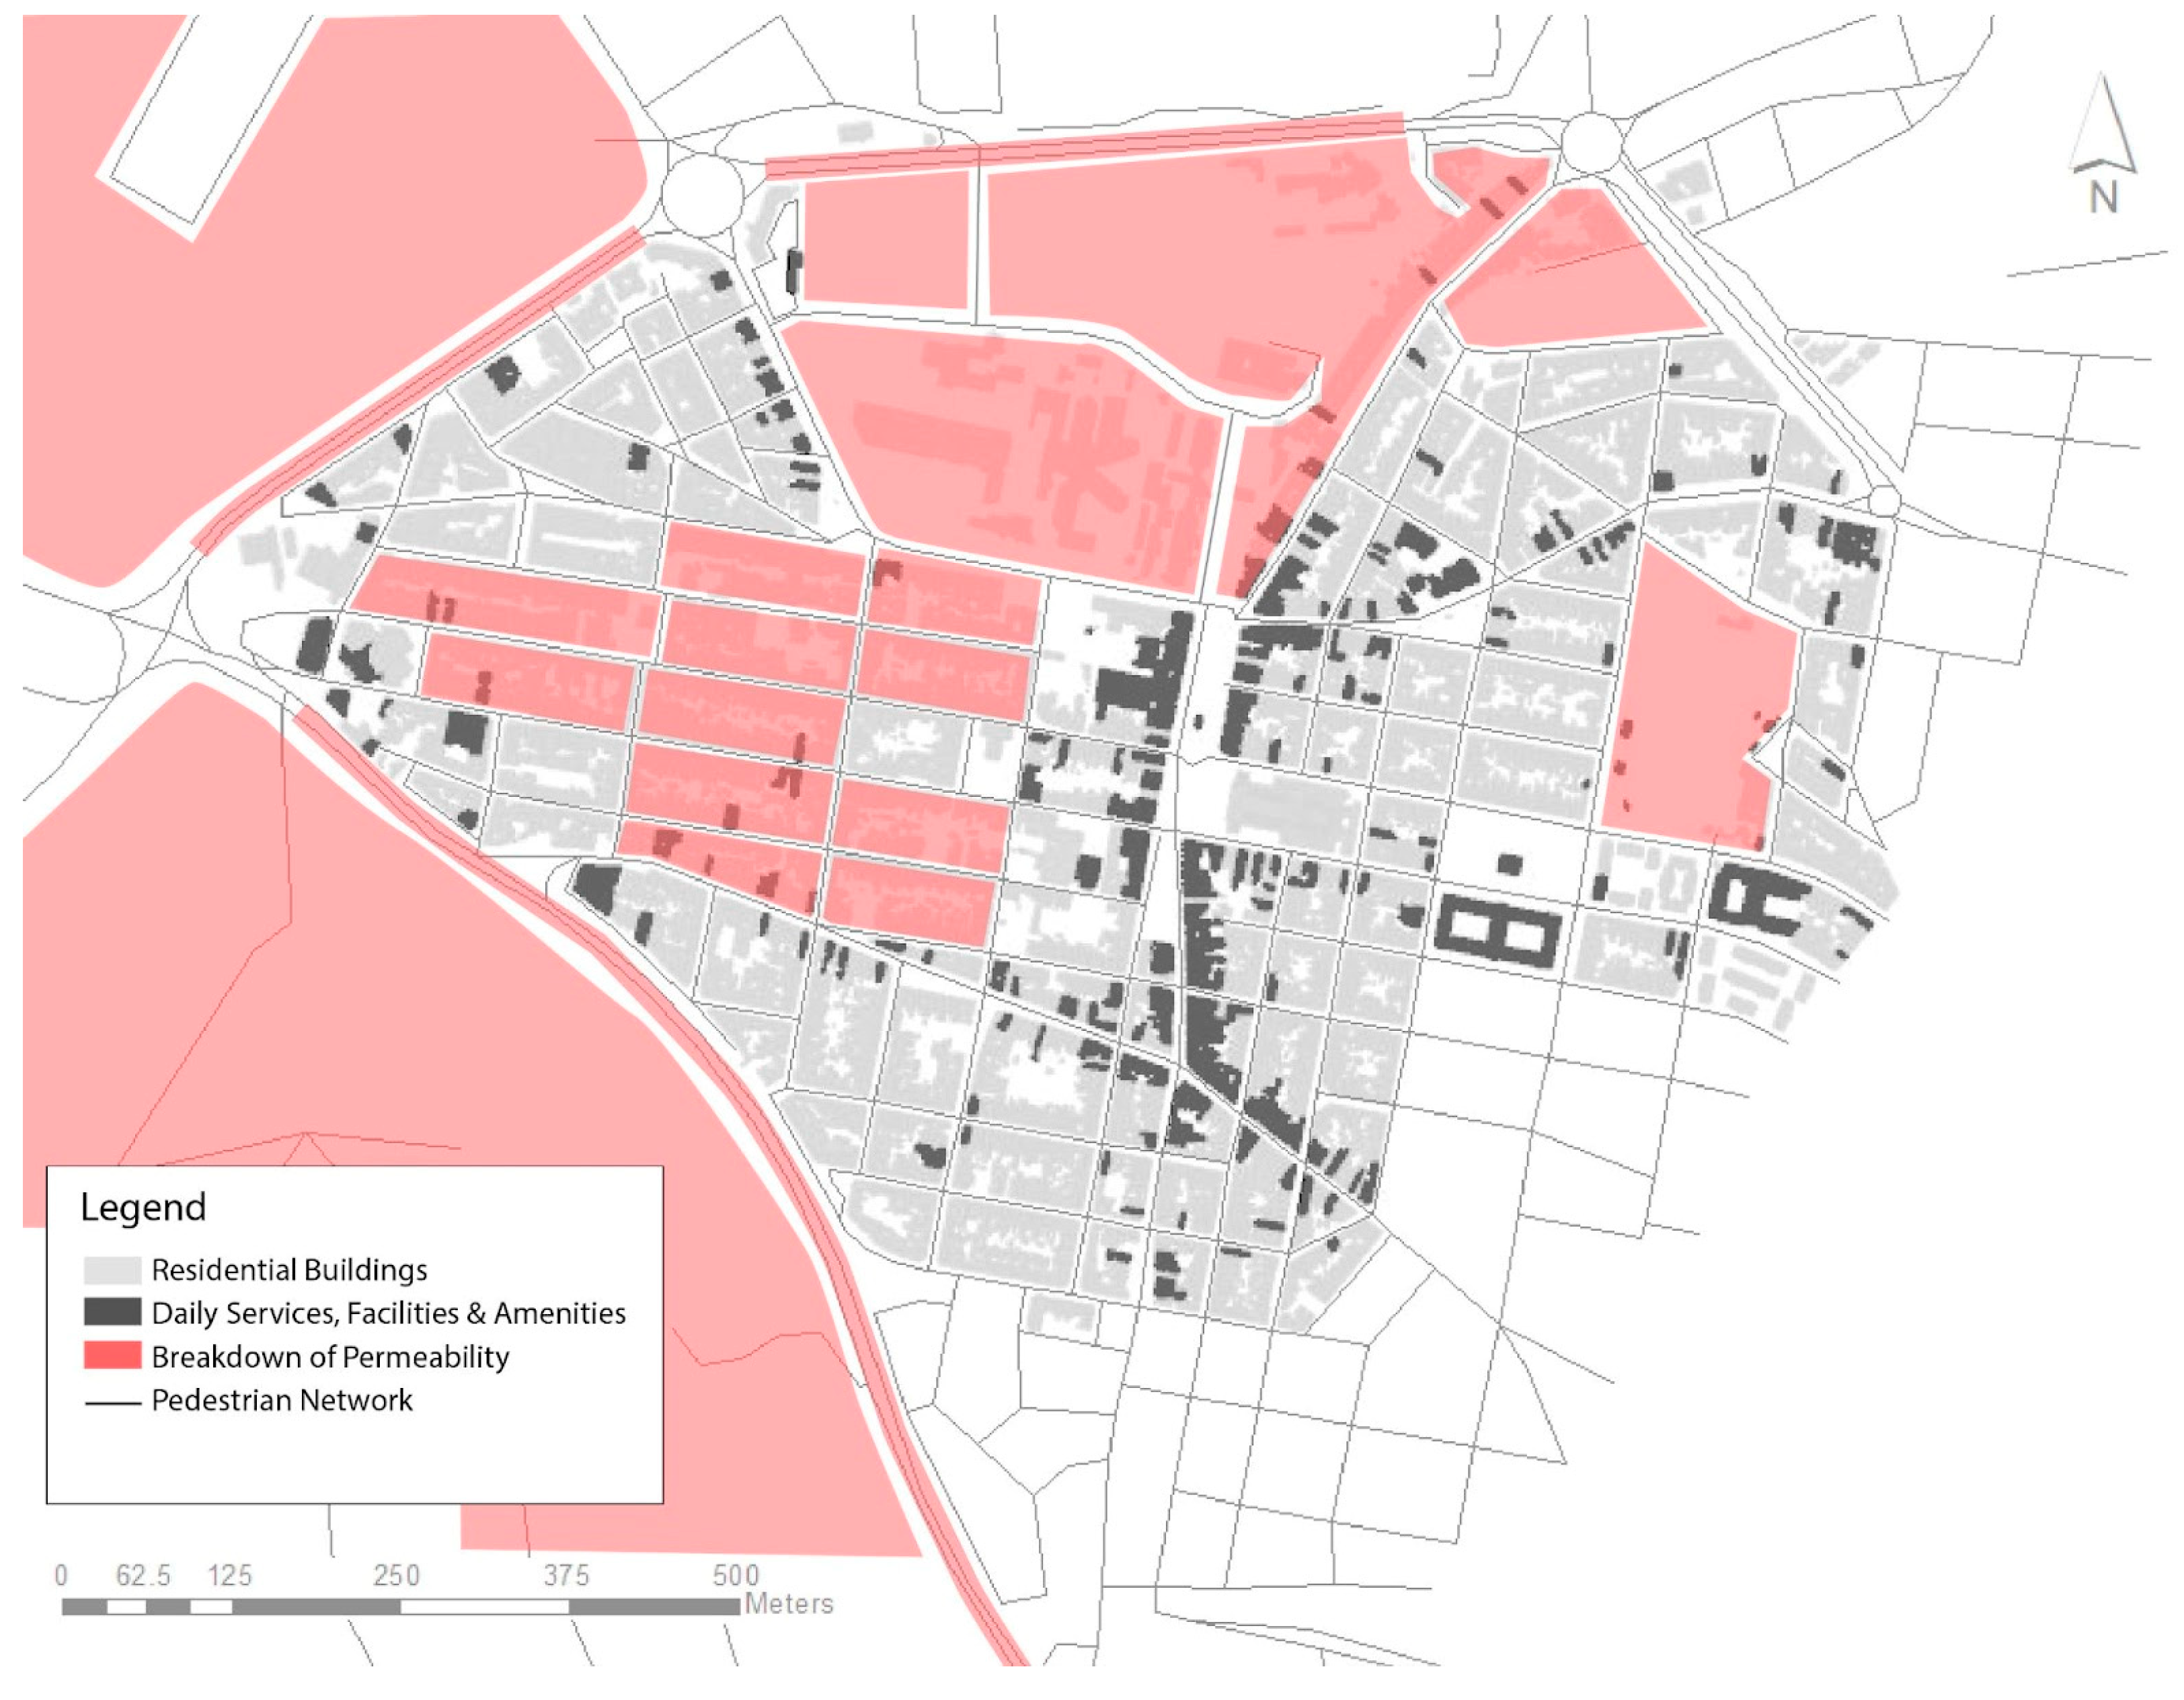
3.8. Connectivity, Permeability and Land Uses
Figure 11 shows the breakdown in permeability in relation to daily services and amenities. That is all the land use categories mapped except for residential. It can be observed that most of these are located in the town centre, which is permeable from a morphological sense for pedestrians. There are a few services which are more peripherally located and the breakdown of permeability identified may thus create accessibility problems for residents from opposing parts of the locality.
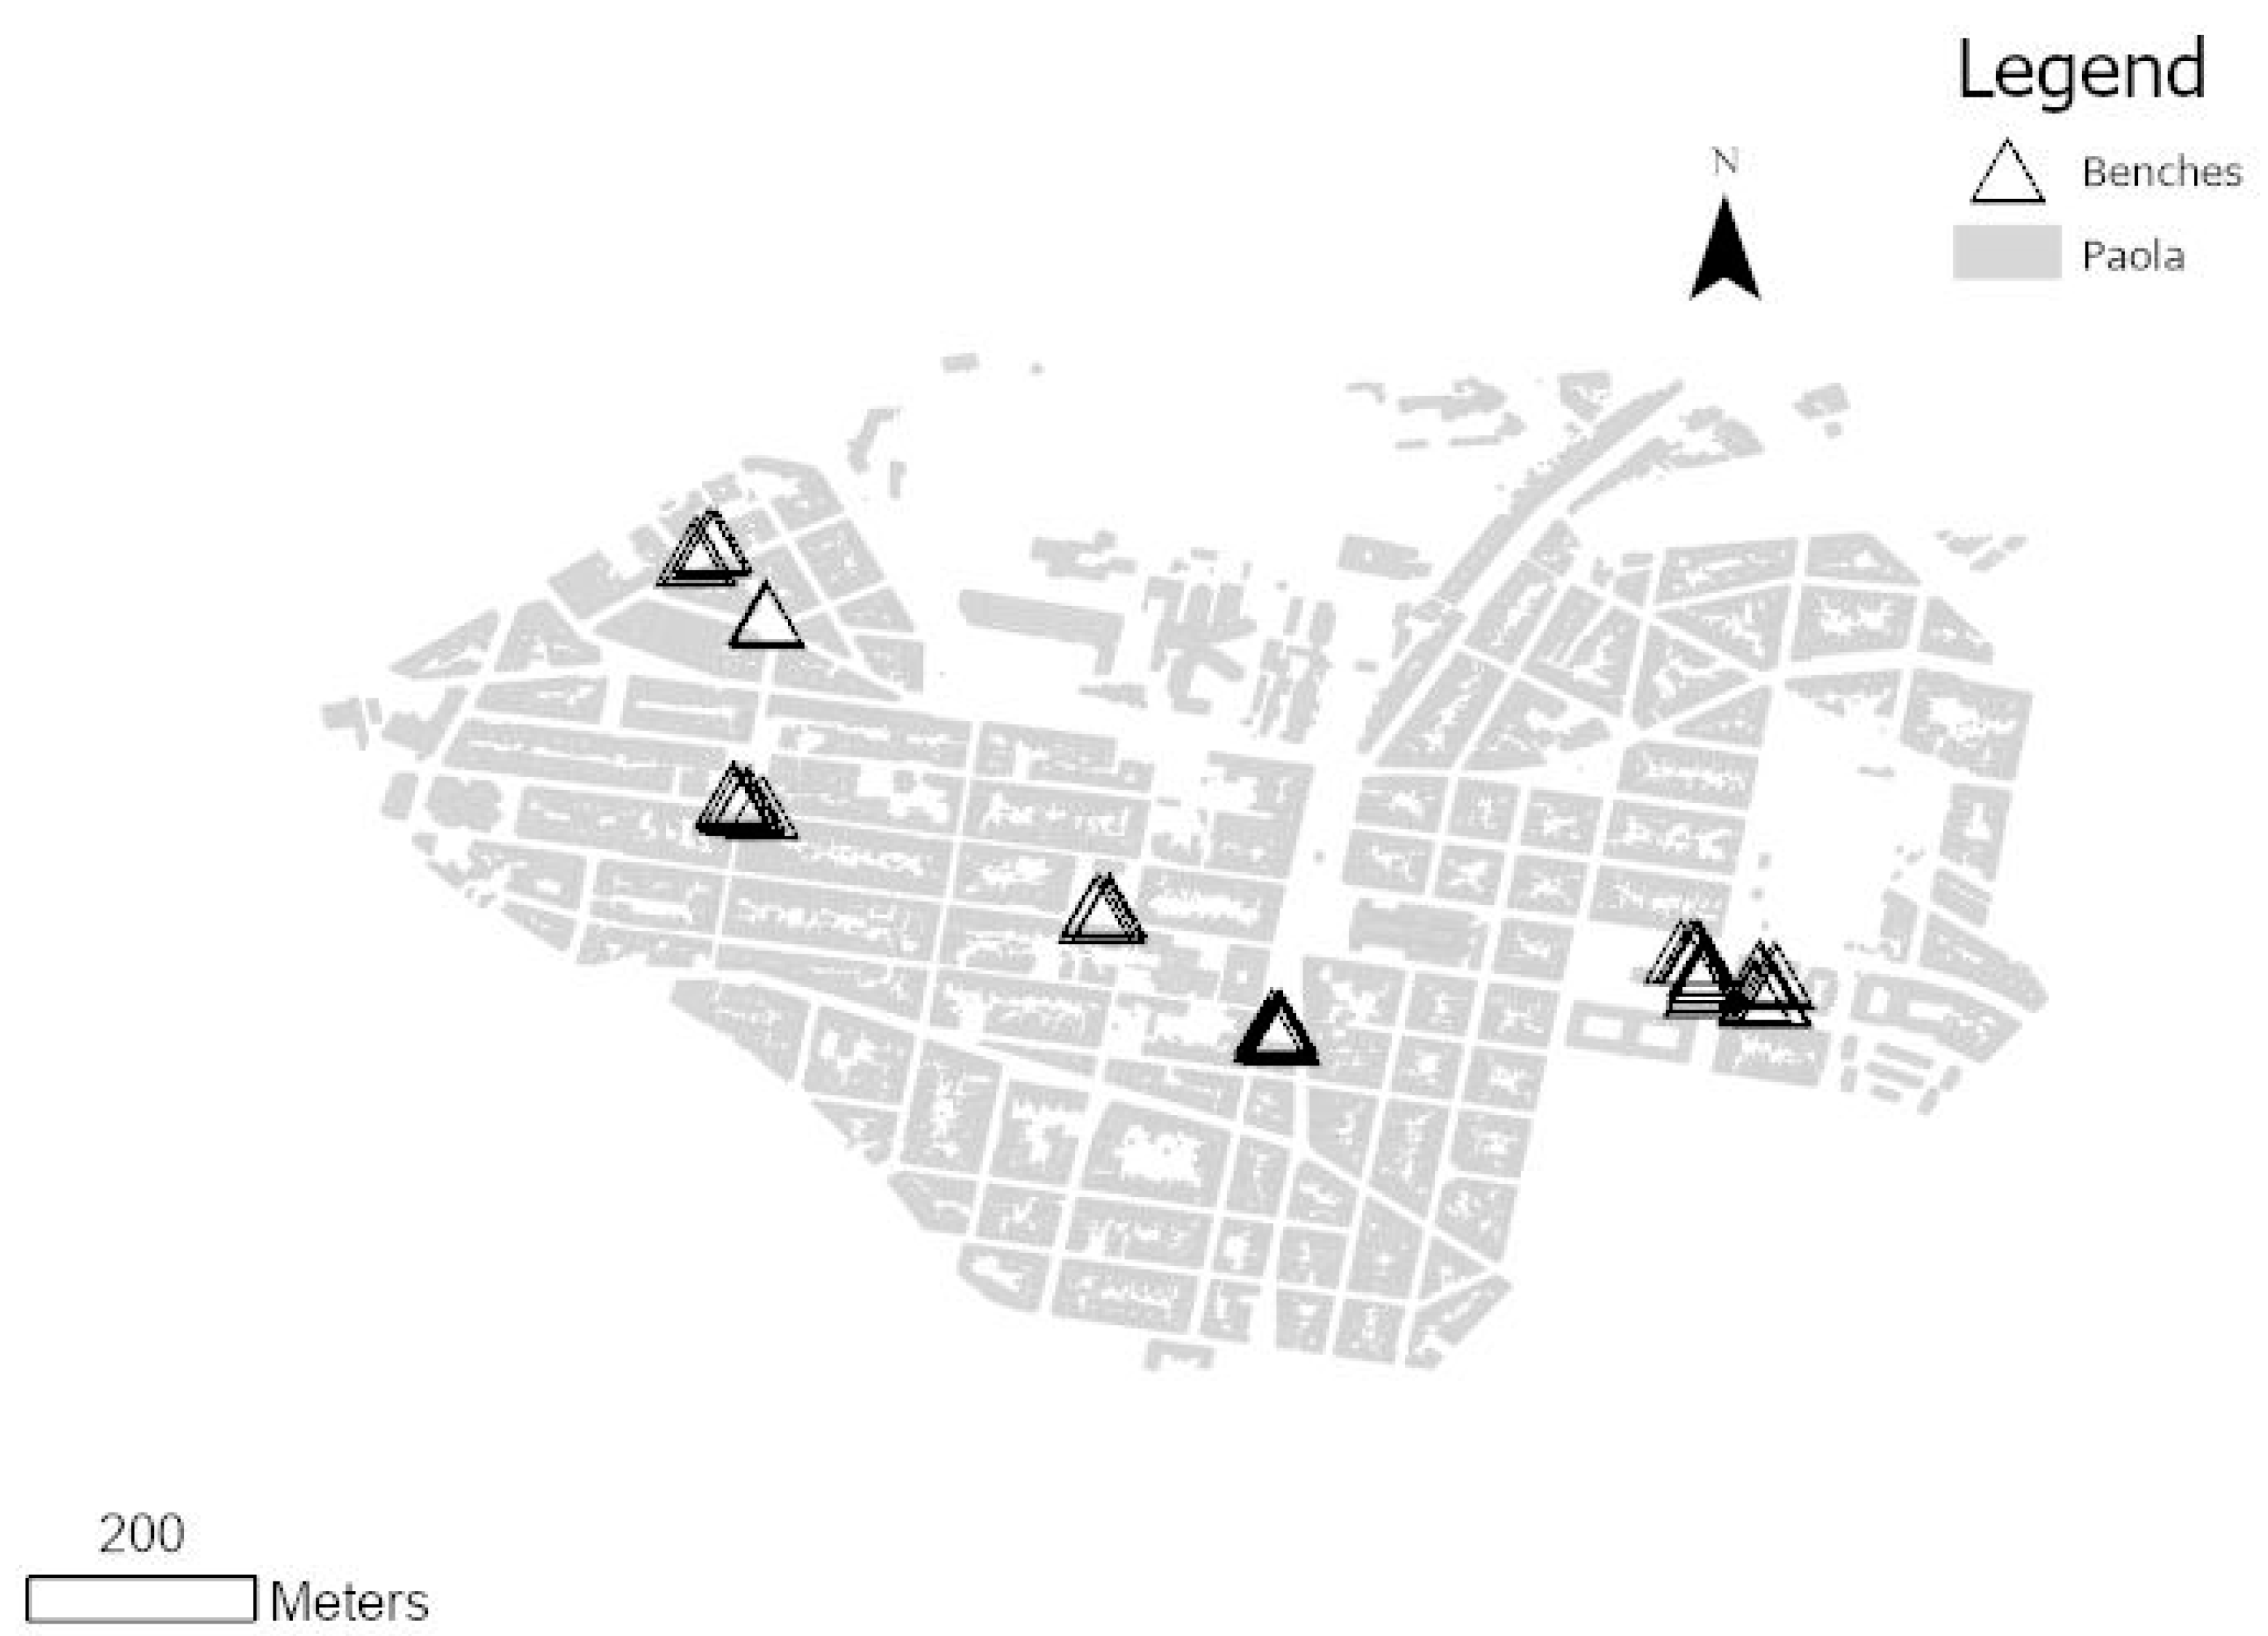
3.9. Presence of Benches
Figure 12 shows the location of benches in Paola. They are located in zones where there is either a square or an open space. The map shows that there is a dearth of benches in this locality.
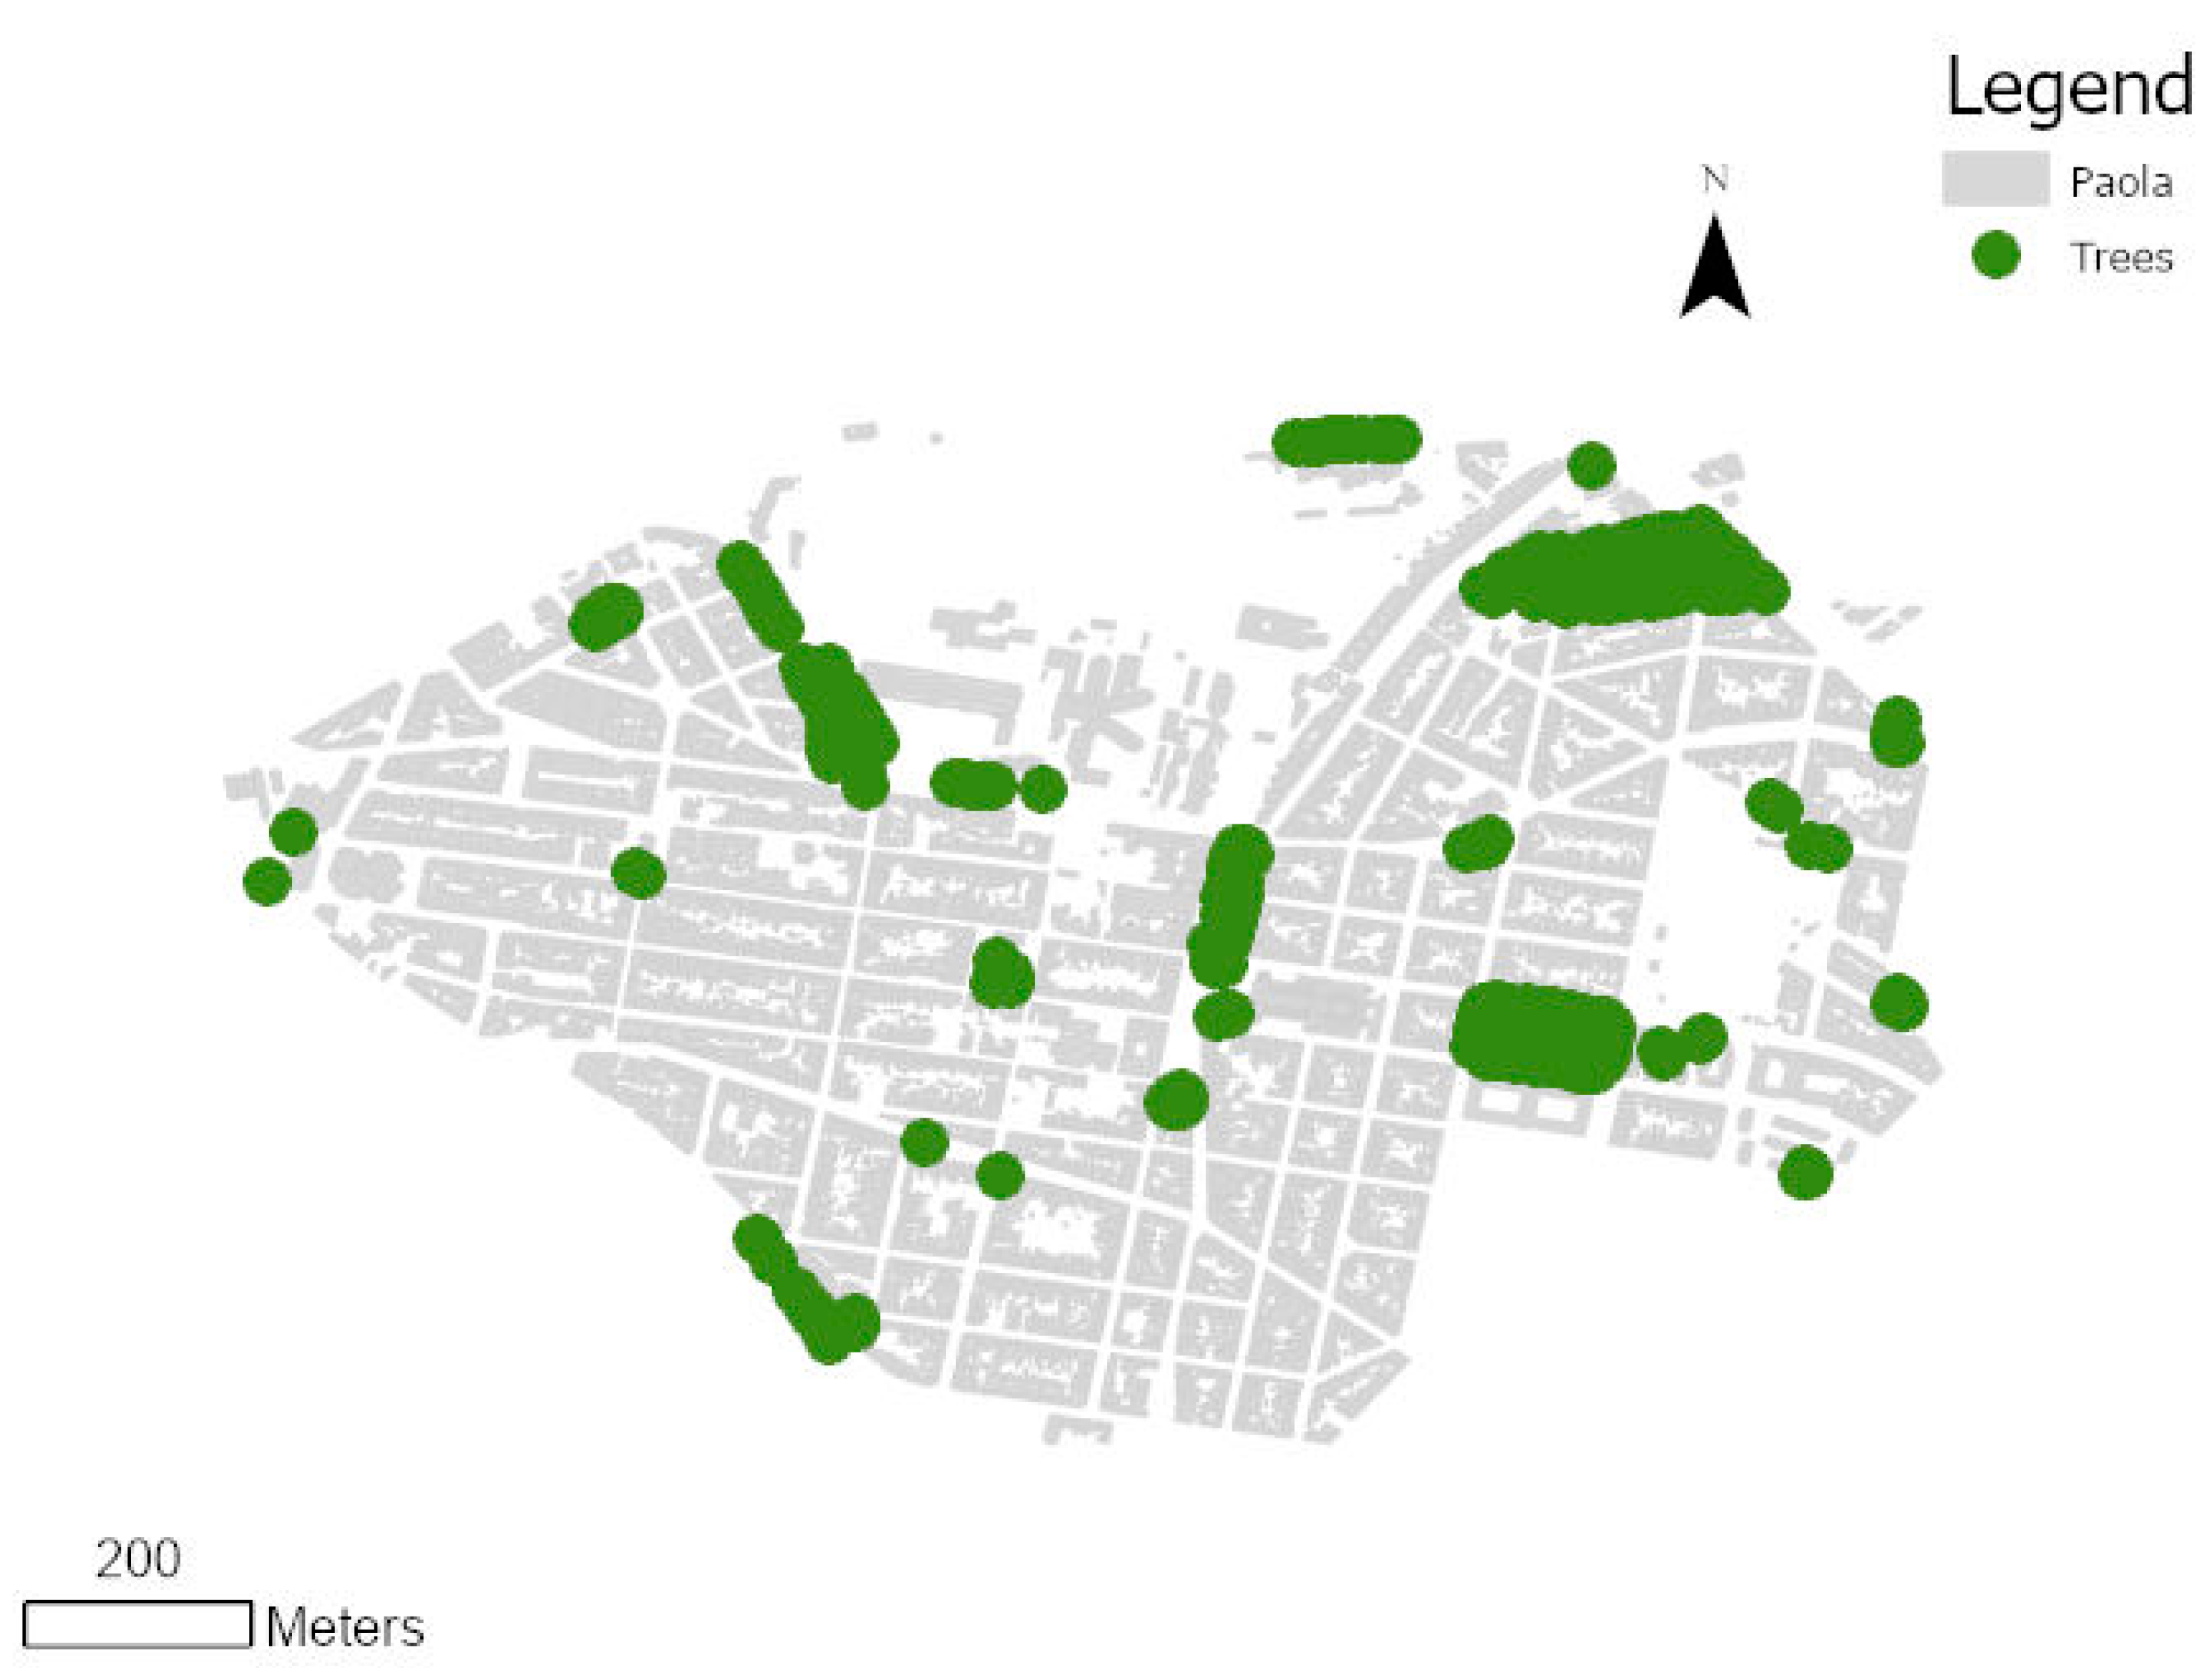
3.10. Presence of Trees and Shading
Trees in Paola are mainly located in main squares or open spaces (
Figure 13). Towards the southern and northern part of Paola, a cluster of trees can be seen in specific streets. Comparing
Figure 12 with
Figure 13, it can be seen that the link between trees and benches is limited. Squares and open spaces have benches and trees; however, some streets have trees, but no benches.
4. Discussion
The mapped data sets and spatial analysis provide an initial picture of the dynamics in Paola in relation to key Timed City concepts. In relation to proximity [
2], it is clear that basic services and amenities are, for the most part, available within a walking catchment for the Paola residents. Healthcare and educational facilities are slightly more off-centre geographically, illustrating that other active mobility modes need to be considered to ensure suitable proximity to all residents of these services. In a similar way, residential areas to the west of the locality have limited access to open spaces. There is therefore scope to create more opportunities for recreational open spaces that support social activity and integration. The mix of land uses also indicates a diverse [
2] town centre where residential, commercial and leisure aspects come together. The mix of land uses also relates well to density [
2], in that higher density areas are located in close proximity to services and amenities.
While the Timed City qualities of proximity, density and diversity, which, as outlined by Moreno et al. [
2], are important qualities of a Timed City, seem to perform relatively well, the walkability of the locality requires more attention. The urban grain of the locality facilitates pedestrian activity from a morphological and permeability perspective. For the most part, the blocks are small, an important characteristic for vital and social neighbourhoods as advocated by Jacobs [
8]. This is also essential for creating a permeable environment that facilitates pedestrian movement [
29]. This permeability, however, breaks down at the edges of the locality due to larger developments such as the Correctional Facility. Highly trafficked vehicular routes due to regional transport connections also create a barrier at the edges of the town. While this does not hinder the walkability of the Town Centre as such, it would need to be considered in relation to access to services located out of the locality, such as Mater Dei Hospital, in terms of healthcare, or higher educational institutions such as the University of Malta.
Walkability also needs to consider the amenity and quality of the connections. The results of the spatial analysis clearly show that this is hindered due to poor pavement widths, high vehicular speeds and steeper topography particularly where daily services and amenities are located in the town centre. Additionally, the mapping of trees illustrates that for the most part, streets are poorly shaded, resulting in potentially uncomfortable climatic conditions for active travellers such as pedestrians and cyclists. Benches and providing places to sit also play an important role in ensuring walkability as they create resting places. Creating opportunities for people to linger is also crucial to stimulating social interaction, an important quality of liveable cities [
30,
31,
32]. There is therefore scope for additional benches and seating opportunities to be provided so as to ensure resting places and more opportunities for lingering, thus inducing social contact and interaction.
As a result, the following three key aspects need addressing. Improving traffic management is essential in promoting a modal shift towards active mobility in Paola town centre. Traffic management interventions are required to reduce the presence of a through-traffic route conflicting with the predominant location of services and facilities. Such interventions could be in the form of rethinking traffic flows and vehicular access to the town centre. Traffic calming measures could also be used to target speed reduction. Additionally, space allocation in street sections needs to be rethought with the aim of increasing pavement widths and creating spaces for amenities such as trees and benches.
Mobility planning also requires improvement so as to achieve a better balance of uses and increased public spaces. Approaches such as the ‘Superblock’ concept introduced in Barcelona could be a means for reducing unnecessary vehicular traffic and winning back space for people and social activity. Such strategies could also serve to increase the provision of recreation open spaces within those residential areas outside of the recreation open space catchment, thus recognizing the social value of streets as public spaces.
In conjunction, the need for street design guidelines and standards that support human centric planning and design are essential since these are still lacking in Malta’s transport policy and legislation. These can be informed by case studies of cities where Timed City interventions have been implemented, and contextualized to the Maltese socio-spatial environment.
This research has provided insights into areas which require specific attention when considering the applicability of the Timed City concept. The introduction of specific policies is seen as an important tool in moving towards such planning approaches. In relation to this, the authors suggest the following policies:
Gather and improve data availability for traffic flows at a locality level to support locality-based mobility planning;
Reduce the maximum speed limits in residential areas and town centres to below 50 km/h;
Reconfigure traffic flows so as to eliminate through-traffic in town centres;
Introduce funding streams specifically dedicated to the upgrading of pedestrian infrastructure including pavement widths, seating and shade provision;
Legislate the adoption of shared street and homezone design approaches in the Maltese context and re-classify appropriate streets accordingly;
Reverse the prioritisation of on-street parking allocation in relation to pedestrian and green infrastructure specifically in streets with limited widths.
5. Conclusions
This study has demonstrated that Paola, a typical locality within the Maltese urban conurbation, represents an undiscovered potential in relation to the Timed City concept as a planning approach. The presence of daily services and amenities, and the morphology of the urban fabric support the application of the Timed City concept. Other qualities, however, such as pavement widths and vehicular speeds, require attention, as do the presence of trees and benches, which provide important amenities in relation to walkable environments.
While the data presented in this paper have substantiated the potential for the application of the Timed City concept to a typical urban locality in Malta, there is additional research that is required. Qualitative research is currently being conducted to understand the attitudes and perceptions of people on the street in Paola. The aim of this additional study is to shed light on the Timed City concept in Malta.
Some data sets, specifically local traffic flows, air quality and built typological diversity, still need to be compiled due to incomplete readily available data sets. Also, due to Malta’s small scale, while a number of daily services can be and are provided at a local level with the potential to be accessed using active mobility modes, there still exist a number of services that are only provided at a national level. This would also be the case when considering commuting for work purposes. The need to travel beyond a 15 min walking and cycling catchment, therefore, exists. In relation to this, a further analysis of access to public transport routes as well as cycling as an active mobility mode beyond one’s locality of residence is important. To further understand the predominance of such travel behaviour, a household travel survey specific to a locality would be pertinent as a form of quantitative data. Additionally, the provision of digitalisation aspects relating to the Timed City concept requires specific focus and data gathering.
Apart from the data sets described above, the authors also acknowledge the importance of qualitative data for such studies. The need to understand socio-cultural trends and the user perspective in relation to fully understanding the potential for living locally and adapting lifestyles to the Timed City concept is deemed essential. In this sense, such research using participatory GIS specific to the Paola case study is ongoing. Additionally, while the mapping of open spaces has revealed the availability and accessibility to such facilities, the quality of such spaces and whether they indeed satisfy Paola’s demographic needs is still to be explored. While research on the quality of open spaces exists at the national level, studies specific to localities and the Timed City model would add further richness to the data sets. It is also worth noting that the buffer analysis for services and open spaces was carried out according to the Euclidean distance. Therefore, an in depth understanding of the micro-geography would also be useful to identify walkability, accessibility and a feeling of safety.
In conclusion, it is important to reiterate that Malta´s spatial composition is made up of a number of localities each with their own town centres. It can also be said that Malta functions as a city with one main urban conurbation, the PUA. Within this urban conurbation, there is the need to consider the scale, specifically for the Maltese context, at which the Timed City concept could potentially be applied. Three different models can be envisaged: (1) a monocentric urban conurbation with one main centre; (2) a polycentric urban conurbation with a centre for each locality (neighbourhood centres); or (3) a polycentric urban conurbation with two or three main centres (district centres). In either of these models, the centres should provide the daily services and amenities required within a 15–30 min active travel time window per the Timed City concept. Potentially, a model could even be imagined specific to the case of Malta where both systems work in parallel, at the level of the main urban conurbation and at the locality (or neighbourhood) level. The ultimate aim, however, is to devise a model that adopts a more integrated approach in planning for access to daily amenities and services in terms of land use and active mobility in terms of transportation. This will support and allow for a reduction in car use, such that urban centres may be reclaimed for social activity and move towards more sustainable, resilient and ultimately more liveable urban areas.


