Article

Potential Risk Identification of Agricultural Nonpoint Source Pollution: A Case Study of Yichang City, Hubei Province

1
Institute of Plant Nutrition, Resources and Environment, Beijing Academy of Agriculture and Forestry Sciences, Beijing 100097, China
2
Satellite Application Center for Ecology and Environment, Ministry of Ecology and Environment, Beijing 100094, China
*
Author to whom correspondence should be addressed.
Sustainability 2023, 15(23), 16324; https://doi.org/10.3390/su152316324
Submission received: 28 October 2023 / Revised: 19 November 2023 / Accepted: 23 November 2023 / Published: 27 November 2023

Abstract

:
Potential risk identification of agricultural nonpoint source pollution (ANPSP) is essential for pollution control and sustainable agriculture. Herein, we propose a novel method for potential risk identification of ANPSP via a comprehensive analysis of risk sources and sink factors. A potential risk assessment index system (PRAIS) was established. The proposed method was used to systematically evaluate the potential risk level of ANPSP of Yichang City, Hubei Province. The potential risk of ANPSP in Yichang City was 18.86%. High-risk areas account for 4.95% and have characteristics such as high nitrogen and phosphorus application rates, large soil erosion factors, and low vegetation coverage. Compared with the identification results of the Diffuse Pollution estimation with the Remote Sensing (DPeRS) model, the area difference of the same risk level calculated by the PRAIS was reduced by 33.9% on average. This indicates that PRAIS has the same level of accuracy as the DPeRS model in identifying potential risks of ANPSP. Thus, a rapid and efficient identification system of potential risks of regional ANPSP was achieved.

1. Introduction

With the continuous transformation of socioeconomic structures and the nationwide initiatives to prevent and control pollution, industrial and urban sewage centralized discharge pollution has been controlled in China [1]. However, nonpoint source pollution (NPSP) caused by agriculture, forestry, animal husbandry, fishery production areas, and rural living areas has gradually become the primary source of water pollution, especially nitrogen and phosphorus loss, which has become a prominent contributor to the deterioration of water quality [2,3,4]. Among them, agricultural NPSP (ANPSP) is more scattered and hidden and has uncertain factors, such as occurrence time and source and pollutant concentration [5]. Therefore, the monitoring and evaluation of ANPSP is very complex. Based on the experience of developed countries in controlling ANPSP, solid environmental monitoring, and scientific assessments form the basis for formulating reasonable prevention and control policies for the accurate prevention and control of pollution. Therefore, it is essential to establish a method for identifying high-risk areas for ANPSP.
ANPSP is an important cause of eutrophication in the Three Gorges Reservoir Area (TGRA), China. Yichang City, located in Hubei Province, is famous as the gateway to the TGRA. Recently, Yichang City’s agriculture has developed rapidly, and ANPSP has accounted for a significant proportion of the total environmental pollution. About 90% of the total value of farm output in Yichang City comes from cash crops and is continuously growing. However, the fertilization amount per unit area of cash crops is much higher than that of grain crops, and agricultural nonpoint source pollution cannot be ignored [6,7]. In 2018, Yichang City began to promote comprehensive control of ANPSP to strike a balance between the ecological environment and agricultural development. Many scholars have carried out extensive research on NPSP in the TGRA by focusing on changes in NPSP, classification of pollution sources, and rural domestic sewage [8,9,10,11,12]. Most of these studies have concentrated on the Chongqing section of the TGRA, and the characteristics of the regional NPSP in Hubei are still not well understood. As Hubei Province and Chongqing City have different topographical and agricultural structures, it is still necessary to conduct systematic research on the NPSP in Hubei Province. In Yichang City, many studies related to ANPSP have also been conducted, including the estimation and analysis of different types of loads, the identification of key source areas, the analysis of strategies, the identification of risk patterns, the evaluation of total nitrogen loss, and remote sensing analysis of the spatial characteristics of nitrogen and phosphorus [13,14,15,16,17]. However, few studies have been conducted on potential risk classification assessment criteria for NPSP assessment.
At present, the methods used to identify ANPSP risk include the export coefficient, quantitative model, and index system methods [18]. The export coefficient method is simple in structure and requires fewer data; therefore, it can directly evaluate and predict the pollution loads of total nitrogen and total phosphorus from ANPSP sources [19,20,21]. However, considerable field monitoring data are required for its application on a regional scale [22]. Quantitative models of NPSP include spatially referenced regressions on watershed attributes (SPARROW) model [23,24,25,26], annualized agricultural NPSP (AnnAGNPSP) model [27,28,29,30], soil and water assessment tool (SWAT) model [31,32,33,34] and hydrological simulation program Fortran model [35,36,37]. These models need numerous parameters for analysis. Presently, data accumulation in agricultural management is not adequate, the underlying surface is complex, and regional differences are high, which increases the difficulty in obtaining vital information on the ground. In addition, most mature models have been developed based on the agricultural situation in foreign countries; therefore, it is difficult to transplant them directly to simulate ANPSP in China. The index system method can synthetically analyze the main factors affecting ANPSP and provide a more reasonable assessment framework for ANPSP risk with strong flexibility [38]. The commonly used methods are the ANPSP potential index (APPI) method [39,40] and the phosphorus index method [41,42,43]. However, there are some problems with the conventional ANPSP risk index system, such as poor pollution source classification, incomplete index selection, and research units that are too coarse [44]. Therefore, there is an urgent need to comprehensively analyze ANPSP factors and establish a new risk assessment model.
Therefore, we proposed the potential risk assessment index system (PRAIS) that identifies the degree of potential risk of ANPSP and applied it to Yichang City. The PRAIS was established based on the perspectives of simplicity, rapidity, low cost, accuracy, and adaptability. The PRAIS determines the index weight, divides the factor grade, and calculates the ANPSP risk index. The main objectives of this study were to (i) propose a novel method for the risk identification of ANPSP, (ii) determine the index weight and divide the factor grade of the PRAIS, and (iii) investigate the potential risk of ANPSP of Yichang City, Hubei Province, and determine the region with a high risk of ANPSP. This study provides a foundation for potential risk evaluation and rapid screening of ANPSP.

2. Materials and Methods

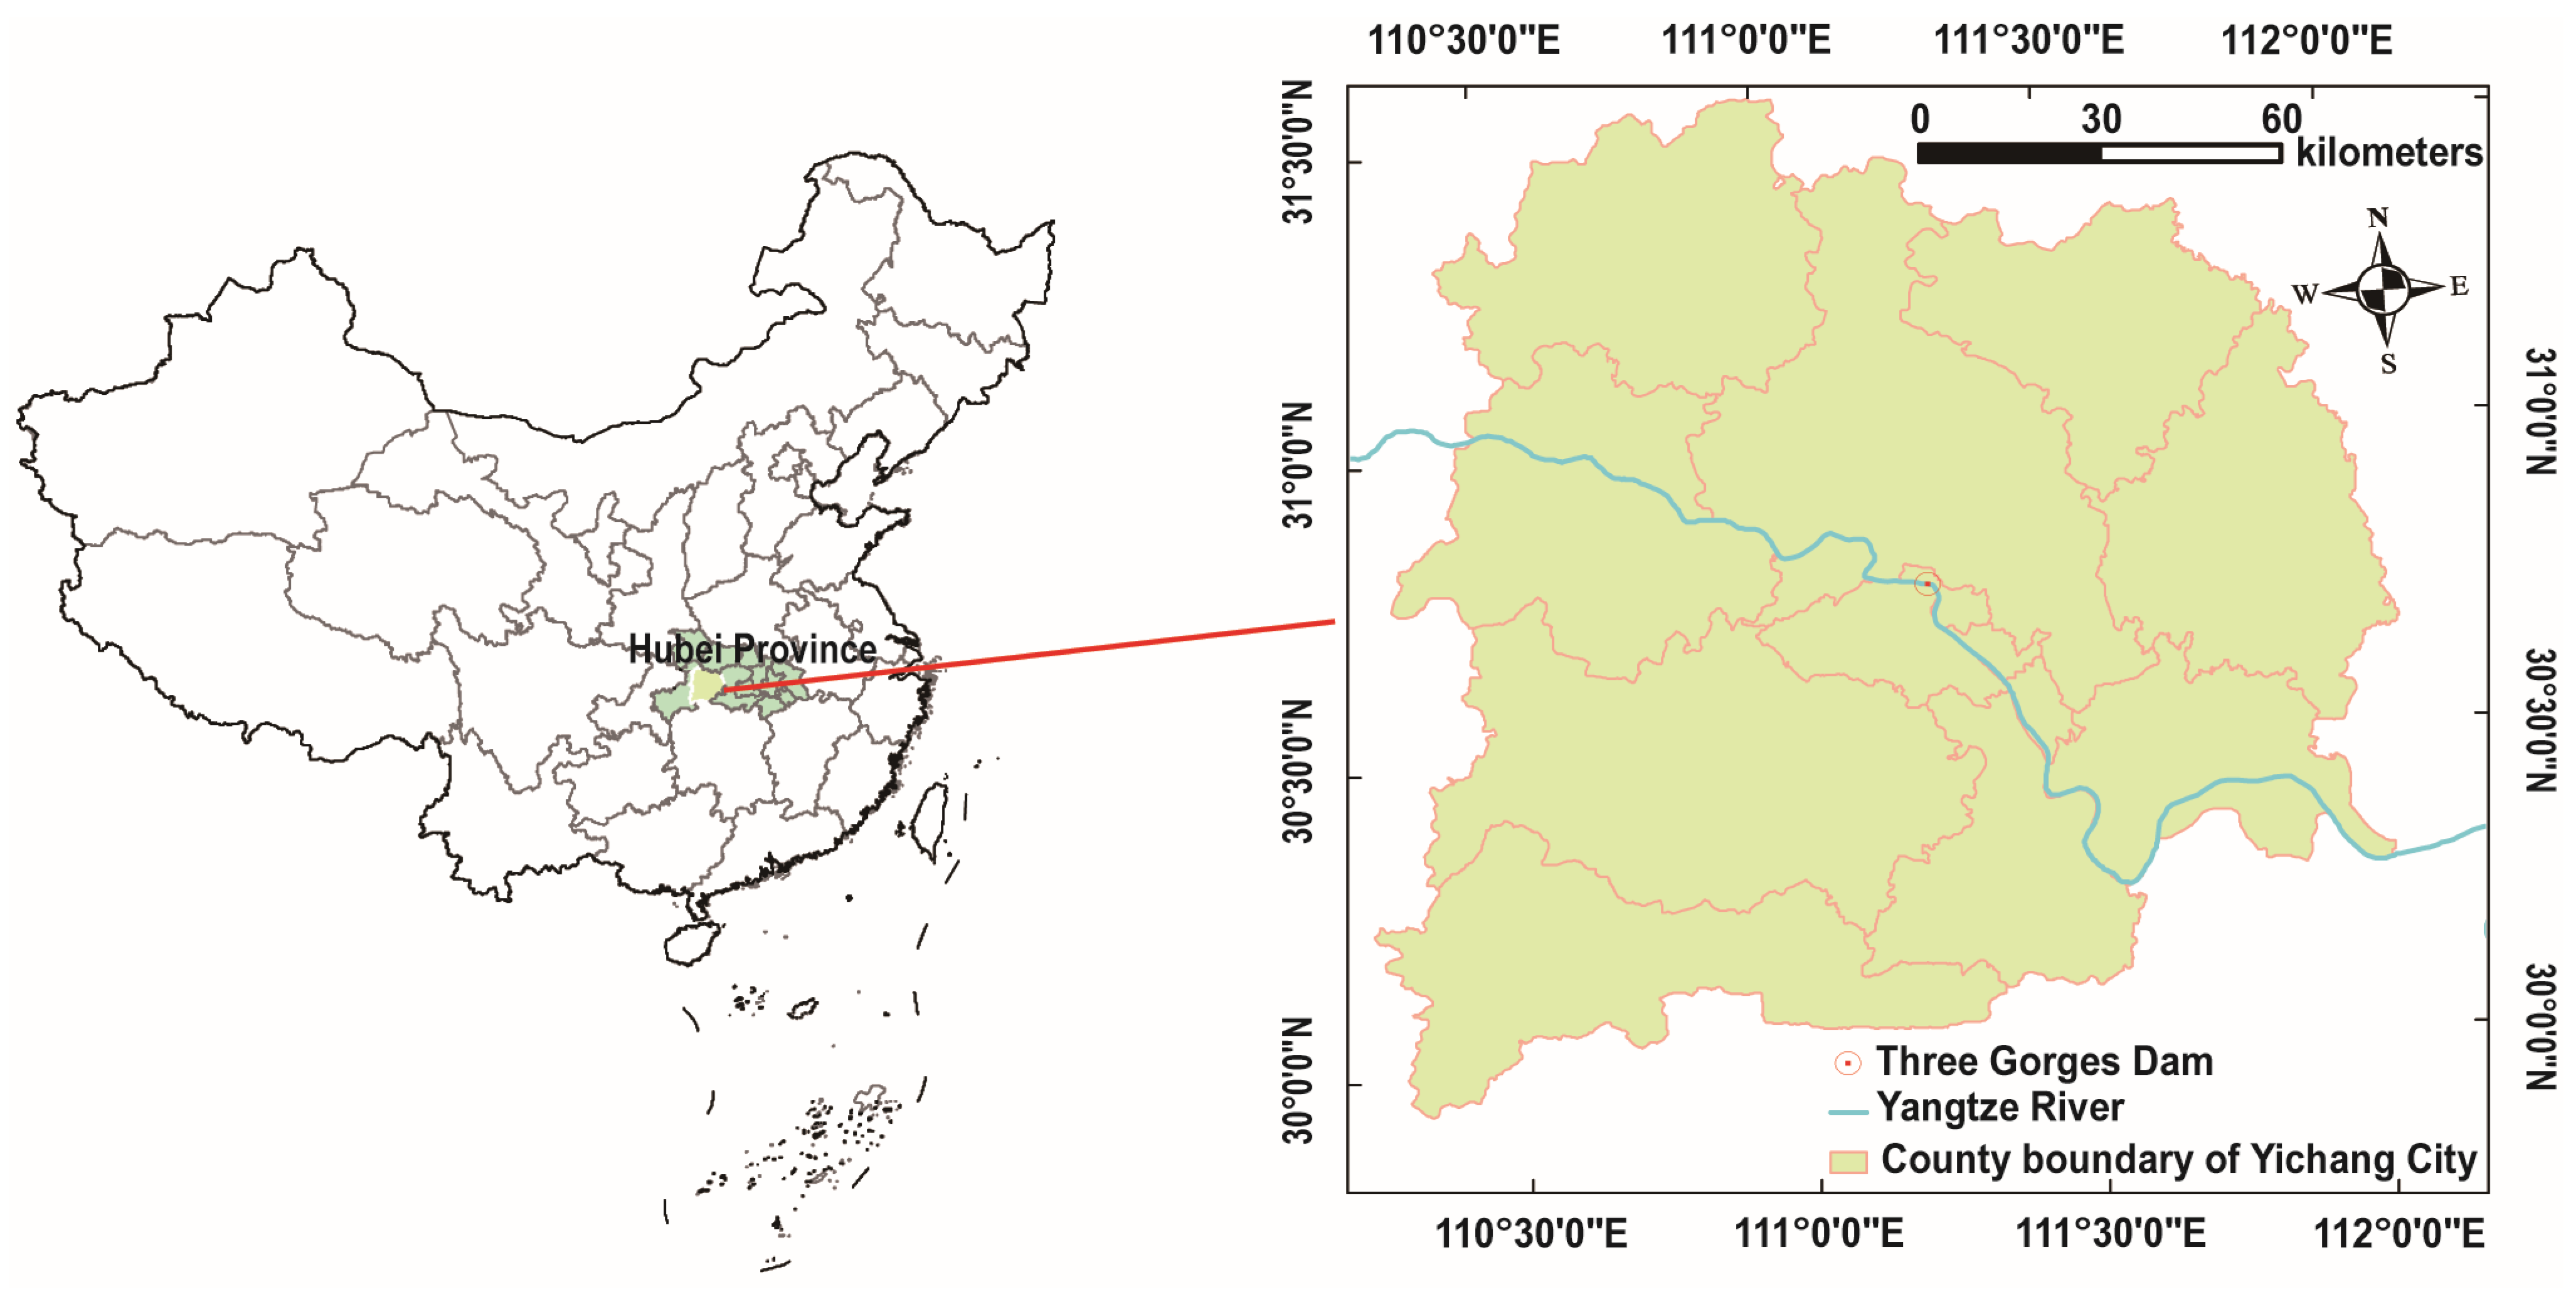
2.1. Overview of the Study Area

Yichang City is located in southwest Hubei Province, at the junction of the upper and middle reaches of the Yangtze River and the transition zone from the Wuling Mountains and Qinba Mountains in western Hubei to the Jianghan Plain (Figure 1). It spans 110°15′–112°04′ E and 29°56′–31°34′ N, with a total area of 21,000 km2. The western mountains, central hills, and eastern plains account for 69, 21, and 10% of the city’s total area, respectively. Yichang City is the second largest city in Hubei, an important member of the Yangtze River Economic Belt, an ecological barrier in the TGRA, an ecologically sensitive area in the Yangtze River Basin, and an important part of the Yangtze River ecological protection line. In 2021, the cultivated land area of Yichang City was 2932 km2, accounting for 13.81% of the land area, second only to the forested land area, which is 14,077 km2. In recent years, the total agricultural output of Yichang City has continued to grow, accounting for approximately 90% of the total agricultural output originating from economic crops. The quantity of fertilization per unit area for cash crops was much higher than that for grain crops. Therefore, the resulting ANPSP cannot be ignored.

2.2. Methodology

2.2.1. Potential Risk Assessment Index System for ANPSP

The potential risk of the occurrence and development of ANPSP is affected by many factors, such as topography, rainfall and temperature, land cover, and soil erodibility [45]. These factors control logistics and energy flows in the ANPSP process. The selection of potential risk indicators for ANPSP significantly influences research results. All climatic factors have corresponding impacts on soil and water loss, among which precipitation is the most important. Generally, the greater the annual precipitation, the more serious the soil and water loss. Topography, soil, and vegetation mainly influence ANPSP through rainfall and surface runoff. The economic level determines people’s production and lifestyle and affects land use mode, agricultural production mode, and management level based on socioeconomic activities. The current situation and growth rate of the rural population directly affects the land use mode, degree of utilization, and total ANPSP.
In this study, natural factors (meteorology, topography, soil, vegetation, and hydrology) and human factors (chemical fertilizer and pesticide application, cultivation, irrigation, livestock and poultry breeding, rural domestic garbage, and sewage discharge) affecting ANPSP were comprehensively considered. In addition, the whole process of pollutant generation, migration, and reduction was also considered. Combining existing data, hydrometeorological, soil topography, vegetation, and economic indicators were selected (Table 1). Hydrometeorological indicators included annual precipitation (AP), dissolved nonpoint source pollutants entering the river coefficient (CR), and adsorbed nonpoint source pollutants entering the river coefficient (SDR). Soil topographic and vegetation indicators included annual vegetation coverage (AVC), slope, and soil erodibility factor (K). Economic indicators included the apparent balance of nitrogen (FANB) and the apparent balance of phosphorus in farmland (FAPB). The meanings and algorithms of the eight indicators in the three categories are as follows.
(1) Annual precipitation (AP): Precipitation intensity, persistence, quantity, and frequency are important factors that affect surface soil erosion and nonpoint source diffusion. Among these factors, precipitation and rainfall intensity have an important impact on NPSP, directly affecting the quantity of runoff and the degree of NPSP. Based on precipitation data from meteorological stations in the study area and a digital elevation model (DEM) as a covariate, the spatial interpolation of precipitation was obtained using the thin-plate spline moving average method;
(2) The coefficient of dissolved nonpoint source pollutants entering the river (CR) and the coefficient of adsorbed nonpoint source pollutants entering the river (SDR), which refer to the proportion of nonpoint source pollutants entering the river network, are often used to estimate the quantity of discharge of nonpoint source pollutants. According to the existing forms of dissolved and adsorbed pollutants, they can be classified into CR and SDR, where CR is determined by the runoff coefficient, and SDR is determined by the sediment transport coefficient. CR and SDR are non-dimensional. The specific formula is as follows:
C R = R u n o f f A P
where R u n o f f is annual runoff.
S D R = S e d S e l × 100 %
S e l = R × K × L × S × C × P
where S e d is the annual sediment content; S e l is the annual quantity of soil erosion; R is the factor of rainfall erosivity; K is the soil erodibility factor; L and S are the slope length and slope gradient factors, respectively; C is the biological measurement factor; P is the factor of engineering measures. L, S, C , and P are non-dimensional;
(3) Annual vegetation coverage (AVC): Vegetation coverage is closely related to tillage management and directly affects the soil erosion rate. A good correlation was observed between the vegetation index and vegetation coverage; therefore, the vegetation index is suitable for calculating vegetation coverage. With the help of remote sensing data, the maximum–minimum quantitative inversion algorithm can be used to retrieve vegetation coverage [46];
(4) Slope: Slope has a significant influence on erosion intensity. The greater the slope of the terrain, the greater the possibility of erosion. Based on DEM elevation data, the slope was calculated using the ArcGIS Desktop software 10.8.1.
(5) Soil erodibility factor (K): This is a measure of soil potential erodibility that is affected by soil physical properties such as soil mechanical composition, organic matter content, soil structure, and soil permeability. The higher the K value, the more likely it is that the soil is eroded. K was calculated and corrected using the erosion-productivity impact calculator (EPIC) model [47]. The specific formula is as follows:
K = 0.1317 × K C h i n a
K C h i n a = 0.01383 + 0.51575 K E P I C
K E P I C = 0.2 + 0.3 e x p 0.0256 S a 1 S i 100 × S i C i + S i 0.3 × 1 0.25 C C + e x p 3.72 2.95 C × 1 0.7 S n S n + e x p 5.51 + 22.9 S n
where K E P I C is the soil erodibility factor calculated using the EPIC model; K C h i n a is the soil erodibility factor in China; 0.1317 is the unit conversion factor of the American and international systems; S a is the sand content; S i is the powder content; C i is the clay content; C is the content of soil organic carbon. S n = 1 − S a /100;
(6) Apparent balance of nitrogen in farmland (FANB) and apparent balance of phosphorus in farmland (FAPB): Defined as the difference between the inputs and outputs of nitrogen and phosphorus. When the balance is negative, the output of soil nutrients is greater than the input and is in a deficit state. When the balance is positive, the input of soil nutrients is greater than the output, and it is in a surplus state. Surplus nitrogen and phosphorus increases the risk of farmland NPSP in farmlands. According to 51 statistical index data types, such as quantity of chemical fertilizer application, quantity of livestock and poultry breeding, crop yield, and agricultural population at the county level, the input–output method was adopted to calculate them [48], and the specific formula is as follows:
Q b a l = B a l a n c e a r e a × 1000
B a l a n c e = I n p u t O u t p u t
I n p u t = F t l z + M n r + I r g + S e e d + D p z t + B n f
O u t p u t = H v s t
where Q b a l is FANB or FAPB; a r e a is the sum of cultivated land area and garden land area; 1000 is the unit conversion coefficient; B a l a n c e is nutrient balance; I n p u t is nutrient input; O u t p u t is nutrient output; F t l z is the nutrient input of chemical fertilizer; M n r is the nutrient input of organic fertilizer; I r g is the input of irrigation nutrients; S e e d is seed nutrient input; D p z t is the nutrient input of dry and wet sedimentation; B n f is the input quantity of biological nitrogen fixation; H v s t is the nutrient output taken away by crops.

2.2.2. Weights of Potential Risk Assessment Indicators

Different indicators present different potential hazards of ANPSP; therefore, it is necessary to determine the weight of each indicator to obtain a more accurate pollution risk level [49]. Because ANPSP is affected by many factors and has the characteristics of randomness, universality, fuzziness, and lag, it is more suitable for adopting the analytic hierarchy process (AHP). In this study, the power method in AHP was adopted to determine the weight of each indicator. Based on the constructed hierarchical structure model and the interrelationships between indicators at each level, combined with expert opinions, Sati’s 1–9 scale method was used to compare factors at each level in pairs and establish a judgment matrix [50]. The relative weight values of each indicator were calculated, and consistency testing was conducted on the judgment matrix. The consistency values were <0.1, indicating that the indicator weights were reliable. Finally, a weighted combination of the results of each level’s single ranking was used to obtain the importance weights of each indicator for the overall goal (Table 1).

2.2.3. Calculation of Potential Risk Index and Risk Classification of ANPSP

According to the “Technical Regulations for Investigation of Land Use Status,” regional precipitation distribution law, and reference index of soil erosion intensity classification, the grid discrete values of each indicator were linearly normalized statistically. Eight potential pollution risk indexes were classified and assigned scores of 1–4 using the natural discontinuity classification method (Jenks), considering the mean and variance of data (Table 2).
Based on the construction of a potential risk index system for ANPSP, combined with indicator weight and assignment, the algorithm for the potential risk index of ANPSP was established as follows:
N P S P P R I = W i × I i
where N P S P P R I is the potential risk index of ANPSP; W i is the weight value of the potential risk indicator in the index system, with a value range of 0–1; I i is the indicator assignment, with a value range of 1–4, and i is the indicator in the index system.
The NPSPPRI is classified into four risk levels by Jenks, and the detailed classification standards are as follows: no risk (0, 2.208), low risk (2.208, 2.704), medium risk (2.704, 3), and high risk (3, 4). The numerical ranges of each level were values of 1–4, and a potential risk spatial distribution map of the CIES was obtained.

2.3. Data Sources

All data in this study were collected in 2015, mainly remote sensing, meteorological, hydrological, elevation, soil, and agricultural statistical data for Yichang City, Hubei Province. All images were uniformly converted into Alber’s equal product projections for inclusion in the spatial operation. Table 3 summarizes the data sources.

2.4. Verification of Risk Identification Results

2.4.1. Model Verification

The DPeRS model was used to verify the results of risk identification using CIES. It is a semi-empirical and semi-mechanistic process model based on a binary structure coupled with remote-sensing technology. It considers natural factors, such as precipitation, vegetation cover, terrain, and topography, as well as socioeconomic factors, such as fertilization utilization efficiency, population, livestock, and poultry. The simulation of nonpoint source pollutants was conducted according to two types: dissolved and particulate pollutants. The spatial calculation unit was an image grid, and the model parameters considered the hydrological, land use, and soil characteristics of the watershed/region. This model can achieve quantitative data on the total nitrogen and total phosphorus loads of ANPSP in the study area. This model provides support for the validation of the integrated ANPSP risk assessment index system [51,52].

2.4.2. Verification Method

The risk maps of CIES and DPeRS models were generated based on ENVI’s unified assignment of grade range values and were comparable. First, differences in processing between the two risk maps were examined. The pixel brightness values of the remote sensing images (Digital Number, DN) and specific descriptions of the difference result maps are shown in Table 4 and Table 5, respectively. Second, the percentage deviation is calculated as the ratio of the number of deviated pixels to the total number of pixels in the risk map or by converting pixels into real areas as a ratio. A deviation map was also provided as the output.

3. Results

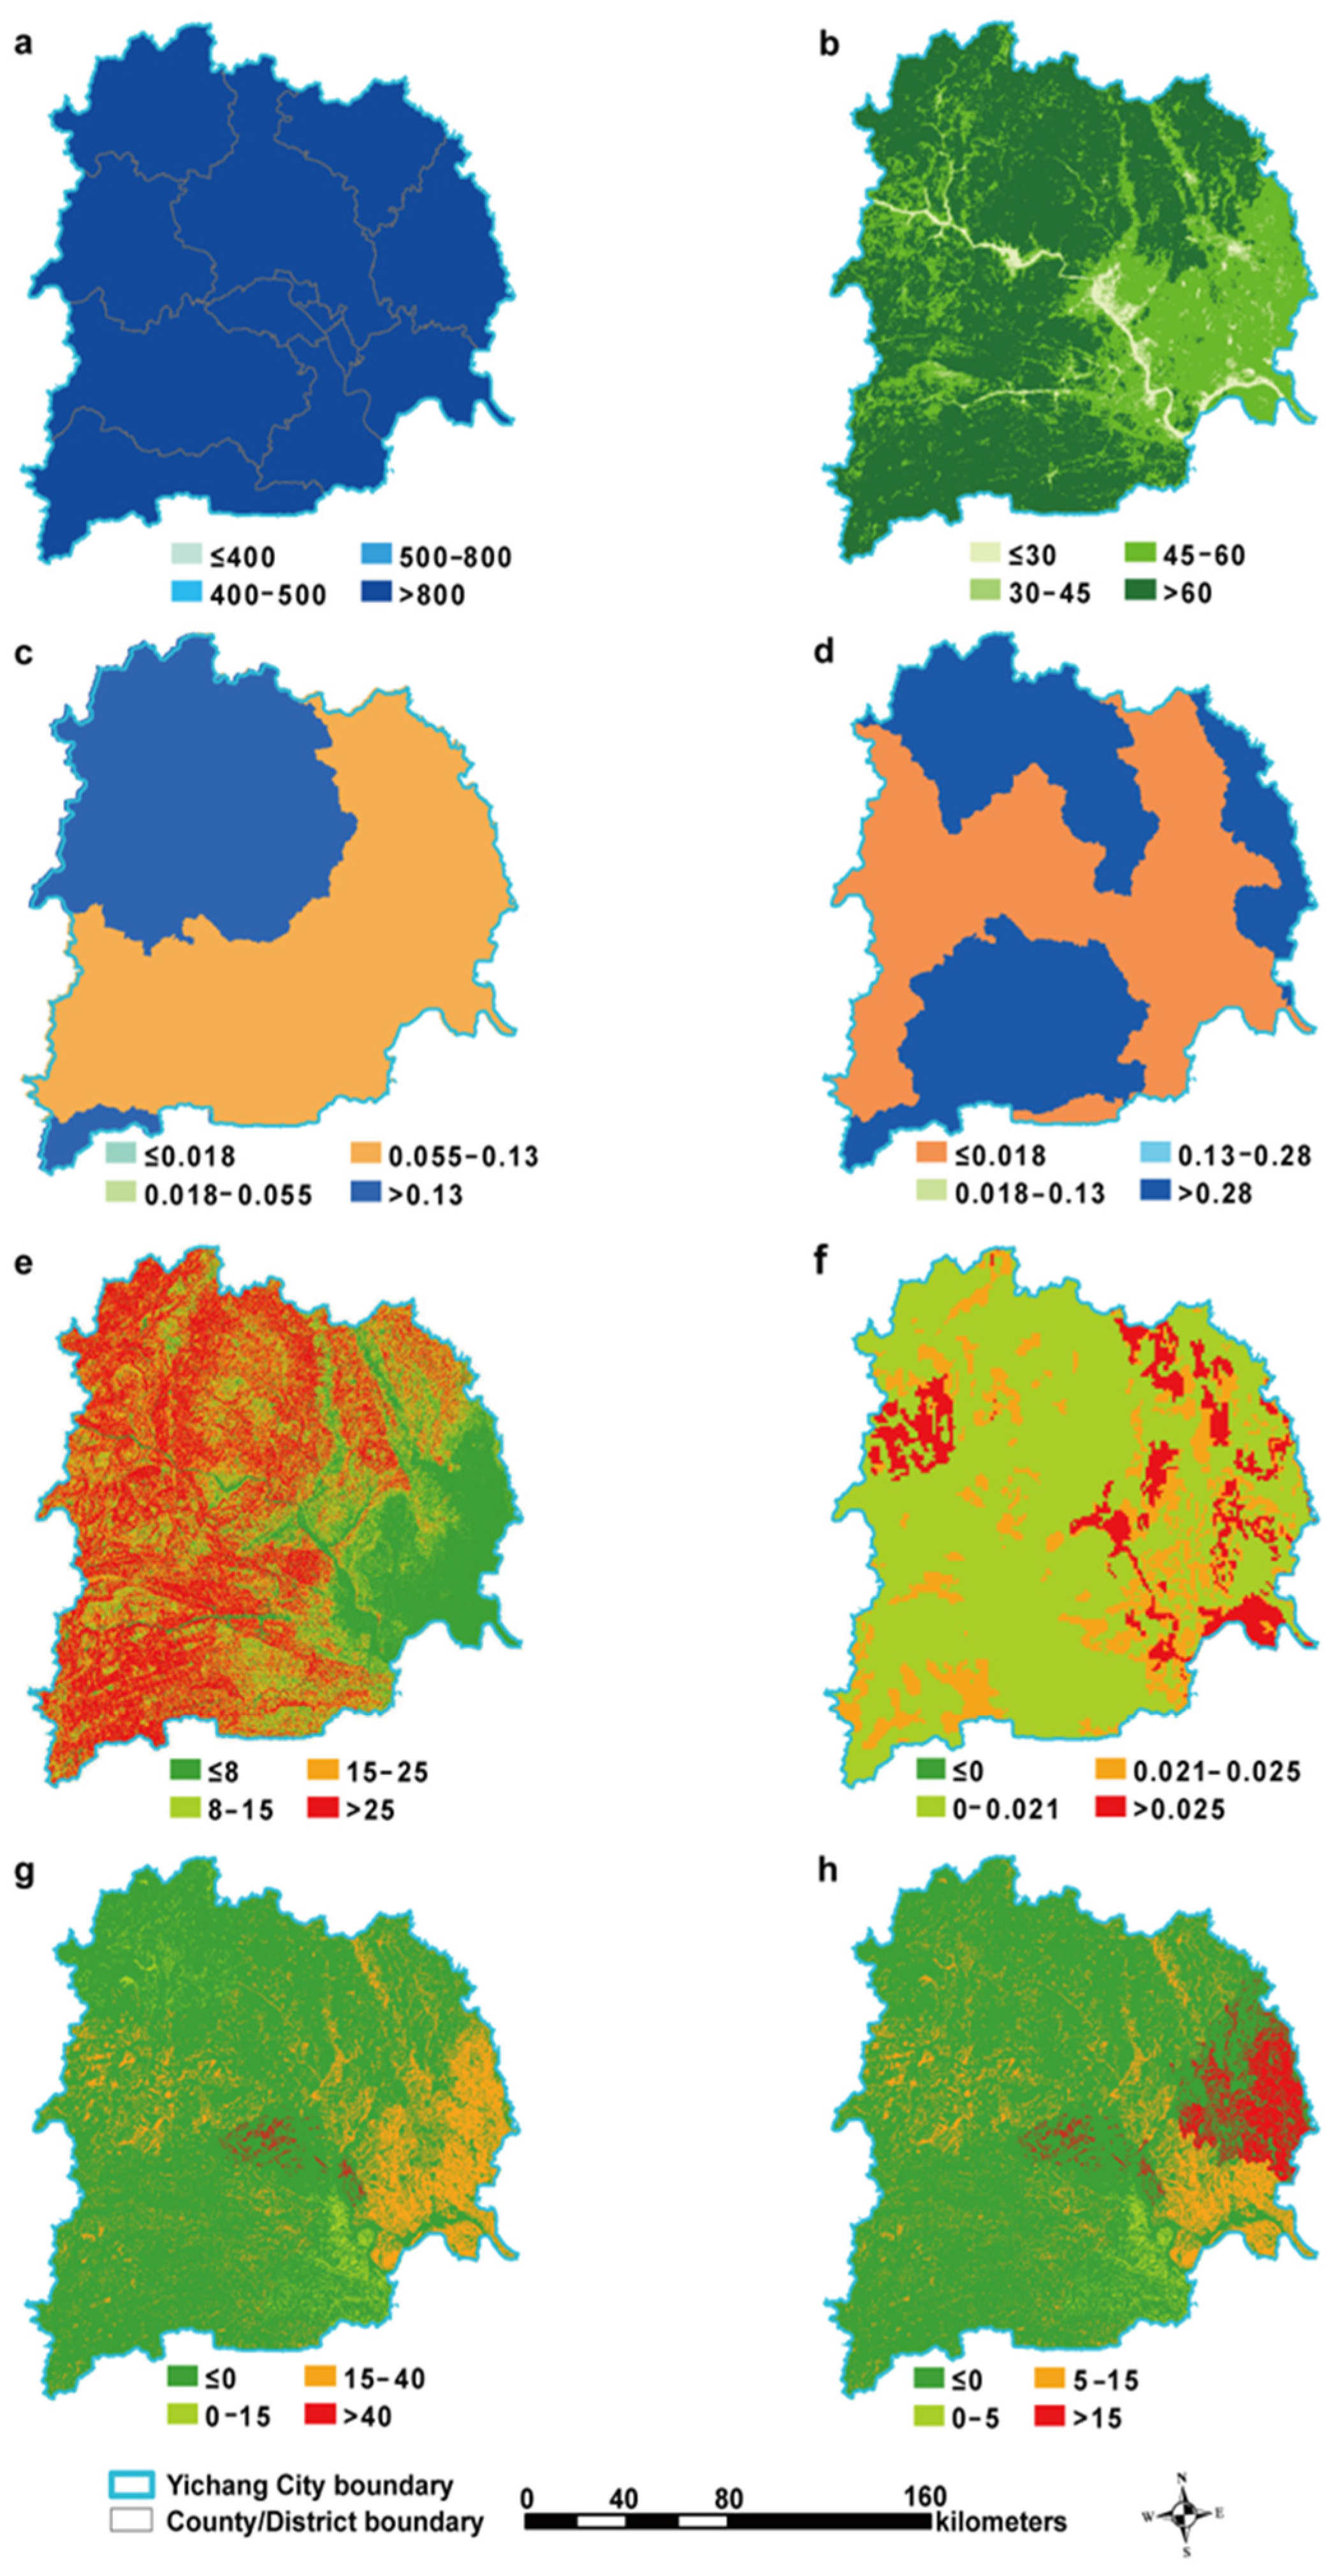
3.1. Spatial Characteristics of Potential Risk Identification Indicators for ANPSP

The spatial distribution of potential risk indicators prevalent in Yichang City is shown in Figure 2. The classification standards for potential risk indicators are listed in Table 2. The results showed that the annual precipitation in Yichang City is over 800 mm, and the vegetation coverage is relatively high. In the northwest region, the coefficient of dissolved nonpoint source pollutants entering the river was relatively high, whereas the coefficient of adsorbed nonpoint source pollutants entering the river was relatively low in the west and southeast of the study area. The slopes of the mountainous and hilly areas were relatively high, and the value of the soil erodibility factor for a low slope was relatively high. The apparent balance of nitrogen and phosphorus in farmlands in the eastern and western areas was higher, whereas that in the southern and northern areas was relatively lower.

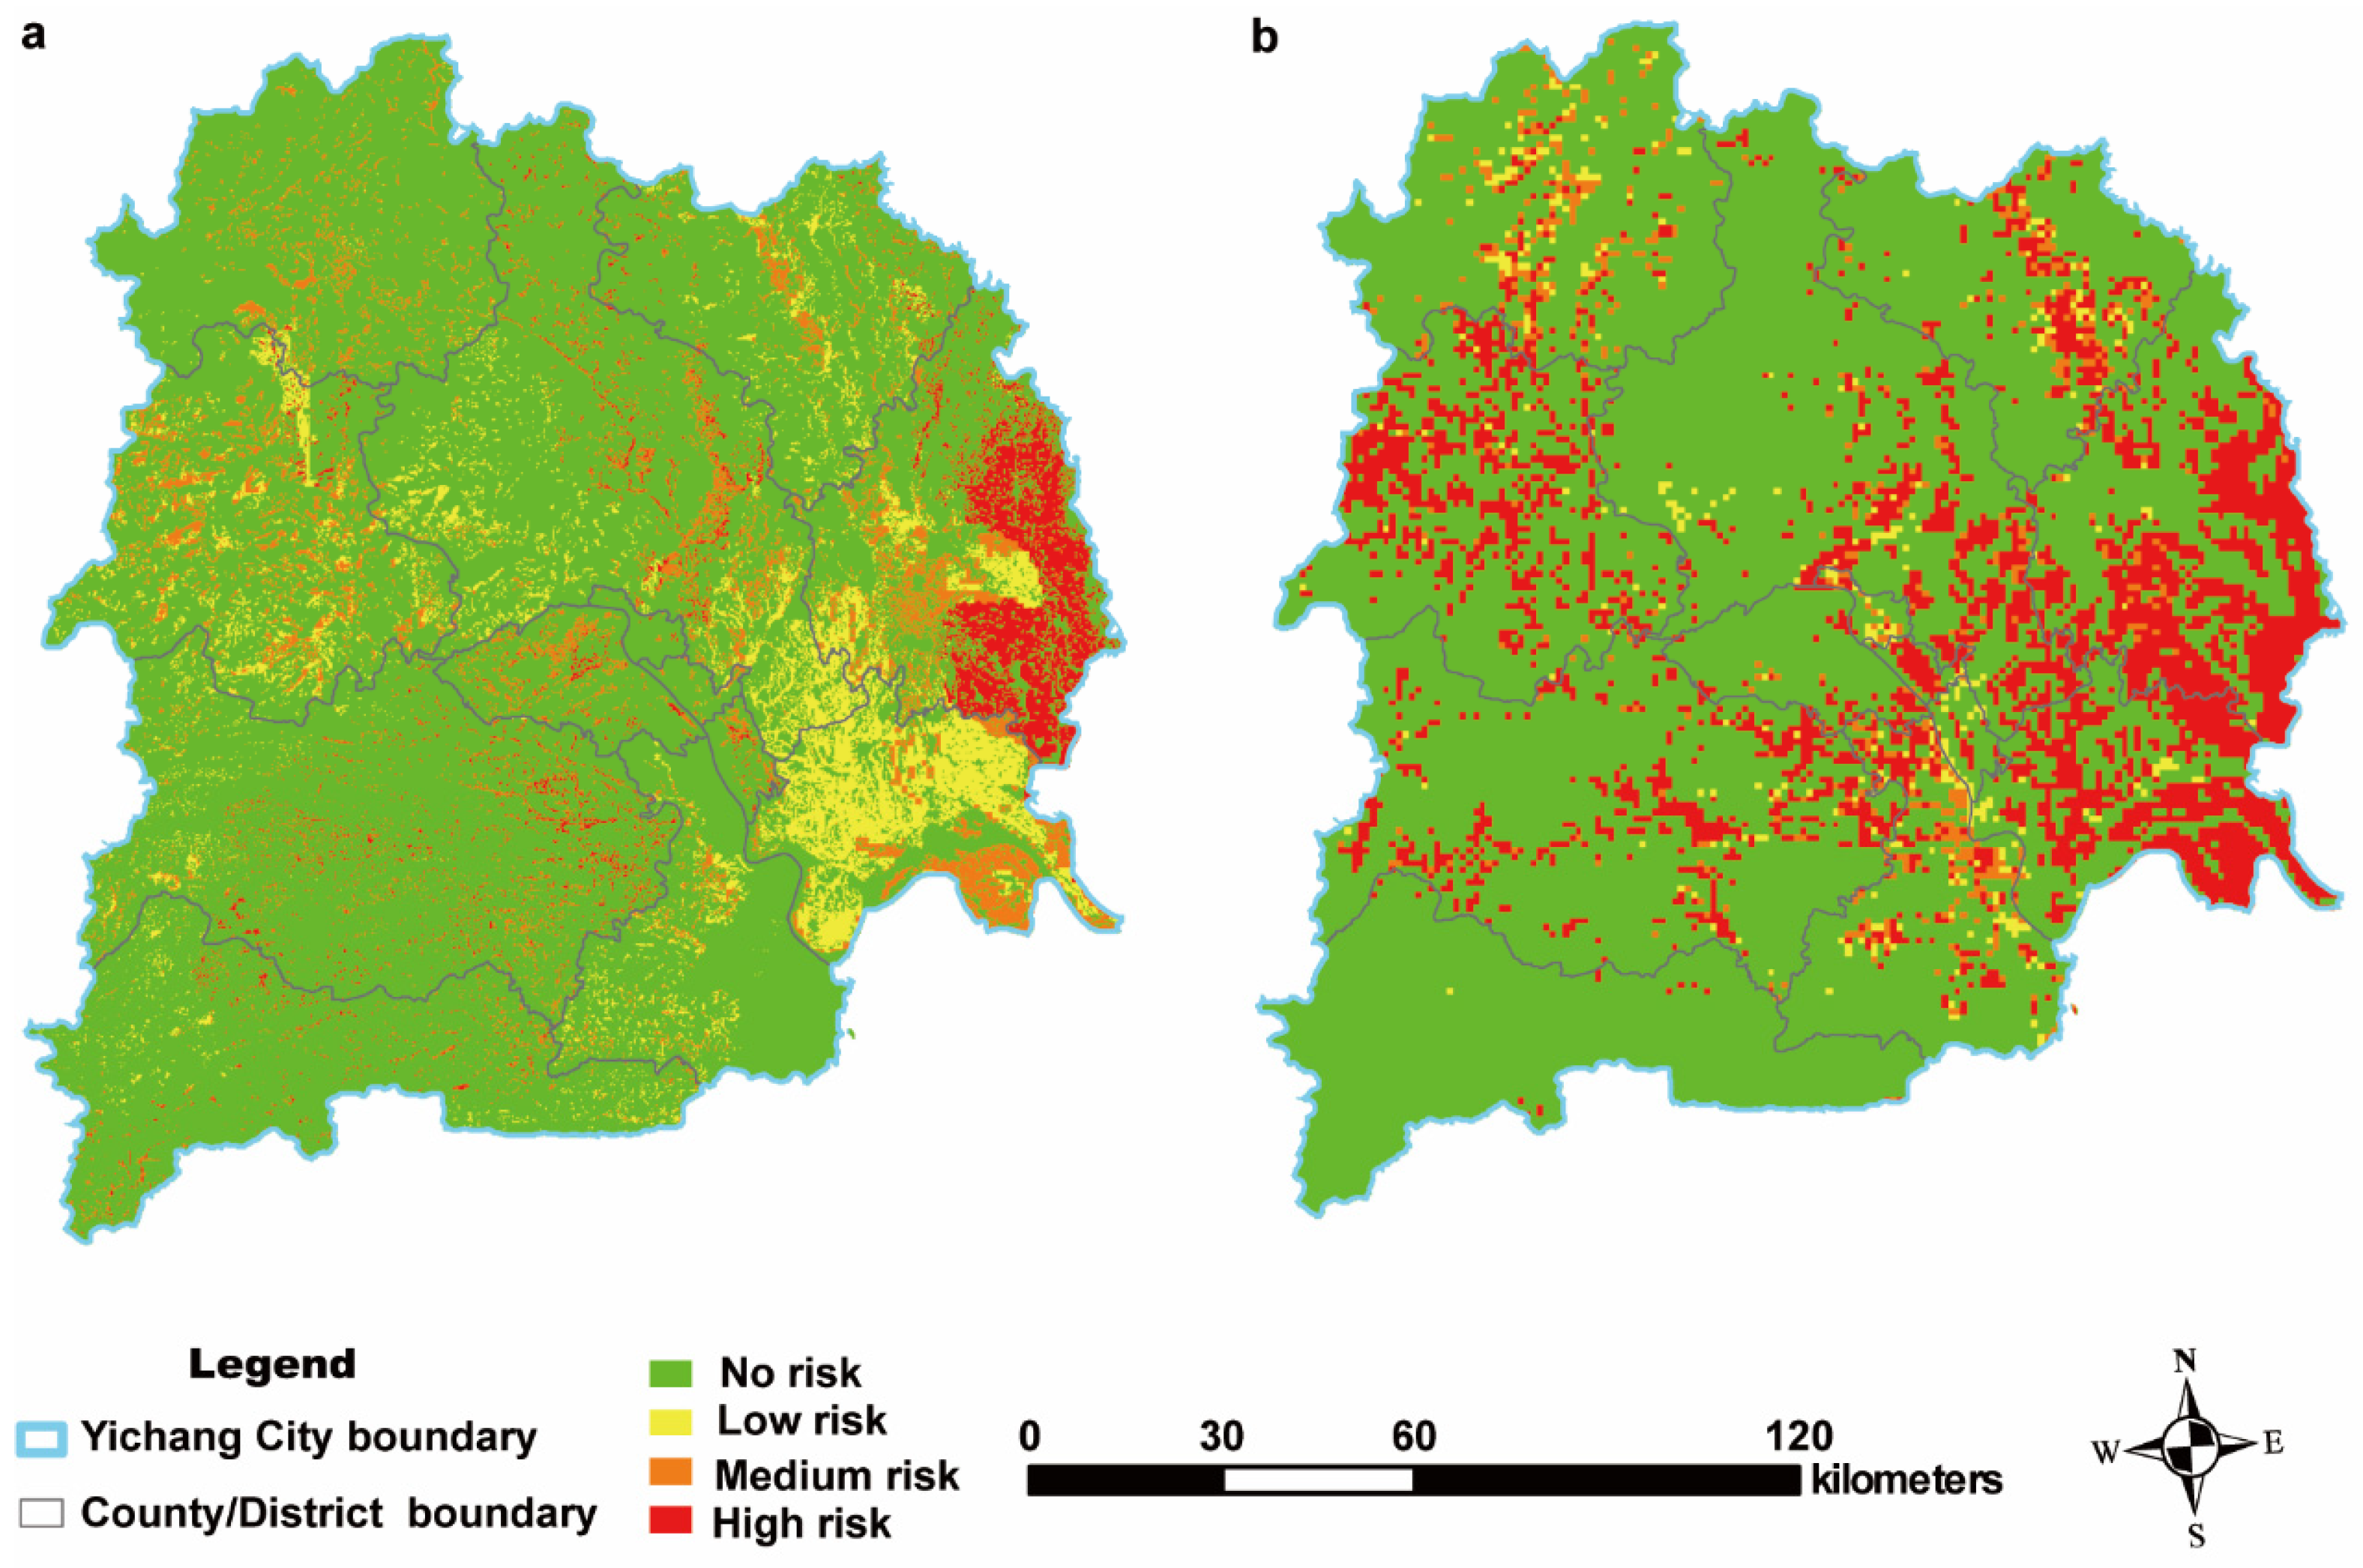
3.2. Identification of Potential Risks for ANPSP

The risk grade map and area statistics of ANPSP for Yichang City, Hubei Province, are shown in Figure 3 and Table 6. Results of the potential risk index system of ANPSP for Yichang City, Hubei Province, show a potential risk (not including “no risk”) of 18.86%, which is concentrated in the central and eastern areas, and the high-risk areas mainly distributed in the eastern area of Dangyang account for 4.95%. In addition, some sporadic distributions of risk were observed in the central areas of Yichang City.
The Diffuse Pollution estimation with Remote Sensing (DPeRS) model was used to identify potential risk areas for ANPSP in Yichang City. To achieve comparability, the pollution load results simulated by the DPeRS model were also classified into four risk levels (no risk, low risk, medium risk, and high risk) as in the previous method, and the four levels were assigned scores of 1–4 to obtain the model risk-level map (see Figure 3b).
Table 6 provides statistics on the results of the two potential risk identification methods, showing that 22.96% of Yichang City has a potential risk of ANPSP, and the area of high-risk areas accounts for 18.43%. And high-risk areas are mainly distributed in Dangyang and Zhijiang in the east of Yichang City, Zigui County and Xingshan County in the northwest, and Yuan’an County in the northeast. Based on the spatial distribution map (Figure 2), it can be seen that the four major counties above in high-risk areas have a large proportion of crop planting area and fertilizer application, accounting for 71.51% and 67.82% of the city’s total crop planting area and fertilizer application, respectively. They all have characteristics such as high nitrogen and phosphorus application rates, large soil erosion factors, and low vegetation coverage.

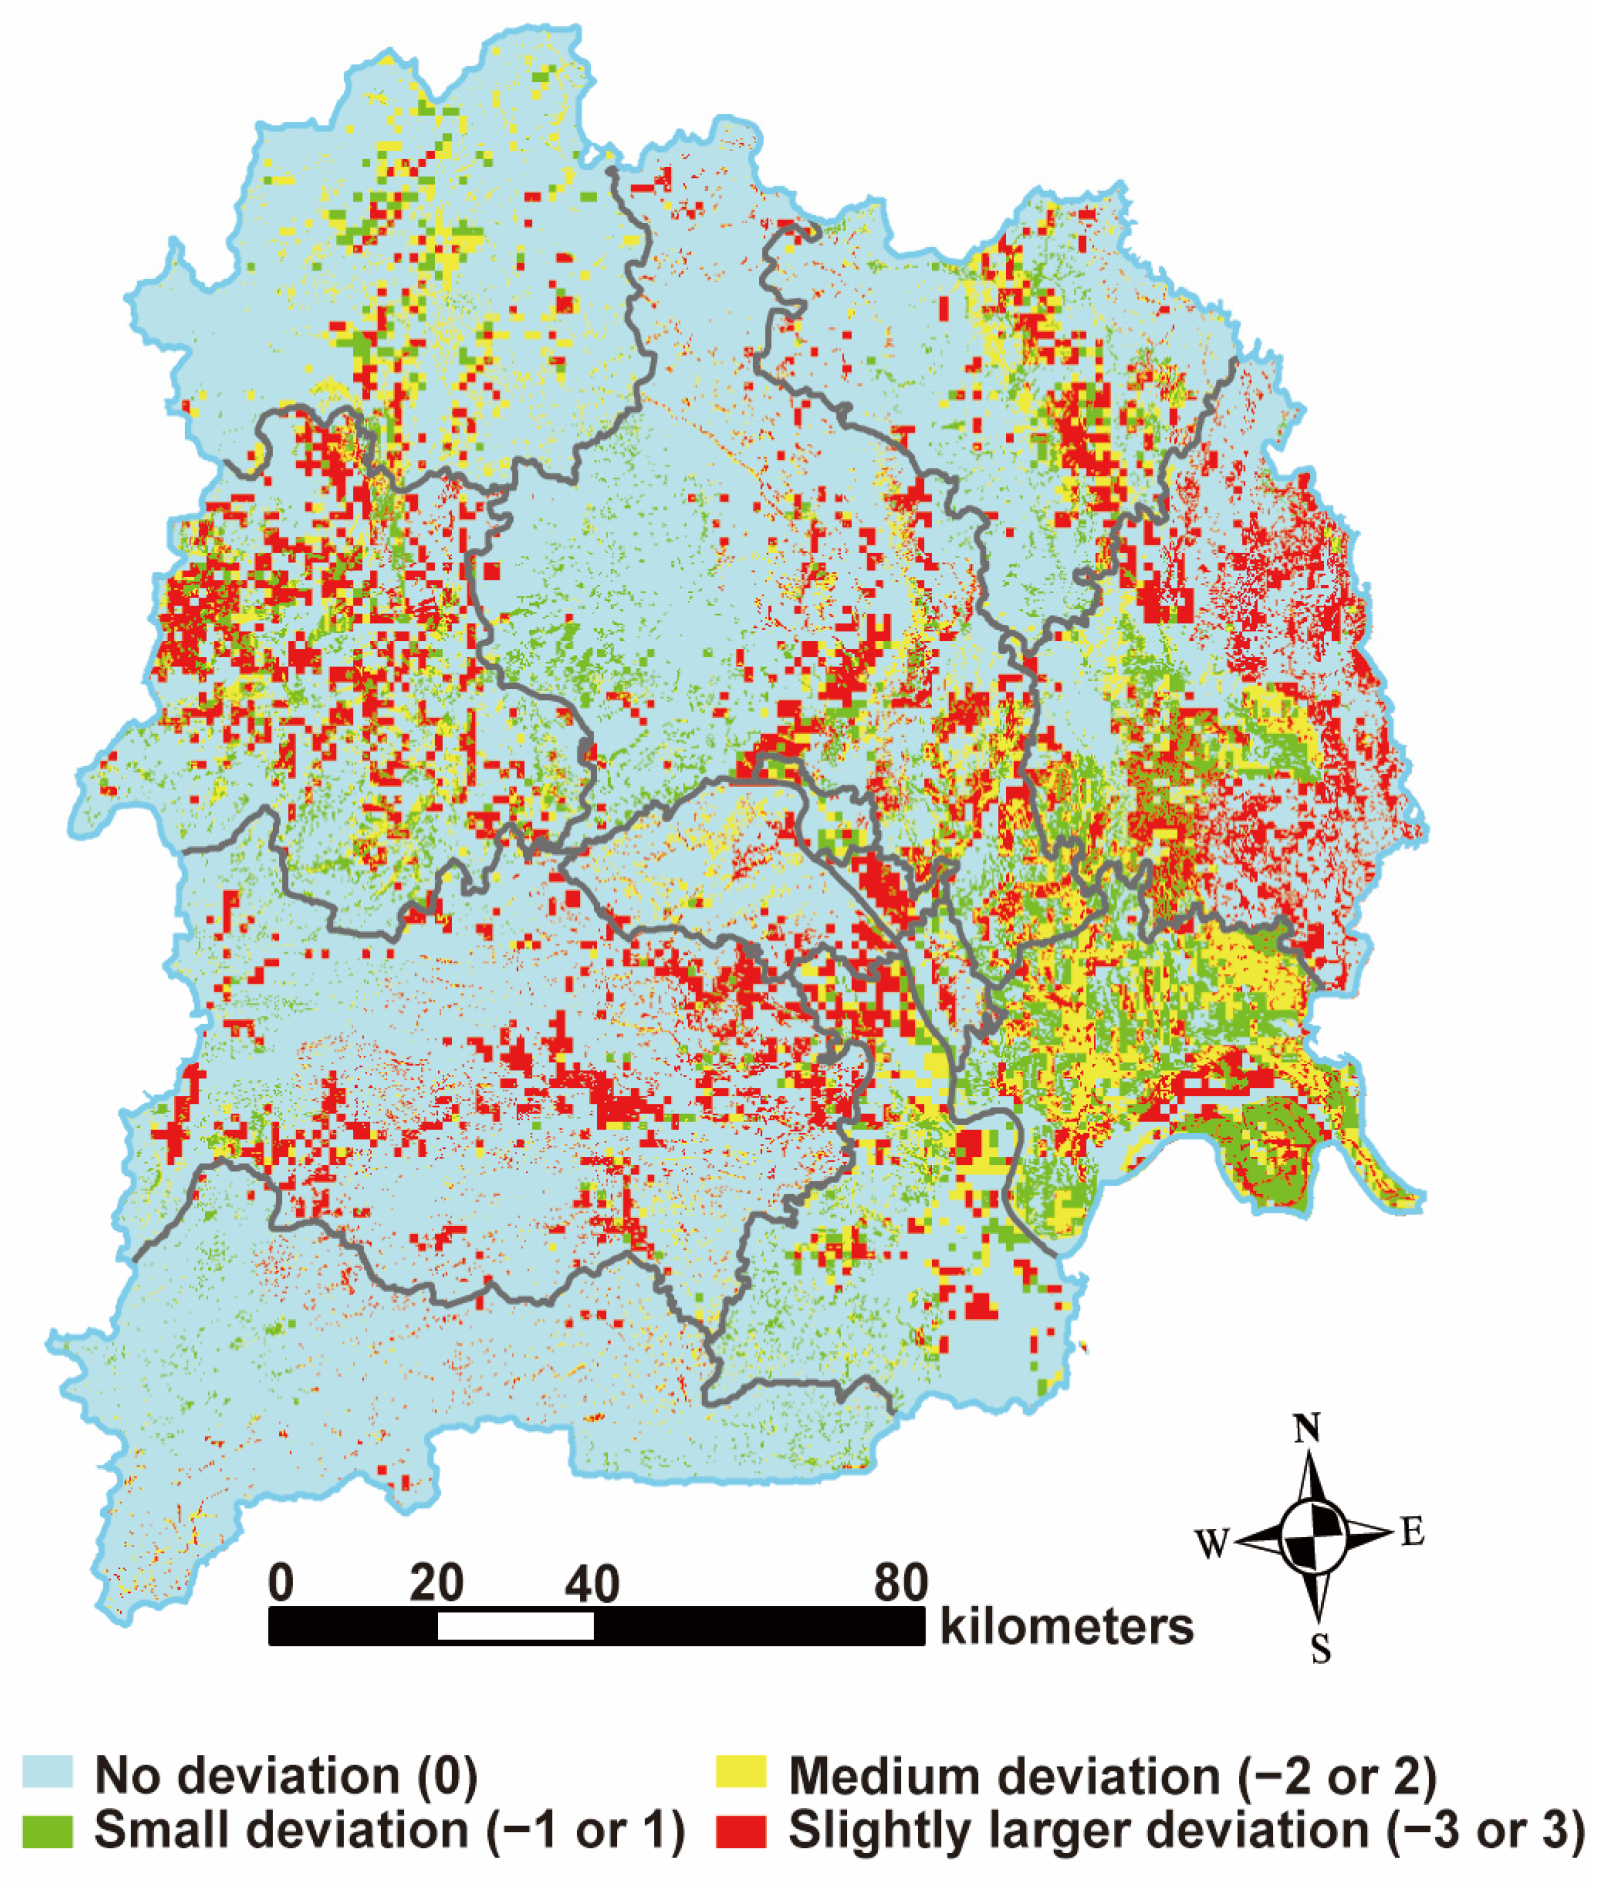
3.3. Verification of Identification Using CIES

To verify the accuracy of the identification method of potential risk indicators of ANPSP, a deviation analysis was carried out between the risk grade maps of CIES and DPeRS models (Figure 4).
A comparison of the results of risk grades of CIES and DPeRS models shows that the average difference in area for the same risk grade is not >33.9%, an area of >48.57% has a low or no deviation, and only 8.35% of the area has a slightly higher deviation (Table 7). This shows that the proposed method has the same level of risk identification accuracy as the DPeRS model. Moreover, the identification method does not require complex indicators and data accumulation that are required for the DPeRS model and it need not consider complex underlying surface conditions. Therefore, the proposed method is simple, fast, and has high precision for the risk identification of ANPSP.

4. Discussions

Herein, we propose a novel method—PRAIS, for potential risk identification of ANPSP of Yinchang City. As previous studies related to ANPSP in Yinchang City have not been involved in the potential risk identification of ANPSP [13,14,15,16,17], this study highlights the significance of the potential risk of ANPSP in the study area. Only 18.86% of the area has the potential risk of ANPSP in Yichang City, and the area of high-risk areas is less than 5%. This indicates that Yichang City has significantly improved the control of ANPSP, which is consistent with the water quality monitoring results of the outflow section of the Yangtze River mainstream in the TGRA (Nanjinguan, Yiling District, Yichang City, China). The average water quality index (WQI) meets the level II (WQI standard), and the water quality parameters (CODMn, NH3-N) meet the level I and II standards (GB3838-2002), respectively [13]. The average application rate of chemical fertilizers in Yichang City has decreased from 634.13 kg·hm−2 in 2019 to 470.82 kg·hm−2 in 2020, but it is still far higher than the international safety limit for chemical fertilizer use (225 kg·hm−2) to prevent water pollution [7,16,53]. By analyzing the relationship between the four variables in agricultural non-point source pollution in Yichang City (pesticide pollution, fertilizer pollution, plastic film pollution, livestock, and poultry manure pollution) and per capita agricultural output value, the treatment of fertilizer pollution and livestock and poultry manure pollution should become the focus of agricultural non-point source pollution control work in Yichang City [14]. From the identification results of PRAIS, it can also be seen that for the areas with high fertilizer application rates, the likelihood of becoming a high-risk area is greater. At present, the centralized treatment of livestock and poultry manure has achieved significant results. Therefore, the rational use of chemical fertilizers remains the key to the prevention and control of agricultural non-point source pollution in Yichang City.
The potential risk identification method for ANPSP proposed in this study is easy, quick, inexpensive, adaptable, and accurate in identifying the risk of ANPSP as it combines specific indicators with specific weights [54]. (i) Required indicator data are easy to obtain through meteorological and hydrological monitoring stations, national statistical yearbooks, and the China Soil Database. Indicators with fixed values throughout the year can be used directly without further measurements. Indicators for long-term monitoring and ease of calculation can also be quickly obtained, thus simplifying risk identification. (ii) The selected indicators are often used in scientific research. Even if they must be purchased, they are inexpensive because they are commonly available data, thereby significantly reducing overall risk-identification costs. (iii) This risk identification method is more suitable for identifying risks associated with agricultural fields, such as those for growing grain crops, vegetables, and commercial crops. Also, this method is more suitable for the areas with NPSP of the leaching type rather than the runoff type, as the water network distribution indicator that reflects the characteristics of the southern NPSP varies greatly with regions. It is particularly suitable for identifying the risk of ANPSP in agricultural fields on the plains of northern China. (iv) This study compares the identification results of the risk of ANPSP in Yichang City with the results of the DPeRS model and shows high consistency.
However, this study has some limitations. For example, in the southern region, owing to the high amount of precipitation, the current classification standard for annual precipitation indicators is not clear. In the future, it will be necessary to continue analyzing the spatiotemporal distribution characteristics of annual precipitation nationwide to optimize the classification standards for this indicator.

5. Conclusions

A novel method for the potential risk identification of NPSP was proposed by a comprehensive analysis of source and sink factors of the ANPSP risk. A potential risk assessment index system (PRAIS) was established. Eight indicators were screened for PRAIS: AP, coefficient of dissolved nonpoint source pollutants entering the river, coefficient of adsorbed nonpoint source pollutants entering the river, annual vegetation coverage, slope, soil erodibility factor, and apparent balance of nitrogen and phosphorus in farmland. The potential risk areas of ANPSP in Yichang City can be identified quickly and efficiently. An area of 18.86% in Yichang has the potential risk of ANPSP, which is concentrated in the central and eastern areas. High-risk areas account for 4.95% with sporadic distribution. Comparing the risk grade results of the CIES with the results of the DPeRS model, the average difference in area for the same risk grade is not >33.9%, an area of >48.57% has a low or no deviation, and only 8.35% of the area has a slightly higher deviation, which shows that this identification method has the same level of accuracy of risk identification as that of the DPeRS model.

Author Contributions

Investigation, J.Y., X.W. and Z.T.; Writing—original draft, J.Y.; Data acquisition; X.W.; Writing—review and editing X.W., X.L., Z.T. and X.G.; Resources and project administration, G.Z. and L.D.; Project administration, Funding acquisition, and Supervision, X.G. All authors have read and agreed to the published version of the manuscript.

Funding

This work was supported by the Key R&D Plan of China [grant number: 2021YFD1700500], Beijing Academy of Agriculture and Forestry Sciences [grant numbers: YXQN202305, ZHS202303, KJCX20220408, and YZS202101], and the Young Talent Support Project from CAST [grant number: YESS20200159].

Institutional Review Board Statement

Not applicable.

Informed Consent Statement

Not applicable.

Data Availability Statement

The data presented in this study are available on request from the corresponding author.

Conflicts of Interest

The authors declare no conflict of interest.

References

  1. Hu, W.; Tian, J.; Zang, N.; Gao, Y.; Chen, L. Study of the development and performance of centralized wastewater treatment plants in Chinese industrial parks. J. Clean. Prod. 2019, 214, 939–951. [Google Scholar] [CrossRef]
  2. Zhou, J.; Chen, S.; Luo, H.; Wen, Q. Research on Rural Environment Monitoring System in the 14th Five-Year Period. Environ. Monit. China 2021, 37, 8–15. [Google Scholar]
  3. Chang, D.; Lai, Z.; Li, S.; Li, D.; Zhou, J. Critical source areas’ identification for non-point source pollution related to nitrogen and phosphorus in an agricultural watershed based on SWAT model. Environ. Sci. Pollut. Res. 2021, 28, 47162–47181. [Google Scholar] [CrossRef] [PubMed]
  4. Xu, Y.; Su, B.; Wang, H.; He, J.; Yang, Y. Analysis of the water balance and the nitrogen and phosphorus runoff pollution of a paddy field in situ in the Taihu Lake basin. Paddy Water Environ. 2020, 18, 385–398. [Google Scholar] [CrossRef]
  5. Qiu, W.; Zhong, Z.; Li, Z.; Li, Z. Spatial-temporal variations of agricultural non-point source pollution in China. Chin. J. Agric. Resour. Reg. Plan. 2019, 40, 26–34. [Google Scholar]
  6. Yichang Municipal Bureau of Statistics. Statistical Bulletin on National Economic and Social Development of Yichang City in 2021; Hubei Provincial Statistics Bureau: Wuhan, China, 2021.
  7. Yichang Municipal Bureau of Statistics. Yichang Statistical Yearbook 2021; China Stastics Press: Beijing, China, 2021.
  8. Zhu, K.; Yang, Z.; Huang, L.; Chen, Y.; Zhang, S.; Lei, B. Coupling ITO3dE model and GIS for spatiotemporal evolution analysis of agricultural non-point source pollution risks in Chongqing in China. Sci. Rep. 2021, 11, 4635. [Google Scholar] [CrossRef] [PubMed]
  9. Tan, S.; Xie, D.; Ni, J.; Chen, L.; Ni, C.; Ye, W.; Zhao, G.; Shao, J.; Chen, F. Output characteristics and driving factors of non-point source nitrogen (N) and phosphorus (P) in the Three Gorges reservoir area (TGRA) based on migration process: 1995–2020. Sci. Total Environ. 2023, 875, 162543. [Google Scholar] [CrossRef]
  10. Xu, W.; Liu, L.; Zhu, S.; Sun, A.; Wang, H.; Ding, Z. Identifying the critical areas and primary sources for agricultural non-point source pollution management of an emigrant town within the Three Gorges reservoir area. Environ. Monit. Assess. 2023, 195, 602. [Google Scholar] [CrossRef] [PubMed]
  11. Tong, X.; Zhou, Y.; Liu, J.; Qiu, P.; Shao, Y. Non-point source pollution loads estimation in Three Gorges Reservoir Area based on improved observation experiment and export coefficient model. Water Sci. Technol. 2021, 85, 27–38. [Google Scholar] [CrossRef]
  12. Ma, L.; Ni, J.; Fleskens, L.; Wang, H.; Xuan, Y. Modelling Fertilizer Use in Relation to Farmers’ Household Characteristics in Three Gorges Reservoir Area, China. Agriculture 2021, 11, 472. [Google Scholar] [CrossRef]
  13. Huang, Y.; Huang, Z.; Xiao, W.; Zeng, L.; Ma, L. Assessing and predicting water quality of outflow under water level fluctuation of the Three Gorges Reservoir, China. Desalination Water Treat. 2021, 218, 32–43. [Google Scholar] [CrossRef]
  14. Zheng, H.; Chen, Y. Analysis of the Relationship between Economic Growth and Agricultural Non-Point Source Pollution in Yichang City. J. Xinyang Agric. For. Univ. 2020, 30, 33–38. [Google Scholar]
  15. Zhao, Y.; Xia, Y.; Fan, X.; Chen, Y.; Wu, M.; Zhang, F.; Liu, D.; Xiong, G. Agricultural Non-Point Source Pollution Load, Evaluation And Early Warning System in Hubei Three Gorges Reservoir Area. Hubei Agric. Sci. 2016, 55, 6244–6249. [Google Scholar]
  16. Cai, J.; Fan, X.; Huang, M.; Liu, D.; Gan, X.; Wang, L. Sources Analysis of Agricultural Non -point Source Pollution in the Three Gorges Reservoir Area of Hubei Province, China. J. Agro-Environ. Sci. 2012, 31, 1421–1430. [Google Scholar]
  17. Wang, L.; Xia, Y.; Fan, X.; Huang, M.; Zhang, F.; Liu, D.; Xiong, G.; Yang, L. Survey and Analysis of Planting Non-point Source Pollution in Hubei. Hubei Agric. Sci. 2016, 55, 6421–6426. [Google Scholar]
  18. Ma, D.; Peng, W.; Jin, Y. Identification and spatial distribution of critical source areas for nonpoint source pollution on islands. Fresenius Environ. Bull. 2020, 29, 4861–4870. [Google Scholar]
  19. Wang, W.; Chen, L.; Shen, Z. Dynamic export coefficient model for evaluating the effects of environmental changes on non-point source pollution. Sci. Total Environ. 2020, 747, 141164. [Google Scholar] [CrossRef]
  20. Wang, J.; Lu, J.; Zhang, Z.; Han, X.; Zhang, C.; Chen, X. Agricultural non-point sources and their effects on chlorophyll-a in a eutrophic lake over three decades (1985–2020). Environ. Sci. Pollut. Res. 2022, 29, 46634–46648. [Google Scholar] [CrossRef]
  21. Wang, M.; Duan, L.; Bai, Y.; Peng, J.; Wang, Y.; Zheng, B. Improved export coefficient model for identification of watershed environmental risk areas. Environ. Sci. Pollut. Res. 2023, 30, 34649–34668. [Google Scholar] [CrossRef]
  22. Geng, R.; Sharpley, A. A novel spatial optimization model for achieve the trad-offs placement of best management practices for agricultural non-point source pollution control at multi-spatial scales. J. Clean. Prod. 2019, 234, 1023–1032. [Google Scholar] [CrossRef]
  23. Roberson, D.; Saad, D. Nitrogen and Phosphorus Sources and Delivery from the Mississippi/Atchafalaya River Basin: An Update Using 2012 SPARROW Models. J. Am. Water Resour. Assoc. 2021, 57, 406–429. [Google Scholar] [CrossRef]
  24. Xu, Z.; Ji, Z.; Liang, B.; Song, D.; Lin, Y.; Lin, J. Estimate of nutrient sources and transport into Bohai Bay in China from a lower plain urban watershed using a SPARROW model. Environ. Sci. Pollut. Res. 2021, 28, 25733–25747. [Google Scholar] [CrossRef] [PubMed]
  25. Dai, Y.; Lang, Y.; Wang, T.; Han, X.; Wang, L.; Zhong, J. Modelling the sources and transport of ammonium nitrogen with the SPARROW model: A case study in a karst basin. J. Hydrol. 2021, 592, 125763. [Google Scholar] [CrossRef]
  26. Neumann, A.; Blukacz-Richards, E.; Saha, R.; Arnillas, C.; Arhonditsis, G. A Bayesian hierarchical spatially explicit modelling framework to examine phosphorus export between contrasting flow regimes. J. Great Lakes Res. 2023, 49, 190–208. [Google Scholar] [CrossRef]
  27. Pérez-Gutiérrez, J.; Paz, J.; Tagert, M.; Yasarer, L.; Bingner, R. Using AnnAGNPS to Simulate Runoff, Nutrient, and Sediment Loads in an Agricultural Catchment with an On-Farm Water Storage System. Climate 2020, 8, 133. [Google Scholar] [CrossRef]
  28. Chen, Y.; Lu, B.; Xu, C.; Chen, X.; Liu, M.; Gao, L.; Deng, H. Uncertainty Evaluation of Best Management Practice Effectiveness Based on the AnnAGNPS Model. Water Resour. Manag. 2022, 36, 1307–1321. [Google Scholar] [CrossRef]
  29. Zhang, S.; Zhang, J.; Zhuang, J.; Wang, X.; Zhang, S. Parameters sensitivity and applicability evaluations of AnnAGNPS model in a small watershed of the Yangtze River Delta. J. Nanjing For. Univ. 2021, 45, 183–192. [Google Scholar]
  30. Mohammadi, M.M.; Mehdi, Z.; Tirtash, M.N. Predicting the effects of Controlled Tile Drainage on Nitrogen and Sediment Loads at the Watershed Scale using AnnAGNPS (Case study: Qharesu Watershed). Iran. Water Res. J. 2022, 16, 45. [Google Scholar]
  31. Li, H.; Zhou, X.; Huang, K.; Hao, G.; Li, J. Research on optimal control of non-point source pollution: A case study from the Danjiang River basin in China. Environ. Sci. Pollut. Res. 2022, 29, 15582–15602. [Google Scholar] [CrossRef]
  32. Venishetty, V.; Parajuli, P. Assessment of BMPs by Estimating Hydrologic and Water Quality Outputs Using SWAT in Yazoo River Watershed. Agriculture 2022, 12, 477. [Google Scholar] [CrossRef]
  33. Zuo, D.; Han, Y.; Gao, X.; Ma, G.; Xu, Z.; Bi, Y.; Abbaspour, K.; Yang, H. Identification of priority management areas for non-point source pollution based on critical source areas in an agricultural watershed of Northeast China. Environ. Res. 2022, 214, 113892. [Google Scholar] [CrossRef] [PubMed]
  34. Li, Z.; Xue, W.; Winijkul, E.; Shrestha, S. Spatio-Temporal Dynamics of Non-Point Source Pollution in Jiulong River Basin (China) Using the Soil & Water Assessment Tool Model in Combination with the GeoSOS-FLUS Model. Water 2023, 15, 2763. [Google Scholar]
  35. Ruan, S.; Zhuang, Y.; Hong, S.; Zhang, L.; Wang, Z.; Tang, X.; Wen, W. Cooperative identification for critical periods and critical source areas of nonpoint source pollution in a typical watershed in China. Environ. Sci. Pollut. Res. 2020, 27, 10472–10483. [Google Scholar] [CrossRef] [PubMed]
  36. Liu, H.; Chen, J.; Zhang, L.; Sun, K.; Cao, W. Simulation effects of clean water corridor technology on the control of non-point source pollution in the Paihe River basin, Chaohu lake. Environ. Sci. Pollut. Res. 2021, 28, 23534–23546. [Google Scholar] [CrossRef] [PubMed]
  37. Li, Z.; Dai, J.; Li, Z.; Liu, Y.; Xu, J.; Zhang, Z.; Xu, B. Simulation Study on the Effect of Non-Point Source Pollution on Water Quality in the Upper Reaches of the Lijiang River. Water 2022, 14, 3995. [Google Scholar] [CrossRef]
  38. Chen, S.; Wang, J. An integrative analytical framework and evaluation system of water environment security in the context of agricultural non-point source perspective. Environ. Res. Commun. 2023, 5, 015009. [Google Scholar] [CrossRef]
  39. Guo, H.; Wang, X.; Zhu, J. Quantification and index of non-point source pollution in Taihu Lake region with GIS. Environ. Geochem. Health 2004, 26, 147–156. [Google Scholar] [CrossRef] [PubMed]
  40. Shen, Z.; Hong, Q.; Chu, Z.; Gong, Y. A framework for priority non-point source area identification and load estimation integrated with APPI and PLOAD model in Fujiang Watershed, China. Agric. Water Manag. 2011, 98, 977–989. [Google Scholar] [CrossRef]
  41. Zhang, W.; Ma, Y.; Lu, Q.; Wu, L.; Fu, B.; Zhang, X.; Gong, J.; Tian, Y. Nutrient loss from farmland: Research on and application of phosphorus index method. Agric. Sci. Technol. 2015, 16, 262–265. [Google Scholar]
  42. Welikhe, P.; Brouder, S.; Volenec, J.; Gitau, M.; Turco, R. Using artificial neural networks to improve phosphorus indices. J. Soil Water Conserv. 2021, 76, 513–526. [Google Scholar] [CrossRef]
  43. Koch, S.; Kahle, P.; Lennartz, B. Spatio-temporal analysis of phosphorus concentrations in a North-Eastern German lowland watershed. J. Hydrol. Reg. Stud. 2018, 15, 203–216. [Google Scholar] [CrossRef]
  44. Wan, W.; Han, Y.; Wu, H.; Liu, F.; Liu, Z. Application of the source–sink landscape method in the evaluation of agricultural non-point source pollution: First estimation of an orchard-dominated area in China. Agric. Water Manag. 2021, 252, 106910. [Google Scholar] [CrossRef]
  45. Liu, R.; Miao, Y.; Wang, Q.; Jiao, L.; Wang, Y.; Li, L.; Cao, L. Effectivity and Efficiency of Best Management Practices Based on a Survey and SWAPP Model of the Xiangxi River Basin. Water 2021, 13, 985. [Google Scholar] [CrossRef]
  46. Jiménez-Muñoz, J.C.; Sobrino, J.A.; Plaza, A.; Guanter, L.; Moreno, J.; Martinez, P. Comparison Between Fractional Vegetation Cover Retrievals from Vegetation Indices and Spectral Mixture Analysis: Case Study of PROBA/CHRIS Data Over an Agricultural Area. Sensors 2009, 9, 768–793. [Google Scholar] [CrossRef] [PubMed]
  47. Gong, W.; Liu, T.; Duan, X.; Sun, Y.; Zhang, Y.; Tong, X.; Qiu, Z. Estimating the Soil Erosion Response to Land-Use Land-Cover Change Using GIS-Based RUSLE and Remote Sensing: A Case Study of Miyun Reservoir, North China. Water 2022, 14, 742. [Google Scholar] [CrossRef]
  48. Wang, X.; Feng, A.; Wang, Q.; Wu, C.; Liu, Z.; Ma, Z.; Wei, X. Spatial variability of the nutrient balance and related NPSP risk analysis for agro-ecosystems in China in 2010. Agric. Ecosyst. Environ. 2014, 193, 42–52. [Google Scholar] [CrossRef]
  49. Gburek, W.J.; Sharpley, A.N.; Heathwaite, L.; Folmar, G.J. Phosphorus management at the watershed scale: A modification of the phosphorus index. J. Environ. Qual. 2000, 29, 130–144. [Google Scholar] [CrossRef]
  50. Lu, Y.; Wang, C.; Yang, R.; Sun, M.; Zhang, L.; Zhang, Y.; Li, X. Research on the Progress of Agricultural Non-Point Source Pollution Management in China: A Review. Sustainability 2023, 15, 13308. [Google Scholar] [CrossRef]
  51. Wang, X.; Wang, X.; Zhu, L.; Ma, Y.; Wu, C.; Wang, Q.; Feng, A.; Chen, M. Spatial analysis on diffuse pollution and algal bloom characteristic with remote sensing in Chao Lake Basin. China Environ. Sci. 2015, 35, 1511–1519. [Google Scholar]
  52. Huang, L.; Han, X.; Wang, X.; Zhang, Y.; Yang, J.; Feng, A.; Li, J.; Zhu, N. Coupling with high-resolution remote sensing data to evaluate urban non-point source pollution in Tongzhou, China. Sci. Total Environ. 2022, 831, 154632. [Google Scholar] [CrossRef]
  53. Yichang Municipal Bureau of Statistics. Yichang Statistical Yearbook 2020; China Stastics Press: Beijing, China, 2020.
  54. Yang, J.; Feng, A.; Wang, X.; Li, X.; Wang, C.; Tian, Z. An identification method of potential risk for agricultural non-point source pollution in the Haihe River Basin. China Environ. Sci. 2021, 41, 4782–4791. [Google Scholar]
Figure 1. Location of the study area.
Sustainability 15 16324 g001
Figure 2. Spatial distribution of potential risk identification indicators of ANPSP pertaining to Yichang City, Hubei Province. (a) Annual precipitation (mm). (b) Annual vegetation coverage (%). (c) Coefficient of dissolved nonpoint source pollutants entering the river. (d) Coefficient of adsorbed nonpoint source pollutants entering the river. (e) Slope (°). (f) Soil erodibility factor (t·h·(MJ·mm)−1). (g) Apparent balance of nitrogen in farmland (t·km−2). (h) Apparent balance of phosphorus in farmland (t·km−2).
Sustainability 15 16324 g002
Figure 3. Risk grade maps of ANPSP for Yichang City obtained using (a) the Comprehensive Indicator Evaluation System (CIES) and (b) DPeRS.
Sustainability 15 16324 g003
Figure 4. Results of deviation analysis of risk grades between CIES and DPeRS models for Yichang City.
Sustainability 15 16324 g004
Table 1. Weights of potential risk identification indicators for ANPSP.
First-Class IndicatorsWeightsSecondary IndicatorsWeights
Hydrometeorological indicators0.5396Annual precipitation0.2662
Coefficient of dissolved nonpoint source pollutants entering the river0.1677
Coefficient of adsorbed nonpoint source pollutants entering the river0.1057
Soil topography
Vegetation indicators
0.1634Annual vegetation coverage0.0267
Slope0.0485
Soil erodibility factor0.0882
Economic indicators0.2970Apparent balance of nitrogen in farmland0.1980
Apparent balance of phosphorus in farmland0.0990
Table 2. Classification standards for potential risk identification indicators of ANPSP.
IndicatorsIndicator Classification
Level 1Level 2Level 3Level 4
Assignment: 1Assignment: 2Assignment: 3Assignment: 4
AP≤400400–500500–700>700
CR≤0.0180.018–0.0550.055–0.130>0.130
SDR≤0.0180.018–0.130.13–0.28>0.28
AVC>6045–6030–45≤30
Slope≤88–1515–25>25
K≤0.0100.010–0.0230.023–0.027>0.027
FANB ≤00–1515–40>40
FAPB ≤00–55–15>15
Note: AP: annual precipitation (mm), CR: dissolved nonpoint source pollutant entering river coefficient, SDR: adsorbed nonpoint source pollutant entering river coefficient; AVC: annual vegetation coverage (%); Slope (°), K: soil erodibility factor (t h·(MJ·mm)−1); FANB: farmland apparent nitrogen balance (t·km−2); FAPB: farmland apparent phosphorus balance (t·km−2).
Table 3. List of data sources.
Data TypeData InformationData SourceUse
Remote sensing dataNDVI Data of MOD13A2
(1-km resolution vegetation index 16a synthetic product)
https://ladsweb.nascom.nasa.gov/search accessed on 27 October 2023Used for vegetation coverage inversion
Precipitation dataAnnual precipitation datahttp://data.cma.cn accessed on 27 October 2023Used for interpolation of annual precipitation and calculation of R factor of rainfall erosivity
Hydrological dataAnnual runoff and sediment content dataHydrological Yearbook and Bulletin of River Sediment in ChinaUsed for calculating the river entry coefficient of dissolved and adsorbed nonpoint source pollutants
Elevation dataASTER Global DEM Data/30-m Resolutionhttps://wist.echo.nasa.gov/api/ accessed on 27 October 2023Used for slope and slope length calculation
Soil dataSoil organic carbon content and soil mechanical compositionhttp://globalchange.bnu.edu.cn/research/soilw accessed on 27 October 2023Used for calculating soil erodibility factor K
Statistical datacounty population, livestock and poultry breeding, and cultivated land area,
Statistical data of the quantity of chemical fertilizer application, crop yield, and sown area.
http://tongji.cnki.net/kns55/Navi/NaviDefault.aspx accessed on 27 October 2023Used for estimating the apparent balance of nitrogen and phosphorus in farmland
Table 4. Pixel brightness value of remote sensing image (DN).
Level (DN)Level 1 (1)Level 1 (2)Level 1 (3)Level 1 (4)
Level 1 (1)0123
Level 2 (2)−1012
Level 3 (3)−2−101
Level 4 (4)−3−2−10
Table 5. Pixel brightness value of remote sensing image (DN) values description.
DN ValuesDeviationDescription
0No deviationThere is no overshoot between risk levels.
−1 or 1Low deviationRisk levels have crossed one level.
−2 or 2Medium deviationRisk levels have crossed two levels.
−3 or 3Slightly higher deviationRisk levels have crossed three levels.
Table 6. Statistics of areas of ANPSP risk grades in Yichang City.
Identification MethodRisk GradeArea (km2)Area Proportion (%)
CIESNo risk17,215.8381.14
Low risk1544.517.28
Medium risk1408.236.64
High risk1049.304.95
DPeRS modelNo risk16,346.3677.04
Low risk370.571.75
Medium risk589.702.78
High risk3911.2418.43
Table 7. Deviation between results of risk grades of CIES and DPeRS models.
Deviation ValueDeviationArea Value (km2)Area Ratio (%)
0No deviation14,515.8068.41
1 or −1Low deviation1798.518.48
2 or −2Medium deviation1915.119.03
3 or −3Slightly higher deviation2988.4414.08
Disclaimer/Publisher’s Note: The statements, opinions and data contained in all publications are solely those of the individual author(s) and contributor(s) and not of MDPI and/or the editor(s). MDPI and/or the editor(s) disclaim responsibility for any injury to people or property resulting from any ideas, methods, instructions or products referred to in the content.

