


Exploration of Riding Behaviors of Food Delivery Riders: A Naturalistic Cycling Study in Changsha, China


Abstract
:1. Introduction
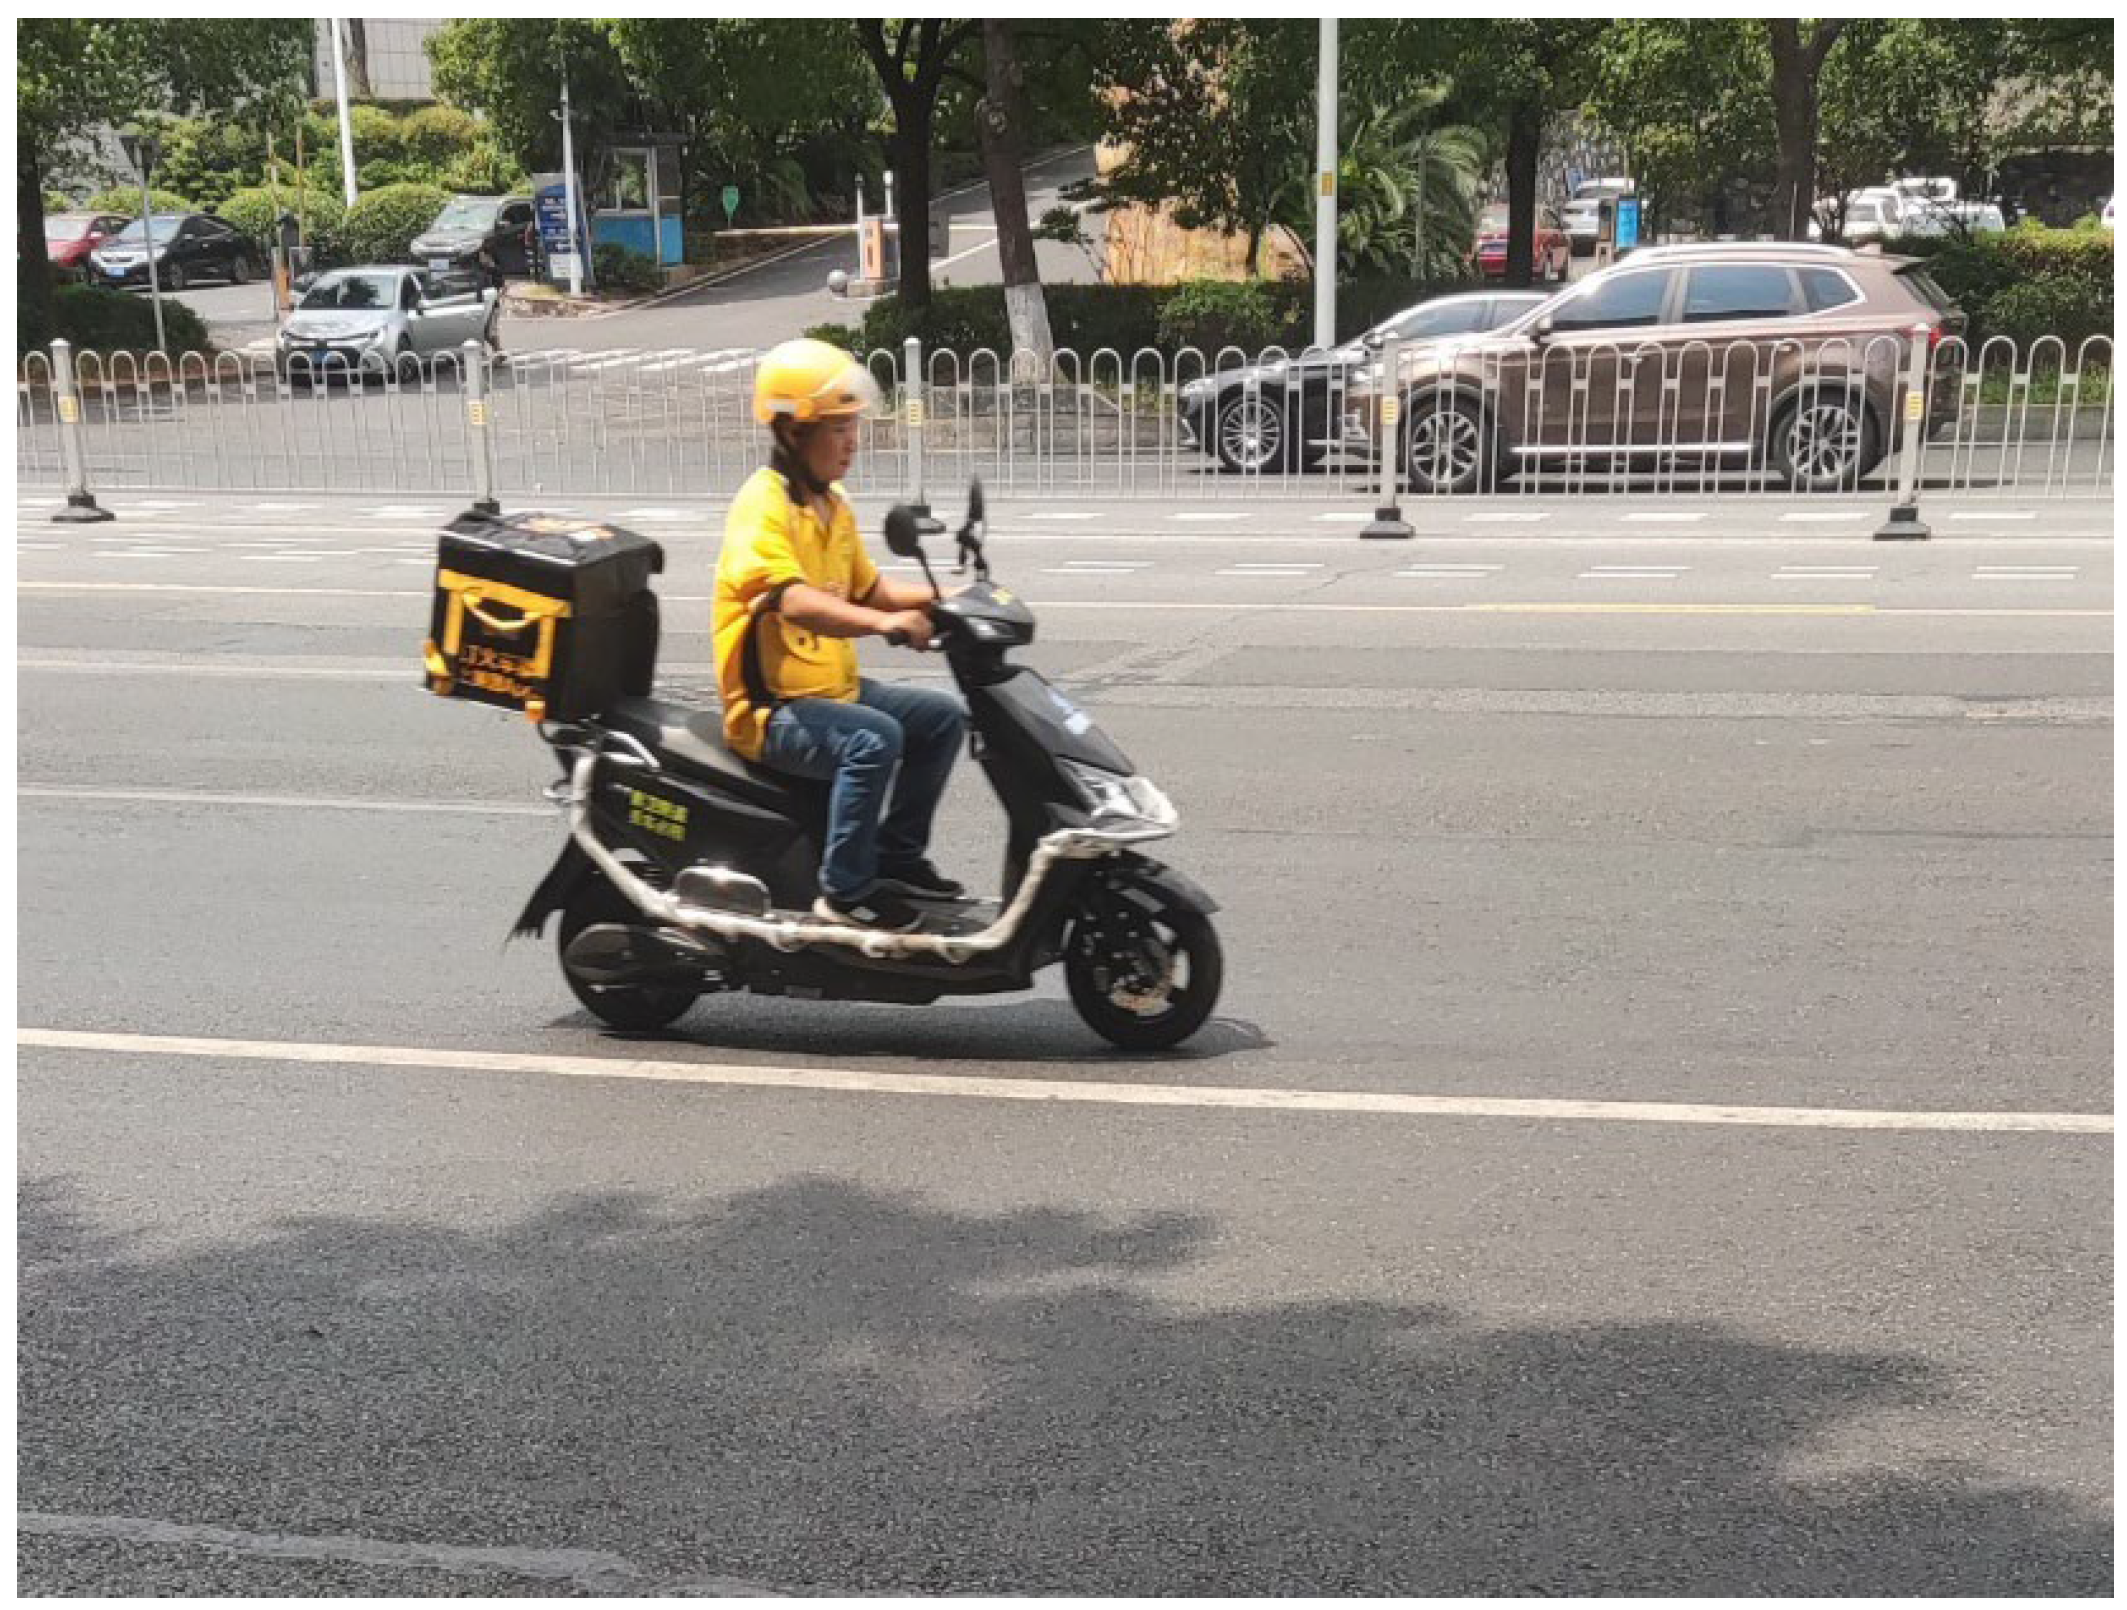
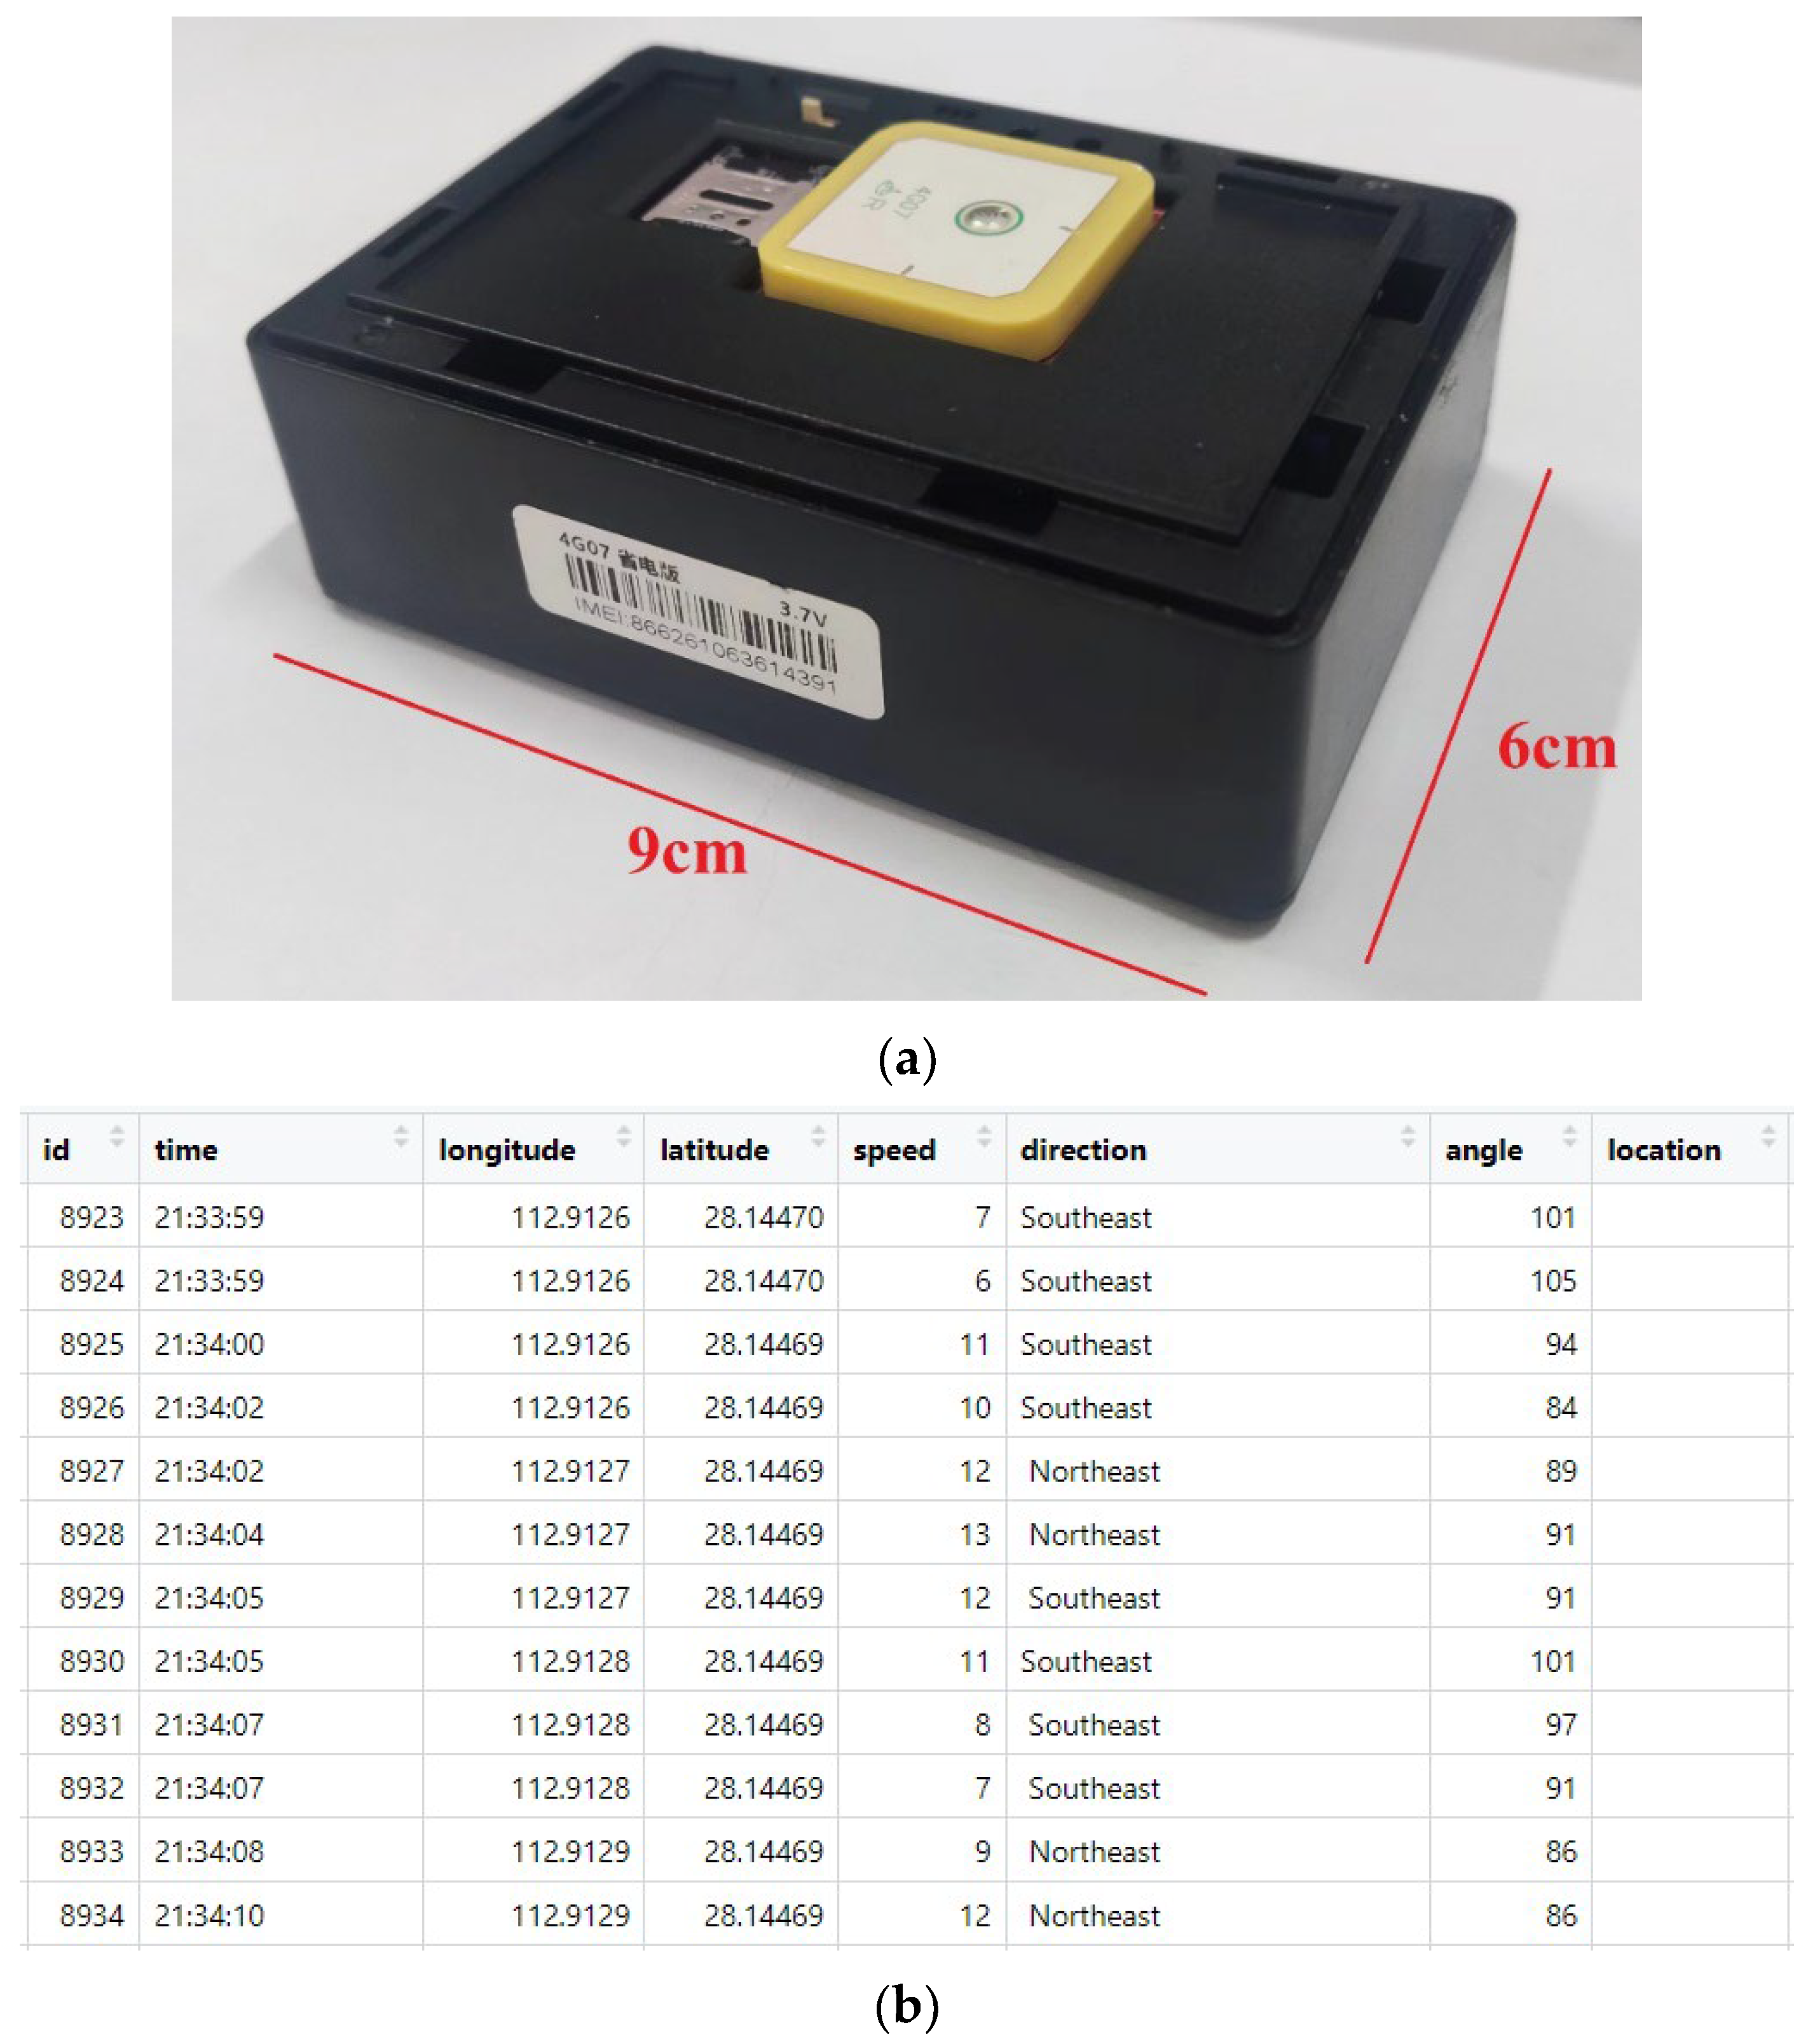
2. Data Collection
3. Questionnaire Analysis
3.1. Demographic Characteristics
3.2. Occupation Characteristics
3.3. Riding Safety Attitudes
4. Riding Characteristics Analysis
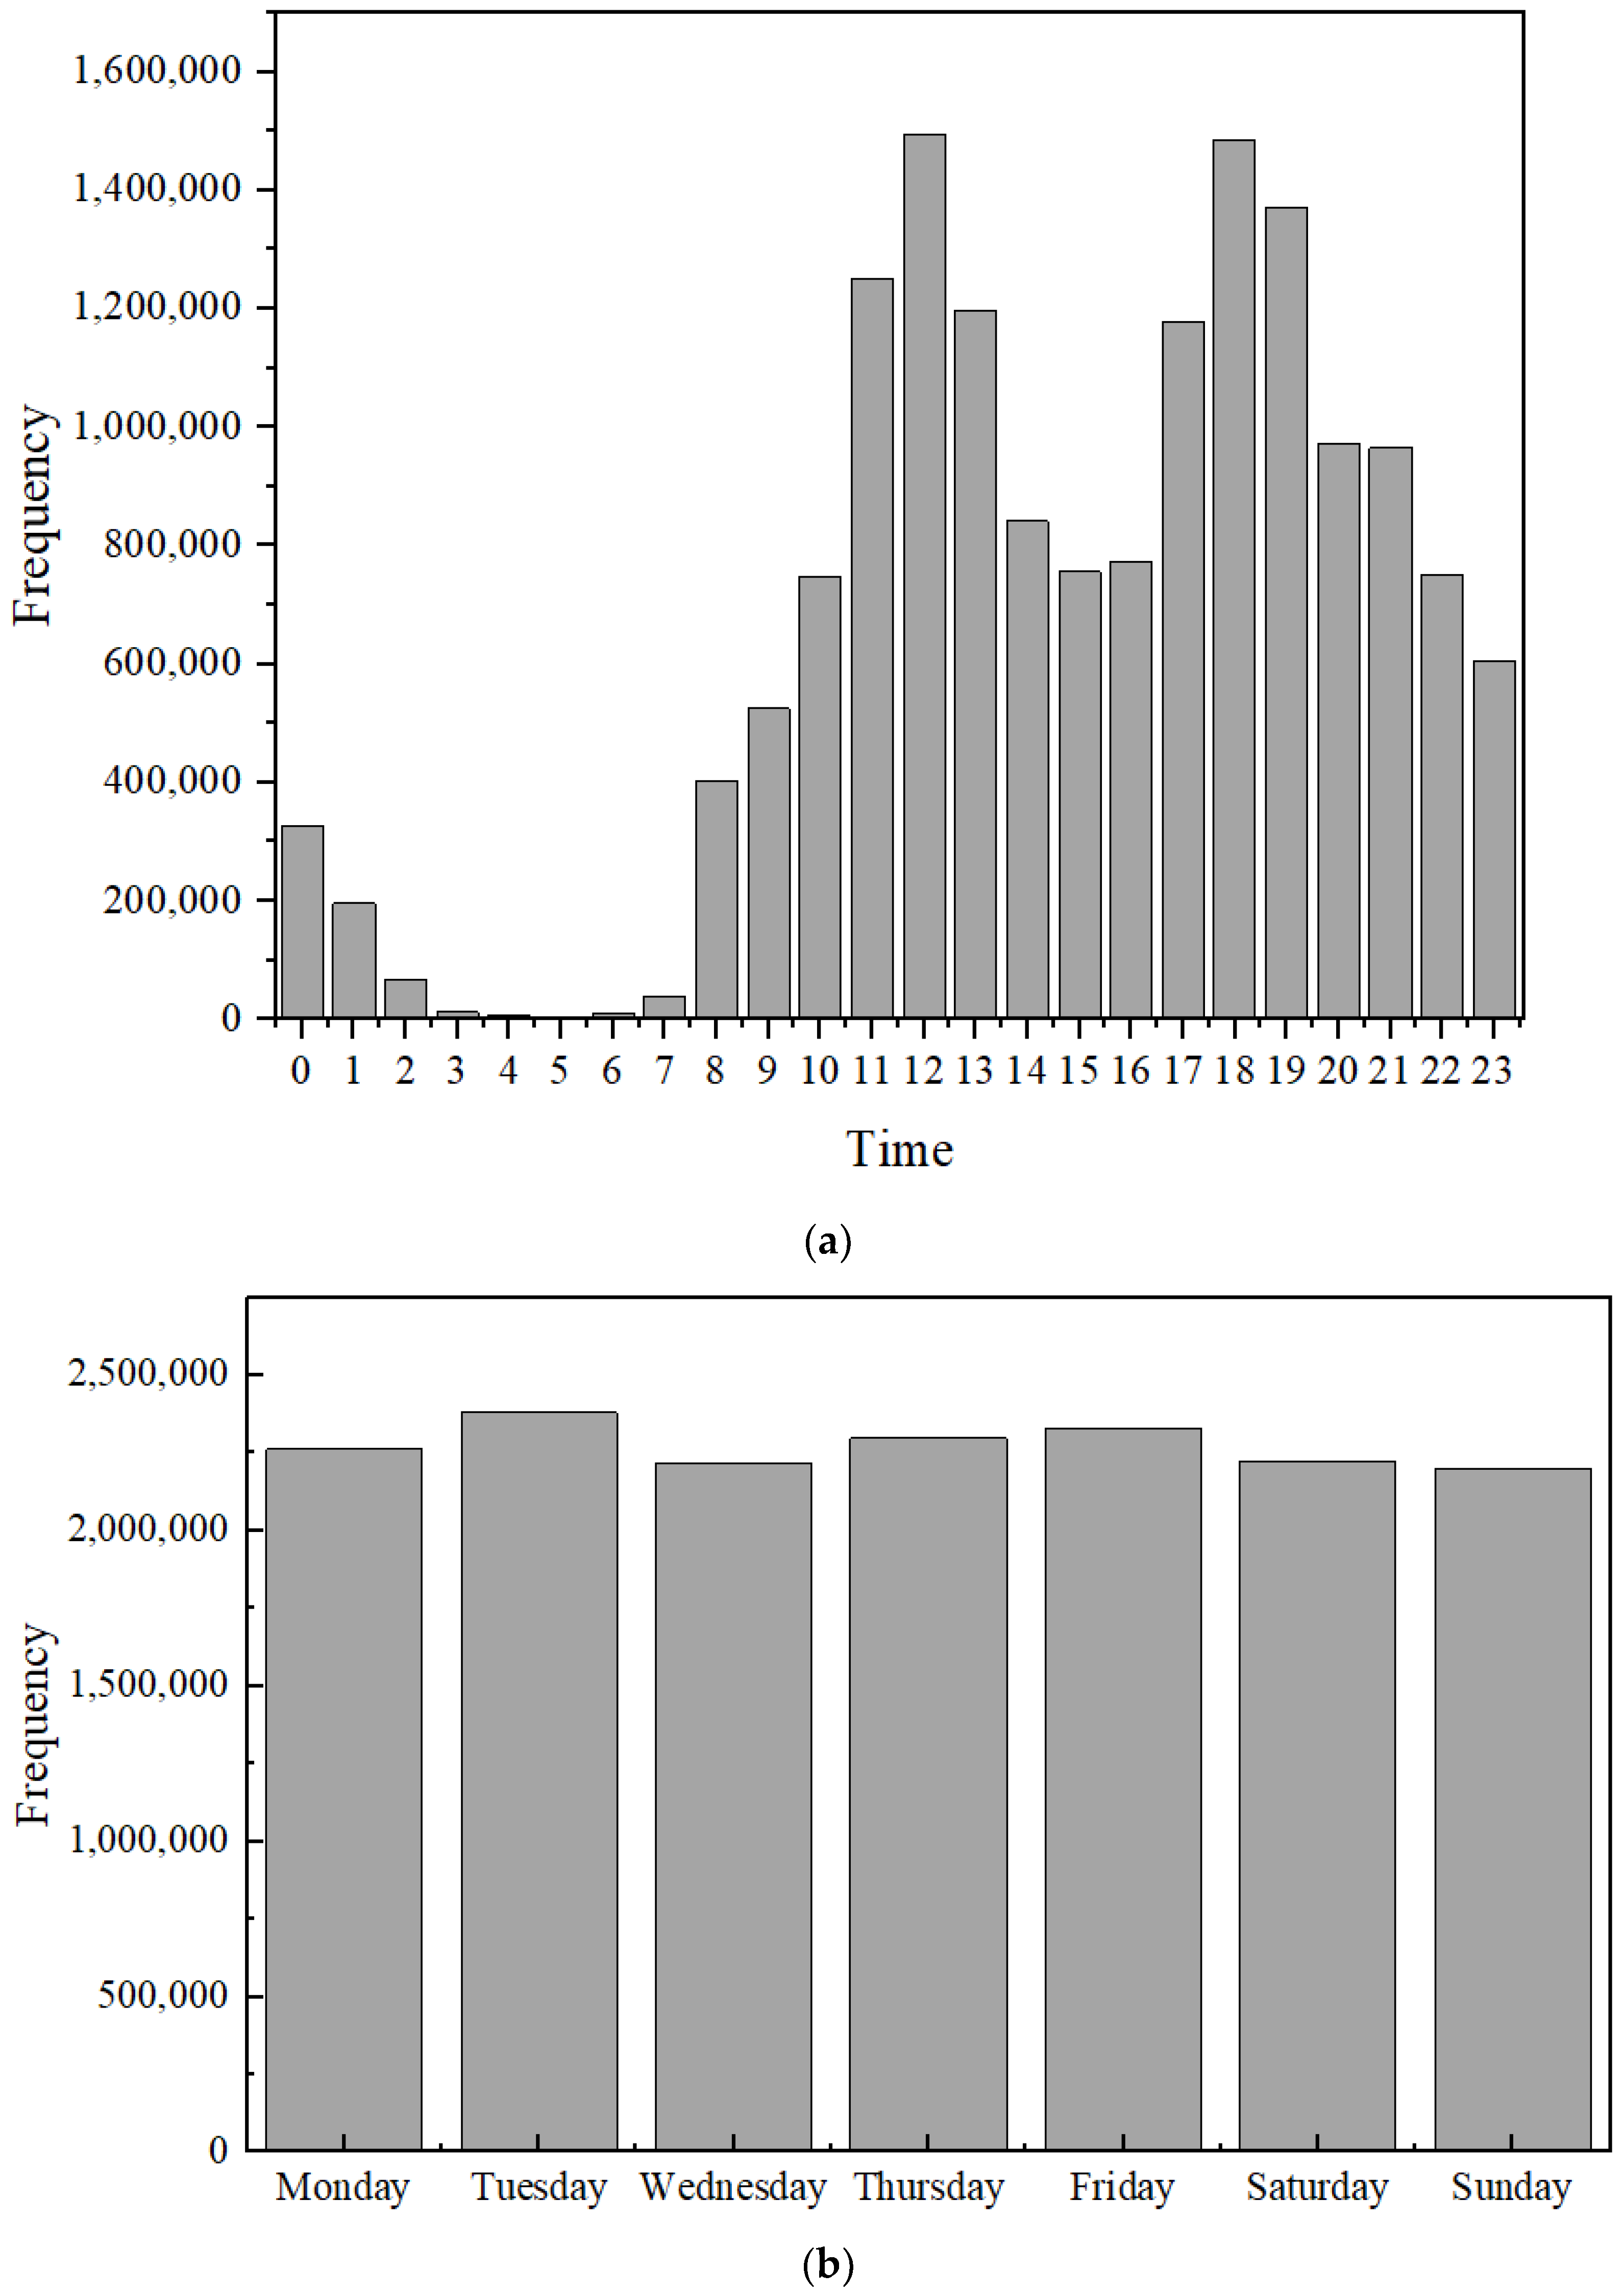
4.1. Riding Time
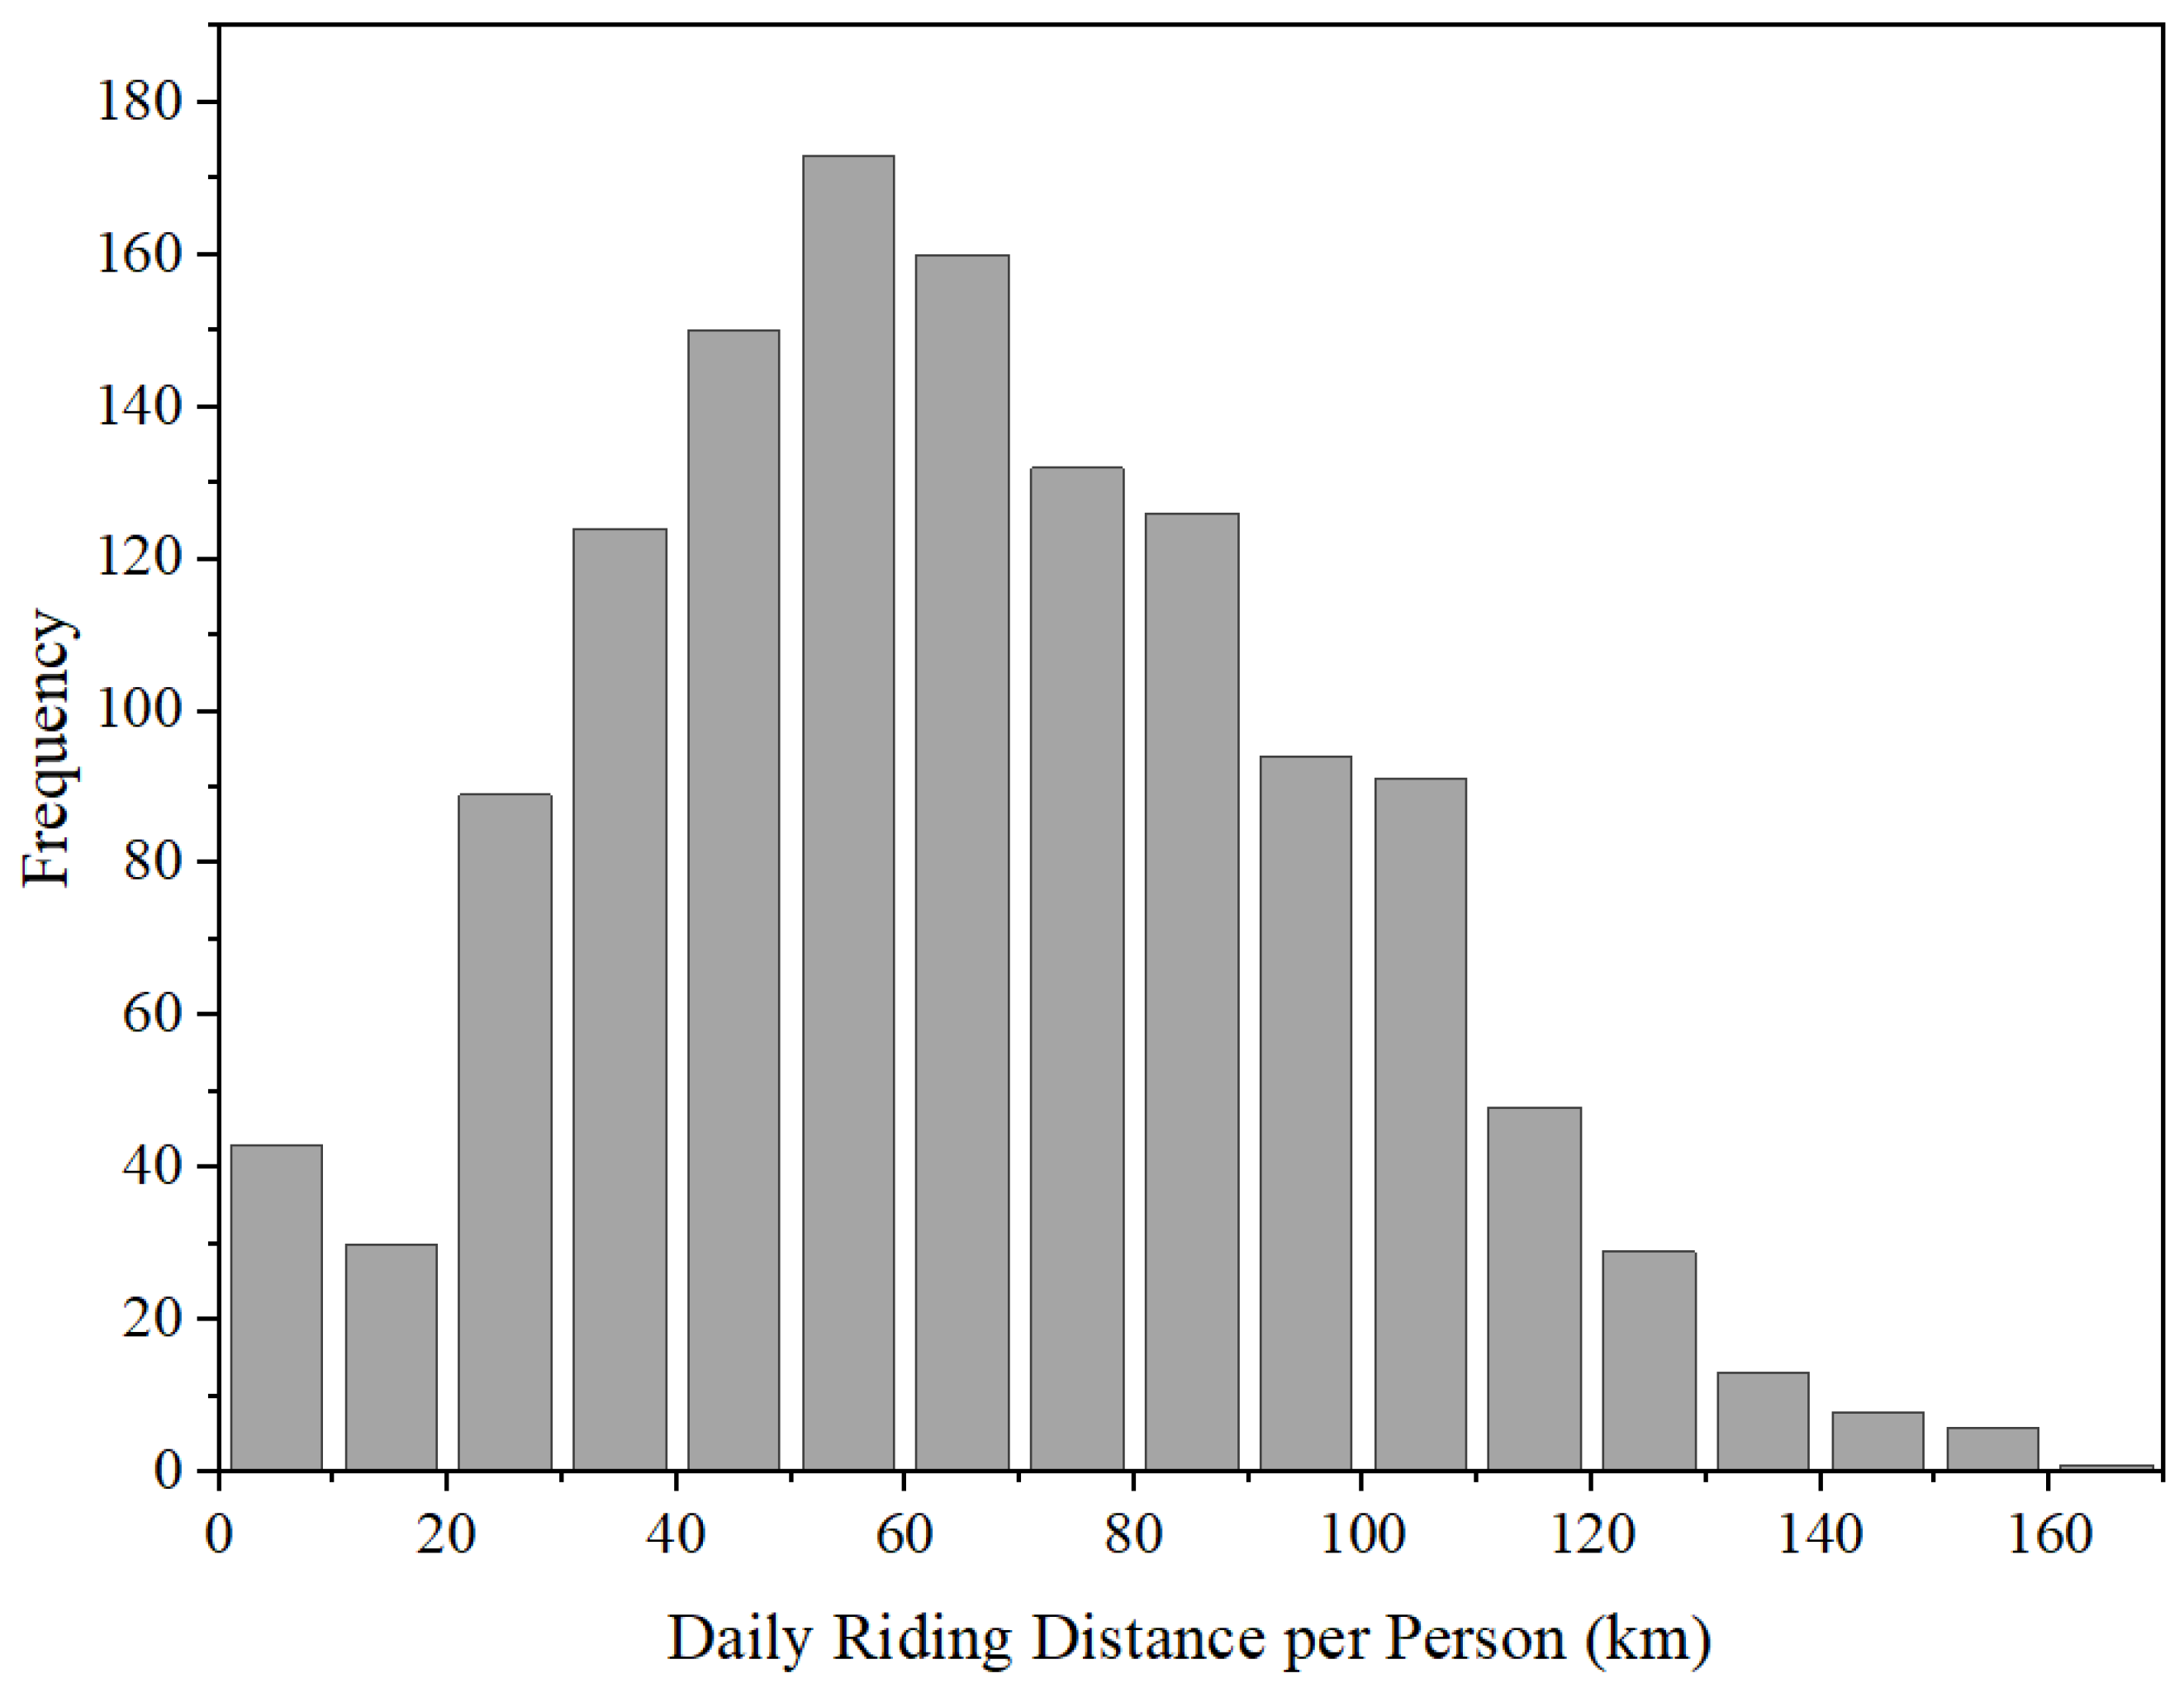
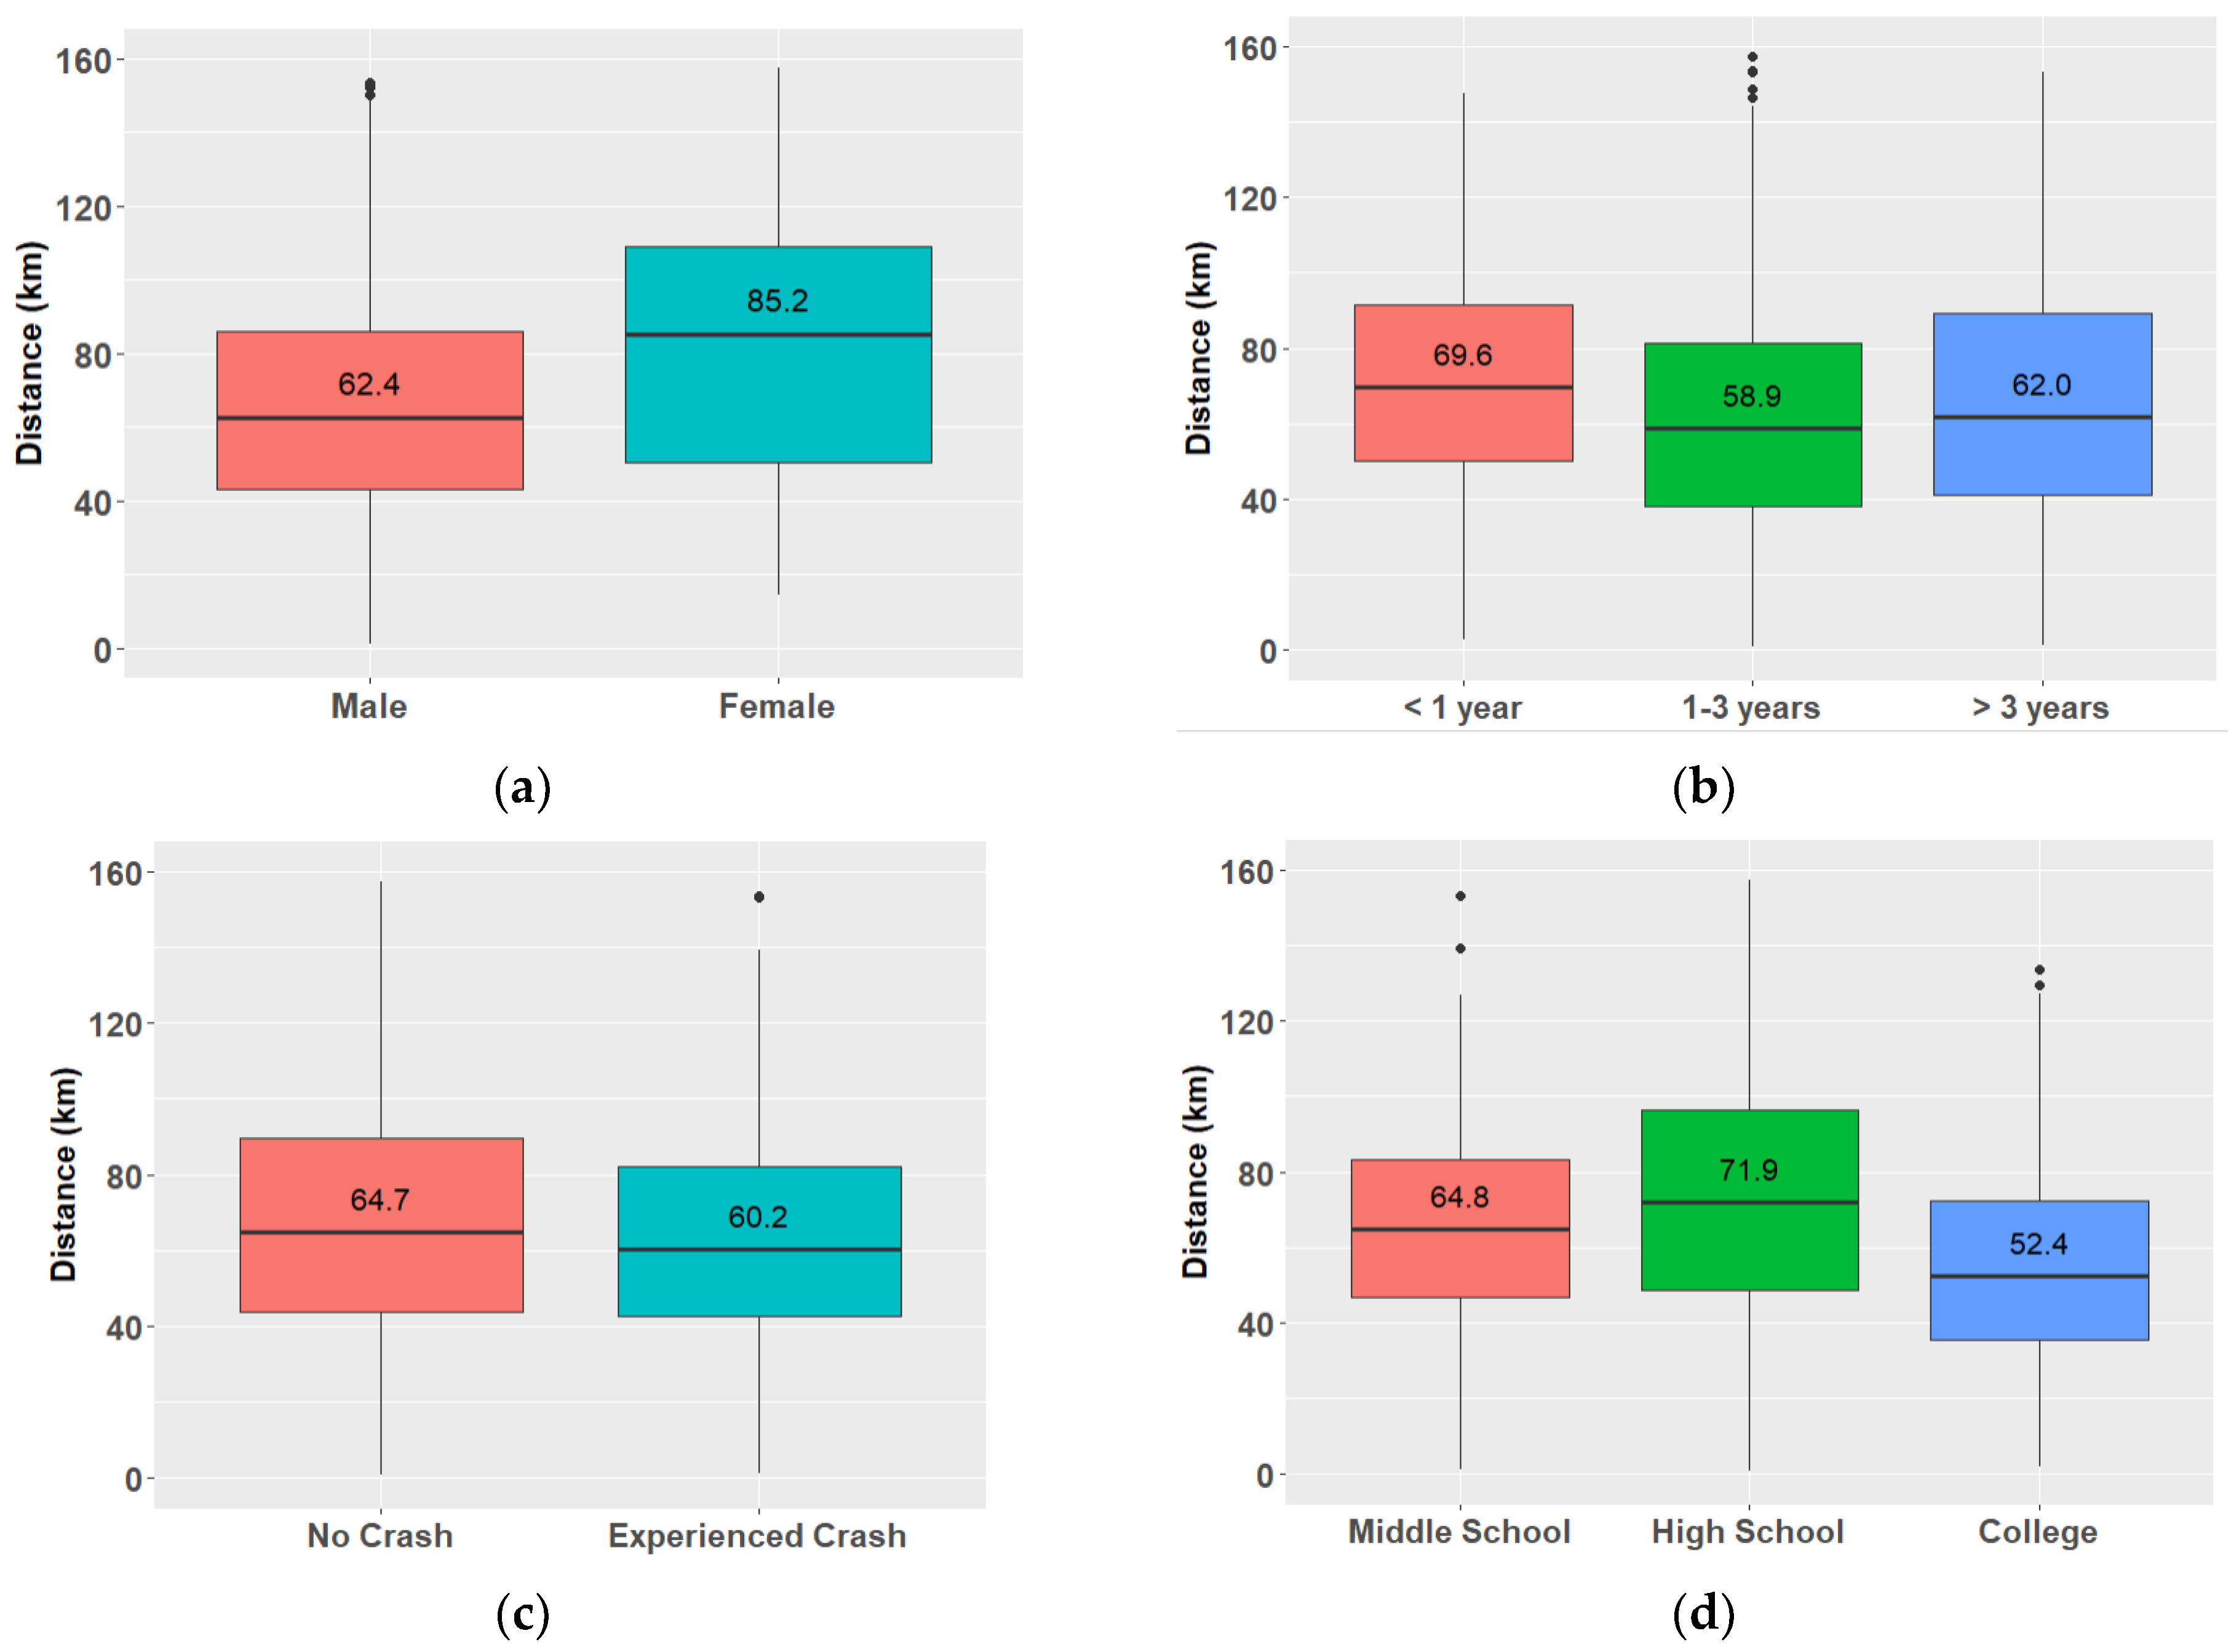
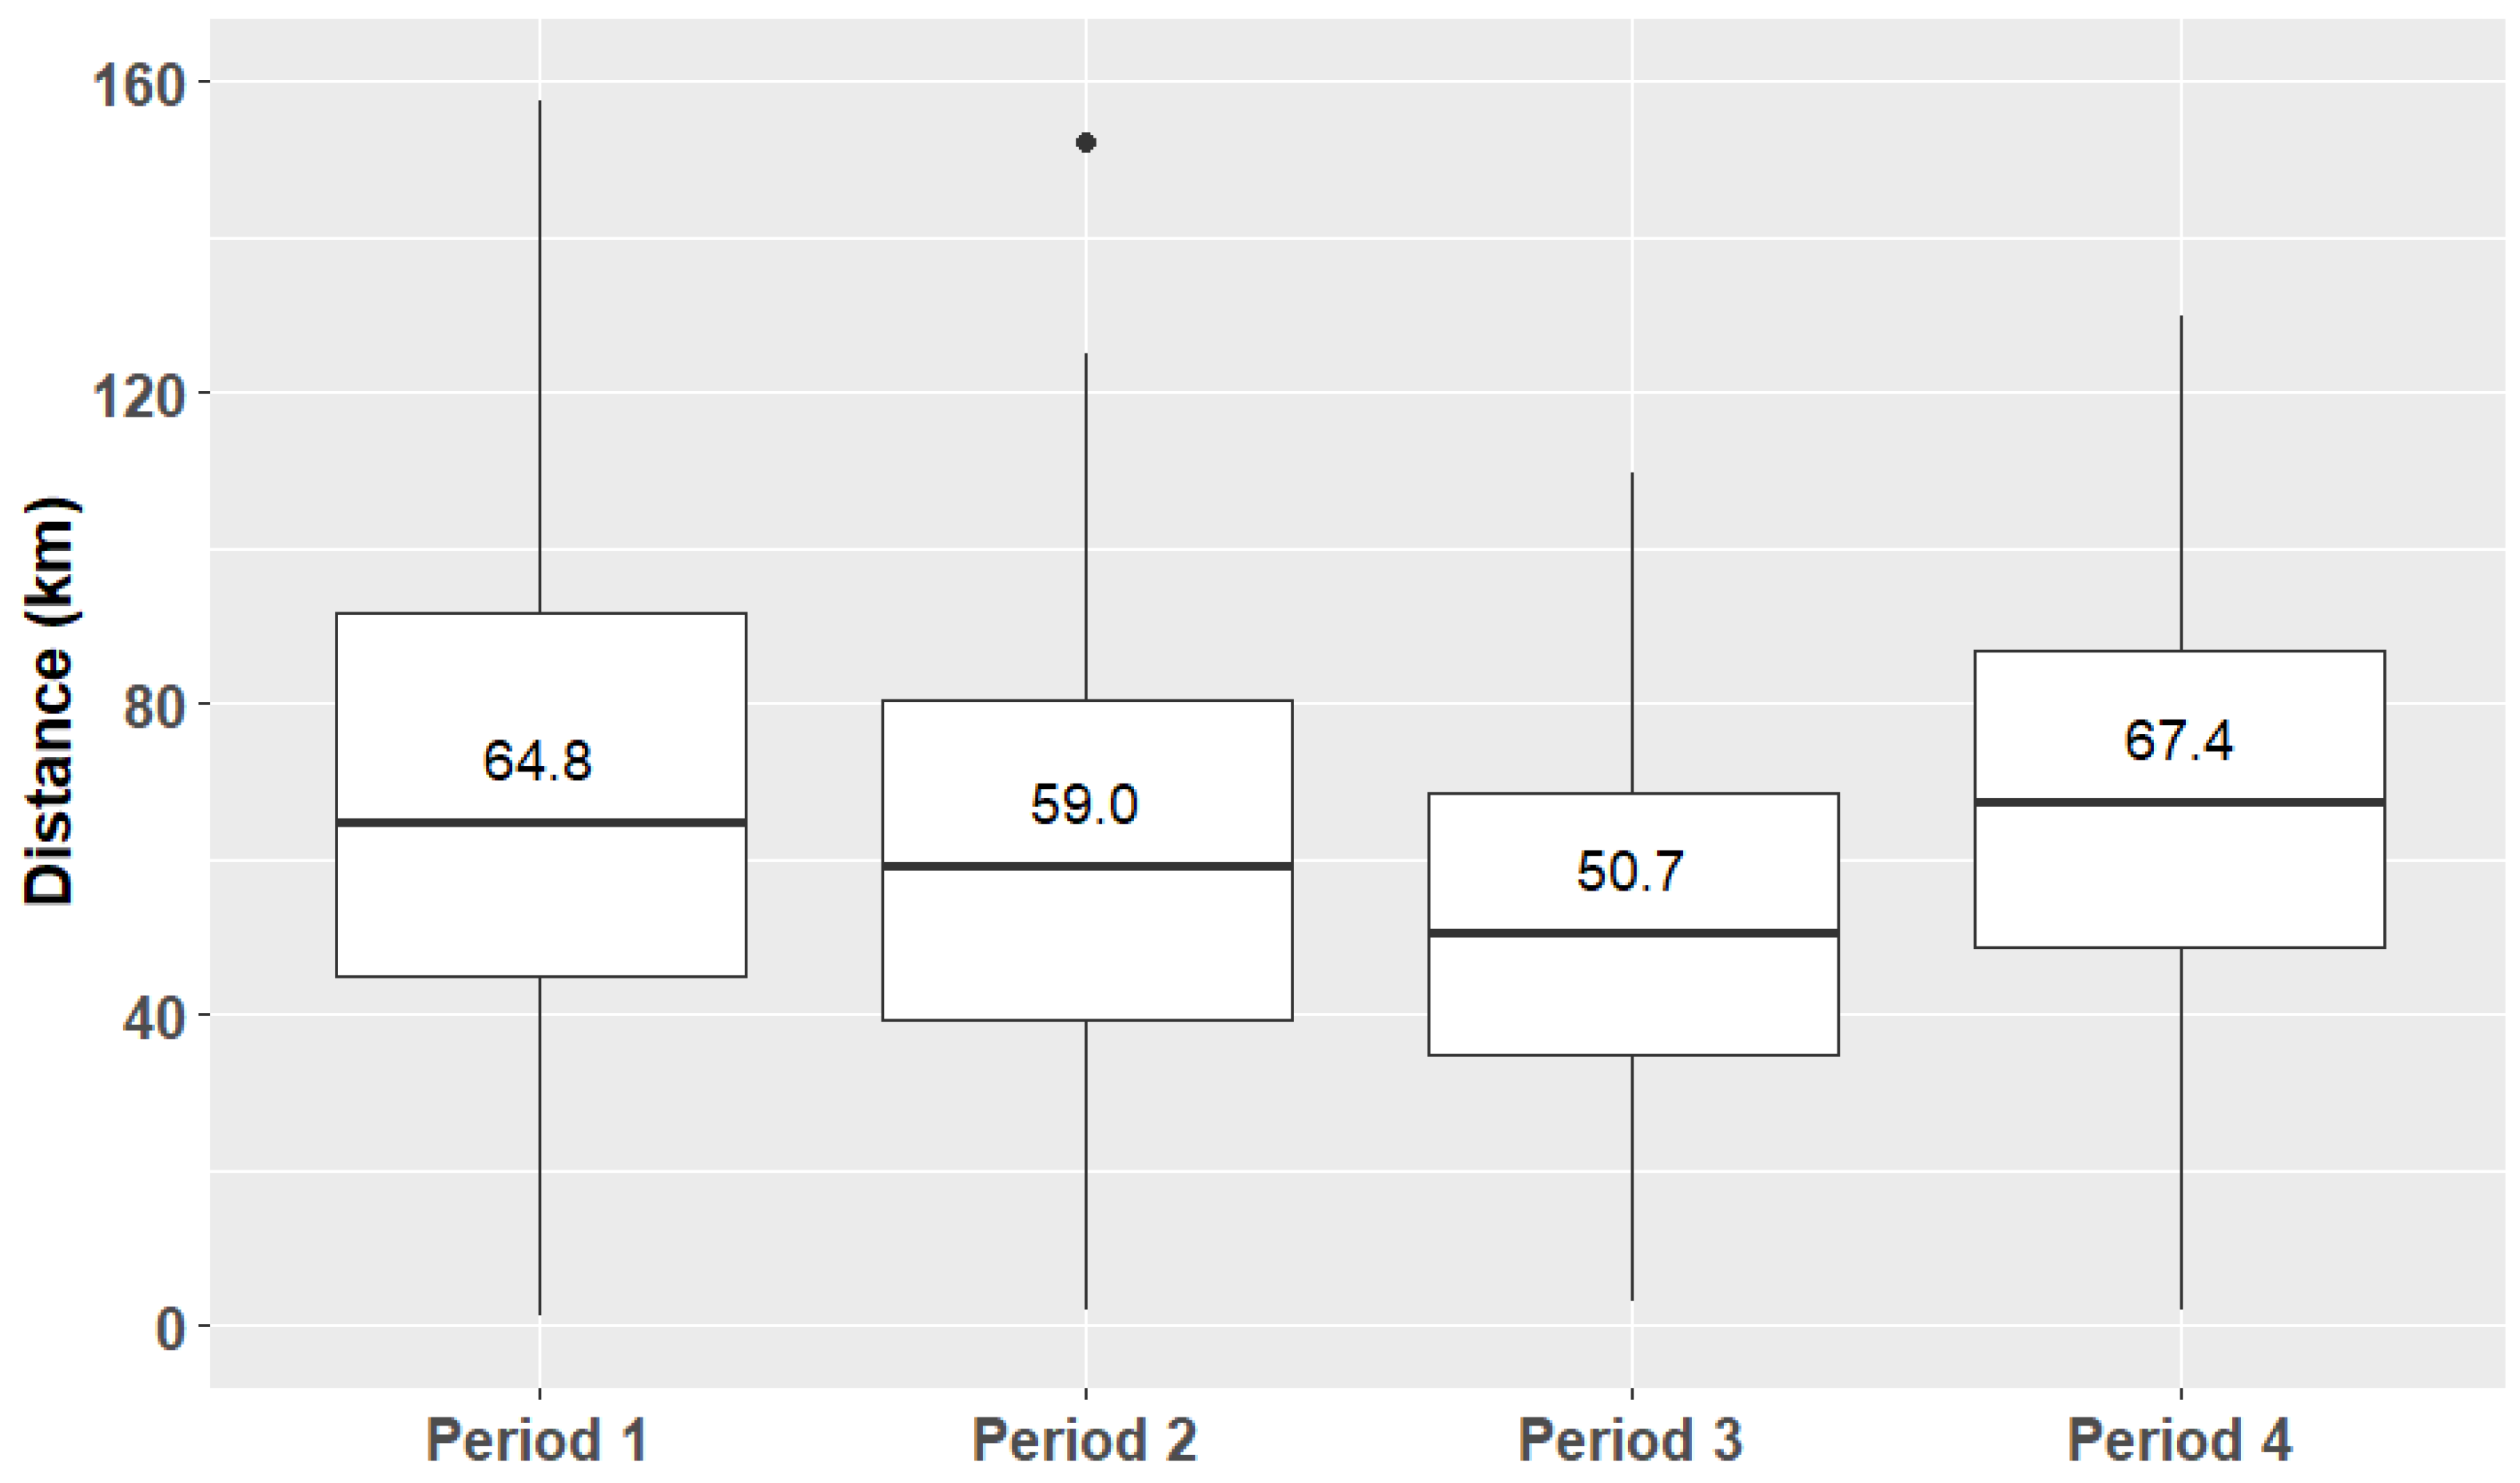
4.2. Riding Distance
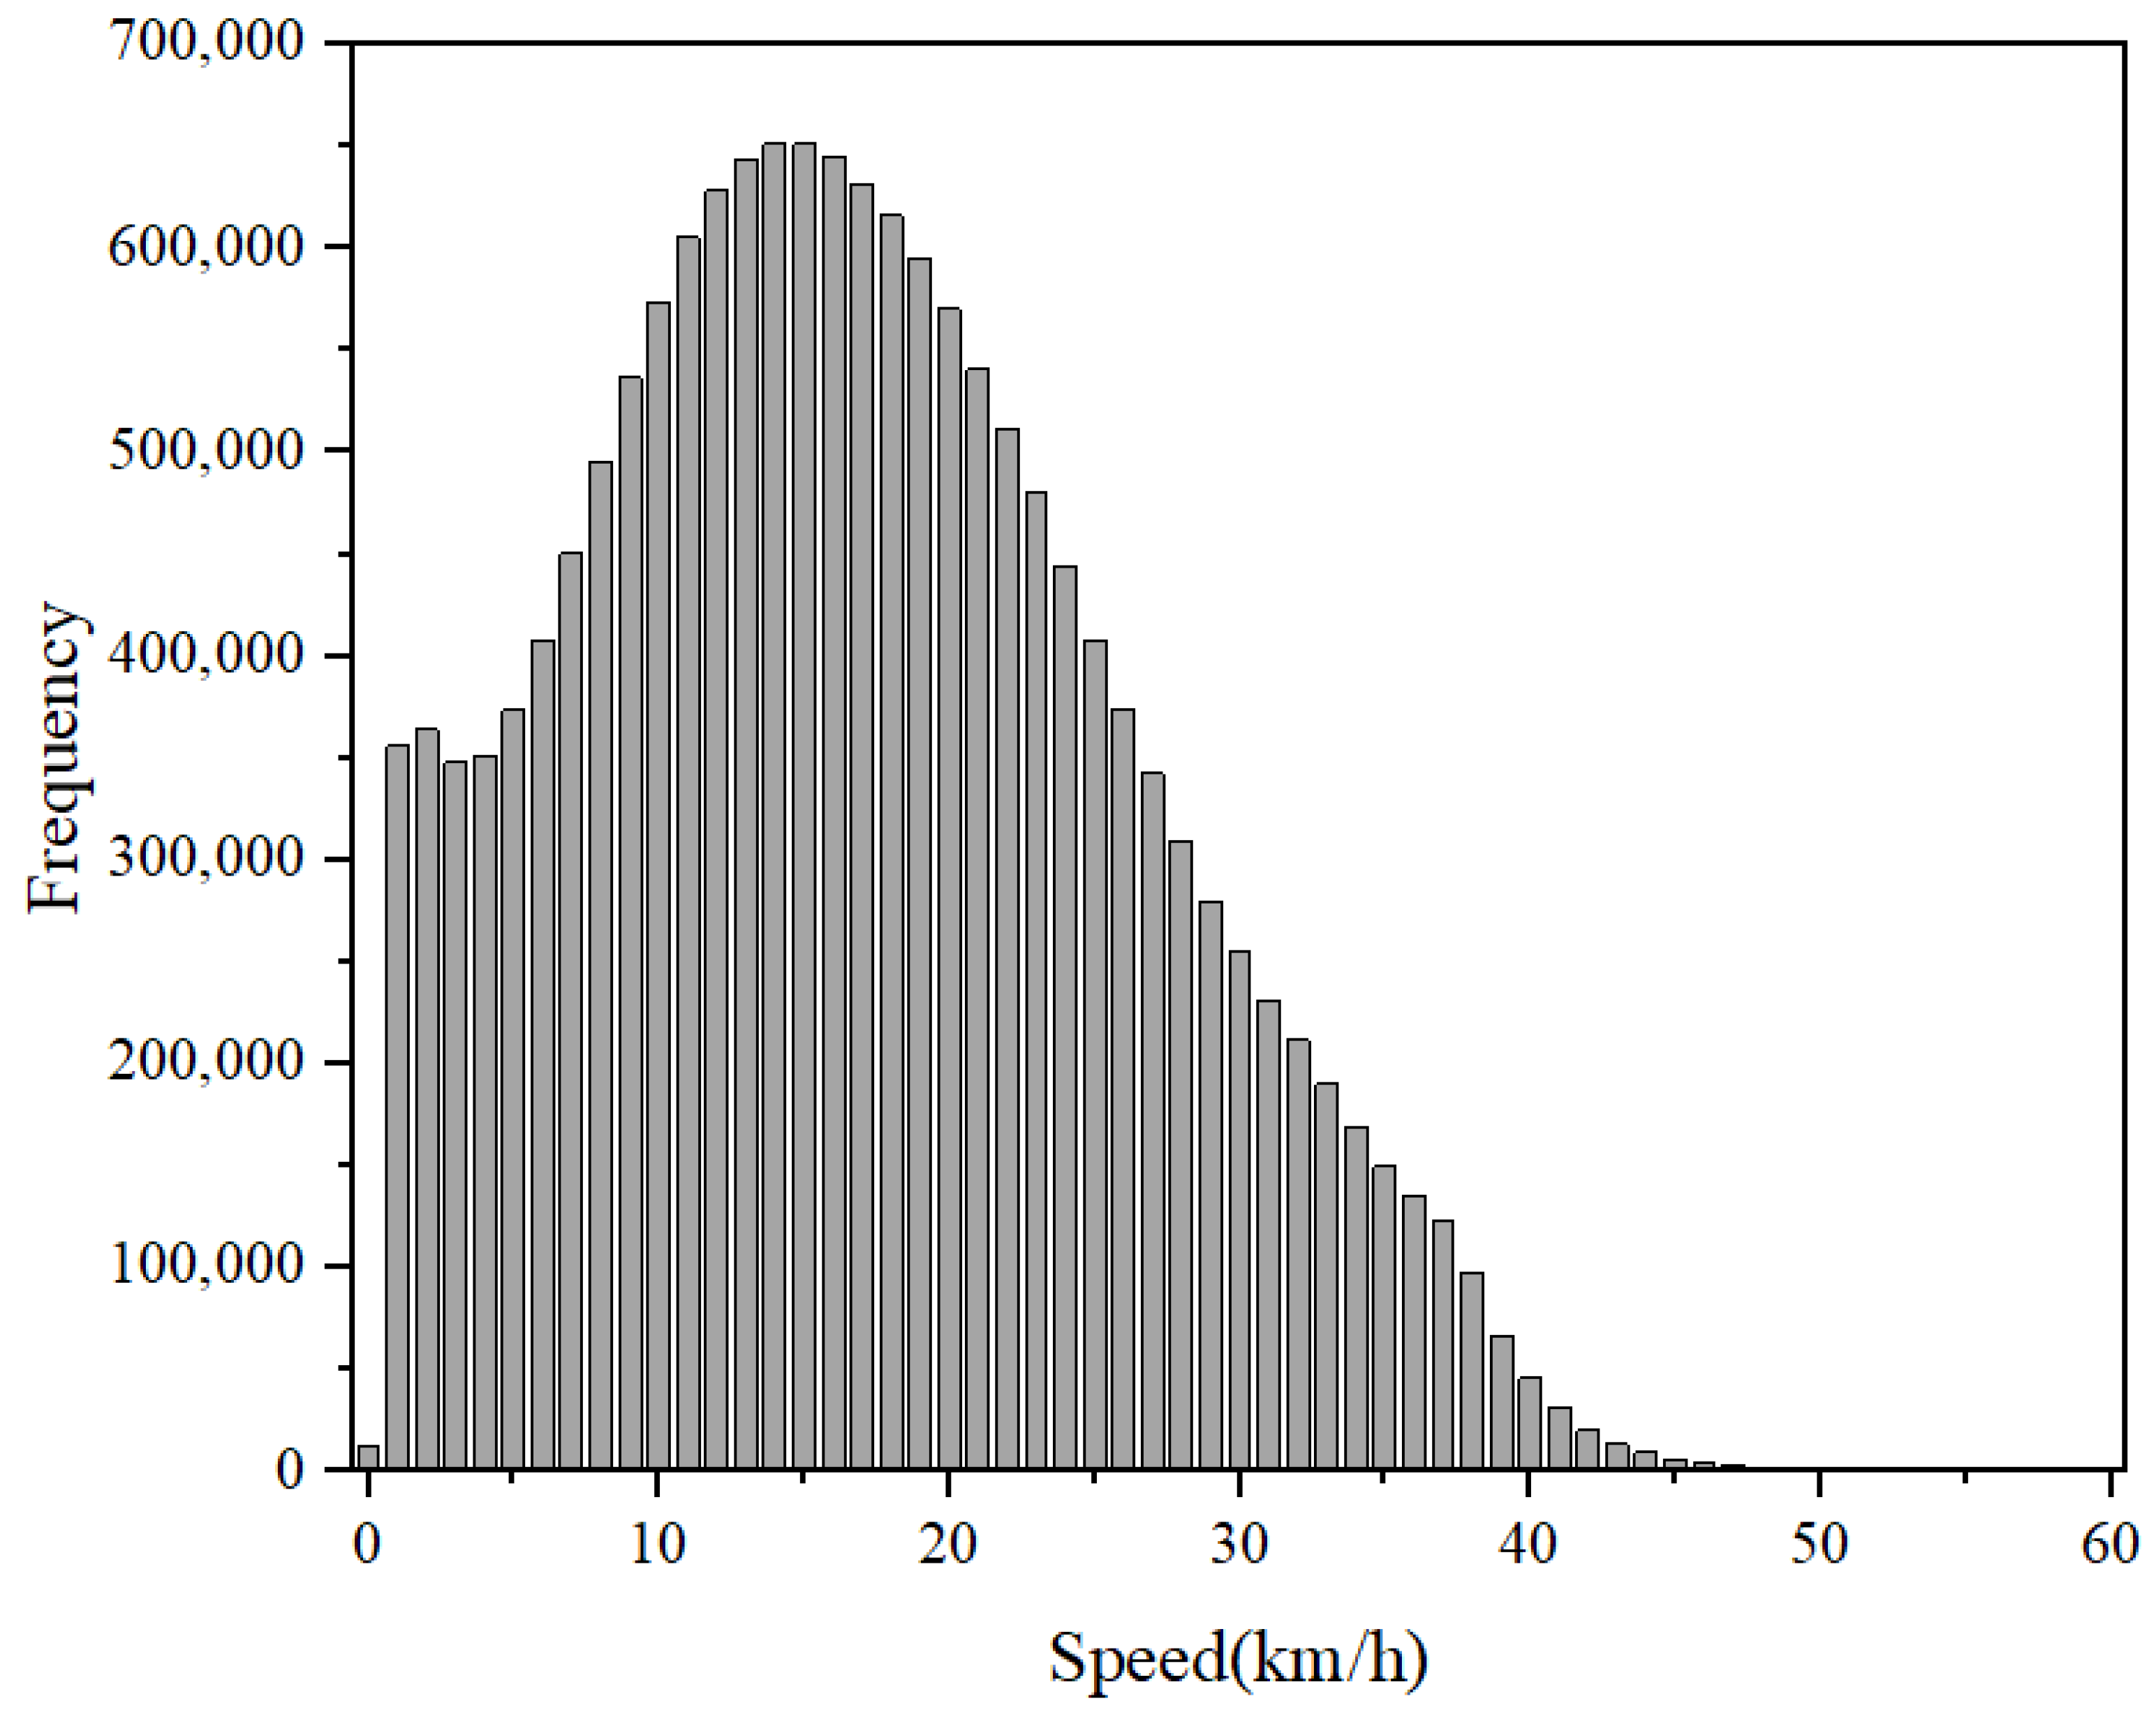
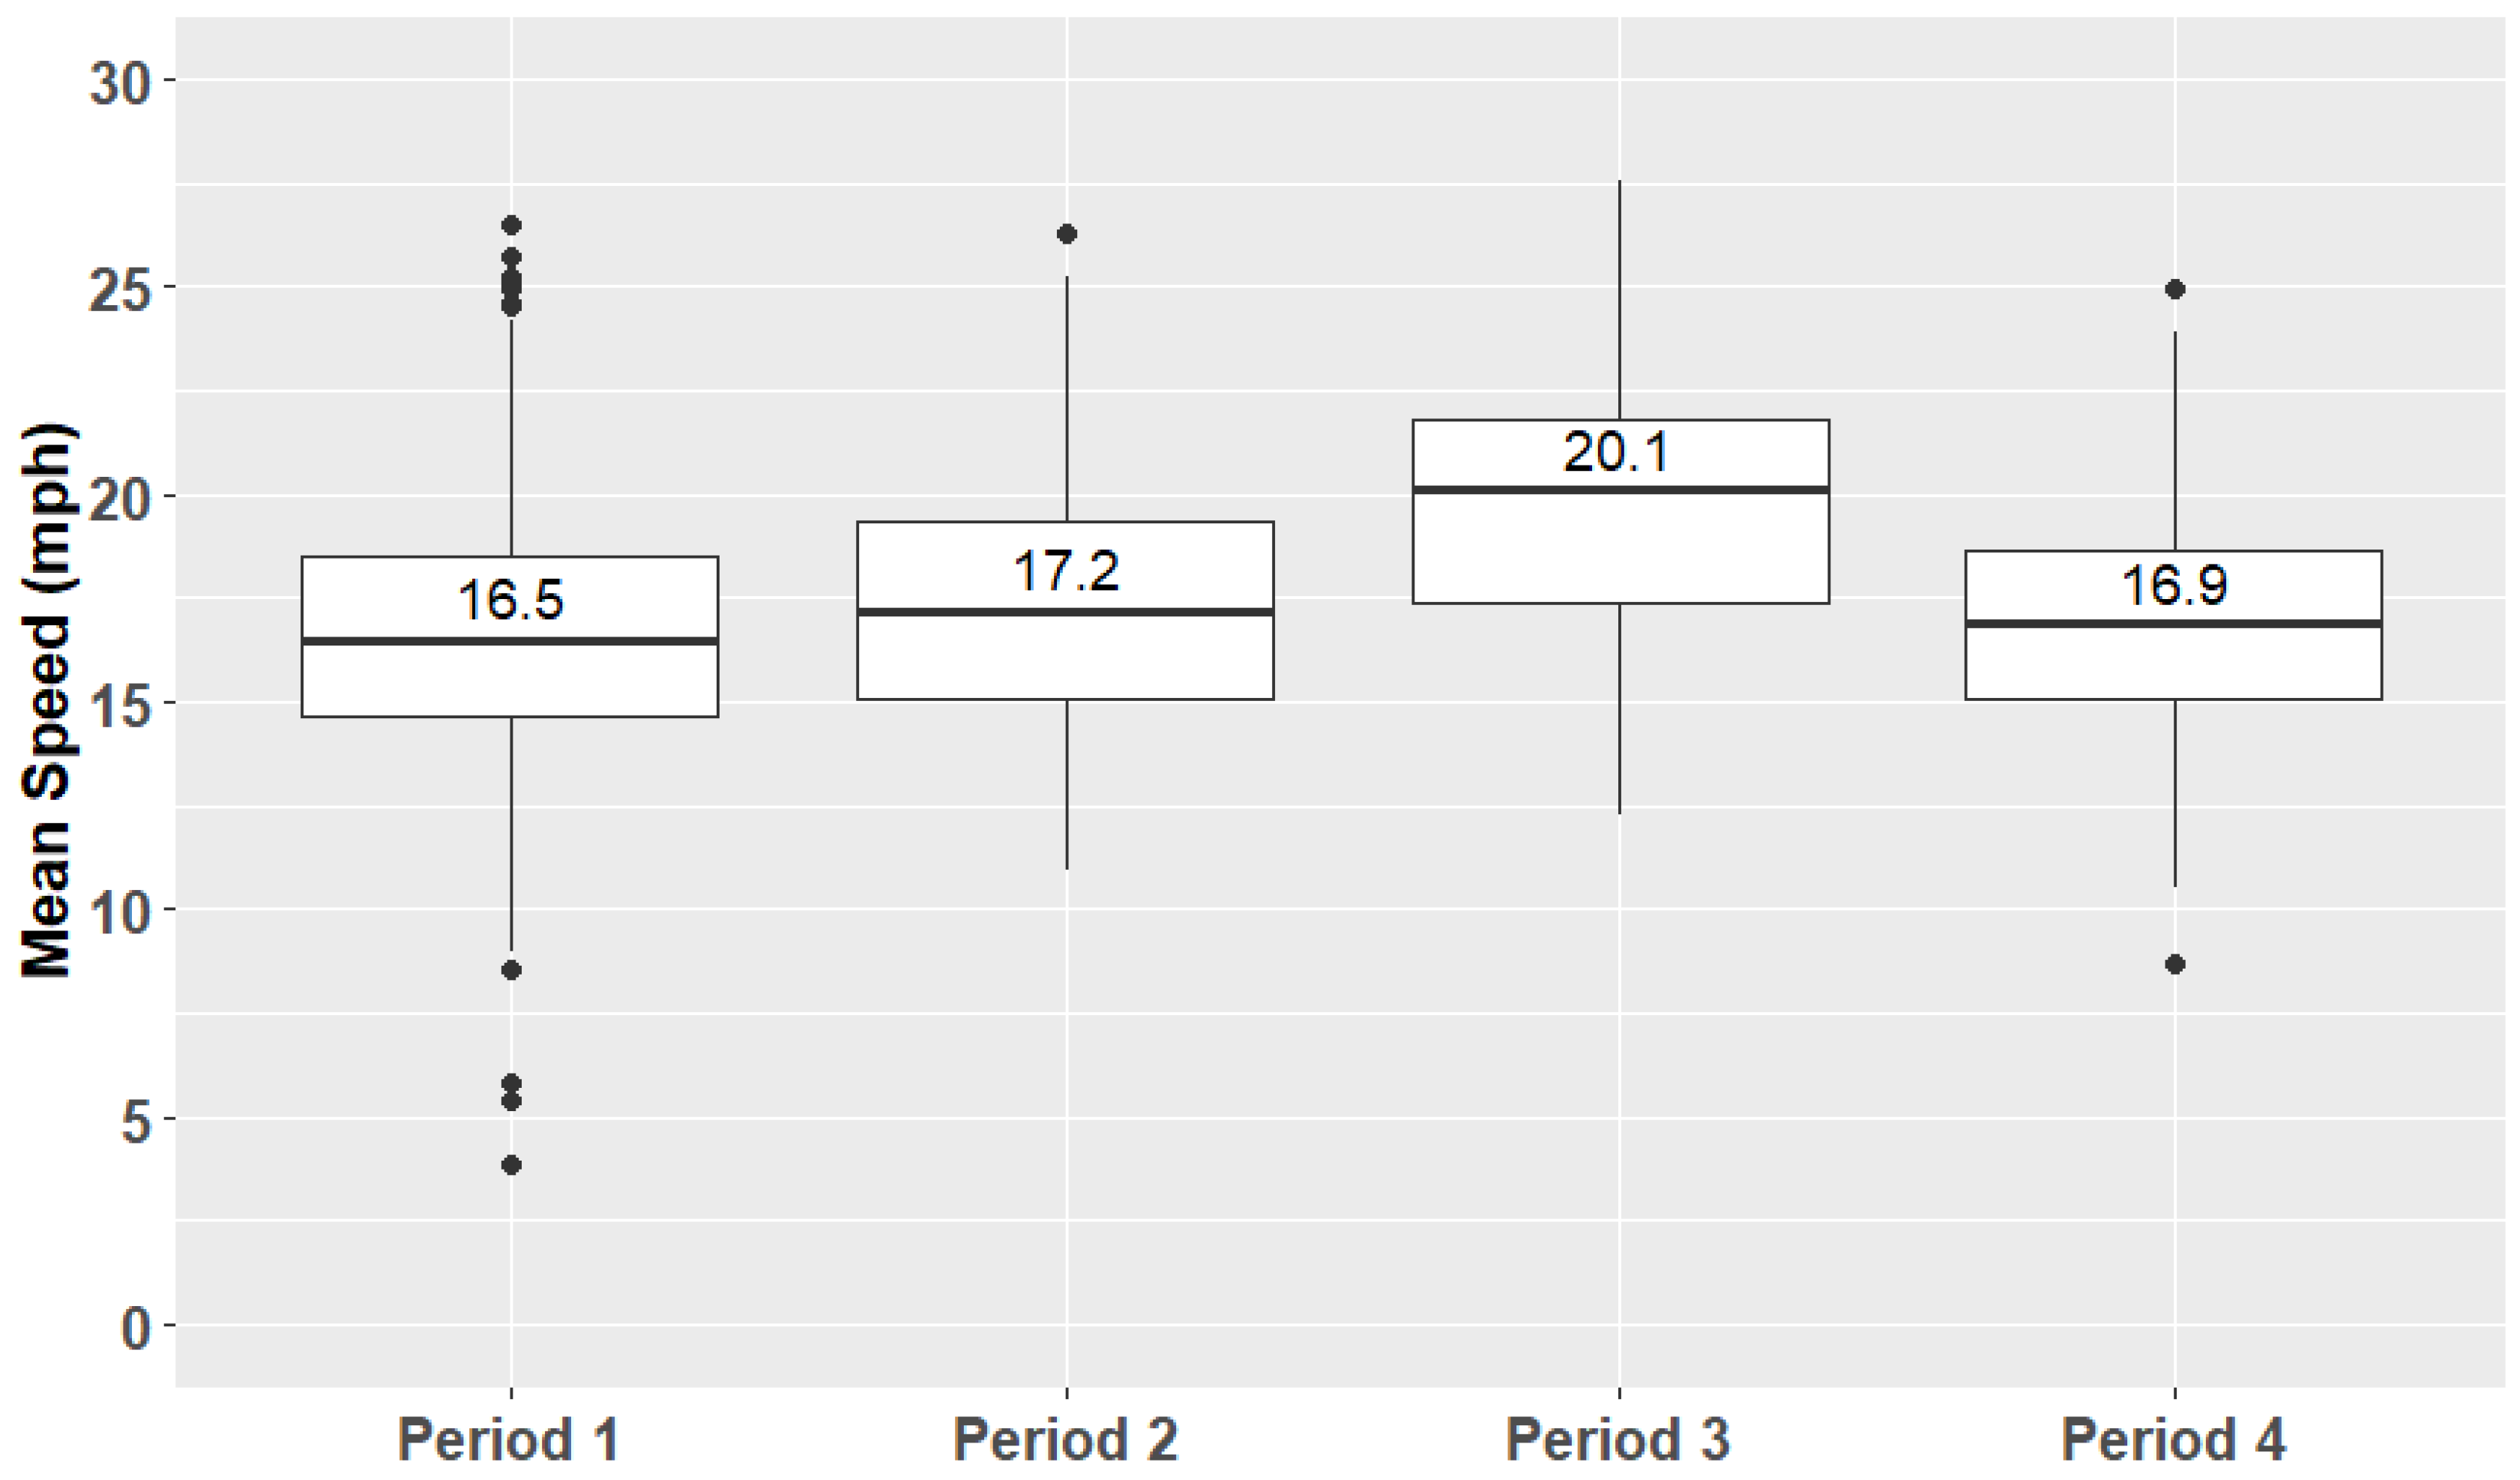
4.3. Riding Speed
5. Conclusions
Author Contributions
Funding
Institutional Review Board Statement
Informed Consent Statement
Data Availability Statement
Conflicts of Interest
References
- China Internet Network Information Center. The 49th Statistical Report on Internet Development in China; China Internet Network Information Center: Beijing, China, 2022. [Google Scholar]
- Liu, M. 13 Million Delivery Riders, Transition from “Gig Work” to “Full-Time Employment”. Available online: https://www.tmtpost.com/6007454.html (accessed on 21 February 2022).
- Zheng, Y.; Ma, Y.; Guo, L.; Cheng, J.; Zhang, Y. Crash Involvement and Risky Riding Behaviors among Delivery Riders in China: The Role of Working Conditions. Transp. Res. Rec. 2019, 2673, 1011–1022. [Google Scholar] [CrossRef]
- Lu, X.W.; Guo, X.L.; Zhang, J.X.; Li, X.B.; Li, L.; Jones, S. Reducing Traffic Violations in the Online Food Delivery Industry—A Case Study in Xi’an City, China. Front. Public Health 2022, 10, 1–14. [Google Scholar] [CrossRef] [PubMed]
- Wang, Z.; Neitzel, R.L.; Zheng, W.; Wang, D.; Xue, X.; Jiang, G. Road Safety Situation of Electric Bike Riders: A Cross-Sectional Study in Courier and Take-out Food Delivery Population. Traffic Inj. Prev. 2021, 22, 564–569. [Google Scholar] [CrossRef] [PubMed]
- Lai, Y. Food Delivery Riders, Constrained by the Delivery Platforms’ System. Available online: https://baijiahao.baidu.com/s?id=1677231323622016633&wfr=spider&for=pc (accessed on 13 August 2022).
- Wei, Y.; Qin, H. Study on Risk Behavior of Take-Away Electric Bicycles at Intersection. J. Beijing Univ. Civ. Eng. Archit. 2021, 37, 25–30. [Google Scholar]
- Wang, X.; Chen, J.; Quddus, M.; Zhou, W.; Shen, M. Influence of Familiarity with Traffic Regulations on Delivery Riders’ e-Bike Crashes and Helmet Use: Two Mediator Ordered Logit Models. Accid. Anal. Prev. 2021, 159, 106277. [Google Scholar] [CrossRef] [PubMed]
- Gao, X.; Zhao, J.; Gao, H. Red-Light Running Behavior of Delivery-Service E-Cyclists Based on Survival Analysis. Traffic Inj. Prev. 2020, 21, 558–562. [Google Scholar] [CrossRef] [PubMed]
- Liu, K.; Jiang, K. A Study of the Characteristics of Typical Risk Riding Behaviors of Takeaway Deliverers. Technol. Econ. Areas Commun. 2021, 23, 1–6. [Google Scholar]
- Dong, H.; Zhong, S.; Xu, S.; Tian, J.; Feng, Z. The Relationships between Traffic Enforcement, Personal Norms and Aggressive Driving Behaviors among Normal e-Bike Riders and Food Delivery e-Bike Riders. Transp. Policy 2021, 114, 138–146. [Google Scholar] [CrossRef]
- Wu, G.; Huang, C.; He, D. Exploration of Social Psychological Factors Leading to 2 Distracted E-Bike Riding among Delivery Workers in China. Transp. Res. Rec. J. Transp. Res. Board 2023. onlineFirst. [Google Scholar] [CrossRef]
- Singh, H.; Kathuria, A. Analyzing Driver Behavior under Naturalistic Driving Conditions: A Review. Accid. Anal. Prev. 2021, 150, 105908. [Google Scholar] [CrossRef]
- Kenneth, L. Campbell. The SHRP 2 Naturalistic Driving Study: Addressing Driver Performance and Behavior in Traffic Safety. TR News 2012, 282, 30–35. [Google Scholar]
- Wang, X.; Zhu, M.; Xing, Y. Impacts of Collision Warning System on Car-Following Behavior Based on Naturalistic Driving Data. J. Tongji Univ. (Nat. Sci.) 2016, 44, 1045–1051. [Google Scholar]
- Wang, X.; Sun, P.; Zhang, X.; Zhang, K. Calibrating Car-Following Models on Freeway Based on Naturalistic Driving Data. China J. Highw. Transp. 2020, 33, 132–142. [Google Scholar]
- Ma, Y.; Yu, L.; Chen, S.; Zhang, C.; Zhang, Z.; Zhou, M. Analysis of Driving-Stability Factors for Heavy-Duty Truck Drivers Under Naturalistic Driving Conditions. China J. Highw. Transp. 2022, 35, 169–179. [Google Scholar]
- Yuan, W.; Yuan, X.; Gao, Y.; Li, K.; Zhao, D.; Liu, Z. Identification Method for Electric Bus Pedal Misoperation Based on Natural Driving Data. J. Jilin Univ. (Eng. Technol. Ed.) 2022. [Google Scholar] [CrossRef]
- Liu, C.; Zhang, W. Exploring the Stop Sign Running at All-Way Stop-Controlled Intersections with the SHRP2 Naturalistic Driving Data. J. Saf. Res. 2022, 81, 190–196. [Google Scholar] [CrossRef] [PubMed]
- Johnson, M.; Charlton, J.; Oxley, J.; Newstead, S. Naturalistic Cycling Study: Identifying Risk Factors for on-Road Commuter Cyclists. Ann. Adv. Automot. Med. 2010, 54, 275–283. [Google Scholar]
- Dozza, M.; Werneke, J. Introducing Naturalistic Cycling Data: What Factors Influence Bicyclists’ Safety in the Real World? Transp. Res. Part F Traffic Psychol. Behav. 2014, 24, 83–91. [Google Scholar] [CrossRef]
- Dozza, M.; Bianchi Piccinini, G.F.; Werneke, J. Using Naturalistic Data to Assess E-Cyclist Behavior. Transp. Res. Part F Traffic Psychol. Behav. 2016, 41, 217–226. [Google Scholar] [CrossRef]
- Wang, C.; Wei, L.; Wang, K.; Tang, H.; Yang, B. Investigating the Factors Affecting Rider’s Decision on Overtaking Behavior: A Naturalistic Riding Research in China. Sustainability 2022, 14, 11495. [Google Scholar] [CrossRef]
- Zheng, Y.; Ma, Y.; Cheng, J.; Feng, Z. Automated Identification and Visualization of Conflict Events in Bike Lanes Using Trajectory Data. China J. Highw. Transp. 2022, 35, 71–84. [Google Scholar]
- Bian, Y.; Yang, J.; Zhao, X.; Zhang, X.; HAN, T. Research on Influencing Factors of Reverse Riding Risk Behavior of Shared E-Bike Based on Trajectory Data. China J. Highw. Transp. 2021, 34, 262–275. [Google Scholar]
- China Statistics Press. China Population Census Yearbook 2020. Available online: http://www.stats.gov.cn/sj/pcsj/rkpc/7rp/zk/indexch.htm (accessed on 3 November 2023).
- NBS Survey Office in Hunan. The Per Capita Disposable Income and Consumption Expenditure of Residents in Changsha in 2022 (Quarterly). Available online: http://hnzd.stats.gov.cn/dcsj/sjfb/cs/zxfb/202205/t20220521_207500.html (accessed on 10 November 2023).
- Chen, T.; Tian, D.; Deng, P.; Zhou, E.; Huang, J. Study on Instant Delivery Service Riders’ Safety and Health by the Effects of Labour Intensity in China: A Mediation Analysis. Front. Public Health 2022, 10, 907474. [Google Scholar] [CrossRef]
- Wang, Y.; Wang, H.; Xu, H. Understanding the Experience and Meaning of App-Based Food Delivery from a Mobility Perspective. Int. J. Hosp. Manag. 2021, 99, 103070. [Google Scholar] [CrossRef]
- Wang, H.; Yang, W. Optimization Design of Electric Bicycles for Food Delivery. Decoration 2021, 06, 34. [Google Scholar] [CrossRef]
- Stimpson, J.P.; Zhu, H.; Wilson, F.A. Bicyclists Found at Fault for Bicycle Crashes in California. Am. J. Emerg. Med. 2016, 34, 1699–1701. [Google Scholar] [CrossRef] [PubMed]
- Zhang, F.; Kuai, C.; Lv, H.; Li, W. Investigating Different Types of Red-Light Running Behaviors among Urban e-Bike Rider Mixed Groups. J. Adv. Transp. 2021, 2021, 1977388. [Google Scholar] [CrossRef]
- Zhang, F.; Ji, Y.; Lv, H.; Ma, X. Analysis of Factors Influencing Delivery E-Bikes’ Red-Light Running Behavior: A Correlated Mixed Binary Logit Approach. Accid. Anal. Prev. 2021, 152, 105977. [Google Scholar] [CrossRef]
- Cai, S.; Li, M.; Zhang, J. Emotional Design Research on Intelligent Helmets for Food Delivery Riders. MingRiFengShang 2021, 24, 98–100. [Google Scholar]
- Ye, X.; Hu, Y.; Liu, L.; Wang, T.; Yan, X.; Chen, J. Analyzing Takeaway E-Bikers’ Risky Riding Behaviors and Formation Mechanism at Urban Intersections with the Structural Equation Model. Sustainability 2023, 15, 13094. [Google Scholar] [CrossRef]
- Zhang, W.; Zhou, C.; Huang, W.; Tao, H.; Wang, K.; Feng, Z.; Hu, Z. Investigating Factors Affecting Riders’ Behaviors of Occupying Motorized Vehicle Lanes on Urban Streets. Accid. Anal. Prev. 2019, 122, 127–133. [Google Scholar] [CrossRef]
- Qian, Q.; Shi, J. Comparison of Injury Severity between E-Bikes-Related and Other Two-Wheelers-Related Accidents: Based on an Accident Dataset. Accid. Anal. Prev. 2023, 190, 107189. [Google Scholar] [CrossRef]
- Zhou, Z.; Wang, J.B.; He, C.; Fang, X.L.; Xiong, D.; Wei, M.M. The Relationship between Non-Motor Vehicle Lane’s Utilization and Width and Other Factors. Adv. Transp. 2014, 505–506 Pts 1 and 2, 827–831. [Google Scholar]
- Xiao, S.; Guo, M.; Wang, J. Research on Fast Lane Separation from Slow Lane on Non-Motor Vehicle Lane of Urban Road. J. Munic. Technol. 2022, 40, 25–28+96. [Google Scholar]


| Characteristics | Definitions | Frequency (N) | Percentage (%) |
|---|---|---|---|
| Gender | Male | 44 | 95.7% |
| Female | 2 | 4.3% | |
| Age | 18–25 | 13 | 28.3% |
| 26–35 | 26 | 56.5% | |
| 36–45 | 5 | 10.9% | |
| >45 | 2 | 4.3% | |
| Education | ≤Middle school | 11 | 23.9% |
| High school | 21 | 45.7% | |
| Junior college/Polytechnic | 12 | 26.1% | |
| Bachelor’s degree or above | 2 | 4.3% | |
| Reasons for being a rider (multiple choices) | Higher income than other jobs | 6 | 13.0% |
| Flexible working hours | 39 | 84.8% | |
| No skill requirements | 9 | 19.6% | |
| Income (RMB) | <5000 | 7 | 15.2% |
| 5000–8000 | 34 | 73.9% | |
| >8000 | 5 | 10.9% |
| Characteristics | Definitions | Frequency (N) | Percentage (%) |
|---|---|---|---|
| Length of employment | <6 months | 10 | 21.7% |
| 6–12 months | 7 | 15.2% | |
| 1–3 years | 20 | 43.5% | |
| >3 years | 9 | 19.6% | |
| Average daily working hours | 4–8 h | 5 | 10.9% |
| 8–12 h | 33 | 71.7% | |
| >12 h | 8 | 17.4% | |
| Weekly rest time | Never | 20 | 43.5% |
| 1 day | 17 | 36.9% | |
| ≥2 days | 9 | 19.6% | |
| Number of traffic accidents | None | 26 | 56.5% |
| 1–3 times | 16 | 34.8% | |
| >3 times | 4 | 8.7% | |
| Electric bike source | Self-purchased | 36 | 78.3% |
| Company-provided | 1 | 2.2% | |
| Renting | 9 | 19.5% |
| Characteristics | Definitions | Frequency (N) | Percentage (%) |
|---|---|---|---|
| Frequency of safety training | Only training for new employees | 1 | 2.2% |
| Monthly | 27 | 58.7% | |
| Weekly | 16 | 34.8% | |
| Daily | 2 | 4.3% | |
| Familiarity with traffic rules | Low | 11 | 23.9% |
| Moderate | 16 | 34.8% | |
| High | 19 | 41.3% | |
| Most dangerous riding behavior at work (multiple choices) | Reverse riding | 29 | 63.0% |
| Riding in motorized lanes | 14 | 30.4% | |
| Running red lights | 27 | 58.7% | |
| Riding without helmets | 23 | 50.0% | |
| Using mobile phones while riding | 20 | 43.5% | |
| Helmet source | Self-purchased | 14 | 30.4% |
| Company-provided | 32 | 69.6% | |
| Frequency of helmet use | Always | 40 | 87% |
| Often | 4 | 8.7% | |
| Occasional | 2 | 4.3% | |
| Reasons for wearing helmets (multiple choices) | Company policy | 23 | 50% |
| Fear of fine from traffic police | 12 | 26.1% | |
| Self-protection | 43 | 93.5% | |
| Ways of using mobile phones | Directly using | 5 | 10.9% |
| Vehicle bracket | 25 | 54.3% | |
| Using while waiting at traffic lights | 16 | 34.8% | |
| Reasons for using mobile phones while cycling (multiple choices) | Checking order information | 32 | 69.6% |
| Contacting customers to pick up orders | 12 | 26.1% | |
| Navigation | 21 | 45.7% | |
| Other reasons | 2 | 4.3% | |
| Reasons for breaking traffic rules (multiple choices) | Personal habits | 2 | 4.3% |
| Overdue orders | 18 | 39.1% | |
| Non-motorized lanes are occupied | 27 | 58.7% | |
| No non-motorized lane | 22 | 47.8% | |
| Bad weather | 5 | 10.9% | |
| Following others | 3 | 6.5% | |
| Not willing to take a detour | 12 | 26.1% | |
| Traffic light lasts too long | 3 | 6.5% |
Disclaimer/Publisher’s Note: The statements, opinions and data contained in all publications are solely those of the individual author(s) and contributor(s) and not of MDPI and/or the editor(s). MDPI and/or the editor(s) disclaim responsibility for any injury to people or property resulting from any ideas, methods, instructions or products referred to in the content. |
© 2023 by the authors. Licensee MDPI, Basel, Switzerland. This article is an open access article distributed under the terms and conditions of the Creative Commons Attribution (CC BY) license (https://creativecommons.org/licenses/by/4.0/).
Share and Cite
Zhang, Z.; Liu, C. Exploration of Riding Behaviors of Food Delivery Riders: A Naturalistic Cycling Study in Changsha, China. Sustainability 2023, 15, 16227. https://doi.org/10.3390/su152316227
Zhang Z, Liu C. Exploration of Riding Behaviors of Food Delivery Riders: A Naturalistic Cycling Study in Changsha, China. Sustainability. 2023; 15(23):16227. https://doi.org/10.3390/su152316227
Chicago/Turabian StyleZhang, Zihao, and Chenhui Liu. 2023. "Exploration of Riding Behaviors of Food Delivery Riders: A Naturalistic Cycling Study in Changsha, China" Sustainability 15, no. 23: 16227. https://doi.org/10.3390/su152316227
APA StyleZhang, Z., & Liu, C. (2023). Exploration of Riding Behaviors of Food Delivery Riders: A Naturalistic Cycling Study in Changsha, China. Sustainability, 15(23), 16227. https://doi.org/10.3390/su152316227