
Analysis of the Water Resource Carrying Capacity in Guyuan City


Abstract
:1. Introduction
2. Materials and Methods
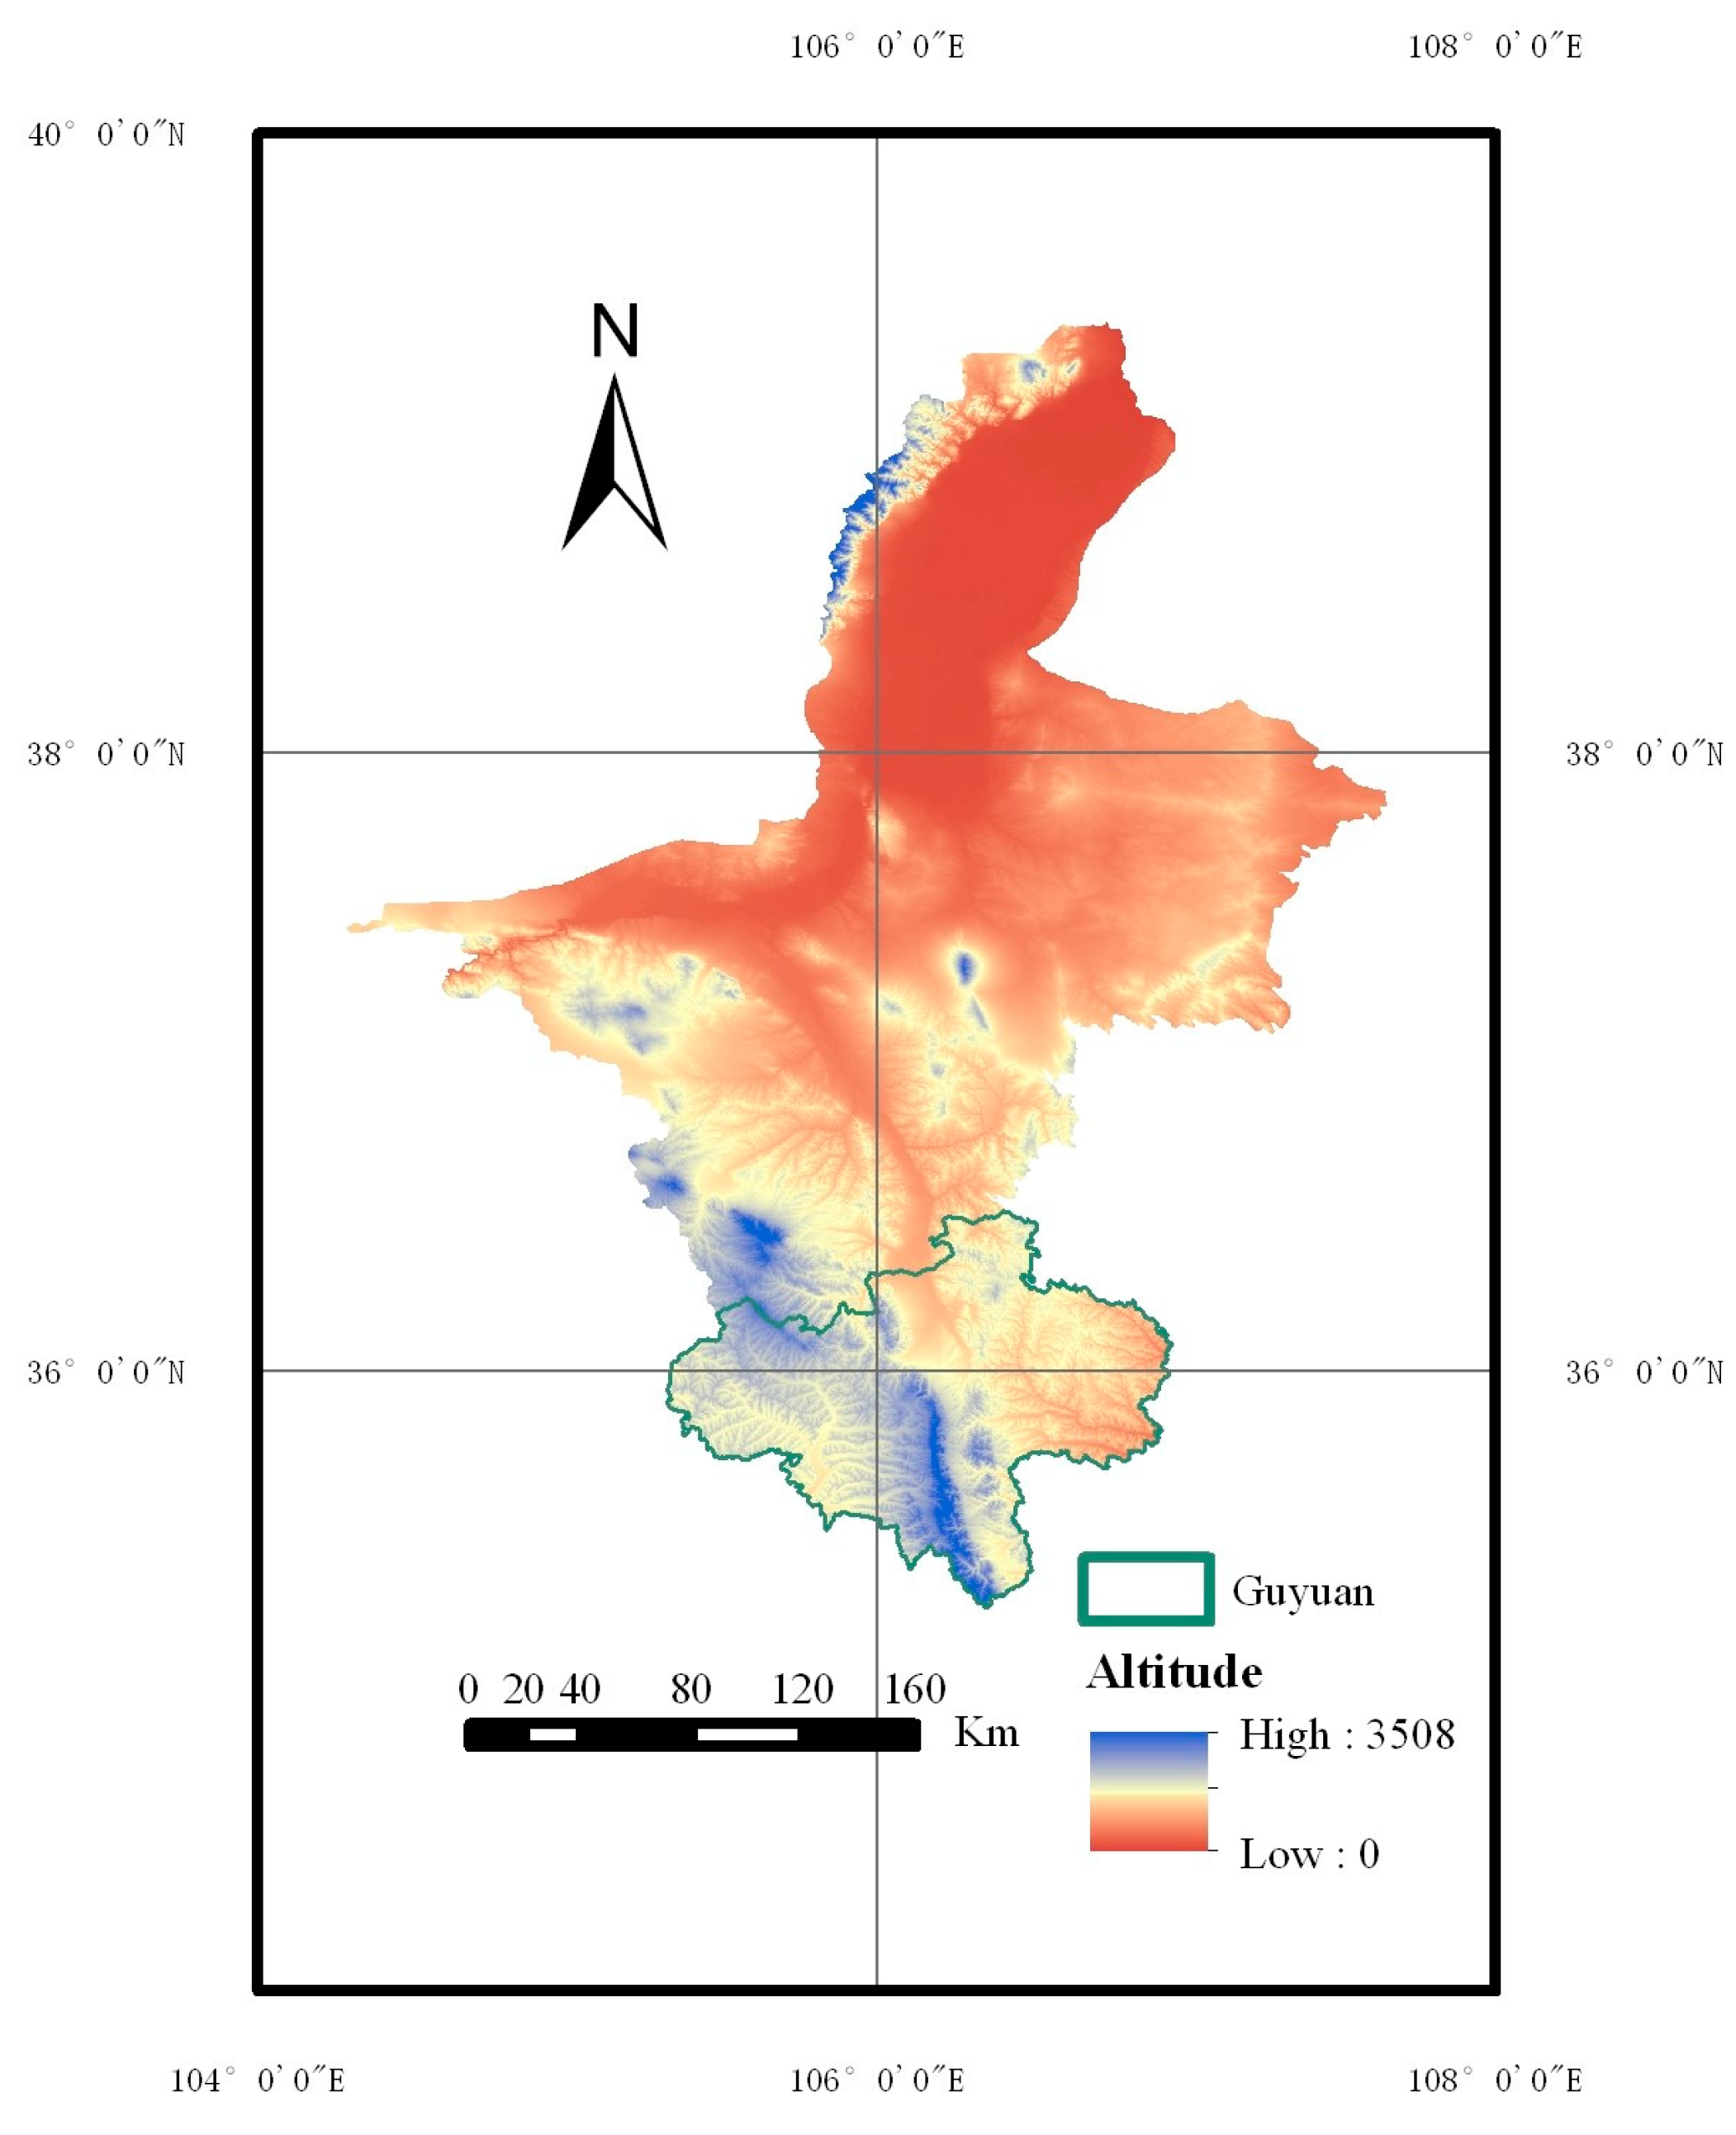
2.1. Study Area
2.2. Source of Data
2.3. Research Methods
2.3.1. Load Index Method
2.3.2. Principal Component Analysis
- (1)
- Data Preprocessing: In the initial step, raw data are preprocessed and standardized to mitigate issues associated with scale and unit disparities, which can introduce errors.
- (2)
- Correlation Coefficient Matrix: The preprocessed data are then used to compute a correlation coefficient matrix.
- (3)
- Eigenvalues and Eigenvectors: Based on the calculations from the previous step, eigenvalues and eigenvectors are derived.
- (4)
- Component Contribution: The eigenvalues and eigenvectors are analyzed to ascertain the contribution of each component. It is widely accepted in academia to consider components with a cumulative contribution rate exceeding 85% as principal components.
- (5)
- Principal Component Loadings: Principal component loadings are calculated.
- (6)
- Impact Analysis: The impact of each component is assessed by examining the major components and their respective contribution rates.
2.3.3. Ecological Footprint Method
3. Results and Analysis
3.1. Analysis of Water Resource Carrying Capacity in Guyuan City Based on the Load Index Method
3.2. Analysis of Guyuan City’s Water Resource Carrying Capacity Based on Principal Component Analysis
3.2.1. Construction of Evaluation Indicator System
3.2.2. Principal Component Analysis
3.3. Analysis of Guyuan City’s Water Resource Carrying Capacity Based on the Ecological Footprint Method
4. Discussion
5. Conclusions
Author Contributions
Funding
Institutional Review Board Statement
Informed Consent Statement
Data Availability Statement
Conflicts of Interest
References
- Li, L.Y. Assessment of water resource security in karst area of Guizhou Province, China. Sci. Rep. 2021, 11, 7641. [Google Scholar] [CrossRef] [PubMed]
- Peng, T.; Deng, H.W.; Lin, Y.; Jin, Z.Y. Assessment on water resources carrying capacity in karst areas by using an innovative DPESBRM concept model and cloud model. Sci. Total Environ. 2020, 767, 144353. [Google Scholar] [CrossRef] [PubMed]
- Yang, Z.; Song, J.X.; Cheng, D.D. Comprehensive evaluation and scenario simulation for the water resources carrying capacity in Xi’an city, China. J. Environ. Manag. 2019, 230, 221–233. [Google Scholar] [CrossRef] [PubMed]
- Wang, T.Z.; Jian, S.Q.; Wang, J.Y.; Yan, D.H. Dynamic interaction of water–economic–social–ecological environment complex system under the framework of water resources carrying capacity. J. Clean. Prod. 2022, 368, 133132. [Google Scholar] [CrossRef]
- Liao, X.; Ren, Y.T.; Shen, L.Y.; Shu, T.H.; Shen, L.Y.; He, H.M.; Wang, J.H. A “carrier-load” perspective method for investigating regional water resource carrying capacity. J. Clean. Prod. 2020, 269, 122043. [Google Scholar] [CrossRef]
- Zuo, Q.; Guo, J.; Ma, J. Assessment of regional-scale water resources carrying capacity based on fuzzy multiple attribute decision-making and scenario simulation. Ecol. Indic. 2021, 30, 108034. [Google Scholar] [CrossRef]
- Wang, G.; Xiao, C.; Qi, Z. Development tendency analysis for the water resource carrying capacity based on system dynamics model and the improved fuzzy comprehensive evaluation method in the Changchun city, China. Ecol. Indic. 2021, 122, 107232. [Google Scholar] [CrossRef]
- Guo, L.; Zhu, W.; Wei, J. Water demand forecasting and countermeasures across the Yellow River basin: Analysis from the perspective of water resources carrying capacity. J. Hydrol. Reg. Stud. 2022, 42, 101–148. [Google Scholar] [CrossRef]
- Zare, F.; Elsawah, S.; Bagheri, A. Improved integrated water resource modelling by combining DPSIR and system dynamics conceptual modelling techniques. J. Environ. Manag. 2019, 246, 27–41. [Google Scholar] [CrossRef] [PubMed]
- Brown, C.M.; Lund, J.R.; Cai, X.; Reed, P.M.; Zagona, E.A.; Ostfeld, A.; Hall, J.; Characklis, G.W.; Yu, W.; Brekke, L. The future of water resources systems analysis: Toward a scientific framework for sustainable water management. Water Resour. Res. 2015, 51, 6110–6124. [Google Scholar] [CrossRef]
- Leeuw, P.N.; Tothill, J.C. The Concept of Rangeland Carrying Capacity in Sub-Saharan Africa—Myth or Reality; Overseas Development Institute, Pastoral Development Network: London, UK, 1990. [Google Scholar]
- Engelman, R.; Leroy, P. Population and the future of renewable water supplies. Sustain. Water 1993, 34, 56–59. [Google Scholar]
- Rijsberman, M.A.; Frans, H.M. Different approaches to assessment of design and management of sustainable urban water systems. Environ. Impact Assess. Rev. 2000, 20, 333–345. [Google Scholar] [CrossRef]
- Clarke, A.L. Assessing the Carrying Capacity of the Florida Keys. Popul. Environ. 2002, 23, 405–418. [Google Scholar] [CrossRef]
- Menem, N.A.A.; Ewa, B.A. Algiers carrying capacity with respect to per capita domestic water use. Sustain. Cities Soc. 2014, 13, 1–11. [Google Scholar]
- Djuwansyah, M.R. Environmental sustainability control by water resources carrying capacity concept: Application significance in Indonesia. IOP Conf. Ser. Earth Environ. Sci. 2018, 118, 012027. [Google Scholar] [CrossRef]
- Shi, Y.F.; Qu, Y.G. Water Resources Carrying Capacity and Its Rational Utilization in the Urumqi River Basin; Science Press: Beijing, China, 1992. [Google Scholar]
- You, X. Study on the Water Resources Utilization and Carrying Capacity. Pearl River 2015, 36, 15–20. [Google Scholar]
- Yu, Q.W. Research on Regional Water Ecological Carrying Capacity Based on Ecological Footprint Method. Low Carbon World 2017, 3, 3–4. [Google Scholar]
- Zheng, W. Study on Water Resources Carrying Capacity in Guangdong Province Based on Multilevel Fuzzy Comprehensive Evaluation Model. Hubei Agric. Sci. 2018, 57, 30–34. [Google Scholar]
- Liu, C.M.; Wang, H.R. An analysis of the relationship between water resources and population-economy-society-environment. J. Nat. Resour. 2003, 18, 635–644. [Google Scholar]
- Zhang, Y.Y.; Xia, J.; Wang, Z.G. Research on Regional Water Resources Carrying Capacity Theory and Method. Prog. Geogr. 2007, 26, 126–132. [Google Scholar]
- Wang, W.W.; Meng, J.T.; Zhang, Y. Study on the Carrying Capacity of Water Resource in Hubei Province Based on Component Analysis. Hubei Agric. Sci. 2010, 49, 2764–2767. [Google Scholar]
- Wang, W. Comprehensive analysis on water resources development potential of Xuzhou City based on load index. Jiangsu Water Resour. 2020, 6, 45–48. [Google Scholar]
- Liu, L.H.; Liu, J.S. Research on Evaluation System and Threshold Value of Water Resources Carrying Capacity Based on Principal Component Analysis. J. Phys. Conf. Ser. 2021, 1757, 012090. [Google Scholar] [CrossRef]
- Xing, Q.Z.; Ren, Z.Y.; Wang, L.X.; Zhang, W.M. Evaluation on Sustainable Utilization of water resource in north Shaanxi Province Based on Ecological Footprint Model. Arid. Zone Res. 2009, 26, 793–798. [Google Scholar] [CrossRef]
- Huang, L.N.; Zhang, W.X.; Jiang, C.L. Ecological footprint method in water resources assessment. Acta Ecol. Sin. 2008, 28, 1279–1286. [Google Scholar]
- Mathis, W.; Larry, O.; Patricia, B.; Alejandro, C.L. National natural capital accounting with the ecological footprint concept. Ecol. Econ. 1999, 29, 375–390. [Google Scholar]
- Liu, X.; Lei, H.J.; Yan, Q.H.; Yang, T.X. Research on Urban Water Ecological Footprint Based on Ecological Water Demand. Yellow River 2008, 6, 41–43. [Google Scholar]
- Hu, Y.H.; Wu, Z.F.; Li, D.Q.; Zhuo, M.N. Measuring sustainable development of water resources with aquatic ecological footprint in Guangzhou based on ARIMA model. Ecol. Environ. 2006, 15, 94–98. [Google Scholar]
- Hong, X.Y. Analysis of Xinjiang’s Water Resource Carrying Capacity Based on Principal Component Analysis. Water Resour. Plan. Des. 2020, 33, 39–41. [Google Scholar]
- Ma, J.; Yang, Y.Z.; Yang, X. Current Situation and Evaluation of Water Resource Bearing Capacity in Ningxia. Ningxia Eng. Technol. 2019, 18, 179–182. [Google Scholar]
- Zhao, Z.Y.; Li, W.C.; Wang, X.; Cui, T.T.; Cheng, Z.H.; Wang, S. Study on Water Resources Carrying Capacity in Ningxia Based on Principal Component Analysis and Factor Analysis. J. China Hydrol. 2017, 37, 64–72. [Google Scholar]
- Fan, D.Z.; Mei, X.M.; Ren, Z.Y.; Li, P. Evolution of Water and Soil Resources Carrying Capacity in Ningxia Based on DPSIR Model. Water Resour. Power 2023, 41, 35–39. [Google Scholar]


| Level | C | Water Resource Utilization Level | Water Resource Development Evaluation |
|---|---|---|---|
| Ⅰ | >10 | Very high, limited potential | When conditions permit, water transfer from external basins is required |
| Ⅱ | 5~10 | High, limited potential | Development conditions are challenging |
| Ⅲ | 2~5 | Medium, moderate potential | Development conditions are moderate |
| Ⅳ | 1~2 | Low, significant potential | Development conditions are relatively favorable |
| Ⅴ | <1 | Low, very high potential | Undertaking small- to medium-sized projects, development is relatively straightforward |
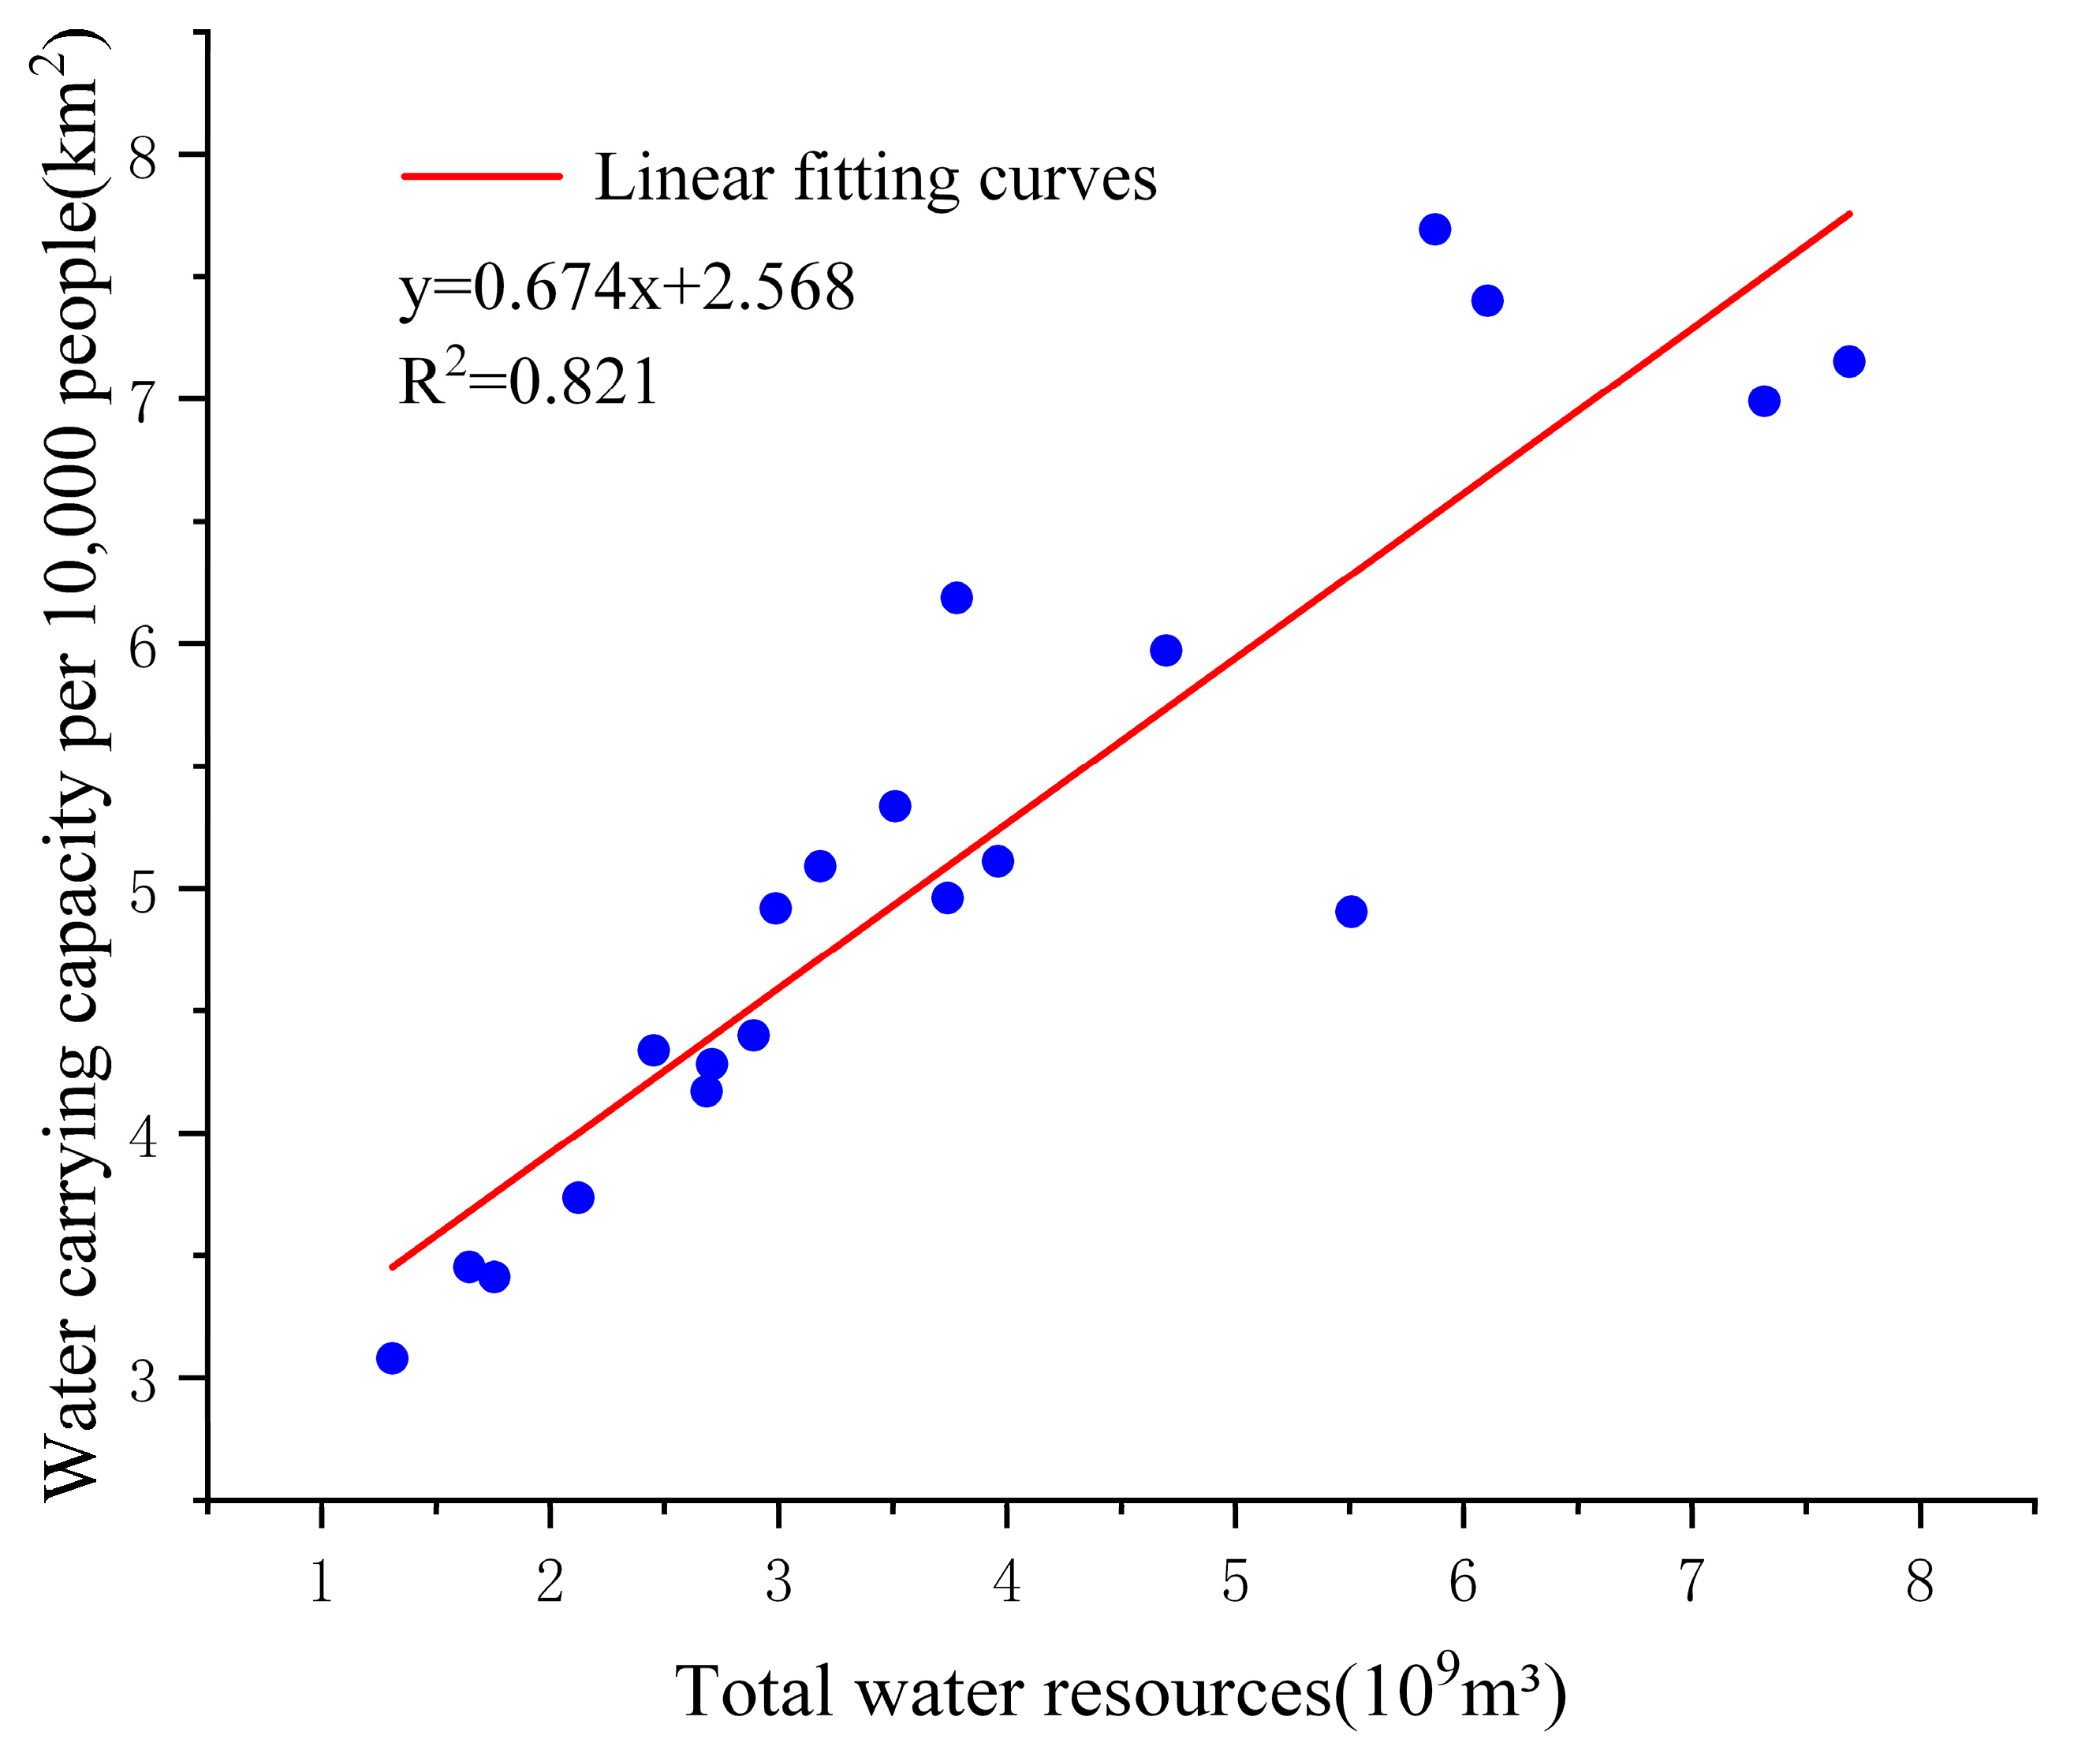
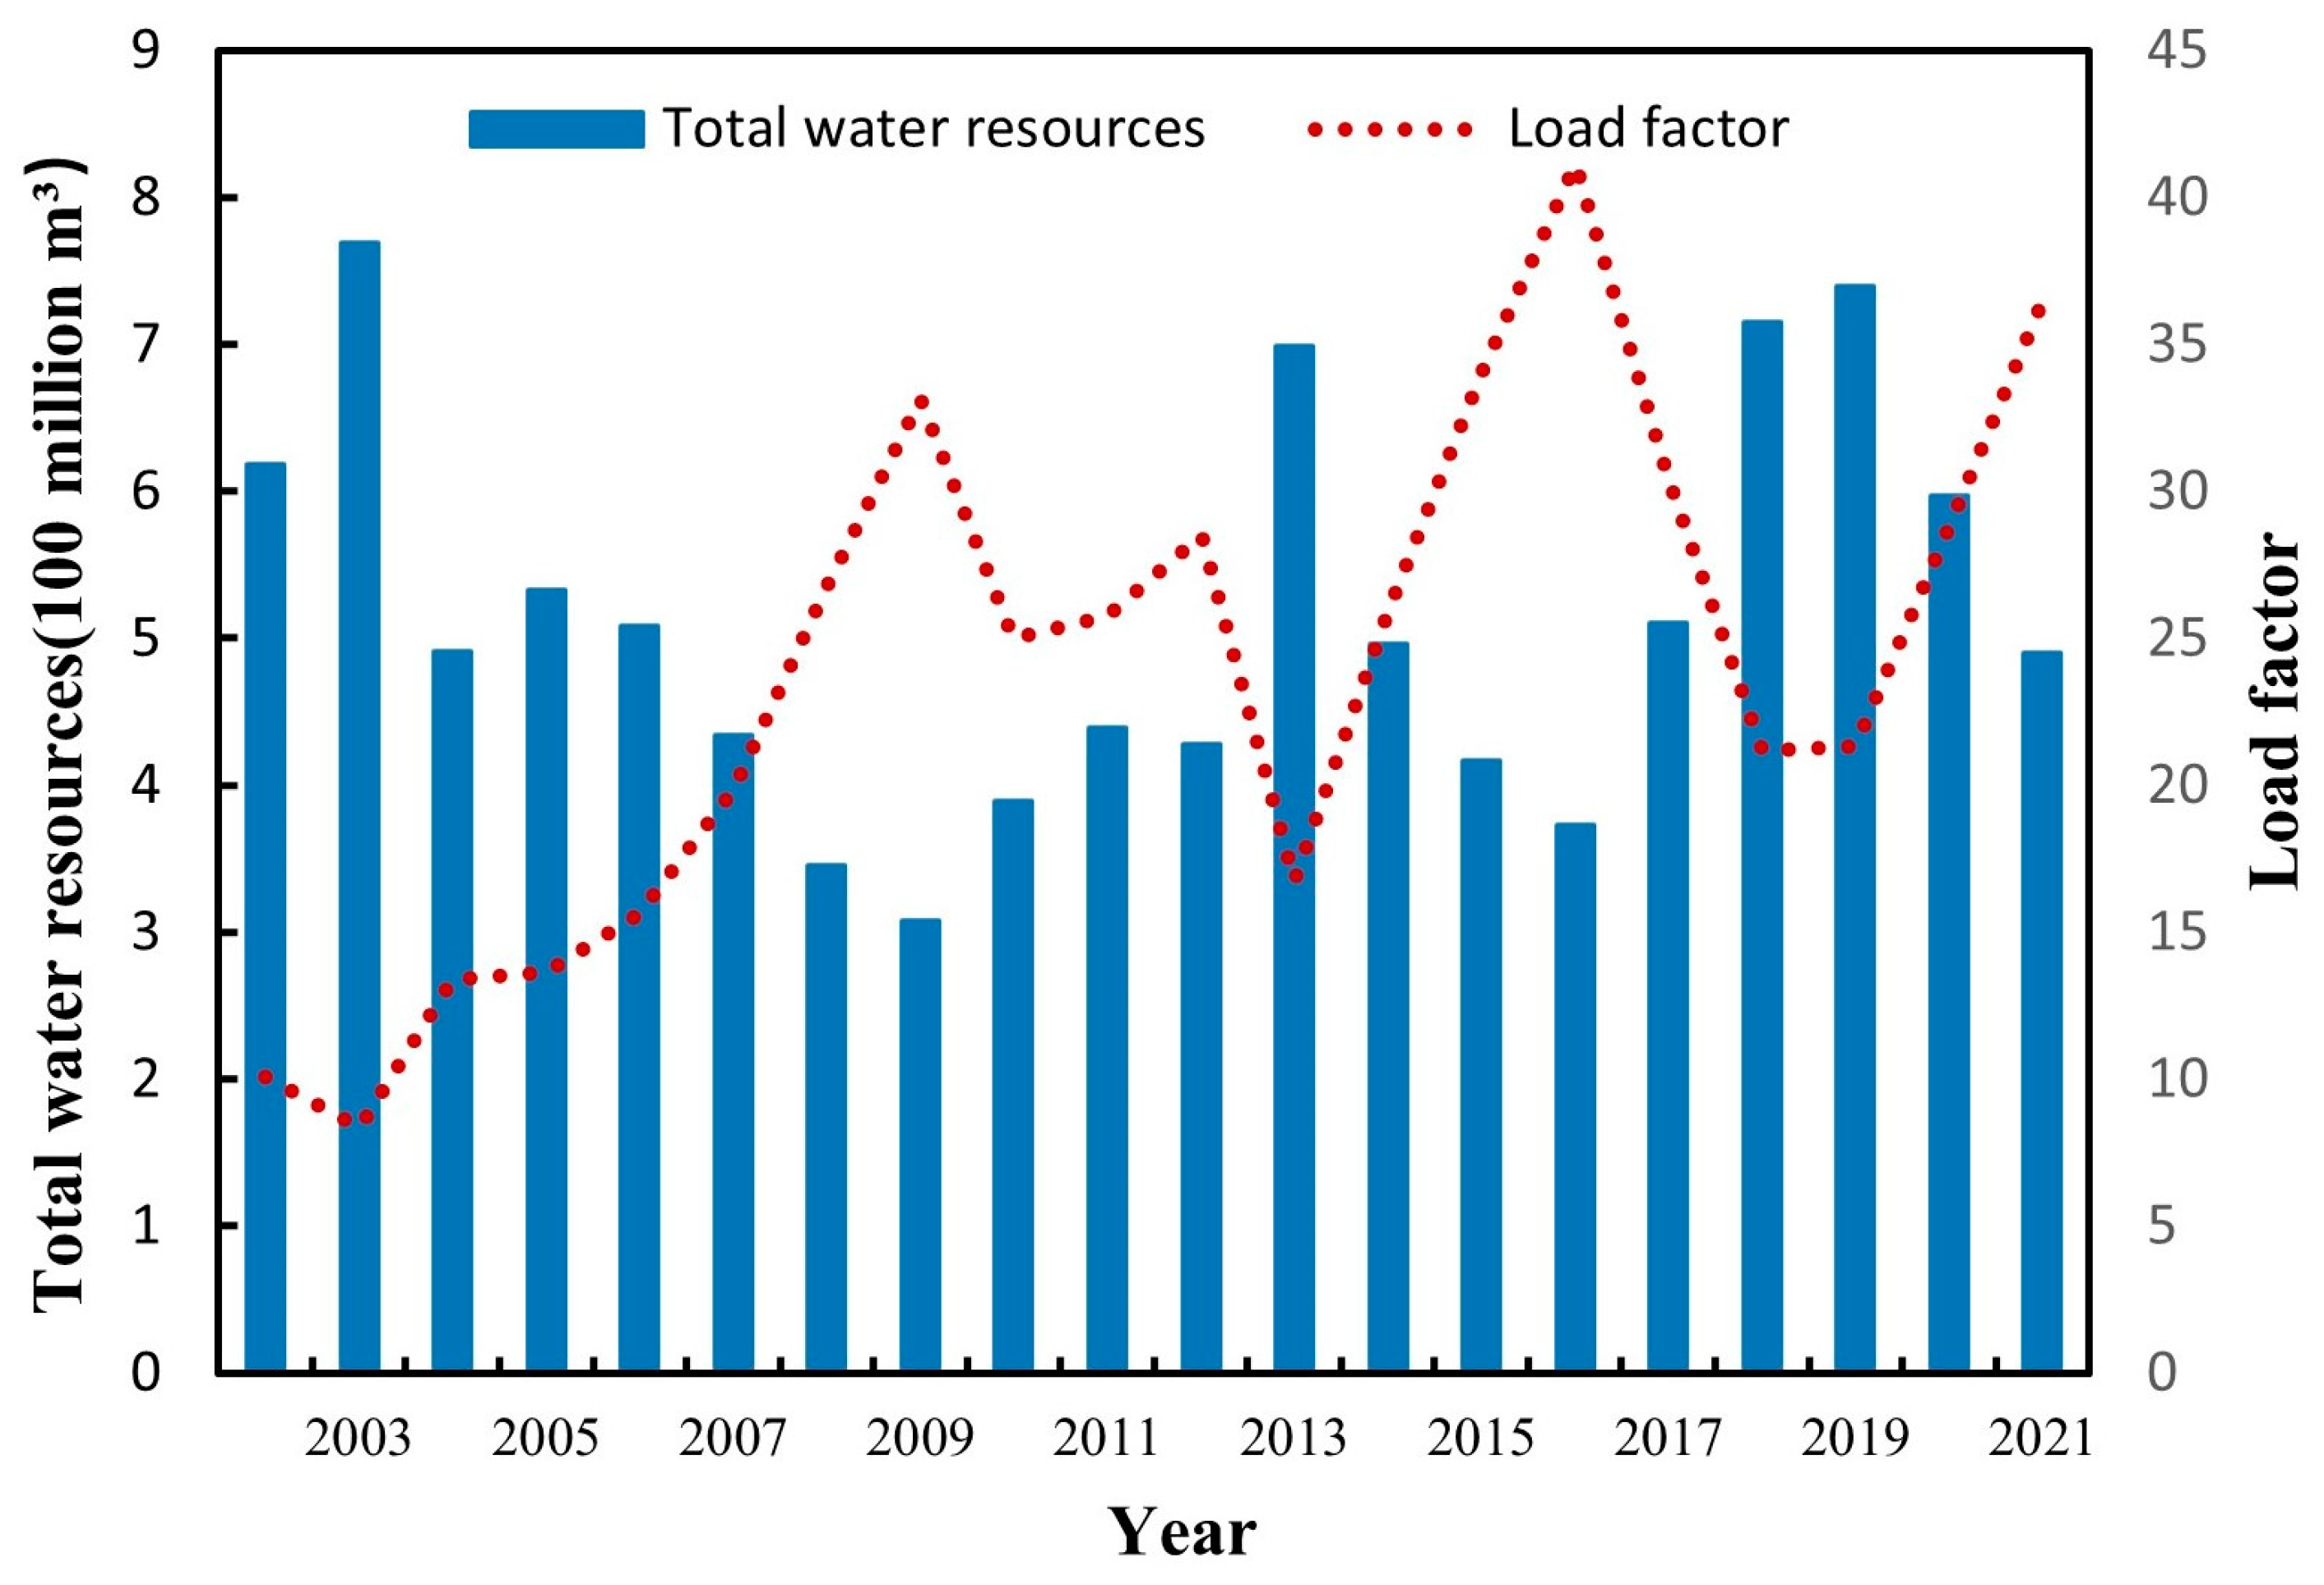
| Year | Annual Precipitation R (mm) | Population P (104 Person) | Gross Domestic Product G (109 Yuan) | Total Water Resources W (109 m3) | K | Load Coefficient | Load Grade |
|---|---|---|---|---|---|---|---|
| 2002 | 412 | 188.19 | 25.79 | 6.186 | 0.894 | 10.068 | Ⅰ |
| 2003 | 523 | 187.83 | 31.45 | 7.691 | 0.839 | 8.379 | Ⅱ |
| 2004 | 410 | 151.27 | 35.75 | 4.918 | 0.895 | 13.383 | Ⅰ |
| 2005 | 428 | 150.62 | 44.88 | 5.334 | 0.886 | 13.657 | Ⅰ |
| 2006 | 411 | 152.24 | 51.94 | 5.090 | 0.895 | 15.627 | Ⅰ |
| 2007 | 391 | 142.58 | 63.52 | 4.338 | 0.905 | 19.843 | Ⅰ |
| 2008 | 370 | 134.42 | 75.79 | 3.452 | 0.915 | 26.754 | Ⅰ |
| 2009 | 348 | 135.14 | 89.77 | 3.078 | 0.926 | 33.136 | Ⅰ |
| 2010 | 496 | 123.32 | 105.80 | 3.892 | 0.852 | 25.005 | Ⅰ |
| 2011 | 447 | 124.71 | 134.18 | 4.398 | 0.877 | 25.780 | Ⅰ |
| 2012 | 475 | 126.43 | 158.45 | 4.281 | 0.863 | 28.516 | Ⅰ |
| 2013 | 656 | 124.41 | 184.58 | 6.990 | 0.772 | 16.736 | Ⅰ |
| 2014 | 560 | 122.74 | 201.03 | 4.960 | 0.820 | 25.969 | Ⅰ |
| 2015 | 452 | 121.18 | 217.31 | 4.171 | 0.874 | 34.004 | Ⅰ |
| 2016 | 403 | 122.03 | 239.80 | 3.734 | 0.899 | 41.162 | Ⅰ |
| 2017 | 491 | 122.82 | 270.09 | 5.110 | 0.855 | 30.456 | Ⅰ |
| 2018 | 638 | 124.23 | 303.19 | 7.153 | 0.781 | 21.190 | Ⅰ |
| 2019 | 628 | 125.05 | 322.66 | 7.402 | 0.786 | 21.33 | Ⅰ |
| 2020 | 538 | 114.3 | 352.46 | 5.971 | 0.831 | 28.818 | Ⅰ |
| 2021 | 236 | 114.8 | 375.13 | 4.905 | 0.864 | 36.554 | Ⅰ |
| X1 | X2 | X3 | X4 | X5 | X6 | X7 | X8 | X9 | X10 | X11 | X12 | X13 | |
|---|---|---|---|---|---|---|---|---|---|---|---|---|---|
| X1 | 1.000 | ||||||||||||
| X2 | −0.745 | 1.000 | |||||||||||
| X3 | −0.466 | 0.820 | 1.000 | ||||||||||
| X4 | −0.803 | 0.979 | 0.818 | 1.000 | |||||||||
| X5 | −0.712 | 0.994 | 0.809 | 0.953 | 1.000 | ||||||||
| X6 | 0.313 | 0.211 | 0.314 | 0.122 | 0.216 | 1.000 | |||||||
| X7 | −0.112 | 0.288 | 0.496 | 0.297 | 0.308 | −0.128 | 1.000 | ||||||
| X8 | −0.781 | 0.803 | 0.784 | 0.889 | 0.751 | −0.074 | 0.342 | 1.000 | |||||
| X9 | −0.473 | 0.845 | 0.739 | 0.763 | 0.888 | 0.195 | 0.485 | 0.520 | 1.000 | ||||
| X10 | 0.369 | 0.040 | 0.190 | −0.081 | 0.116 | 0.198 | 0.523 | −0.197 | 0.494 | 1.000 | |||
| X11 | −0.536 | 0.883 | 0.773 | 0.872 | 0.876 | 0.317 | 0.398 | 0.732 | 0.823 | 0.196 | 1.000 | ||
| X12 | 0.832 | −0.920 | −0.634 | −0.951 | −0.882 | −0.088 | −0.114 | −0.830 | −0.616 | 0.236 | −0.791 | 1.000 | |
| X13 | −0.296 | 0.561 | 0.445 | 0.546 | 0.526 | 0.757 | −0.172 | 0.384 | 0.304 | −0.190 | 0.556 | −0.594 | 1.000 |
| Eigenvalue | Contribution Rate (%) | Cumulative Contribution Rate (%) | |
|---|---|---|---|
| The first principal component | 7.322 | 56.326 | 56.326 |
| The second principal component | 2.300 | 17.689 | 74.016 |
| The third principal component | 2.097 | 16.135 | 90.150 |
| The First Principal Component | The Second Principal Component | The Third Principal Component | |
|---|---|---|---|
| X1 | −0.745 | 0.486 | 0.353 |
| X2 | 0.987 | −0.018 | 0.016 |
| X3 | 0.859 | 0.243 | 0.023 |
| X4 | 0.987 | −0.128 | −0.056 |
| X5 | 0.972 | 0.054 | 0.008 |
| X6 | 0.213 | 0.283 | 0.922 |
| X7 | 0.360 | 0.632 | −0.471 |
| X8 | 0.859 | −0.230 | −0.235 |
| X9 | 0.827 | 0.437 | −0.077 |
| X10 | 0.042 | 0.942 | −0.046 |
| X11 | 0.916 | 0.180 | 0.092 |
| X12 | −0.914 | 0.327 | −0.001 |
| X13 | 0.579 | −0.191 | 0.744 |
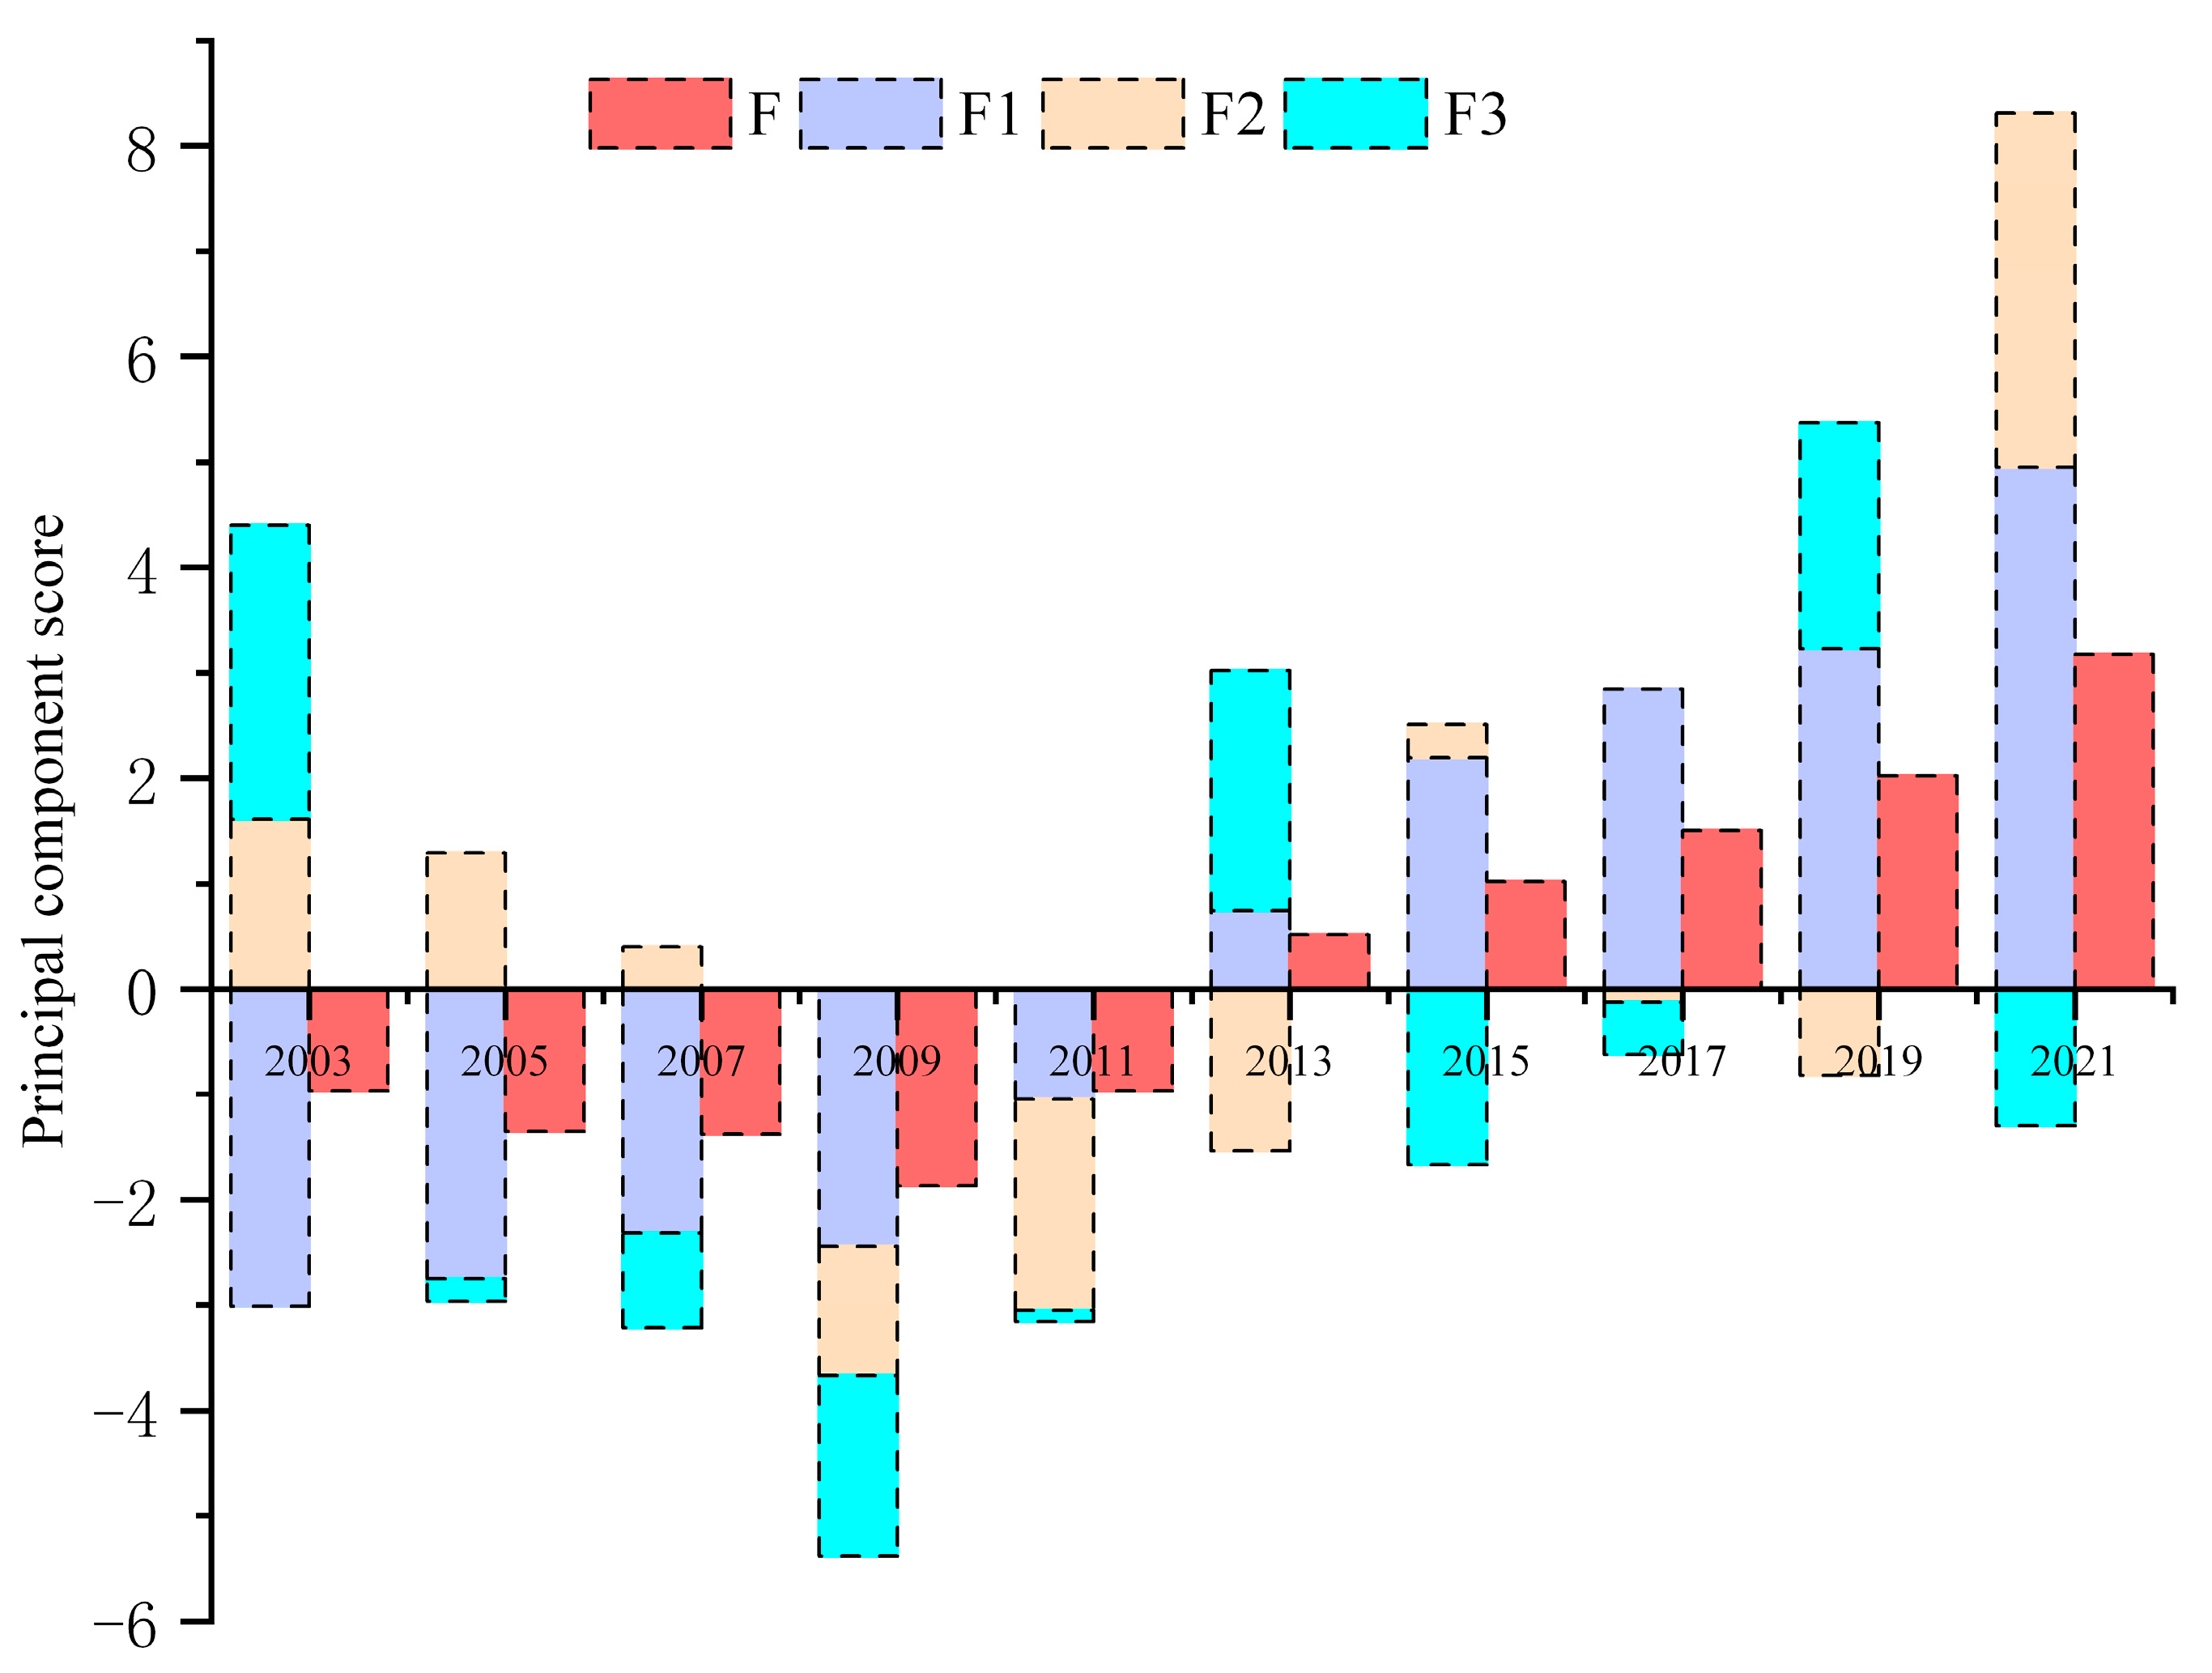
| Year | F1 (First Principal Component Score) | F2 (Second Principal Component Score) | F3 (Third Principal Component Score) | F (Principal Component Composite Score) |
|---|---|---|---|---|
| 2002 | −3.68 | 2.43 | 0.86 | −1.51 |
| 2003 | −3.01 | 1.61 | 2.79 | −0.96 |
| 2004 | −2.96 | 1.15 | −0.32 | −1.52 |
| 2005 | −2.75 | 1.29 | −0.22 | −1.35 |
| 2006 | −2.74 | 0.40 | 0.17 | −1.45 |
| 2007 | −2.31 | 0.40 | −0.90 | −1.38 |
| 2008 | −2.15 | −0.82 | −1.30 | −1.56 |
| 2009 | −2.44 | −1.23 | −1.72 | −1.87 |
| 2010 | −1.36 | −1.82 | −0.36 | −1.15 |
| 2011 | −1.05 | −2.00 | −0.11 | −0.96 |
| 2012 | −0.21 | −1.74 | −0.04 | −0.44 |
| 2013 | 0.74 | −1.54 | 2.88 | 0.51 |
| 2014 | 1.03 | −1.04 | 0.16 | 0.42 |
| 2015 | 2.19 | 0.32 | −1.67 | 1.02 |
| 2016 | 2.10 | −0.06 | −1.92 | 0.86 |
| 2017 | 2.85 | −0.12 | −0.50 | 1.50 |
| 2018 | 4.09 | 0.30 | 1.36 | 2.58 |
| 2019 | 3.23 | −0.82 | 2.14 | 2.02 |
| 2020 | 3.49 | −0.06 | 0.61 | 2.05 |
| 2021 | 4.95 | 3.36 | −1.30 | 3.17 |
| Year | Total Water Consumption W (109 m3) | Total Water Resources Q (109 m3) | Ecological Water Footprint CW (km2) | Yield Factor φW | Water Resource Carrying Capacity ECW (km2) | Ecological Deficit ED (km2) |
|---|---|---|---|---|---|---|
| 2002 | 1.974 | 6.186 | 32.63 | 0.174 | 7.12 | 25.51 |
| 2003 | 2.028 | 7.691 | 33.52 | 0.217 | 11.03 | 22.49 |
| 2004 | 1.553 | 4.918 | 25.67 | 0.139 | 4.52 | 21.15 |
| 2005 | 1.144 | 5.334 | 18.91 | 0.150 | 5.29 | 13.62 |
| 2006 | 1.097 | 5.09 | 18.13 | 0.144 | 4.85 | 13.29 |
| 2007 | 1.233 | 4.338 | 20.38 | 0.122 | 3.50 | 16.88 |
| 2008 | 1.121 | 3.452 | 18.53 | 0.097 | 2.21 | 16.31 |
| 2009 | 0.816 | 3.078 | 13.49 | 0.087 | 1.77 | 11.72 |
| 2010 | 0.875 | 3.412 | 14.46 | 0.096 | 2.17 | 12.30 |
| 2011 | 0.901 | 4.398 | 14.89 | 0.124 | 3.61 | 11.29 |
| 2012 | 0.944 | 4.281 | 15.60 | 0.121 | 3.42 | 12.18 |
| 2013 | 0.957 | 6.99 | 15.82 | 0.197 | 9.10 | 6.71 |
| 2014 | 1.052 | 4.960 | 17.39 | 0.140 | 4.59 | 12.80 |
| 2015 | 1.214 | 4.171 | 20.07 | 0.118 | 3.25 | 16.81 |
| 2016 | 1.128 | 3.734 | 18.64 | 0.105 | 2.59 | 16.05 |
| 2017 | 1.097 | 5.11 | 18.13 | 0.144 | 4.87 | 13.27 |
| 2018 | 1.128 | 7.153 | 18.64 | 0.202 | 9.55 | 9.09 |
| 2019 | 0.973 | 7.402 | 17.65 | 0.156 | 7.63 | 10.01 |
| 2020 | 1.023 | 5.971 | 16.35 | 0.136 | 5.37 | 10.98 |
| 2021 | 0.986 | 4.905 | 16.23 | 0.195 | 6.32 | 9.90 |
Disclaimer/Publisher’s Note: The statements, opinions and data contained in all publications are solely those of the individual author(s) and contributor(s) and not of MDPI and/or the editor(s). MDPI and/or the editor(s) disclaim responsibility for any injury to people or property resulting from any ideas, methods, instructions or products referred to in the content. |
© 2023 by the authors. Licensee MDPI, Basel, Switzerland. This article is an open access article distributed under the terms and conditions of the Creative Commons Attribution (CC BY) license (https://creativecommons.org/licenses/by/4.0/).
Share and Cite
Peng, W.; Li, C.; Yu, H.; Zhang, Y.; Li, M. Analysis of the Water Resource Carrying Capacity in Guyuan City. Sustainability 2023, 15, 16159. https://doi.org/10.3390/su152316159
Peng W, Li C, Yu H, Zhang Y, Li M. Analysis of the Water Resource Carrying Capacity in Guyuan City. Sustainability. 2023; 15(23):16159. https://doi.org/10.3390/su152316159
Chicago/Turabian StylePeng, Wenfa, Chaochao Li, Haohan Yu, Yadong Zhang, and Mingyang Li. 2023. "Analysis of the Water Resource Carrying Capacity in Guyuan City" Sustainability 15, no. 23: 16159. https://doi.org/10.3390/su152316159
APA StylePeng, W., Li, C., Yu, H., Zhang, Y., & Li, M. (2023). Analysis of the Water Resource Carrying Capacity in Guyuan City. Sustainability, 15(23), 16159. https://doi.org/10.3390/su152316159