Article

From Pixels to Sustainability: Trends and Collaborations in Remote Sensing for Advancing Sustainable Cities and Communities (SDG 11)

1
Graduate School of Science and Engineering, Hacettepe University, Beytepe, Ankara 06800, Türkiye
2
Department of Geomatics Engineering, Hacettepe University, Beytepe, Ankara 06800, Türkiye
*
Author to whom correspondence should be addressed.
Sustainability 2023, 15(22), 16094; https://doi.org/10.3390/su152216094
Submission received: 28 September 2023 / Revised: 12 November 2023 / Accepted: 14 November 2023 / Published: 19 November 2023
(This article belongs to the Special Issue State of the Art of Assessment for Sustainable Development Goals)

Abstract

:
Remote sensing data and methods have become indispensable for observing and modeling the Earth and have great potential for monitoring a substantial portion of the targets defined under the United Nations Sustainable Development Goals (SDGs). This study investigates remote sensing research on SDG 11 (sustainable cities and communities) from 2016 to 2023, highlighting the growing interest in the field. By evaluating a large number of selected articles (6820) using a specialized keyword selection strategy and various filters, a significant increase in publication frequency was observed. Remote Sensing and Sustainability were found to be the most relevant journals. A trend towards research addressing urban ecological quality, changes in land use patterns, and the impact of impervious surfaces was found in domain-specific citations. Semi-niche motor themes encompass deep learning, feature extraction, and semantic segmentation. Simultaneously, remote sensing, machine learning, and change detection serve as foundational motor themes, merging elements of both basic and motor themes. The introduction of new analytical methods (e.g., new indices), together with the use of open data and crowdsourcing, has gained great interest. While there has been a strong focus on land cover, urban expansion, and land surface temperature, the main gaps were identified in regional development, disaster, resilience, natural and cultural heritage, housing, and inclusiveness. The findings show the significance of remote sensing research and its practical applications for shaping urban policy, planning strategies, and sustainable urban development. By extracting research patterns using centrality and density analyses and identifying underexplored areas, valuable insights into relationships, significance, and developmental progress within SDG 11-related remote sensing research were gained and may contribute to future planning and informing policymaking decisions.

1. Introduction

In 2000, the United Nations (UN) General Assembly ratified the Millennium Declaration, setting out eight Millennium Development Goals (MDGs) to be achieved by 2015 [1]. In 2015, the UN introduced the Sustainable Development Goals (SDGs), consisting of 17 goals and 169 targets, including 1 SDG focused on sustainable cities and communities, with 10 targets. The SDGs marked a significant shift in the global development agenda, replacing the MDG era [2]. All facets of sustainable development are influenced by the sustainability of cities and urban areas [3], illustrating the considerable significance of SDG 11, which aims to create cities and human habitats that are welcoming, secure, adaptable, and environmentally responsible [4]. The objective is to ensure that urban areas promote inclusivity, safety, durability, and sustainability.
In most parts of the world, urban centers and their surroundings grew significantly during the second half of the twentieth century [5]. The world’s urban population surpassed its rural counterpart in 2007 for the first time in history, and since then, the world’s population has continued to be predominately urban. Throughout the world, urban regions have more inhabitants than rural areas, with urban areas housing 54% of the world’s population in 2014 [6]. Urbanization is expected to increase from 30% of the global population in 1950 to 66% of the global population by 2050 [6].
Monitoring the SDG indicators is critical, and remote sensing has an important role in achieving this task. Clarifying the concept of remote sensing is challenging, especially given the brief, two-word title attributed to the field [7]. In its most expansive interpretation, remote sensing involves gathering data about an entity or phenomenon without direct contact. Remote sensing is not only an academic field but also a potent tool with considerable consequences for urban policy, planning, and sustainability. Its expansion and alignment with sustainability objectives highlight its crucial function in directing worldwide urban development. This is especially essential as cities tackle the interconnected difficulties of growth and sustainability nowadays. The remote sensing data and methods are valuable for both temporal and spatial monitoring [8]. The Group on Earth Observations (GEO) conducted an assessment and pinpointed 72 targets and 30 indicators suitable for direct or indirect Earth observation (EO) contributions; as a result, SDG 11 emerged as one of the most promising domains for utilizing EO data [9].
There is an increasing trend in using bibliometric analysis and science mapping tools for investigating the relationships between different research domains revealing various patterns (such as collaborations among countries and institutions [10]), identifying the level of collaborations (e.g., with the analysis of co-authorship [11]) and keywords, etc. This approach has become a necessity even for the SDGs due to the exhaustive numbers of publications, which cannot be simply analyzed through manual effort, and the magnitude of the problems (and also keywords) addressed by the SDGs. Recent efforts analyzed the different aspects of SDG-related research. Basu and Dasgupta [12] analyzed 637 articles for SDG 6-related research and concluded that gaps exist in water security, hydropolitics, the water–energy–food nexus, etc. Another study, by Yeh et al. [13], reviewed 2814 research studies and 92 review articles on the SDGs and confirmed the increasing interest and expanding volume of academic research related to the SDGs. They also emphasized that SDG 3 was the most researched goal. Sreenivasan et al. [14] investigated the use of an expert-based method, the analytical hierarchy process (AHP), for all 17 SDGs based on a total of 29,897 articles; revealed clusters and the lead contributors; and discussed future directions. Singh et al. [15] investigated a total of 20,511 articles at the intersection of artificial intelligence (AI) and SDGs and emphasized that most studies were related to SDG 3 and SDG 7. Mishra et al. [16] also analyzed SDG-related research for all 17 goals in 12,176 papers and indicated that most studies have been carried out in developed countries.
A brief analysis of the number of publications on the SDGs using bibliometric analysis and science mapping tools on Web of Science (WoS) using the search terms bibliometric* AND sdg* showed that there is an exponential rise in similar works, from 5 publications in 2019 to 83 publications in 2022 (searched in WoS Core Collection, searched by topic). Considering the abovementioned efforts and the extent of the issue, the need to use bibliometric analysis and science mapping tools for analyzing trends and identifying patterns and gaps is inevitable. Moreover, as most analyses are based on keywords defined by authors, the definition of suitable search terms has become an important issue. To effectively tackle the issue, new AI approaches like the Open SDGs (OSDG) tool by Pukelis et al. [17] are essential. This tool distinctively deciphers SDG-related uncertainties by evaluating submitted texts in a user-friendly manner [18].
In this study, we aimed to analyze remote sensing research and SDG 11 from an interdisciplinary perspective. While numerous bibliometric analyses have addressed the different perspectives of remote sensing [19,20,21,22,23] and SDG 11 [24,25], a comprehensive bibliometric analysis of the interaction between remote sensing studies and their contributions to SDG 11 is not yet available. Here, we used a dataset spanning from 1 January 2016 to 30 June 2023 to provide a comprehensive analysis of the trends, collaborations, and thematic developments at the intersection of these two fields. We employed a combination of bibliometric techniques and a science mapping analysis tool to address a number of research questions, which can be listed as follows:
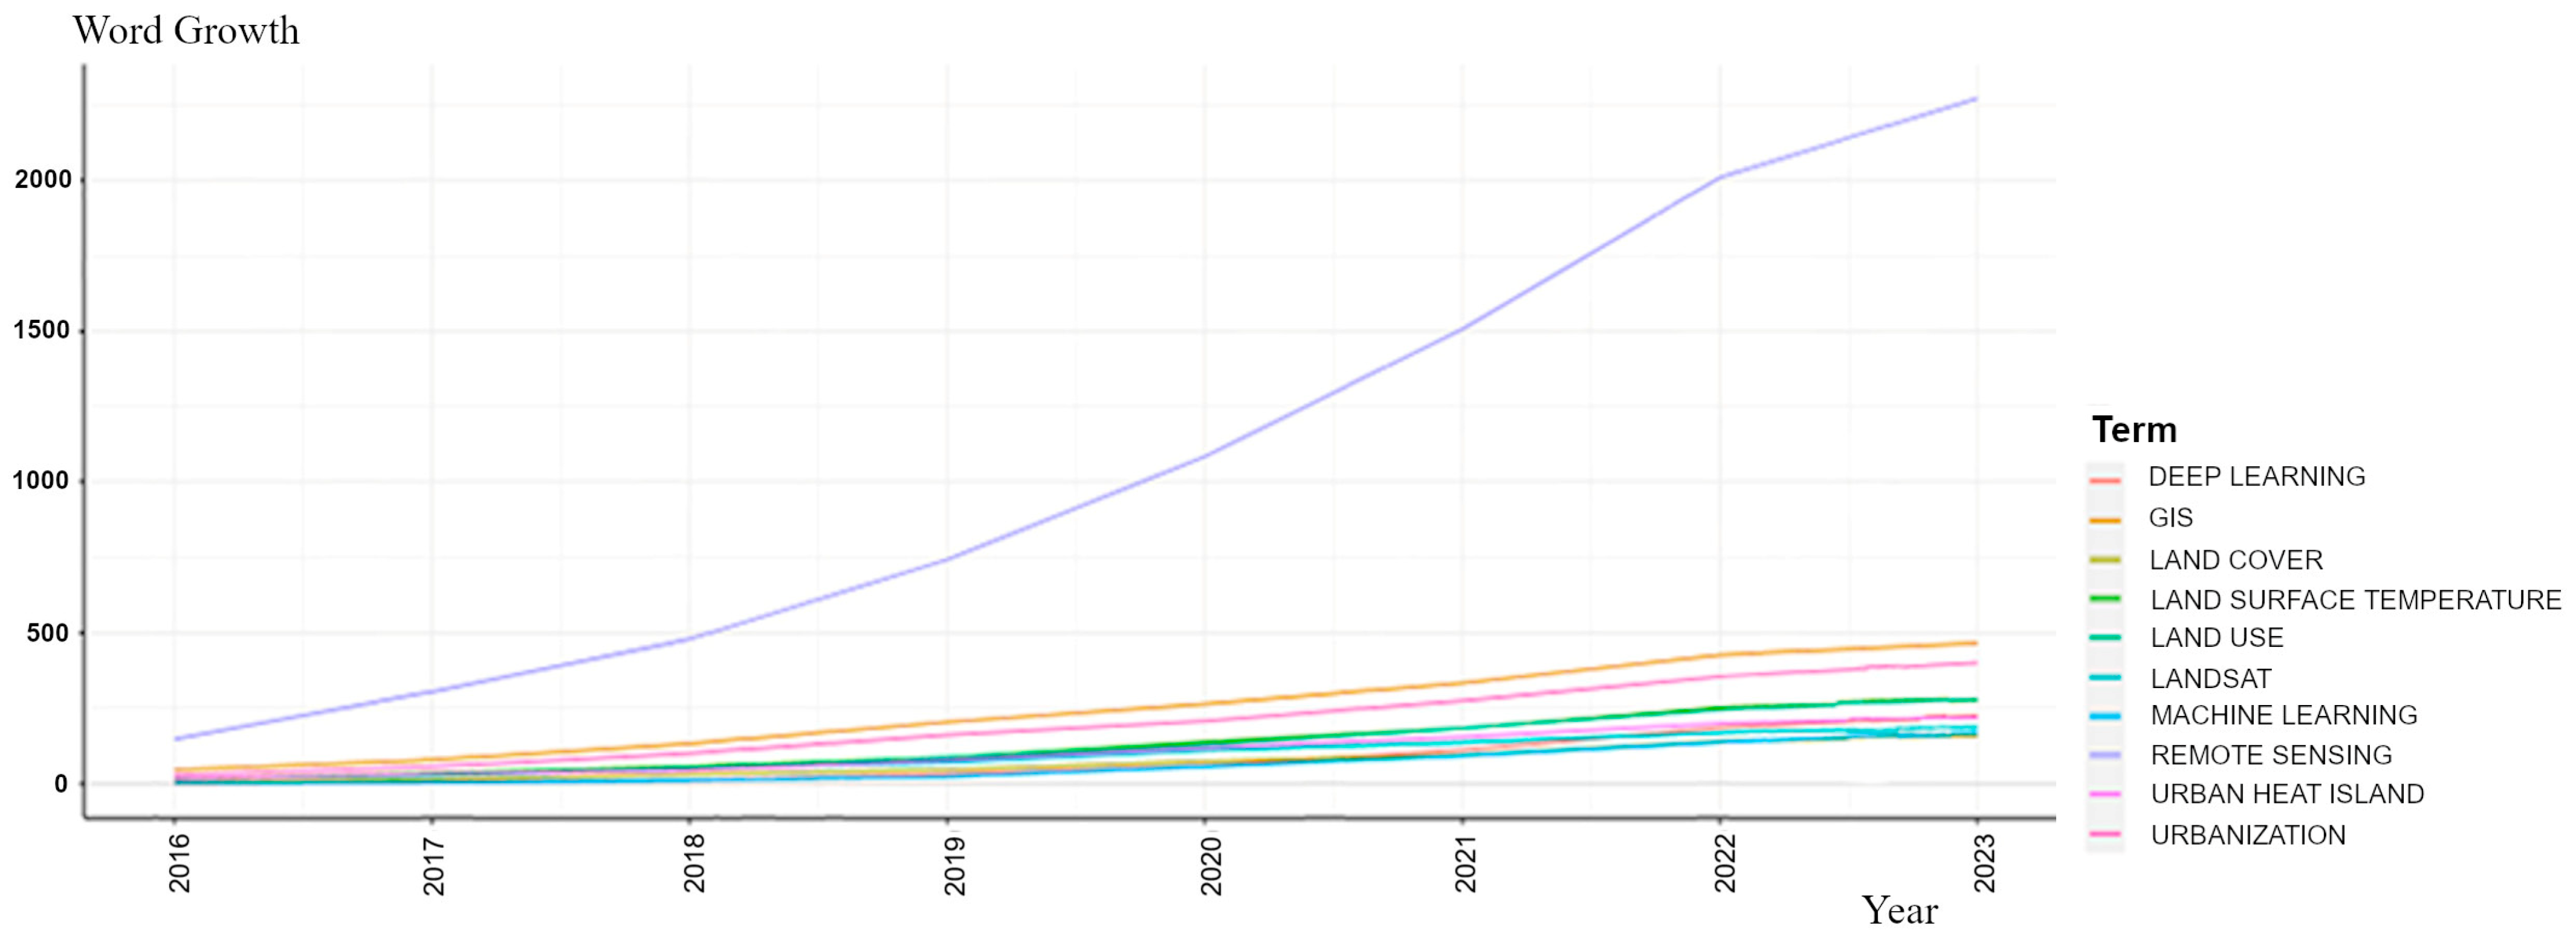
  • How has the publication trend of remote sensing studies contributing to SDG 11 evolved from 2016 to 2023?
  • Which scholarly journals and specific articles within this interdisciplinary field have the greatest influence and impact on the field?
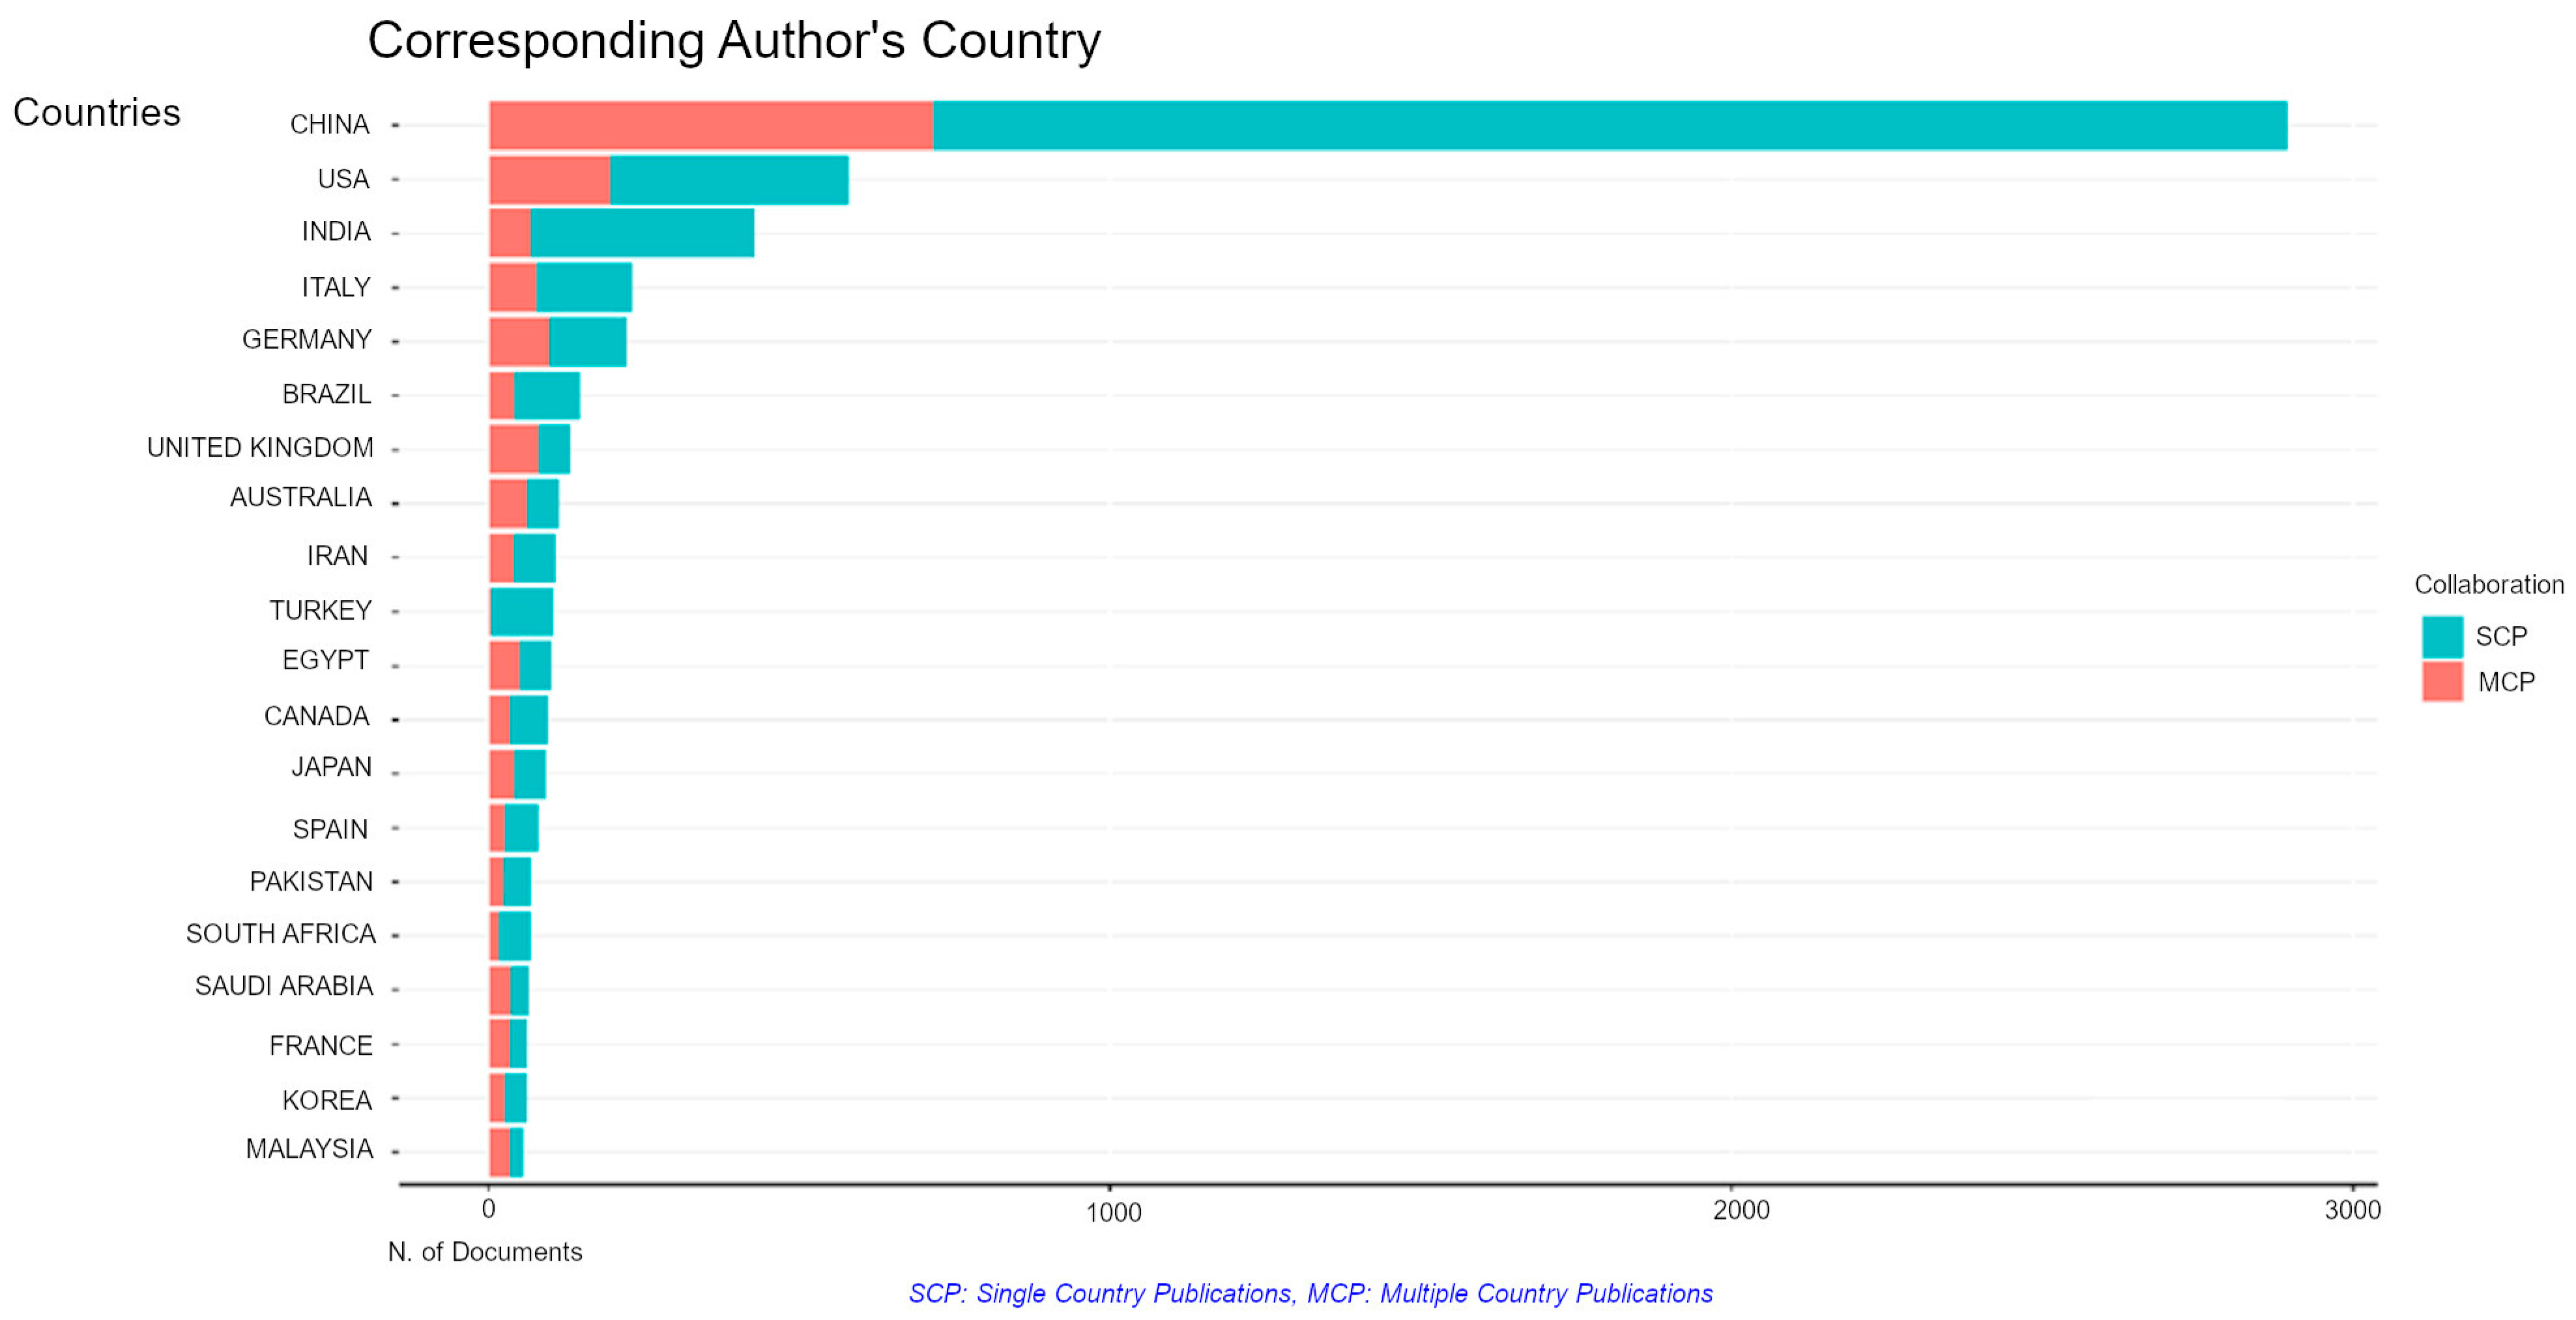
  • Which countries are at the forefront of academic contributions, and between which countries has international collaboration been more intense?
  • How have central themes, as discerned from keywords and abstracts, evolved over the years, and what insights do they provide into the future trajectory of research?
  • In the context of sustainable urban development (SDG 11), what are the emerging technologies and methodologies within remote sensing studies?
  • What are the main gaps in remote sensing research to better contribute to SDG 11?
By addressing these questions, this study aims to reveal the current state of research and potential directions for future studies in advancing sustainable urban development. Although a recent study by Wang et al. [26] also investigated urban sustainability, they explored a total of 240 papers across all SDGs in a broad sense. Our investigation involved a thorough selection of keywords based on the goal, targets, and indicators of SDG 11, which yielded to a total of 6820 articles. We focused on remote sensing research due to its importance in assessing urban and environmental problems across space and time. Thus, the major contributions of this paper are:
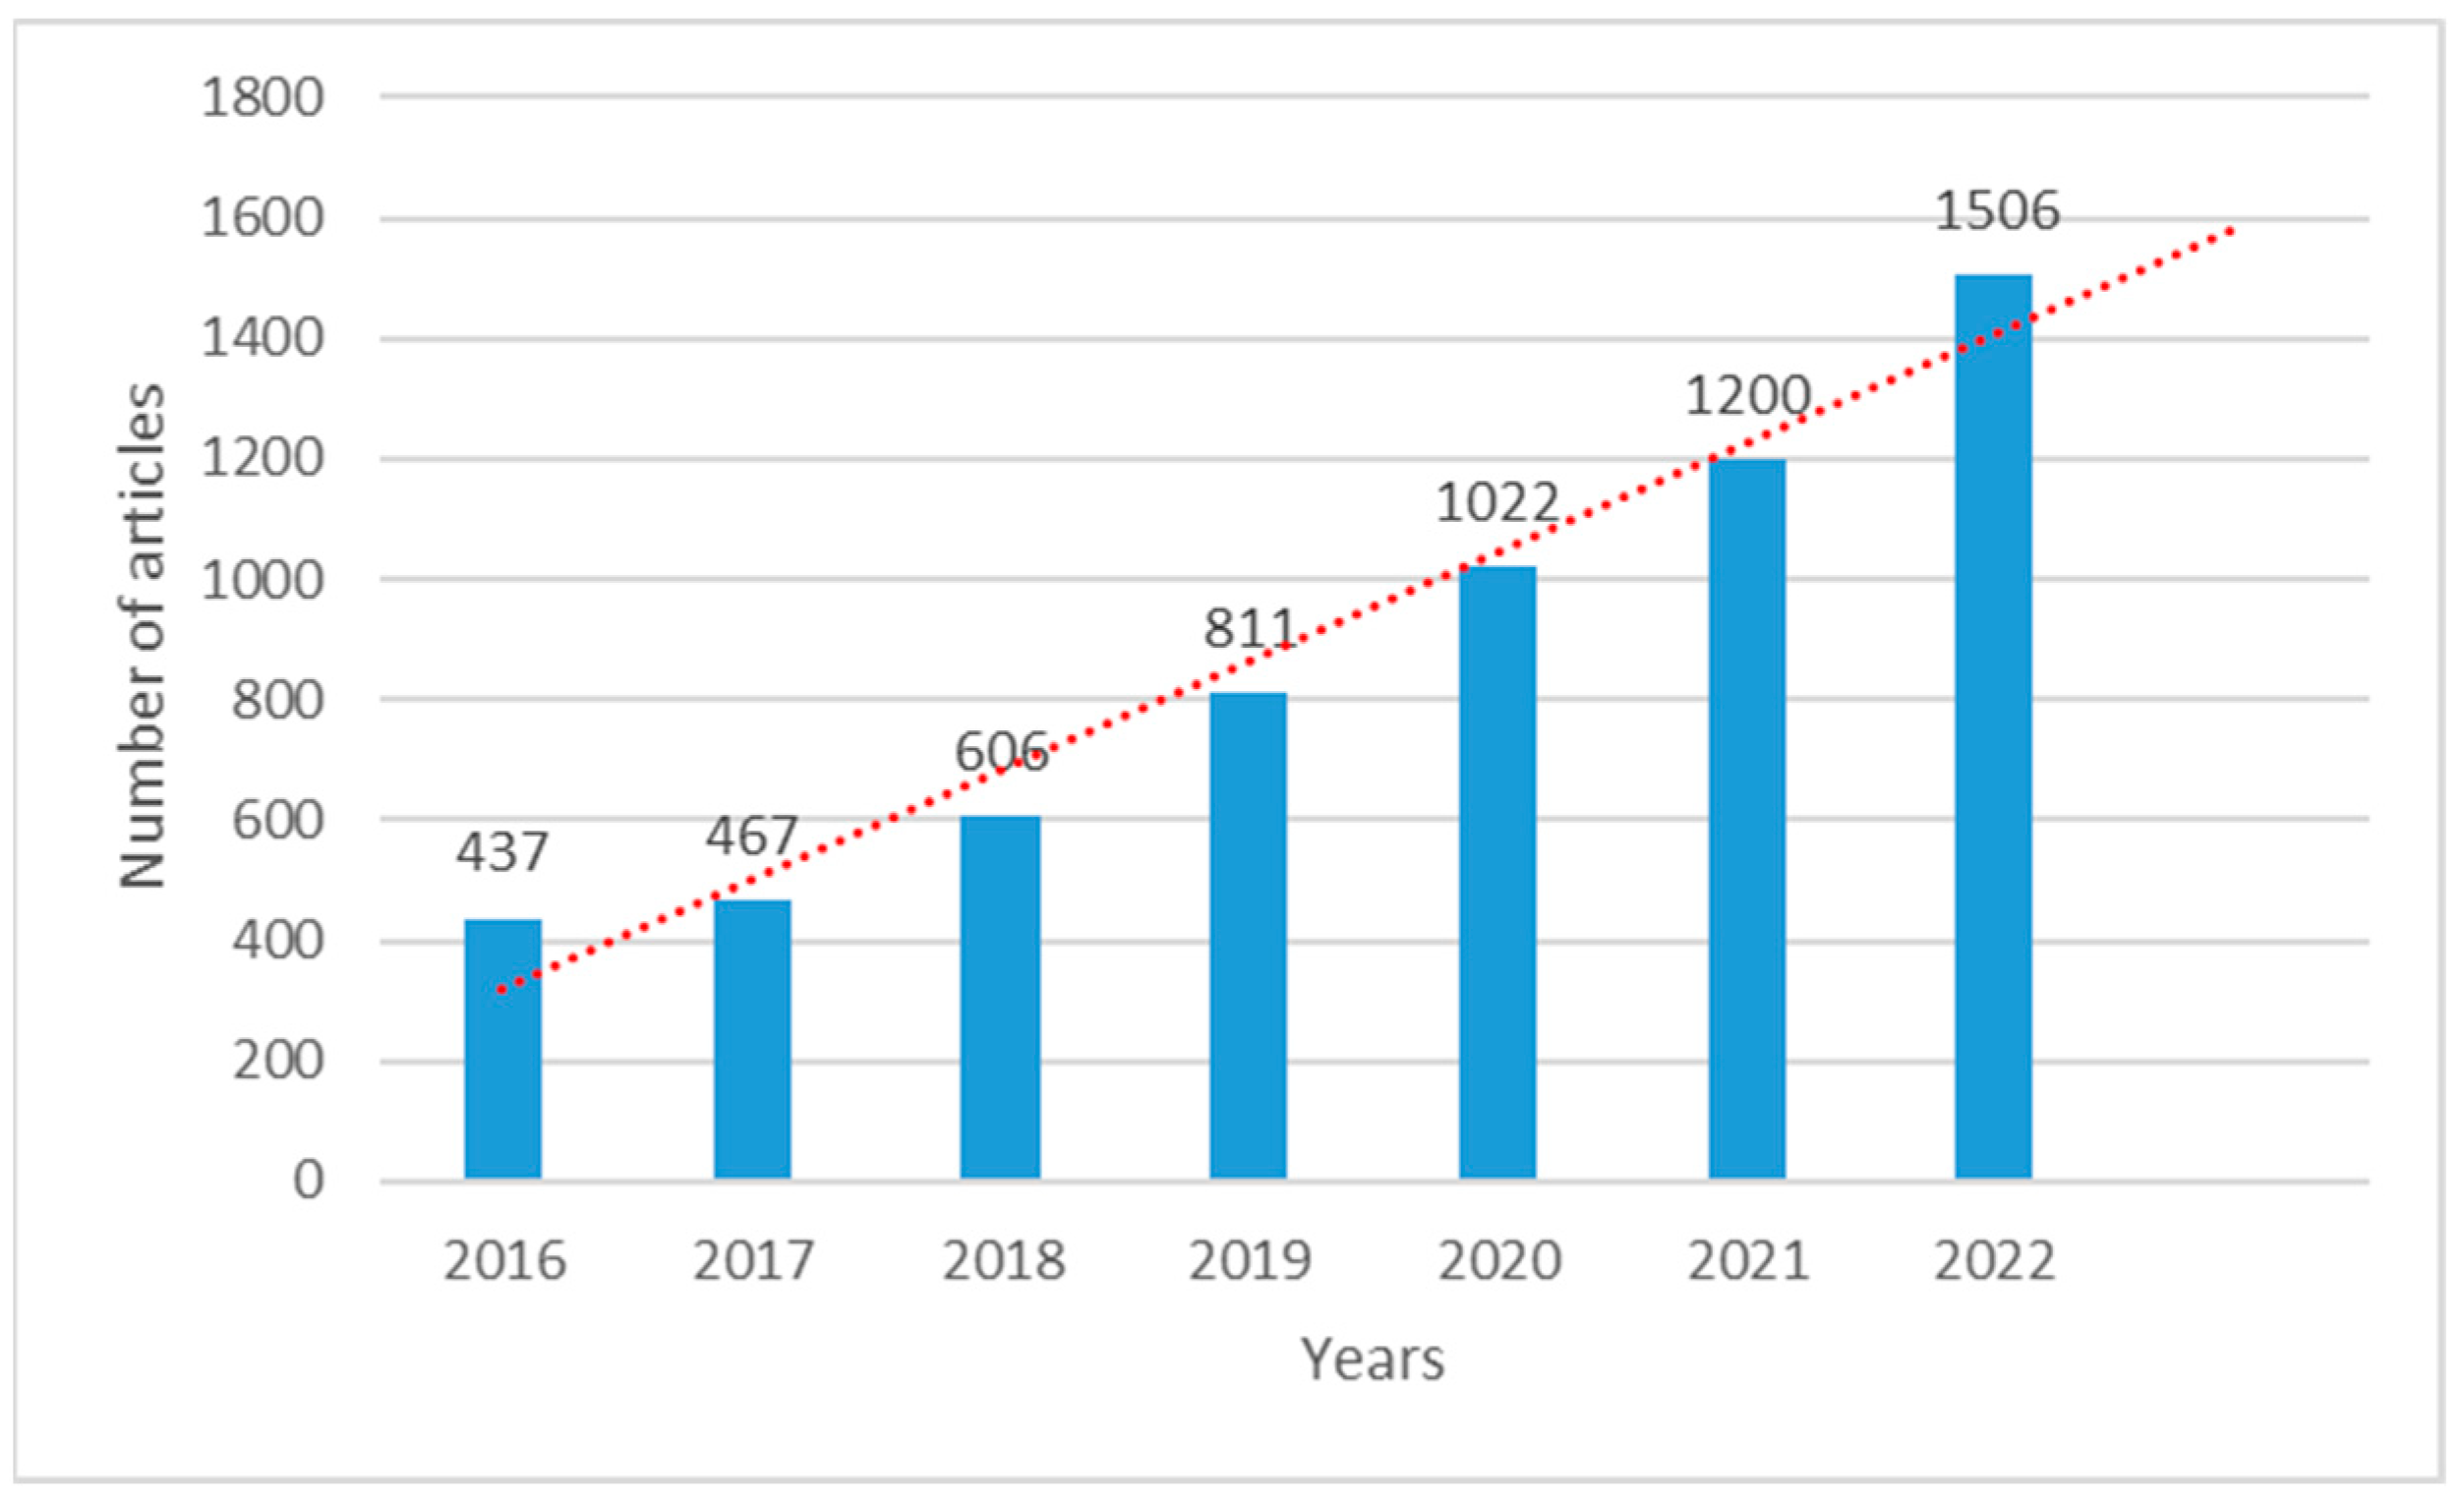
  • The study identified current research trends in remote sensing for sustainable urban development based on the analysis of 6820 articles published between 2016 and 2023.
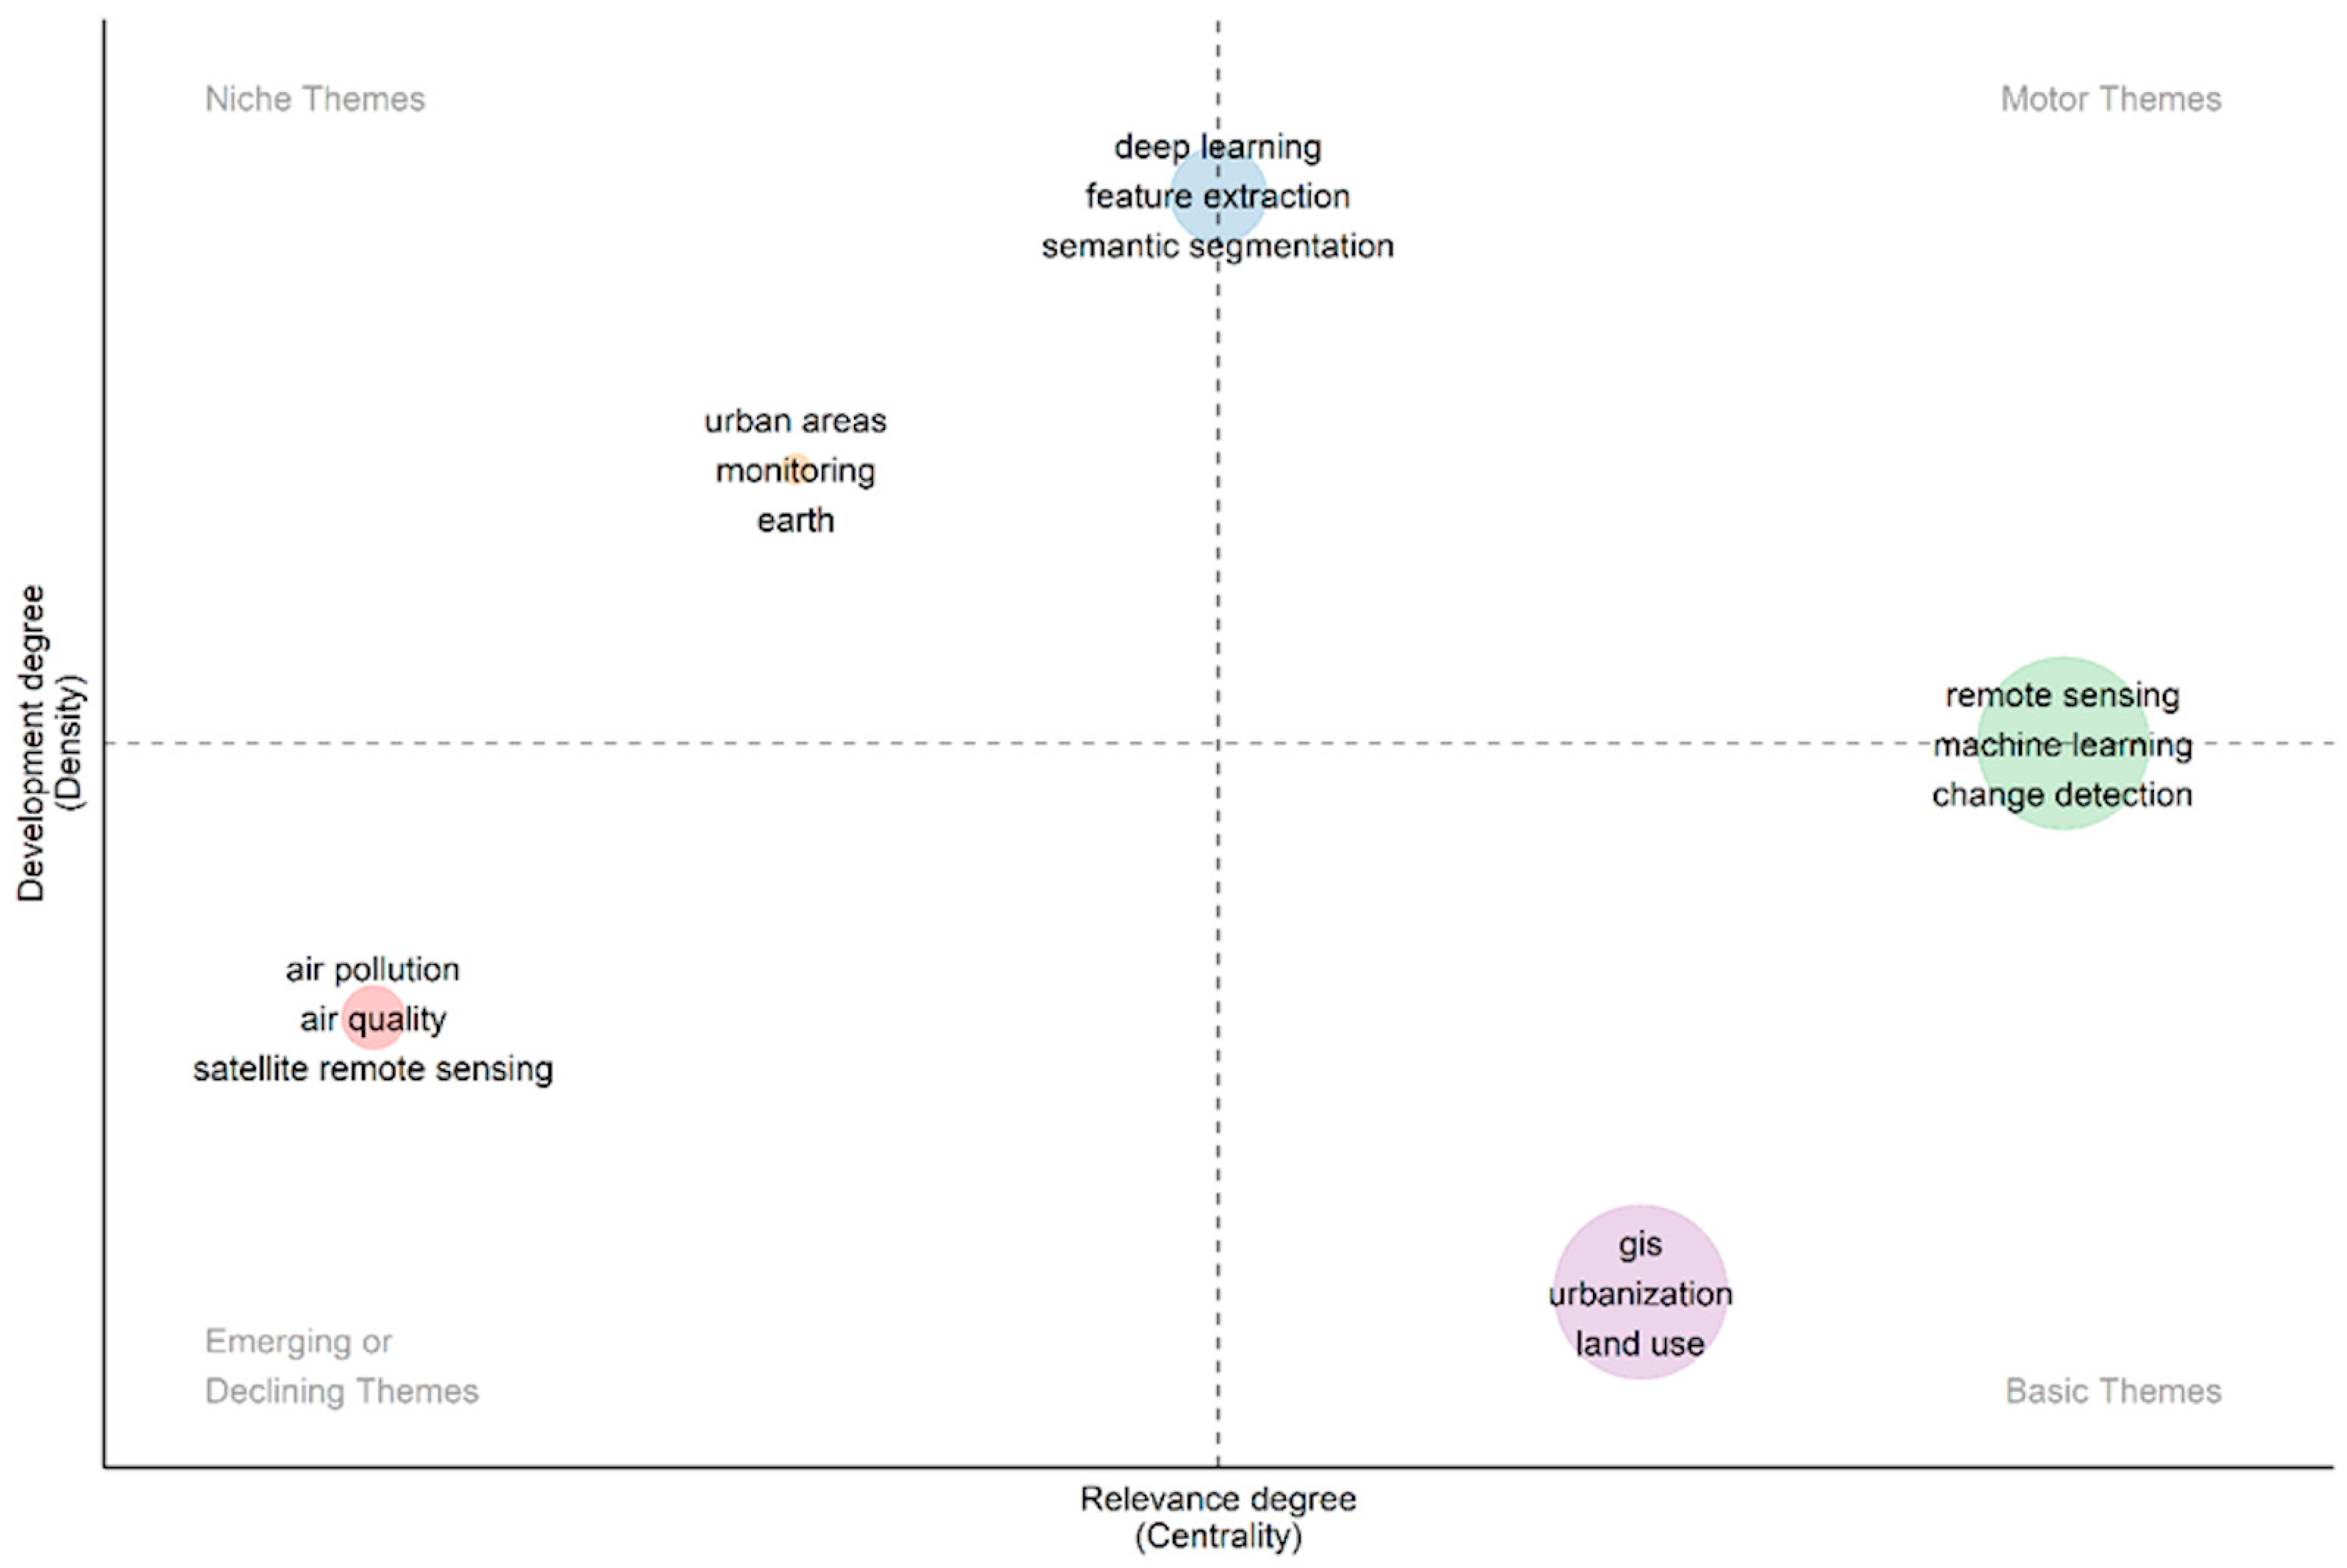
  • Research patterns were extracted from centrality and density analysis as they provide valuable insights into the relationships, significance, and developmental progress of the themes in the research collection that can be used for strategic planning and policymaking.
  • We identified areas that have received insufficient attention comparing the goal, targets, and indicators of SDG 11 to disclose directions for future research.
This article is organized as follows. In Section 2, we present the materials and methods to outline our approach to identifying relevant studies and to explain the techniques used for bibliometric assessment. The Results (Section 3) and the Discussion (Section 4) provide an in-depth analysis of our findings and discuss potential improvements. Section 5 summarizes the conclusions of the study.

2. Materials and Methods

The methodological workflow we followed in this study can be outlined as keyword selection, data acquisition and filtering, and analysis encompassing documents, authors, journals, countries, keywords, and concepts as explained in the following.

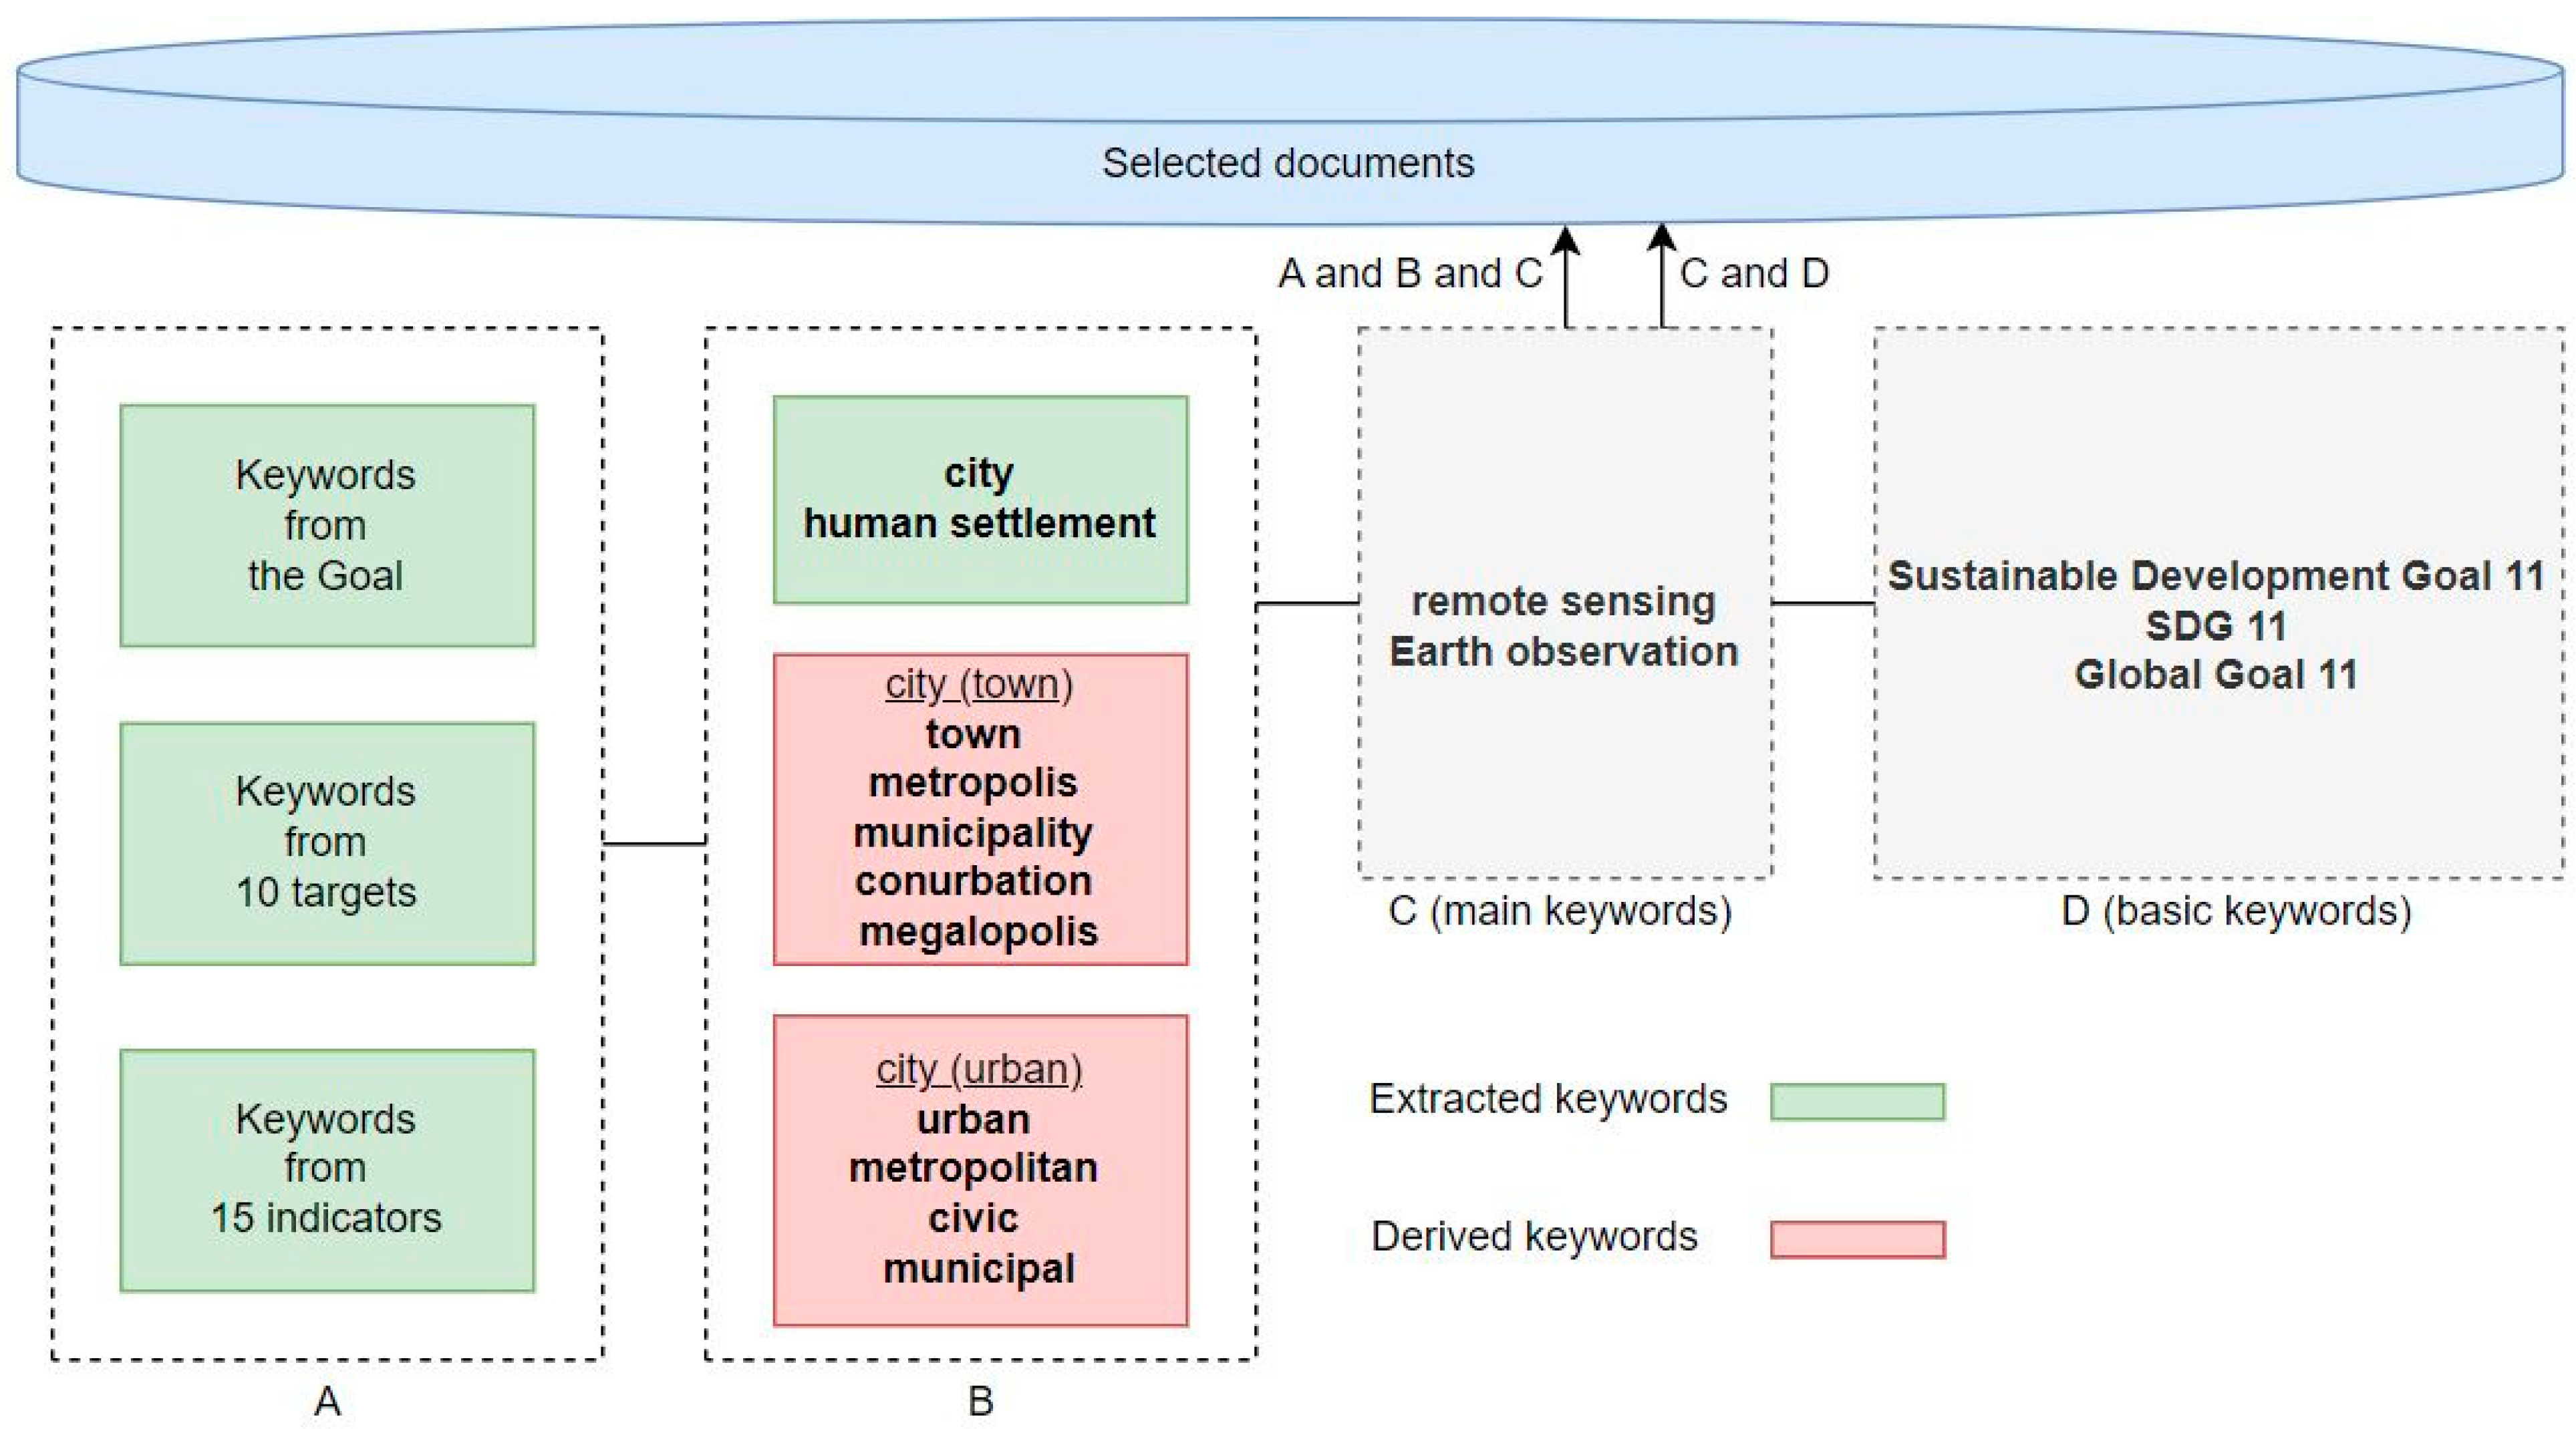
2.1. Literature Search Strategy

Keywords serve as essential bibliometric tools for the classification, retrieval, and summarization of research papers [27]. In this context, the selection of keywords and the creation of the query using them are depicted in Figure 1. We divided the keyword selection task into four main conceptual categories, referred to as clusters. The clusters were identified based on the textual content of SDG 11 (Cluster A), the terms city, human settlement, and adjective and noun synonyms for city (Cluster B), the terms remote sensing and EO (Cluster C). The fourth cluster (Cluster D) aimed to eliminate omissions resulting from linguistic differences in the term SDG 11. To derive Cluster A, we scanned the words defined in the text of SDG 11 (in the goal, targets, and indicators of SDG 11) and extracted certain words. Cluster B consisted of words like “city”, “human settlement”, and adjective and noun synonyms for city [28]. Cluster C consisted of terms “remote sensing” and “Earth observation”. Although the terms remote sensing and EO can be used interchangeably, they have a subtle difference in that the studies that focus on observing planet Earth from satellites usually prefer EO. Hence, we used both terms in our article search. Finally, Cluster D, containing different spellings of SDG 11, was formed. In this way, we could take different paths to get to the relevant articles by following a systematic approach. These clusters were then formulated using Boolean operators, as depicted in Equation (1).
(((A) AND (B) AND (C)) OR ((C) AND (D)))
Thus, the words within the goal, targets, and indicators of SDG 11, in relation to cities (also human settlements) and remote sensing (also EO), can be searched together (i.e., (A AND B AND C)). Additionally, the search combined remote sensing and EO with the term SDG 11 and its various expressions (i.e., (C AND D)). The words within the clusters were also associated with Boolean operators. In addition, the asterisk (*) wildcard was used for variant endings of some words, and the question mark (?) wildcard was used to cover all the different spellings of the term urbanization in American English and British English. With the “TS” field tag, topic terms were sought within a record’s title, abstract, author keywords, and Keywords Plus fields in the Web of Science (WoS) Core Collection database. Therefore, the query is as follows:
TS = (((“inclusive” OR “safe” OR “resilient” OR “sustainable” OR “housing” OR “basic service*” OR “slum*” OR “transport” OR “road safety” OR “urbani?ation” OR “planning” OR “management” OR “cultural heritage” OR “natural heritage” OR “disaster*” OR “environmental impact” OR “air quality” OR “waste” OR “green space*” OR “public space*” OR “national development” OR “regional development” OR “policy” OR “policies” OR “climate change” OR “Sendai Framework” OR “population” OR “informal settlement*” OR “land consumption” OR “direct participation” OR “infrastructure” OR “fine particulate matter” OR “built-up area” OR “open space” OR “territorial development”) AND (“city” OR “cities” OR “human settlement*” OR “town*” OR “metropolis*” OR “municipality” OR “municipalities” OR “conurbation*” OR “megalopoli*” OR “urban” OR “metropolitan” OR “civic” OR “municipal”) AND (“remote sensing” OR “Earth observation*”)) OR ((“remote sensing” OR “Earth observation*”) AND (“Sustainable Development Goal 11” OR “SDG 11” OR “Global Goal 11”))).

2.2. Document Filtering Criteria and Bibliometric Analysis

Filtering data in bibliometrics is of high importance as it serves to enhance data quality and accuracy. As a result, this approach produces more reliable and robust findings that benefit a wide range of individuals, from general readers to academics. In this study, four filters were applied to the data (Table 1). Field search and date filtering were applied during the extraction of the data from the WoS Core Collection database. The topic terms (including title, abstract, author keywords, and Keywords Plus) were searched across the entire record to ensure a reliable set and exclude potentially irrelevant documents. Since the SDGs came into force on 1 January 2016 [29], the period from this date to 30 June 2023 was selected for analysis. The WoS records were downloaded on 8 August 2023 as a single plain text file (consisting of 7242 articles).
In this research, the Bibliometrix R-package software (R version 4.2.0) developed by Aria and Cuccurullo [30] was utilized through a web interface named Biblioshiny. The software was designed to support quantitative analyses and offers essential algorithms for conducting statistical analysis and science mapping [31]. After uploading a single plain text file to Biblioshiny, the built-in features for filtering data by language and document type were applied. The selection was narrowed down to documents that are exclusively categorized as articles, with no additional classifications, and are written in English. Following the filtering, 6820 articles were selected for analyses from the plain text file, reducing the number of sources from 1090 to 942 and the number of authors from 21,134 to 20,076. The high volume of the dataset is such that a comprehensive and scientific bibliometric analysis cannot be carried out manually.
Here, the annual progression of scientific output is evaluated using the compound annual growth rate (CAGR) computed with Equation (2). By employing CAGR, we can effectively neutralize the effects of data volatility [32]. In the context of this article, data volatility refers to potential dramatic fluctuations in the number of publications over the years.
C A G R = ( E V B V 1 n 1 ) × 100
where EV refers to the concluding value, BV stands for the initial value, and n indicates the duration in years.
The ten most locally cited articles (local citation measures a publication’s citations within a specific subset, in this case 6820 articles) were included in the most relevant articles subheading. The number was also limited to ten for the most prolific journals in the field. The reason for this is that listing numerous articles might diffuse the main emphasis, whereas selecting too few could overlook the spectrum of significant research. In the regional analysis, the number of articles by corresponding author’s country and the number of single-country publications (SCPs) and multi-country publications (MCPs) of the countries were analyzed and the scientific collaboration between the countries was addressed.
During the conceptual analysis, the following parameters were configured: the number of words was set to 250, the minimum cluster frequency (per thousand documents) was set to five, the number of labels was set to three, and the clustering algorithm was selected as Walktrap. The foundational premise of the Walktrap algorithm [33] assumes that shorter-distance random walks tend to remain confined within a singular cluster [34]. The thematic map is informed by the density and centrality parameters, and the magnitude of the bubbles indicates the quantity of publications [35]. Callon’s centrality gauges the connection intensity between a community and others, indicating a theme’s significance in the entire collection, while density assesses the community’s internal robustness, reflecting the theme’s developmental progress [36]. The thematic map provides a visual representation of the density, displaying the robustness of the connections among all author keywords that define the research topic [37].
In the keyword analysis, first, the cumulative increase in the ten most used author keywords over the years was analyzed. Then, treemaps were created using Keywords Plus terms and terms from abstracts. Treemaps facilitate the identification of patterns that may be difficult to see using other methods, and their design allows for the space-efficient and clear presentation of a large number of items on the screen at once [38].

3. Results

In this section, we explain the main characteristics of the data obtained from the WoS search and present the results obtained from their analysis with the Biblioshiny application.

3.1. Essential Measures and Overview

Table 2 summarizes the key findings and key measures. The research dataset spans from 1 January 2016 to 30 June 2023 and includes 942 sources (journals). Within this corpus of scholarly work, 6820 individual articles were analyzed. Notably, the articles exhibit a compound annual growth rate (CAGR) of 22.90%, which is indicative of the vibrant academic landscape. The average age of the articles is 2.8 years, and each article receives an impressive average of 15.39 citations, reflecting their influential nature within the scholarly discourse. An extensive reference network is evident, with a cumulative total of 224,533 references.
In terms of content, the analysis reveals 7432 instances of Keywords Plus and 15,420 instances of author keywords. Additionally, 20,076 authors contributed to the theme. Among them, 189 authors of single-authored articles are identified, while there are 211 single-authored articles. The relatively high average of 4.84 co-authors per article indicates a high level of collaborative research activity in the context of the scholarly domain studied. Impressively, international co-authorships accounted for 31.99% of the collaborations, reflecting a global academic exchange.

3.2. Annual Scientific Contribution

The dynamic trajectory of scientific output over successive years is vividly captured in Figure 2. The trend shows a steady increase in the number of articles published, reflecting the progressive nature of scientific contributions. Starting with 437 articles in 2016, the numbers increase steadily, reaching significant peaks in 2021 and 2022 with 1200 and 1506 articles, respectively. A total of 771 articles were published in the first two quarters of 2023, demonstrating a discernible trend even within a truncated timeframe. An examination of the CAGR from 2016 to 2022 reveals a remarkable rate of 22.90%, showing a significant expansion in scientific output. However, when considering the year 2023 as if it were a full year, the CAGR adjusts to 8.45%, reflecting the impact of the year’s limited coverage on the growth rate.

3.3. Most Relevant Articles

Table 3 compiles information from the top ten most relevant articles in the field of remote sensing in relation to SDG 11, showing their publication year, local citations (LC), global citations (GC), and the LC/GC ratio. While GC uses the entire database to determine the impact of a document, LC focuses on its citations within a collection [39]. The rows in the table are sorted by the LC. The top three most locally cited articles address various aspects of urban ecological quality [40], urban land use [41], and impervious surface increase [42]. The article entitled “A new remote sensing index for assessing spatial heterogeneity in urban ecological quality: A case from Fuzhou City, China” received significant local (97) and global (220) citations, with an LC/GC ratio of 44.09%. It is important to note that the ranking of articles based on LC does not consistently match their ranking based on GC, indicating the complicated dynamics between recognition within the dataset and recognition from external sources. The citation trend indicates that novel remote sensing methods (such as the introduction of new indices) and the use of open data including crowdsourcing have gained significant attention from researchers.

3.4. Prolific Journals in the Field

Table 4 presents the journals that have made significant contributions based on the number of articles returned from our search terms. Remote Sensing leads the list with 861 articles, closely followed by Sustainability, which has published 368 articles. Land ranks third with 178 articles. Other notable journals include Science of the Total Environment, IEEE Journal of Selected Topics in Applied Earth Observations and Remote Sensing, and ISPRS International Journal of Geo-Information, each contributing 137, 136, and 135 articles, respectively. Ecological Indicators is also a significant contributor with 113 articles. Additionally, International Journal of Environmental Research and Public Health, Environmental Monitoring and Assessment, and International Journal of Applied Earth Observation and Geoinformation have contributed 97, 93, and 89 articles, respectively.

3.5. Regional Analysis

In the analysis of publications based on corresponding author countries, China leads with a total of 2895 articles, mainly from SCPs with 2179 articles (see Figure 3). The USA and India follow with 580 and 429 articles, respectively. Notably, the UK, Australia, and Malaysia have a higher proportion of MCPs, with ratios of 0.598, 0.558, and 0.625, respectively. MCP denotes the presence of at least one foreign co-author in the publication [43]. The outcomes highlight the different patterns of collaboration across countries in the area of academic publications. China has the largest academic collaboration with the USA, and it has substantial connections with the UK, Germany, and Australia. Additionally, the USA and the UK exhibit strong academic links.

3.6. Conceptual Analysis

A thematic map was constructed rooted in Callon’s metrics of centrality and density, as depicted in Figure 4. The map reflects an analysis of author keywords and the positions of the clusters can be interpreted for their relevance (centrality) and degree of development (density). The “remote sensing” cluster is situated between the motor themes and basic themes, emphasizing its pivotal and foundational status in the landscape. The “deep learning” cluster, distinguished by its high density, navigates the space between motor themes and niche themes. The “urban areas” cluster falls within the niche themes, indicating a more specialized but potentially less traversed sector. The “air pollution” cluster leans toward the emerging or declining themes. Meanwhile, the “GIS” cluster is anchored in the basic themes, highlighting its fundamental role.

3.7. Keyword Analysis

Figure 5 provides a comprehensive overview of the cumulative growth in the use of the top ten author keywords in remote sensing studies contributing to SDG 11, spanning from 2016 to 2023. A consistent upward trajectory is observable for all keywords, emphasizing the broadening interdisciplinary nature of research. The keyword “remote sensing” stands out, registering a significant surge from 148 mentions in 2016 to 2273 by 2023. Similarly, “GIS”, “urbanization”, and “land use” have shown notable growth, illustrating their pivotal roles in urban-centric studies. The post-2016 period marks the advent and swift rise of “deep learning” and “machine learning”, indicating the adoption of advanced computational techniques in remote sensing research. Meanwhile, established terms such as “Landsat” and “land surface temperature” have maintained a consistent growth pattern.
After refining the 25 most frequently used Keywords Plus terms to 22 by assimilating plural forms into their singular equivalents, a treemap chart was produced (see Figure 6). Dominating this visualization is the term “impact” with a frequency of 1015, closely followed by “city” with 977 occurrences. Urban themes are evidently central, as seen with “urbanization” recorded 763 times and “area” 730 times. The analytical technique of “classification” has been referred to 711 times. The term “China” emerges 567 times, emphasizing a regional focus. Rounding out the list, “dynamics” appears 540 times, “model” 419 times, “climate change” 392 times, and “GIS” is noted 362 times.
Continuing from the previous analysis, we delved into another treemap, this time spotlighting the 25 dominant bi-gram terms (N-gram: 2) sourced from the abstracts (refer to Figure 7). The term “remote sensing” stood out with 5993 mentions, succeeded by “land cover” with 1834, “sensing data” with 1177, “surface temperature” with 1034 mentions, and “urban expansion” noted 997 times. Diving deeper into the treemap, terms such as “urban planning”, “urban heat”, “sustainable development”, and “climate change” emerge, indicative of key thematic undertones, further reflecting the prominence of urban and environmental concerns in the dataset.

4. Discussion

In this study, we analyzed the contribution of remote sensing research to urban sustainability, specifically focusing on SDG 11, based on a bibliometric analysis of 6820 articles published in WoS-indexed journals between 1 January 2016 and 30 June 2023. The steady rise in the number of articles within this dataset during this period demonstrated the evolving importance of remote sensing studies in contributing to SDG 11. This growth was highlighted by a CAGR of 22.90% until 2022. Another bibliometric study on all 17 SDGs carried out by Ali et al. [44] indicated a similar increase in the numbers of publications in both Scopus and the WoS databases. They also mapped the trends in the distribution of SDGs in WoS-indexed papers. According to their results, nine other SDGs (SDG 3, 2, 1, 4, 6, 5, 7, 17, 12) received more attention than SDG 11.
We utilized Bibliometrix R-package software for our analysis and presented the results based on article metadata, annual scientific contribution as indicated by the CAGR, the ten most relevant articles, prolific journals in the field, regional and conceptual analyses, and keyword analysis. The search keywords were selected based on a review of the goal, targets, and indicators of SDG 11, alternative uses of the term “city”, and the terms RS and EO. Four keyword clusters were identified with this method (Cluster A: Inclusive, safe, resilient, sustainable, housing, basic service*, slum*, transport, road safety, urbani?ation, planning, management, cultural heritage, natural heritage, disaster*, environmental impact, air quality, waste, green space*, public space*, national development, regional development, policy, policies, climate change, Sendai Framework, population, informal settlement*, land consumption, direct participation, infrastructure, fine particulate matter, built-up area, open space, territorial development; Cluster B: city, cities, human settlement*, town*, metropolis*, municipality, municipalities, conurbation*, megalopoli*, urban, metropolitan, civic, municipal; Cluster C: remote sensing, Earth observation*; and Cluster D: Sustainable Development Goal 11, SDG 11, Global Goal 11). The main findings of the study are summarized in Table 5.
In our analysis of the domain-specific citation metrics from the table (Table 3), there is a clear inclination toward articles that address urban ecological quality, land utilization patterns, and transformations in impervious surfaces emerges, as exemplified by works such as Hu and Xu [40], Hu et al. [41], and Xu et al. [42]. The article titled “A new remote sensing index for assessing spatial heterogeneity in urban ecological quality: A case from Fuzhou City, China” received the highest LC (97 citations) and a high GC (220 citations). Its LC/GC ratio of 44.09% suggests a balanced recognition by local and wider scientific communities. However, a key observation is the discrepancy between LC and GC rankings for different articles. The study centered on the English Bazar Municipality, which occupies the fourth place in Table 3 with an LC/GC ratio of 26.07%, indicating increased interest within regionalized academic circles, particularly regarding the nexus of urban transformations and their consequential environmental impact [45]. Concurrently, the contribution by Zhu et al. [46], holding the fifth position in LC within the table, demonstrates refined strategic directions for urban remote sensing. This paper has an elevated LC/GC ratio of 36.75%, illustrating its role in global urbanization trends. These differences in the LC and GC rankings not only shed light on different regional academic preferences, but also highlight the broader dynamics shaping research priorities and their global reception.
The most prolific journals in this field were found to be Remote Sensing, Sustainability, and Land aligning with the multidisciplinary nature of these studies. Regionally, China’s leadership in the number of publications indicates an increasing emphasis on remote sensing data and methods, likely driven by urban expansion, environmental monitoring needs, and policy directives. International collaborations, particularly those involving China, the USA, and the UK, reflect a global research ecosystem that transcends geopolitical boundaries.
Given their dual nature as both basic and motor themes, the centrality of “remote sensing”, “machine learning”, and “change detection” themes underlines their pivotal importance in the context of this study. The clusters “deep learning” and “urban areas” highlight the convergence of advanced computational models with urban-centered research. The fluctuating importance of the “air pollution” cluster can be attributed to evolving global events or shifts in research priorities. Nevertheless, its presence emphasizes the critical nature of environmental concerns increasingly expressed worldwide.
On the other hand, the increasing use of terms such as “deep learning” and “machine learning” points to the interdisciplinary nature of remote sensing research, combining conventional geospatial techniques with cutting-edge computational models, as emphasized in the strategic directions paper by Zhu et al. [46]. The increasing emphasis on urban sustainability, particularly within SDG 11, is reflected in the evolving keyword landscape of remote sensing studies between 2016 and 2023. The rising prominence of keywords like “remote sensing”, “GIS”, “urbanization”, and “land use” demonstrates the intersections between geospatial technologies and urban-focused research. Terms such as “Landsat” and “land surface temperature” point out the relevance of foundational remote sensing tools. Landsat TM imagery, with its 30 m resolution images and accessible thermal infrared (TIR) band (120 m resolution), is commonly obtained at no cost from the United States Geological Survey (USGS) for land surface temperature analysis [47]. Moreover, the dominance of terms such as “impact”, “city”, and “urbanization” in the Keywords Plus analysis indicates the involvement of urban dynamics and the implications for sustainable growth. Notably, the emergence of “China” as a recurrent word suggests the geographic centrality of this region, which reflects its rapid urban transformations or proactive engagement with SDG 11 initiatives. Additionally, the prevalence of bi-gram terms from the abstracts, with “remote sensing”, “land cover”, and “urban expansion” at the forefront, reinforces the integrative approach researchers are adopting, blending traditional remote sensing methods with a focus on urban sustainability and environmental implications.
Considering the search terms derived from the analysis of the goal, targets, and indicators of SDG 11 (i.e., inclusive, safe, resilient, sustainable, housing, basic service, slum, transport, road safety, urbanization, planning, management, etc.) and the keyword analysis results compared in Section 3.7 and Figure 6, it was observed that the main gaps were in regional development, planning, disaster, resilience, natural and cultural heritage, housing, air quality, and inclusiveness, where remote sensing data and methods can make significant contributions. When the search terms were compared with the most frequently used words in the abstracts (Figure 7), it was found that “air quality” was mentioned 556 times and “urban planning” was mentioned 888 times. Although “inclusiveness” was not clearly identified in the keyword analysis, crowdsourcing emerged as a passive form for such efforts. However, the remaining keywords mentioned above were absent from this list as well (regional development, disaster, resilience, natural and cultural heritage, housing, and inclusiveness).
While this study provides a comprehensive analysis of the research landscape from 2016 to 2023 based on a dataset of 6820 articles, it has some limitations that need addressing. The research primarily relies on quantitative metrics, potentially overlooking the qualitative aspects and subjective interpretations of individual articles. The temporal constraint, where 2023 data encompass only the first half of the year, may introduce bias in the annual growth trends, evident in the adjusted CAGR value. Additionally, the focus on articles from 942 journals might unintentionally exclude emerging or niche journals and publications, limiting the breadth of academic voices. A significant limitation arises from the language constraint, as the study prioritizes articles published in English, potentially missing relevant findings and discussions presented in other languages. Lastly, inherent biases in citation practices within academia, such as favoring well-established journals [48] or certain geographies [49], may influence the perceived impact or relevance of certain articles.
Finally, aligning with SDG 11 (sustainable cities and communities) highlights the role of remote sensing in informing real-world policy decisions and urban planning, not only in academia. As urbanization accelerates globally, remote sensing provides invaluable tools and methods to ensure that growth is aligned with sustainability principles. The apparent mention of “China” in Keywords Plus may also indicate a potential regional focus leading to more detailed, city-specific remote sensing studies.

5. Conclusions

In this study, we analyzed remote sensing and Earth observation studies in the context of their contribution to SDG 11. The analysis of 6820 articles published between 2016 and 2023 indicated an upward trend in the field, which also revealed the central role of geospatial technologies in guiding the future of cities. Articles were selected based on a refined WoS search strategy employing an expanded set of keywords derived from the analysis of the goal, targets, and indicators of SDG 11 together with widely used synonyms for the word city. Region-specific trends, particularly the rise of China in publications, reflect the global intersection of urban transformations, environmental priorities, and sustainability agendas.
When comparing the Keywords Plus analysis results and the frequently used words, it was observed that insufficient attention was given to regional development, disaster, resilience, natural and cultural heritage, housing, and inclusiveness. Remote sensing data and methods can contribute to these topics and future researchers can consider addressing these gaps in these areas to achieve SDG 11. Based on the conceptual analysis, the motor themes were found to be machine learning, deep learning, change detection, feature extraction, and semantic segmentation. Novel analytical methods and the utilization of open data, including crowdsourcing, were among the most commonly referenced methods.
While this study has revealed many trends, it is important to be aware of its limitations, including linguistic constraints and potential academic citation bias. Future directions in remote sensing research related to SDG 11 should focus on a more inclusive and diverse approach, in light of the findings and identified gaps. Including publications written in languages other than English and exploring additional academic platforms, such as Scopus, can provide a holistic view of global research trends, capturing voices from diverse geographic and cultural contexts. In addition, the integration of advanced AI tools can refine and deepen the analyses, providing insights into urban transformations, environmental priorities, and sustainability agendas.

Author Contributions

Conceptualization, methodology, validation, writing—original draft preparation, O.E., S.K.; software, data curation, investigation, visualization, O.E.; writing—review and editing, supervision, S.K. All authors have read and agreed to the published version of the manuscript.

Funding

This research received no external funding.

Institutional Review Board Statement

Not relevant.

Informed Consent Statement

Not relevant.

Data Availability Statement

The data used in the study can be shared upon request.

Acknowledgments

This study is part of the Ph.D. thesis research of Omer Ekmen.

Conflicts of Interest

The authors declare no conflict of interest.

References

  1. WHO. Health in 2015: From MDGs, Millennium Development Goals to SDGs, Sustainable Development Goals; WHO: Geneva, Switzerland, 2015. [Google Scholar]
  2. Opoku, A. SDG2030: A sustainable built environment’s role in achieving the post-2015 United Nations Sustainable Development Goals. In Proceedings of the 32nd Annual ARCOM Conference, Manchester, UK, 5–7 September 2016; Chan, W., Neilson, C.J., Eds.; Association of Researchers in Construction Management. Volume 2, pp. 1149–1158. [Google Scholar]
  3. Han, L.; Lu, L.; Lu, J.; Liu, X.; Zhang, S.; Luo, K.; He, D.; Wang, P.; Guo, H.; Li, Q. Assessing Spatiotemporal Changes of SDG Indicators at the Neighborhood Level in Guilin, China: A Geospatial Big Data Approach. Remote. Sens. 2022, 14, 4985. [Google Scholar] [CrossRef]
  4. UNSTATS. SDG Indicators. Available online: https://unstats.un.org/sdgs/indicators/indicators-list (accessed on 15 September 2023).
  5. Berisha, E.; Caprioli, C.; Cotella, G. Unpacking SDG target 11. a: What is it about and how to measure its progress? City Environ. Interact. 2022, 14, 100080. [Google Scholar] [CrossRef]
  6. UN. World Urbanization Prospects: The 2014 Revision, Highlights. ST/ESA/SER. A/352 2014. ISBN 978-92-1-151517-6. Available online: https://population.un.org/wup/Publications/Files/WUP2014-Highlights.pdf (accessed on 10 November 2023).
  7. Fussell, J.; Rundquist, D.; Harrington, J.A. On defining remote sensing. Photogramm. Eng. Remote Sens. 1986, 52, 1507–1511. [Google Scholar]
  8. Estoque, R.C. A Review of the sustainability concept and the state of SDG monitoring using remote sensing. Remote Sens. 2020, 12, 1770. [Google Scholar] [CrossRef]
  9. EO4SDG: Earth Observations in Service of the 2030 Agenda for Sustainable Development. Strategic Implementation Plan 2020–2024. Available online: https://earthobservations.org/documents/gwp20_22/eo_for_sustainable_development_goals_ip.pdf (accessed on 15 September 2023).
  10. Zhang, L.; Ling, J.; Lin, M. Artificial intelligence in renewable energy: A comprehensive bibliometric analysis. Energy Rep. 2022, 8, 14072–14088. [Google Scholar] [CrossRef]
  11. Oladinrin, O.T.; Arif, M.; Rana, M.Q.; Gyoh, L. Interrelations between construction ethics and innovation: A bibliometric analysis using VOSviewer. Constr. Innov. 2023, 23, 505–523. [Google Scholar] [CrossRef]
  12. Basu, M.; Dasgupta, R. Where Do We Stand Now? A Bibliometric Analysis of Water Research in Support of the Sustainable Development Goal 6. Water 2021, 13, 3591. [Google Scholar] [CrossRef]
  13. Yeh, S.-C.; Hsieh, Y.-L.; Yu, H.-C.; Tseng, Y.-H. The trends and content of research related to the sustainable development goals: A systemic review. Appl. Sci. 2022, 12, 6820. [Google Scholar] [CrossRef]
  14. Sreenivasan, A.; Suresh, M.; Nedungadi, F. Mapping analytical hierarchy process research to sustainable development goals: Bibliometric and social network analysis. Heliyon 2023, 9, e19077. [Google Scholar] [CrossRef] [PubMed]
  15. Singh, A.; Kanaujia, A.; Singh, V.K.; Vinuesa, R. Artificial intelligence for Sustainable Development Goals: Bibliometric patterns and concept evolution trajectories. Sustain. Dev. 2023. [Google Scholar] [CrossRef]
  16. Mishra, M.; Desul, S.; Santos, C.A.G.; Mishra, S.K.; Kamal, A.H.M.; Goswami, S.; Kalumba, A.M.; Biswal, R.; da Silva, R.M.; dos Santos, C.A.C.; et al. A bibliometric analysis of sustainable development goals (SDGs): A review of progress, challenges, and opportunities. Environ. Dev. Sustain. 2023, 1–43. [Google Scholar] [CrossRef]
  17. Pukelis, L.; Puig, N.B.; Skrynik, M.; Stanciauskas, V. OSDG—Open-Source Approach to Classify Text Data by UN Sustainable Development Goals (SDGs). arXiv 2020, arXiv:2005.14569. [Google Scholar]
  18. Pukelis, L.; Bautista-Puig, N.; Statulevičiūtė, G.; Stančiauskas, V.; Dikmener, G.; Akylbekova, D. OSDG 2.0: A multilingual tool for classifying text data by UN Sustainable Development Goals (SDGs). arXiv 2022, arXiv:2211.11252. [Google Scholar]
  19. Duan, P.; Wang, Y.; Yin, P. Remote sensing applications in monitoring of protected areas: A bibliometric analysis. Remote Sens. 2020, 12, 772. [Google Scholar] [CrossRef]
  20. Ogashawara, I. Bibliometric analysis of remote sensing of inland waters publications from 1985 to 2020. Geographies 2021, 1, 346–361. [Google Scholar] [CrossRef]
  21. Viana, J.; Santos, J.V.; Neiva, R.M.; Souza, J.; Duarte, L.; Teodoro, A.C.; Freitas, A. Remote sensing in human health: A 10-year bibliometric analysis. Remote Sens. 2017, 9, 1225. [Google Scholar] [CrossRef]
  22. Wang, L.J.; Zhang, G.M.; Wang, Z.Y.; Liu, J.G.; Shang, J.L.; Liang, L. Bibliometric analysis of remote sensing research trend in crop growth monitoring: A case study in China. Remote Sens. 2019, 11, 809. [Google Scholar] [CrossRef]
  23. Xiao, P.; Qian, P.; Xu, J.; Lu, M. A Bibliometric Analysis of the Application of Remote Sensing in Crop Spatial Patterns: Current Status, Progress and Future Directions. Sustainability 2022, 14, 4104. [Google Scholar] [CrossRef]
  24. Guo, J.; Peng, X. Status of research on Sustainable Development Goal 11: A visual analysis using citespace and ArcGIS. Int. J. Sustain. Dev. World Ecol. 2023, 30, 713–725. [Google Scholar] [CrossRef]
  25. Jain, A.; Gue, I.H.; Jain, P. Research trends, themes, and insights on artificial neural networks for smart cities towards SDG-11. J. Clean. Prod. 2023, 412, 137300. [Google Scholar] [CrossRef]
  26. Wang, D.; Dong, L.; Di, S. Data-driven comparison of urban sustainability towards sustainable urban development under sustainable development goals (SDGs): A review based on bibliometric analysis. Front. Energy Res. 2023, 11, 1168126. [Google Scholar] [CrossRef]
  27. Knudson, D. Top Google Scholar citations to kinesiology-related terms. Int. J. Kinesiol. High. Educ. 2023, 7, 122–129. [Google Scholar] [CrossRef]
  28. Collins English Thesaurus. Available online: https://www.collinsdictionary.com/dictionary/english-thesaurus/city (accessed on 15 September 2023).
  29. McIntyre, O. International water law and SDG 6: Mutually reinforcing paradigms. In Sustainable Development Goals; French, D., Kotzé, L., Eds.; Edward Elgar Publishing Limited: Cheltenham, Glos, UK, 2018; pp. 173–200. ISBN 9781786438751. [Google Scholar] [CrossRef]
  30. Aria, M.; Cuccurullo, C. bibliometrix: An R-tool for comprehensive science mapping analysis. J. Informetr. 2017, 11, 959–975. [Google Scholar] [CrossRef]
  31. Agbo, F.J.; Oyelere, S.S.; Suhonen, J.; Tukiainen, M. Scientific production and thematic breakthroughs in smart learning environments: A bibliometric analysis. Smart Learn. Environ. 2021, 8, 1. [Google Scholar] [CrossRef]
  32. Collazzo, P.; Taieb, L. Fast-Growth Economies and the Determinants of Competitiveness in Latin America and the Caribbean. In Proceedings of the 11th edition of Strategica International Conference: Local versus Global, Bucharest, Romania, 29–30 October 2015; pp. 437–450. [Google Scholar]
  33. Pons, P.; Latapy, M. Computing communities in large networks using random walks. J. Graph Algorithms Appl. 2006, 10, 191–218. [Google Scholar] [CrossRef]
  34. Lee, Y.; Lee, Y.; Seong, J.; Stanescu, A.; Hwang, C.S. A comparison of network clustering algorithms in keyword network analysis: A case study with geography conference presentations. Int. J. Geospat. Environ. Res. 2020, 7, 1. [Google Scholar]
  35. Rey-Álvarez, B.; Sánchez-Montañés, B.; García-Martínez, A. Building material toxicity and life cycle assessment: A systematic critical review. J. Clean. Prod. 2022, 341, 130838. [Google Scholar] [CrossRef]
  36. Yu, Y.; Jin, Z.; Qiu, J. Global Isotopic Hydrograph Separation Research History and Trends: A Text Mining and Bibliometric Analysis Study. Water 2021, 13, 2529. [Google Scholar] [CrossRef]
  37. Mumu, J.R.; Tahmid, T.; Azad, M.A.K. Job satisfaction and intention to quit: A bibliometric review of work-family conflict and research agenda. Appl. Nurs. Res. 2021, 59, 151334. [Google Scholar] [CrossRef]
  38. Long, L.K.; Hui, L.C.; Fook, G.Y.; Zainon, W.M.N.W. A study on the effectiveness of tree-maps as tree visualization techniques. Procedia Comput. Sci. 2017, 124, 108–115. [Google Scholar] [CrossRef]
  39. Ciavolino, E.; Aria, M.; Cheah, J.-H.; Roldán, J.L. A tale of PLS structural equation modelling: Episode I—A bibliometrix citation analysis. Soc. Indic. Res. 2022, 164, 1323–1348. [Google Scholar] [CrossRef]
  40. Hu, X.; Xu, H. A new remote sensing index for assessing the spatial heterogeneity in urban ecological quality: A case from Fuzhou City, China. Ecol. Indic. 2018, 89, 11–21. [Google Scholar] [CrossRef]
  41. Hu, T.; Yang, J.; Li, X.; Gong, P. Mapping urban land use by using Landsat images and open social data. Remote Sens. 2016, 8, 151. [Google Scholar] [CrossRef]
  42. Xu, H.; Wang, M.; Shi, T.; Guan, H.; Fang, C.; Lin, Z. Prediction of ecological effects of potential population and impervious surface increases using a remote sensing based ecological index (RSEI). Ecol. Indic. 2018, 93, 730–740. [Google Scholar] [CrossRef]
  43. Krčál, M.; Zareravasan, A. Bibliometric Analysis of IT/IS Investment Research. In Proceedings of the 4th Int Conf on Business, Management & Economics, Berlin, Germany, 15–17 December 2020. [Google Scholar]
  44. Ali, S.M.; Appolloni, A.; Cavallaro, F.; D’adamo, I.; Di Vaio, A.; Ferella, F.; Gastaldi, M.; Ikram, M.; Kumar, N.M.; Martin, M.A.; et al. Development Goals towards Sustainability. Sustainability 2023, 15, 9443. [Google Scholar] [CrossRef]
  45. Pal, S.; Ziaul, S. Detection of land use and land cover change and land surface temperature in English Bazar urban center. Egypt. J. Remote. Sens. Space Sci. 2017, 20, 125–145. [Google Scholar] [CrossRef]
  46. Zhu, Z.; Zhou, Y.; Seto, K.C.; Stokes, E.C.; Deng, C.; Pickett, S.T.; Taubenböck, H. Understanding an urbanizing planet: Strategic directions for remote sensing. Remote Sens. Environ. 2019, 228, 164–182. [Google Scholar] [CrossRef]
  47. Liu, L.; Zhang, Y. Urban heat island analysis using the Landsat TM Data and ASTER data: A case study in Hong Kong. Remote Sens. 2011, 3, 1535–1552. [Google Scholar] [CrossRef]
  48. Paris, G.; De Leo, G.; Menozzi, P.; Gatto, M. Region-based citation bias in science. Nature 1998, 396, 210. [Google Scholar] [CrossRef] [PubMed]
  49. Taşkın, Z.; Taşkın, A.; Doğan, G.; Kulczycki, E. Factors affecting time to publication in information science. Scientometrics 2022, 127, 7499–7515. [Google Scholar] [CrossRef]
Figure 1. Systematic process of keyword selection and query formulation. Cluster A represents the textual content of SDG 11. Cluster B contains the terms “city”, “human settlement”, and adjective and noun synonyms for city. Cluster C includes the terms “remote sensing” and “Earth observation”. Cluster D encompasses various expressions of the term “SDG 11”.
Sustainability 15 16094 g001
Figure 2. Article production trends between 2016 and 2022.
Sustainability 15 16094 g002
Figure 3. Publication distribution by country: analyzing single-country vs. multi-country collaborations.
Sustainability 15 16094 g003
Figure 4. Thematic intersections of centrality and density in author keywords.
Sustainability 15 16094 g004
Figure 5. Cumulative growth of author keywords in SDG 11-related remote sensing studies.
Sustainability 15 16094 g005
Figure 6. Insights from Keywords Plus.
Sustainability 15 16094 g006
Figure 7. Insights from abstracts.
Sustainability 15 16094 g007
Table 1. Data retrieval filters applied in the study.
Type of FilteringRemark
Sustainability 15 16094 i001 Field searchSearch was conducted in the fields of title, abstract, author keywords, and Keywords Plus.
Sustainability 15 16094 i002 DateThe specified date range encompassed the period from 1 January 2016 to 30 June 2023.
Sustainability 15 16094 i003 Document typeThe document type was restricted exclusively to articles.
Sustainability 15 16094 i004 LanguageEnglish-language articles were chosen.
Table 2. The main characteristics of the data used in the study.
Description Results
Main information about dataTimespanJanuary 2016–June 2023
Sources942
Articles6820
CAGR % (excluding the year 2023)22.90
Document average age (years)2.8
Average citations per document15.39
References224,533
KeywordsKeywords Plus7432
Author keywords15,420
AuthorsAuthors20,076
Authors of single-authored documents189
Author collaboration Single-authored documents211
Co-authors per document4.84
International co-authorships %31.99
Table 3. Mostly cited articles sorted by local citations.
Article TitlesYearLCGCLC/GC Ratio (%)
A new remote sensing index for assessing the spatial heterogeneity in urban ecological quality: A case from Fuzhou City, China20189722044.09
Mapping Urban Land Use by Using Landsat Images and Open Social Data20168725733.85
Prediction of ecological effects of potential population and impervious surface increases using a remote sensing based ecological index (RSEI)20188317347.98
Detection of land use and land cover change and land surface temperature in English Bazar urban centre20177328026.07
Understanding an urbanizing planet: Strategic directions for remote sensing20196116636.75
Characterizing the relationship between land use land cover change and land surface temperature20176029320.48
Impact of land use change and urbanization on urban heat island in Lucknow city, Central India. A remote sensing based estimate20176022127.15
Classifying urban land use by integrating remote sensing and social media data20175919430.41
Sensing spatial distribution of urban land use by integrating points-of-interest and Google Word2Vec model20175525421.65
40-Year (1978–2017) human settlement changes in China reflected by impervious surfaces from satellite remote sensing20195124420.90
Table 4. Most relevant journals.
JournalsN. of Articles
Remote Sensing861
Sustainability368
Land178
Science of the Total Environment137
IEEE Journal of Selected Topics in Applied Earth Observations and Remote Sensing136
ISPRS International Journal of Geo-Information135
Ecological Indicators113
International Journal of Environmental Research and Public Health97
Environmental Monitoring and Assessment93
International Journal of Applied Earth Observation and Geoinformation89
Table 5. Summary of the study findings.
AnalysisCriteriaFinding
Most relevant articlesLocal citations (LC)“A new remote sensing index for assessing the spatial heterogeneity in urban ecological quality: A case from Fuzhou City, China” by Hu and Xu [40] (top LC)
“Mapping Urban Land Use by Using Landsat Images and Open Social Data” by Hu et al. [41]
“Prediction of ecological effects of potential population and impervious surface increases using a remote sensing based ecological index (RSEI)” by Xu et al. [42]
Most prolific journalsNumber of articles returnedRemote Sens. (861), Sustain. (368), Land (178), Sci. Total Env. (137), IEEE J. Sel. Top. Appl. Earth Observ. Remote Sens. (136), ISPRS Int. J. Geo-Inf. (135), Ecol. Indic. (113), Int. J. Environ. Res. Public Health (97), Environ. Monit. Assess. (93), Int. J. Appl. Earth Observ. Geoinf. (89)
Regional analysisCorresponding author countriesSCP: China (2895), USA (580), India (429)
MCP/SCP ratio: Malaysia (0.625), UK (0.598), Australia (0.558)
Conceptual analysisCallon’s metrics of centrality and densityMotor themes (high centrality and density):
(a)
semi-basic motor (or foundational motor) themes: remote sensing, machine learning, change detection
(b)
semi-niche motor themes: deep learning, feature extraction, semantic segmentation

Basic themes (high centrality, low density): GIS, urbanization, land use
Emerging or declining themes (low centrality and low density): air pollution, air quality, satellite remote sensing
Niche themes (low centrality, high density): urban areas, monitoring, Earth
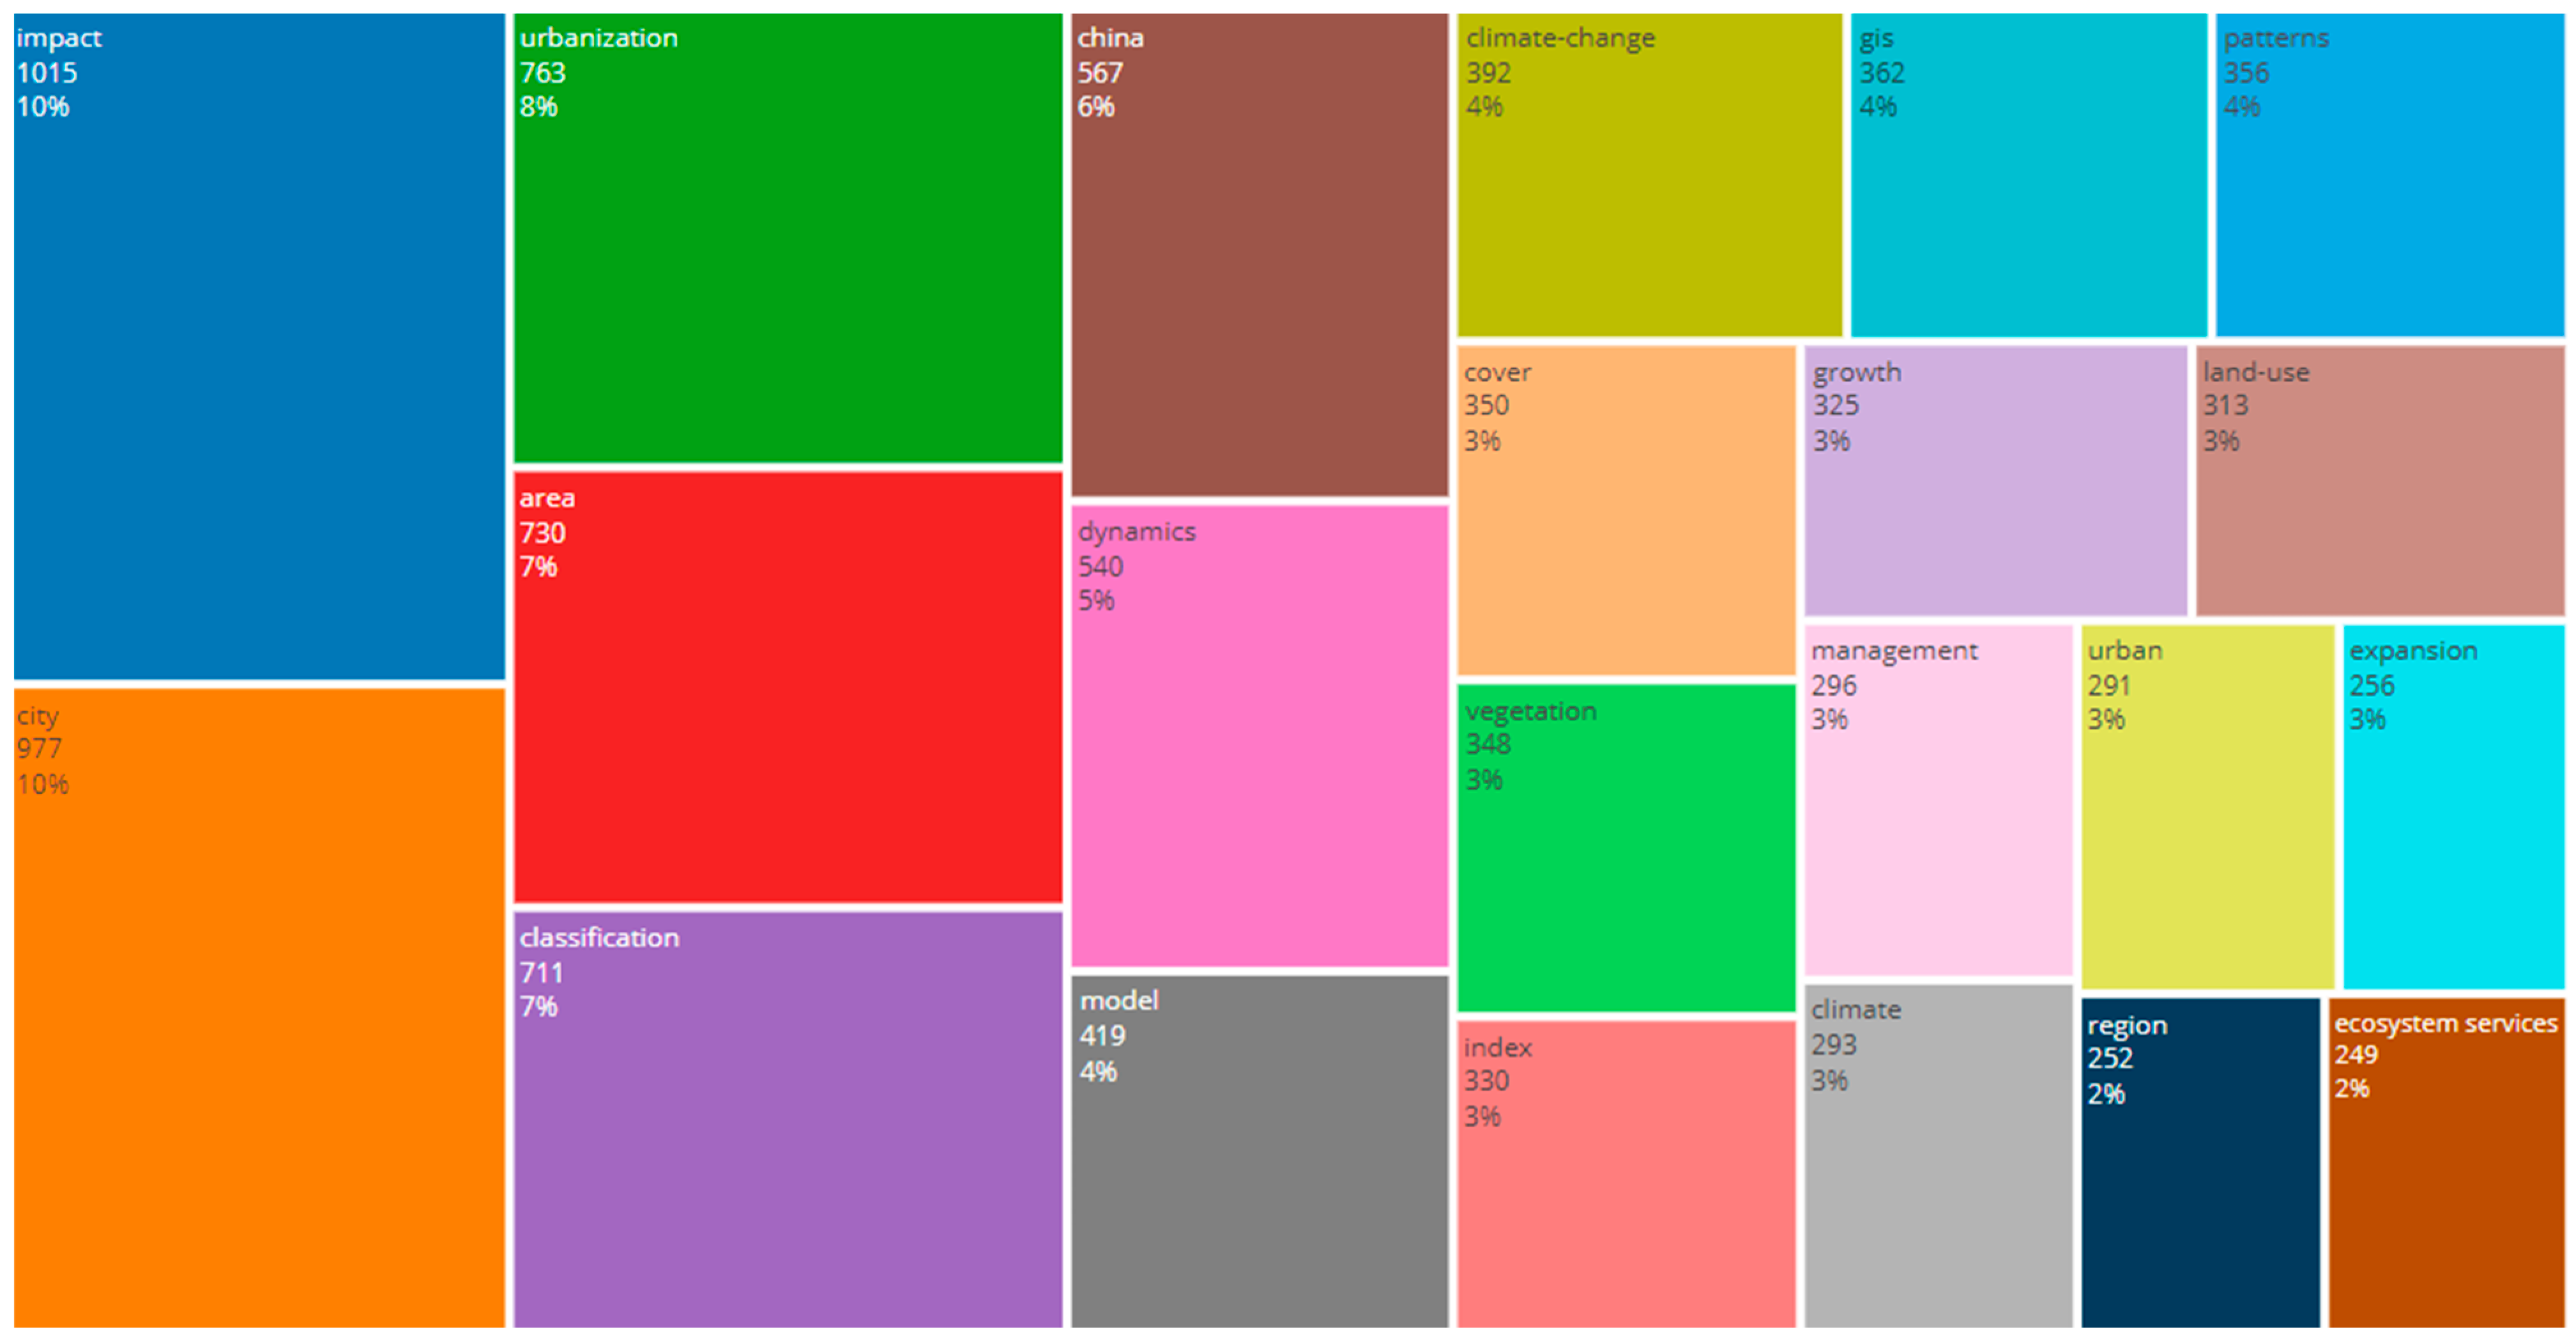
Keywords PlusMost frequently occurring termsImpact (1015), city (977), urbanization (763), area (730), classification (711), China (567), dynamics (540), model (419), climate change (392), GIS (362), patterns (356), cover (350), vegetation (348), index (330), growth (325), land use (313), management (296), climate (293), urban (291), expansion (256),
region (252), ecosystem services (249)
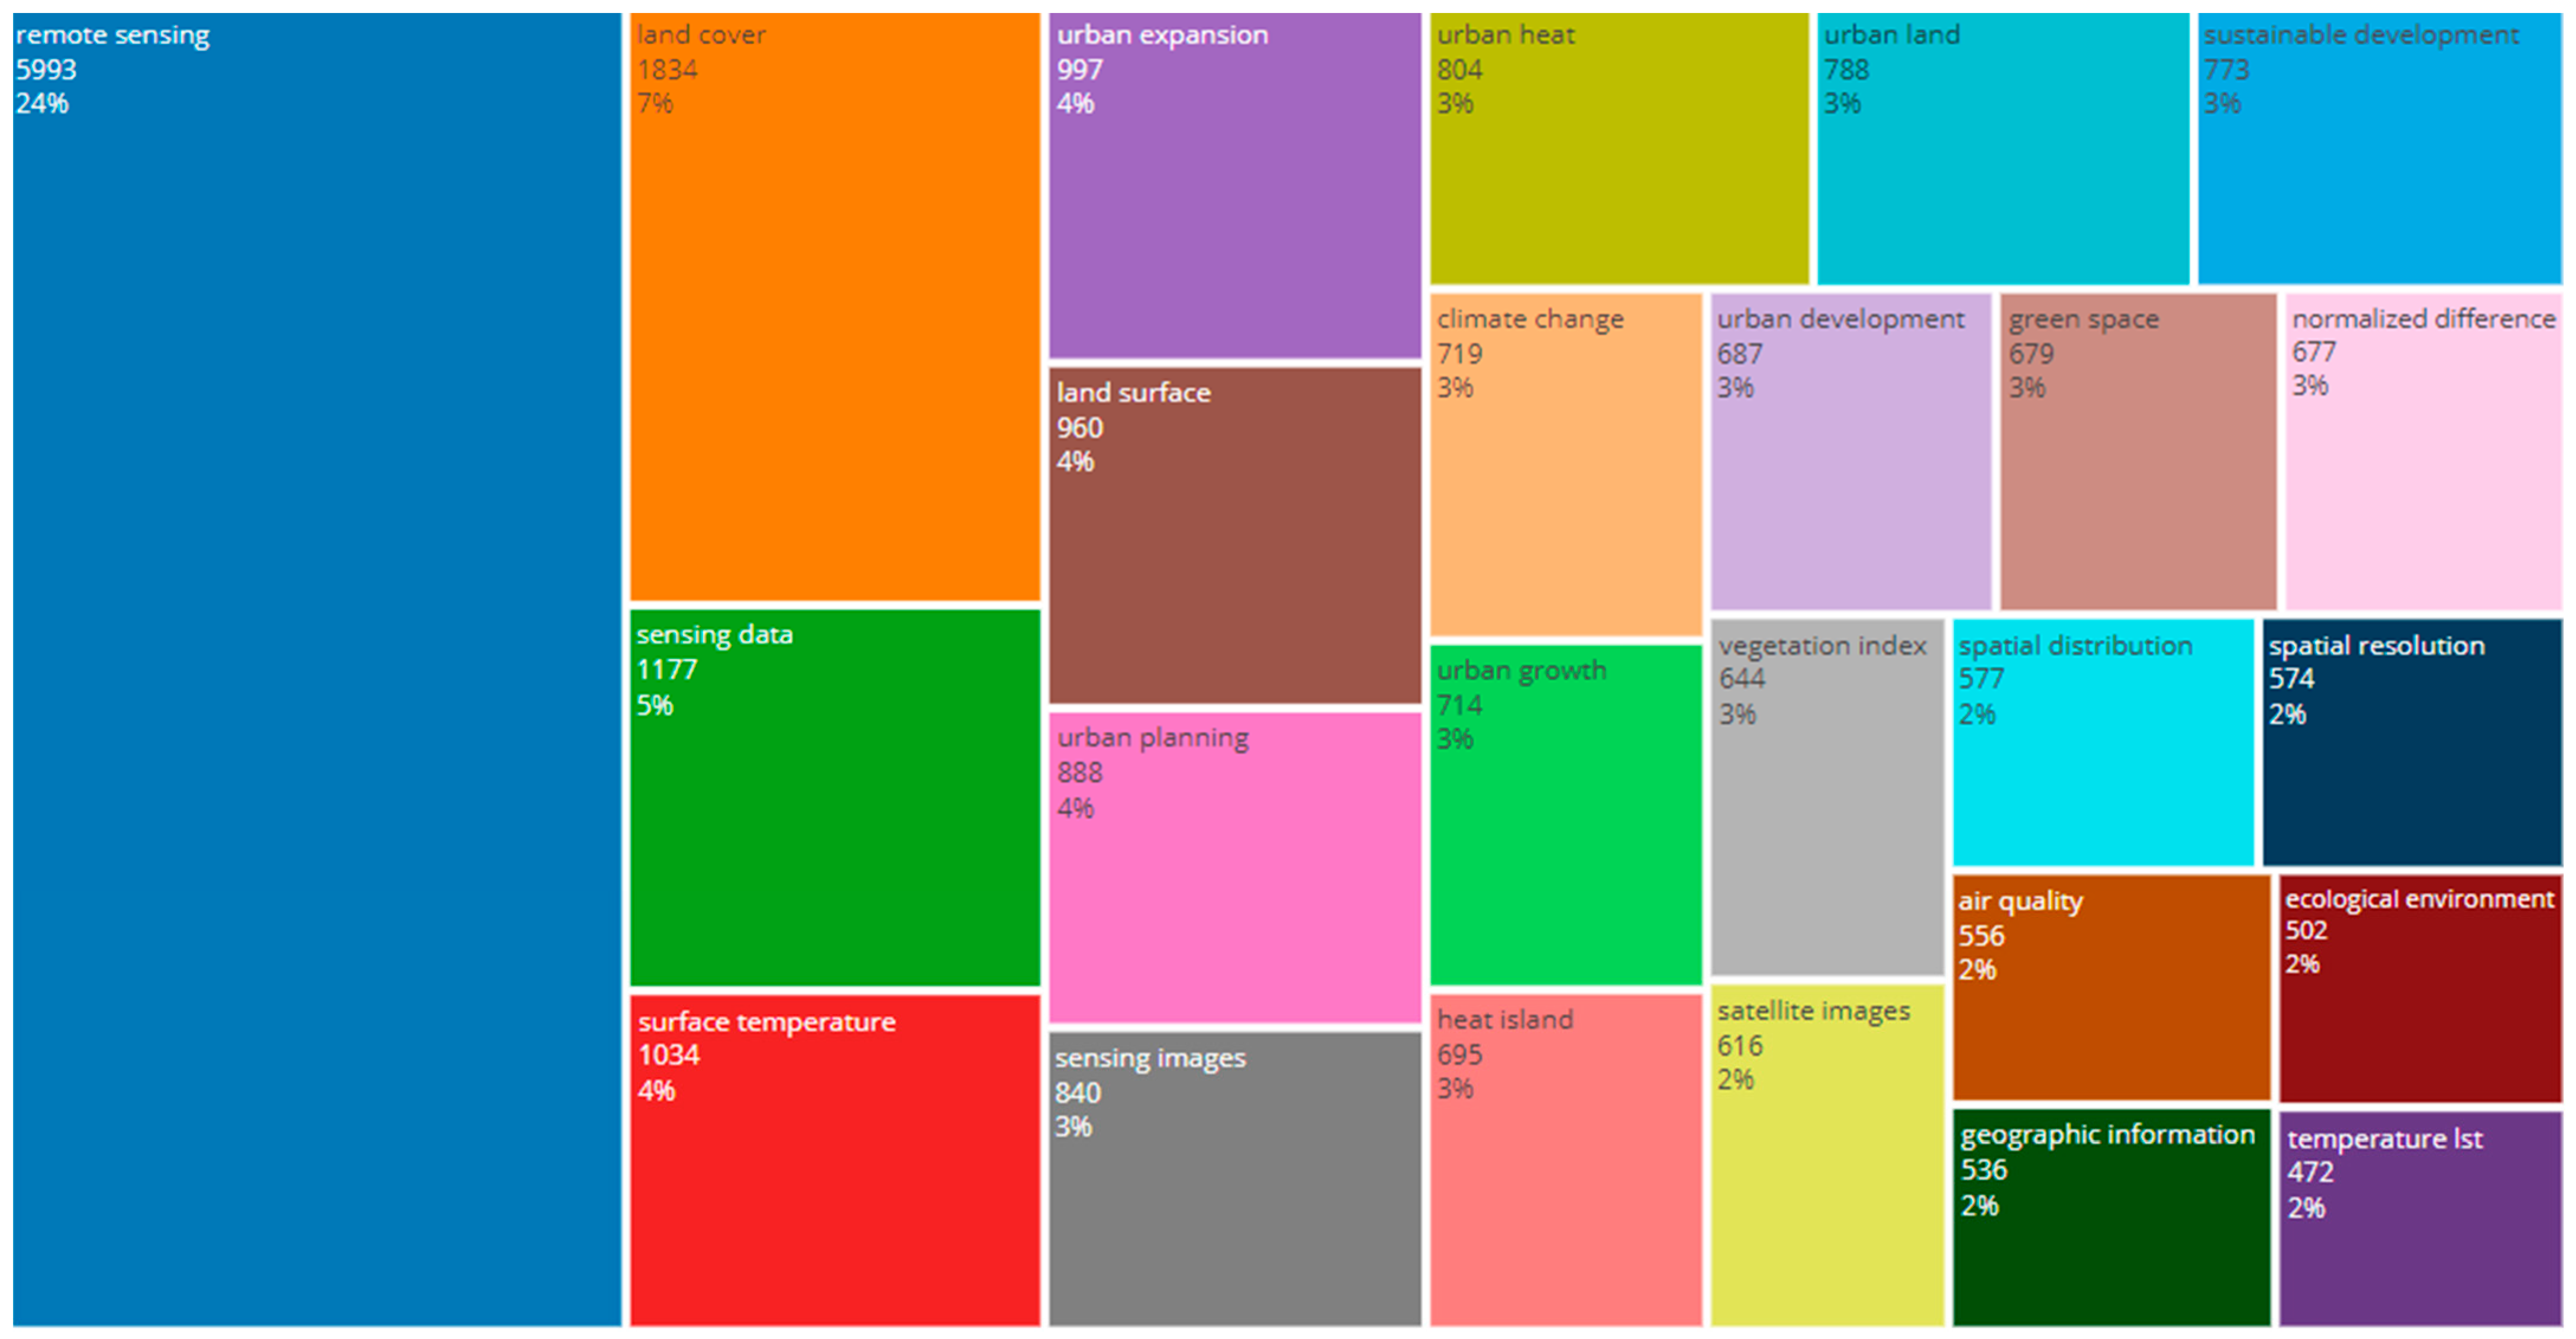
AbstractsThe ten most frequently occurring bi-gram terms (except the term remote sensing)Land cover (1834), sensing data (1177), surface temperature (1034), urban expansion (997), land surface (960), urban planning (888), sensing images (840), urban heat (804), urban land (788), sustainable development (773)
Disclaimer/Publisher’s Note: The statements, opinions and data contained in all publications are solely those of the individual author(s) and contributor(s) and not of MDPI and/or the editor(s). MDPI and/or the editor(s) disclaim responsibility for any injury to people or property resulting from any ideas, methods, instructions or products referred to in the content.

