1. Introduction
In the last decade, information and knowledge management in organizations have been business performance key factors, requiring the constant management of organizational change in order to follow the accelerated technological advances. Information management represents the strategic process of collecting, storing, processing, and efficiently disseminating information within an organization [
1]. It encompasses the establishment of systems and policies that enable the acquisition, storage, and timely access to data and knowledge essential for supporting decision making and daily operational activities within the organization [
2]. The primary goal of information management is to ensure that information is readily available to those in need while preserving its quality and security [
1].
The Theory of Motivated Information Management [
3] underscores the dynamic interaction between information consumers and information provider departments within an organization. This theory recognizes that information consumers, driven by their specific needs and motivations, actively seek, assess, and utilize information resources. Concurrently, information provider departments play a pivotal role in generating, curating, and disseminating pertinent and reliable information. This interdependence is guided by the motivation of information consumers to make informed decisions and the responsibility of information provider departments to facilitate this process by adhering to standards to ensure the quality of the information delivered [
4].
Information management quality (IMQ) alludes to an organization’s capacity to proficiently manage information, ensuring its accuracy, consistency, relevance, accessibility, and security [
5,
6]. IMQ has gained prominence due to organizations’ increasing reliance on information for strategic decision making [
7]. Effective information quality management can yield several advantages for organizations, including more informed and precise decision making [
8,
9], improved operational efficiency [
10,
11], and enhanced responsiveness to changes and emerging scenarios [
12]. Furthermore, the information management quality can contribute to enhancing customer satisfaction by delivering accurate and timely information [
13] and ensuring organizations’ compliance with regulatory requirements [
14]. IMQ is pivotal for organizations to adapt agilely to changes in the business environment [
15]. As Kaplan and Norton [
16] have highlighted, information quality can be the differentiating factor between companies that thrive in a global market and those that lag behind. It is evident that IMQ is not merely an operational practice but a competitive strategy offering substantial advantages for organizations.
Creating channels for information generation and distribution within an organization is imperative for effective management and operational efficiency. Ensuring a seamless, pertinent, and precise flow of information requires organizations to implement effective information systems and adopt suitable technologies [
17,
18]. Additionally, this can foster innovation and organizational learning by facilitating the exchange of ideas and knowledge [
19,
20,
21].
Information management quality systems (IMQS) have been implemented in various forms and industries. In the healthcare sector, for instance, IMQS has been introduced to enhance the accuracy and timeliness of patient data [
22]. In the manufacturing industry, Siemens has developed a system to manage the quality of product and process information, leading to increased efficiency and precision in its operations [
23]. Financial institutions, such as banks, also utilize IMQS to guarantee the accuracy and integrity of financial and customer data [
24]. These instances illustrate how IMQS can be advantageous across different contexts for enhancing information accuracy and utility.
One specific example of an IMQS is information management systems, also known as database management systems, designed to improve information management quality. Digital libraries like Google Scholar, for instance, have been effective in enhancing data access and quality in academic settings [
25]. In the corporate sector, organizations leverage information management systems such as Microsoft SharePoint to manage, store, and share data internally, thus augmenting information management quality and efficiency [
26].
In the educational domain, higher education institutions like universities generate and manage a substantial volume of information through diverse institutional information systems, which draw data from dispersed databases integrating academic, research, and administrative data, among other data types. Additionally, different departments within the university may have exclusive access to specific information [
27,
28]. This organizational information distribution can complicate the task of providing accurate, pertinent, and timely information to information consumers who require it for their work. Information distribution or organizational information architecture in an institution like a university is essential to guarantee effective and accessible information management. The university’s information architecture generally comprises a blend of systems and technologies, including student information management systems, research databases, digital libraries, and web content management systems, among other information systems [
29]. An integral component in this architecture is an integration system, enabling all these diverse systems to communicate and efficiently share information [
30]. The architecture’s design necessitates a balance between usability, accessibility, and security to ensure that information is available to those in need while preserving students’ and staff members’ privacy [
31,
32]. The Chilean university studied has a data analysis department serving as a data provider for other departments. The department’s remit encompasses generating reports based on academic data, research information, and administrative data to facilitate decision making throughout the institution. Information management’s inherent challenges within such a vast and diversified institution (comprising over 3000 employees and 15,000 students) can potentially curtail this unit’s effectiveness. The data analysis department, consisting of a team of eight individuals, including a leader and seven senior analysts, is responsible for producing and maintaining various data reports and analyses. This team acts as the primary information provider, with the remainder of the institution serving as information consumers.
In the present study, we introduce an approach based on the information consumer experience to use design thinking in the design of an information management system centered around the information consumers’ needs in a Chilean higher education institution. Design thinking has demonstrated effectiveness across a broad spectrum of contexts for addressing and resolving complex problems [
33]. The system’s design prioritizes user participation and input, encompassing both information consumers and the information provider department. The study has two primary objectives: enhancing the information consumer experience and addressing information management quality (IMQ) issues into the organization. In this context, this study seeks to explore the initial responses to the following questions: How can a user-centered design of an information management system influence the information consumer experience (ICX) within a higher education institution? Which ICX factors can be addressed through the design of an information management system? How is an organization’s IMQ affected by the implementation of an information system tailored to the information consumers’ needs?
The answers to these questions will provide guidance to professionals in disciplines such as Human–Computer Interaction (HCI) and Human Resources (HR), among others managerial fields, for designing information management systems that can enhance performance in their organizations via IMQ and ICX improvement. The remainder of this study is structured as follows:
Section 2 provides definitions of the key concepts employed throughout the study.
Section 3 details the design thinking-based approach used for designing and implementing the proposed information management system.
Section 4 elucidates how the system’s design and functionalities address IMQ issues and the identified factors influencing the information consumer experience.
3. Research Methodology
For the design and development of the system proposed in this research, a methodology based on the principles of design thinking was adopted. This approach was chosen due to its ability to systematically integrate information consumer experience (ICX) into all phases of the system design. This strategic choice enables the effective addressing of the specific challenges and information-related needs of users within the context of the Chilean university. It is noteworthy that the final stage of the design thinking process “Test” was not included in this study. This omission is deliberate, as the deployment and testing of the proposed system throughout the entire organization are scheduled for March of 2024. In the subsequent subsections, we will delineate how we applied the design thinking process across the four selected stages in order to introduce an information consumer-centered information management system design.
3.1. Empathize
The initial phase in the design thinking methodology is known as the “Empathize” stage. During this stage, the primary objective is to immerse oneself in the user’s perspective, aiming to comprehend their needs, desires, frustrations, and challenges. This phase plays a pivotal role in laying the foundation for the entire design process, enabling the acquisition of an in-depth understanding of the user’s identity and the nature of their actual problems. The work undertaken in this stage encompasses a range of activities for understanding information that consumers needs at the organizational, analytics department, and specific levels.
3.1.1. Organization
Following the methodologies used by [
44,
45], a document analysis was performed with the objective of determining the level of information the organization generates. The documents analyzed consisted of 127 files, which encompassed 36 reports and 91 requirements generated within the organization’s analytics department. This document analysis practice provided us with a detailed and in-depth view of the volume and nature of the information generated in the organization. From the document analysis, a differentiation was established by areas of the organization, which allowed us to observe the state of each area in terms of its information generation volume. The results of this analysis are condensed in
Table 1, which shows the amount of information regularly produced in the organization.
As can be observed in
Table 1, the information generated into the organization is predominantly distributed in the academic area due to being the organization’s main activity. In this regard, the largest amount of information generated is related to undergraduate and postgraduate studies. The next area of information generation is the management area of the organization, which includes information about self-evaluation processes, rankings (national and international), and the information necessary to carry out administrative tasks inherent to the organization. Finally, to a lesser extent, there is information related to research and the relation and communications area. It is important to mention that when we refer to research information, we mean administrative information related to research, not for academic articles or scientific material produced in the organization. The same idea applies to the relation and communications area.
3.1.2. Department Analysis
Analytics in any organization are necessary for the collection, interpretation, and distribution of relevant data over the organization, as they provide a solid foundation for informed decision making [
46]. Often, this department plays a bridging role, transforming raw information into meaningful and accessible knowledge for the rest of the organization. For efficient workflow and effective decision making, it is important that all departments of the organization have access to this processed information. Opportune and transparent access to information can foster collaboration among departments, improve operational efficiency, and facilitate adaptation to changes in the business environment [
15].
To deeply understand the process of information dissemination within the organization, the method of direct observation was used as suggested by [
47]. This technique involves direct immersion in the organizational context, observing and recording interactions, communication practices, and information flows. This active participation allowed for a first-hand view of how information is generated, distributed, and used within the organization. This process is shown in a simplified manner in
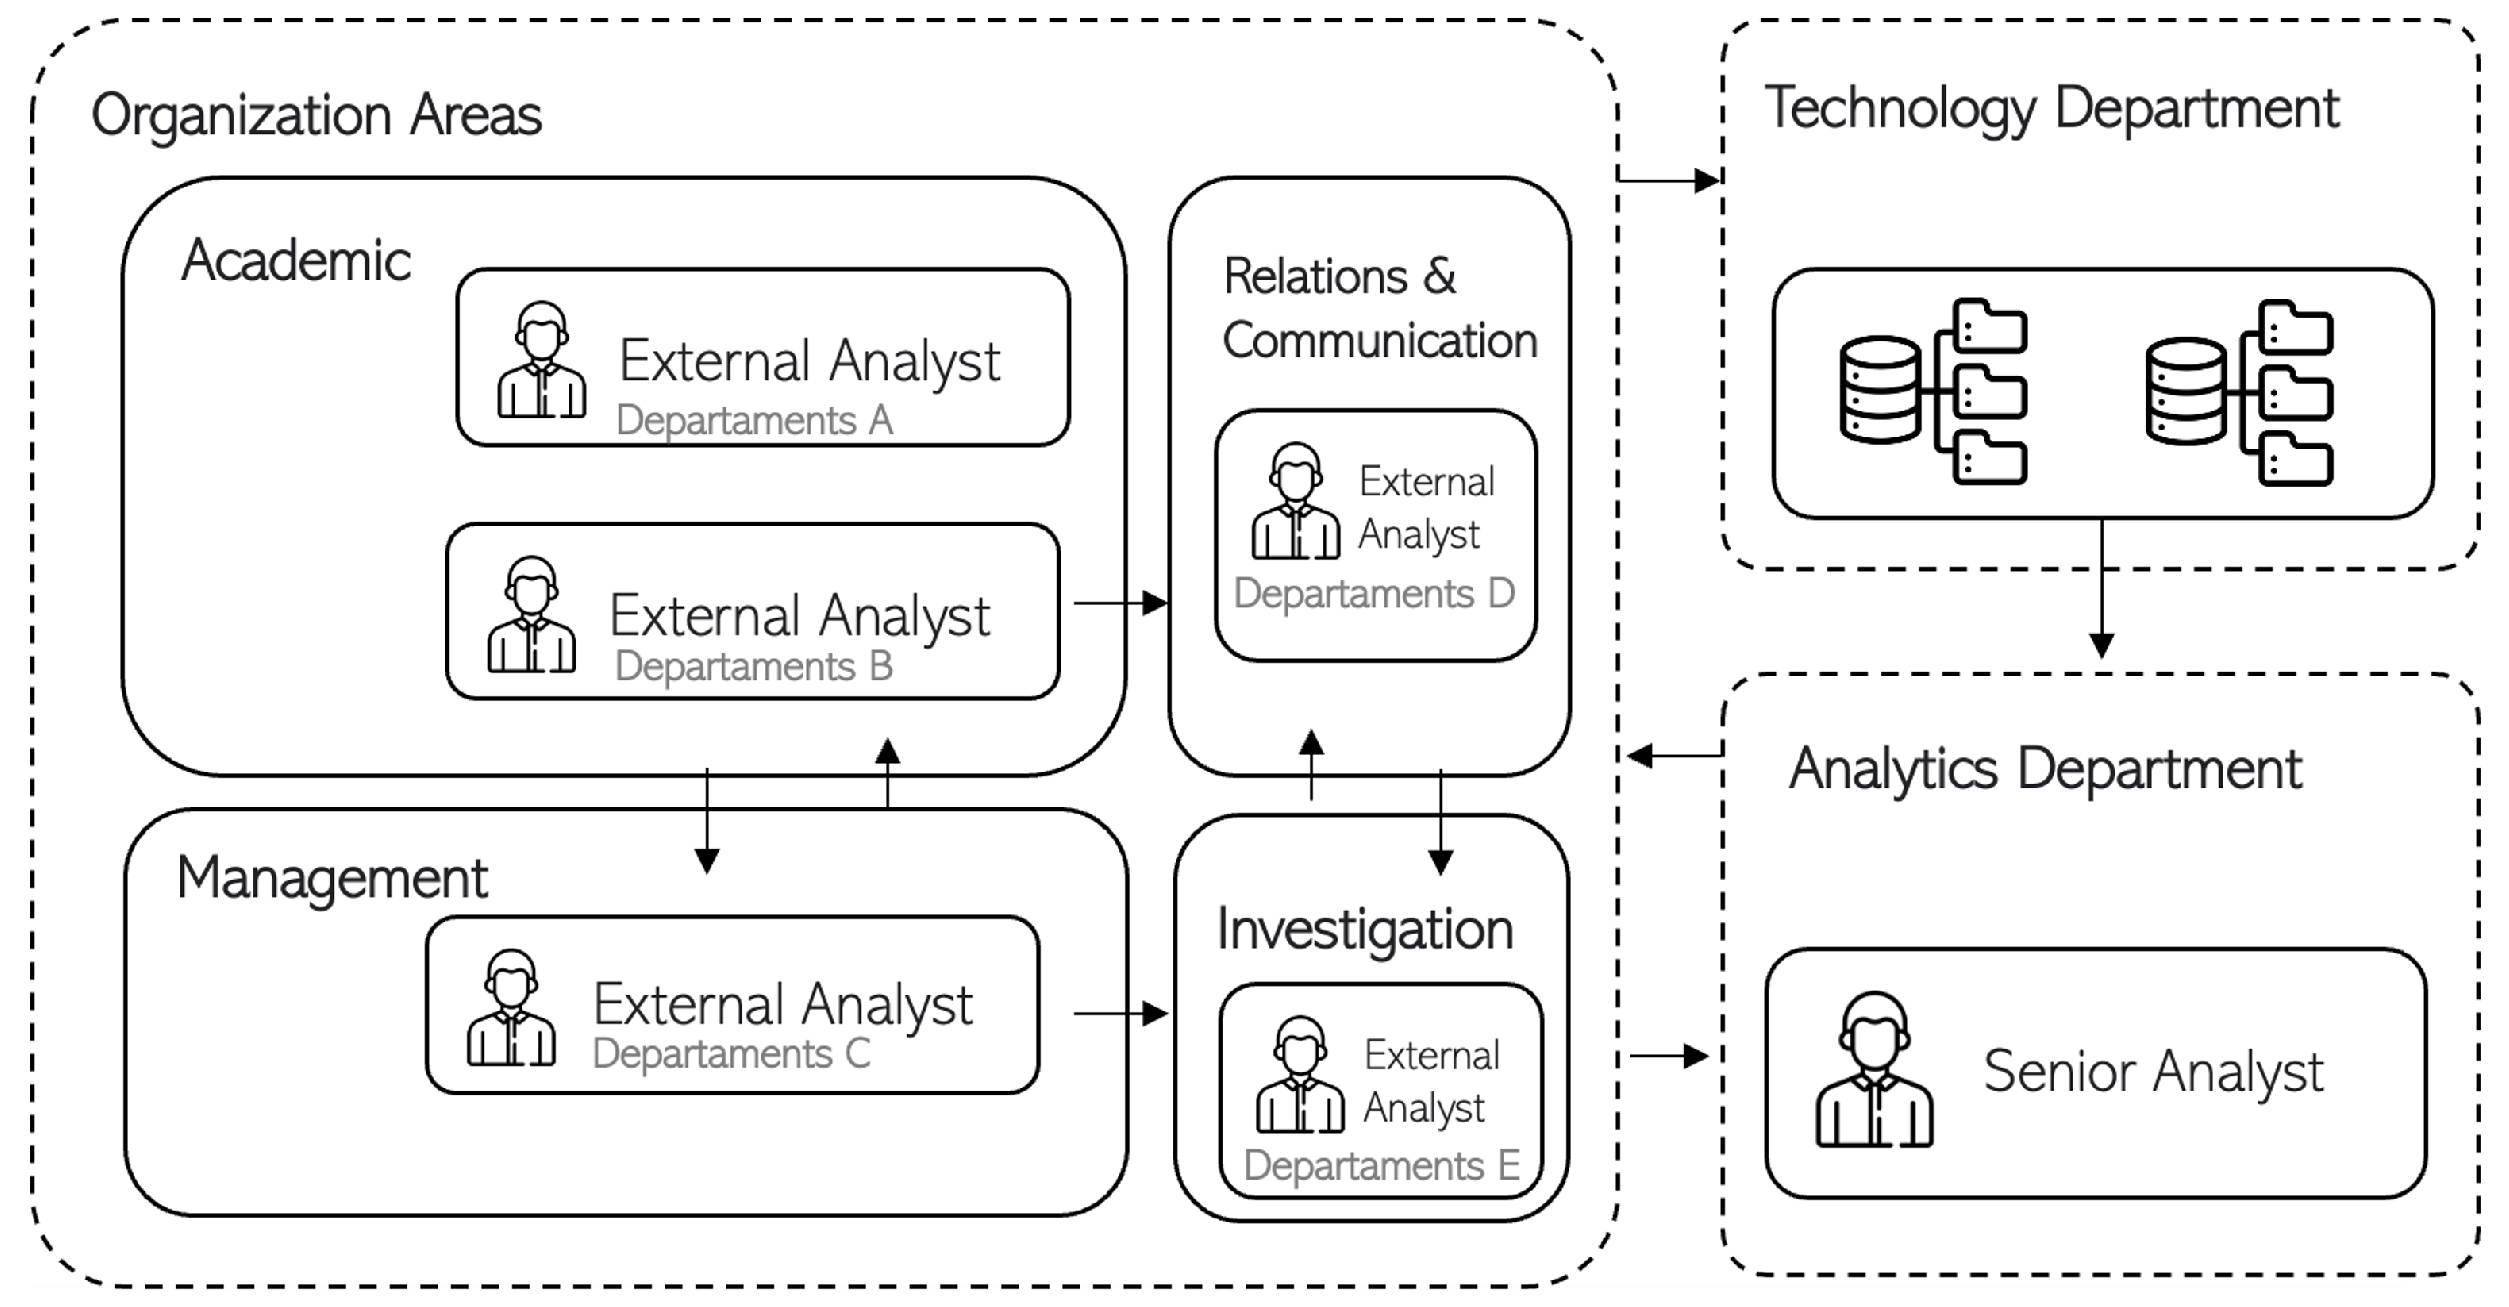
Figure 1, where it can be observed that the organization is composed of various areas, sub-areas, and departments that are related to each other via information flows.
The organization has an analytics department that receives and processes data from several areas of the organization. This department is responsible for transforming these data into valuable information tools that facilitate decision making. The analytics department team is composed of senior analysts, who are tasked with handling and developing the process of generating information from the various available data sources. In relation to these data sources, the analytics department has access to databases provided by the technology department, while these databases are fed from a series of information systems used in the organization.
Additionally, an information distribution phenomenon is observed occurring between different areas, sub-areas, and departments, where each unit provides data to other units that may require this information. This process, although necessary, can lead to problems related to the data quality. For example, it may occur that one department provides data with value X as a representative indicator of its area, while the analytics department supplies data with value Y for the same indicator of said department (based on what is stored in the databases of the various systems). From this process, redundancies or inconsistencies were identified in the information distribution process.
Furthermore, the role of external analysts is considered important. They are called external analysts because they belong to other departments external to the analytics department. These professionals, who are distributed by several areas across the organization, play an important role in communication both with the analytics department and other areas and departments. They are also responsible for managing the information from their respective departments, which impacts the dissemination of information within the organization.
3.1.3. Information Consumers
To characterize information consumers within the organization, the results of a previous study [
48] were used. The objective of this prior study was to conduct an analysis of information consumption within the organization. This was achieved through the characterization of consumers and an evaluation of their experience with information consumption. This prior study was executed using a combination of surveys, interviews, and other assessments to gather data pertaining to the needs, challenges, and perceptions of information consumers within the organization. In this sense, the findings from the prior study [
48] were used to empathize with the information consumers in the Chilean university. These findings are presented in the subsequent “Define” stage.
3.2. Define
The “Define” stage is centered on the profound understanding acquired regarding user needs and desires. Its primary aim is to clarify and specify the specific problem or challenge that will be addressed in the design process. The work conducted in this stage is grounded in the results obtained in the preceding phase, particularly focusing on the analysis of user needs from the perspective of the organization members. Additionally, a comprehensive overview, not limited to the study organization, is obtained through another prior systematic review [
37], which is concentrated on factors that can impact information consumers within an organization.
The identified user needs in [
48] revolve around various aspects of accessing information within the organization. There is a recognition of the need for a centralized information service that integrates all work-related data. Furthermore, the importance of obtaining this information in real time to ensure constant updates is acknowledged. The necessity of having tools that facilitate data manipulation in daily tasks is also emphasized. Survey respondents underscore the importance of disseminating these tools and institutional information systems among users.
Lastly, there is an emphasis on the need to establish protocols for the use of sensitive data. Many users do not use specialized tools to handle such data, are unaware of their existence or significance, or may not even be conscious of the fact that they are working with sensitive data. Below,
Table 2 shows a summary which outlines the user needs identified in the previous study and serves as the foundation for this work [
48].
The preceding table illustrates the needs of a specific group of information consumers within the study organization. In addition, it was determined to take into consideration characteristics or generalized factors that pertain to users of such systems. These generalized factors were derived from a systematic review published in [
37].
Subsequently, to validate these identified factors, unstructured interviews were carried out, conducted with 4 information consumers and 3 senior analysts from the analytics department, within a total population of 224 information consumers and 6 senior analysts. The latter refers to individuals who are responsible for ensuring the availability of information to consumers. The objective was to achieve a well-rounded viewpoint from both sides of this ecosystem, namely, the consumers and the information providers. The unstructured format of the performed interviews was intentionally adopted, as it provided the opportunity for an open and detailed dialogue on the previously identified factors. In contrast to imposing a rigid and potentially limiting structure, the unstructured interviews offered a space for participants to discuss the factors within their own context and terms. This resulted in a deeper and more authentic understanding of how these factors impact their experience when they consume information. Additionally, this approach allows the validation, questioning, or even introduction of new factors into the conversation, thereby expanding the depth and scope of our research.
Table 3, presented below, displays the predominant factors identified in the literature, which according to the interview participants opinions, are the most important for the effective fulfillment of their roles. Although the literature review [
37] revealed a broader variety of factors, those selected as most relevant by interview participants are presented in
Table 3.
The determining factors in the information consumer’s experience, led by “Access” and “Trust”, highlight the need for availability, credibility, and reliability of the information. Furthermore, IMQ related factors such as “Accuracy”, “Completeness”, and “Ease of Use” underline the relevance of the precision, completeness, and utility of the information. Other factors such as “Sociability”, “Staff Responsibility”, “Resistance Behavior”, “Self-Sufficiency”, “Communication Activity”, “Experience Level”, “Opportunity”, and “Task Performing Standards” aid in shaping the consumer experience, indicating the importance of the social component, individual attitudes and abilities, previous experience, timing opportunity, and established procedures in information consumption.
3.3. Ideate
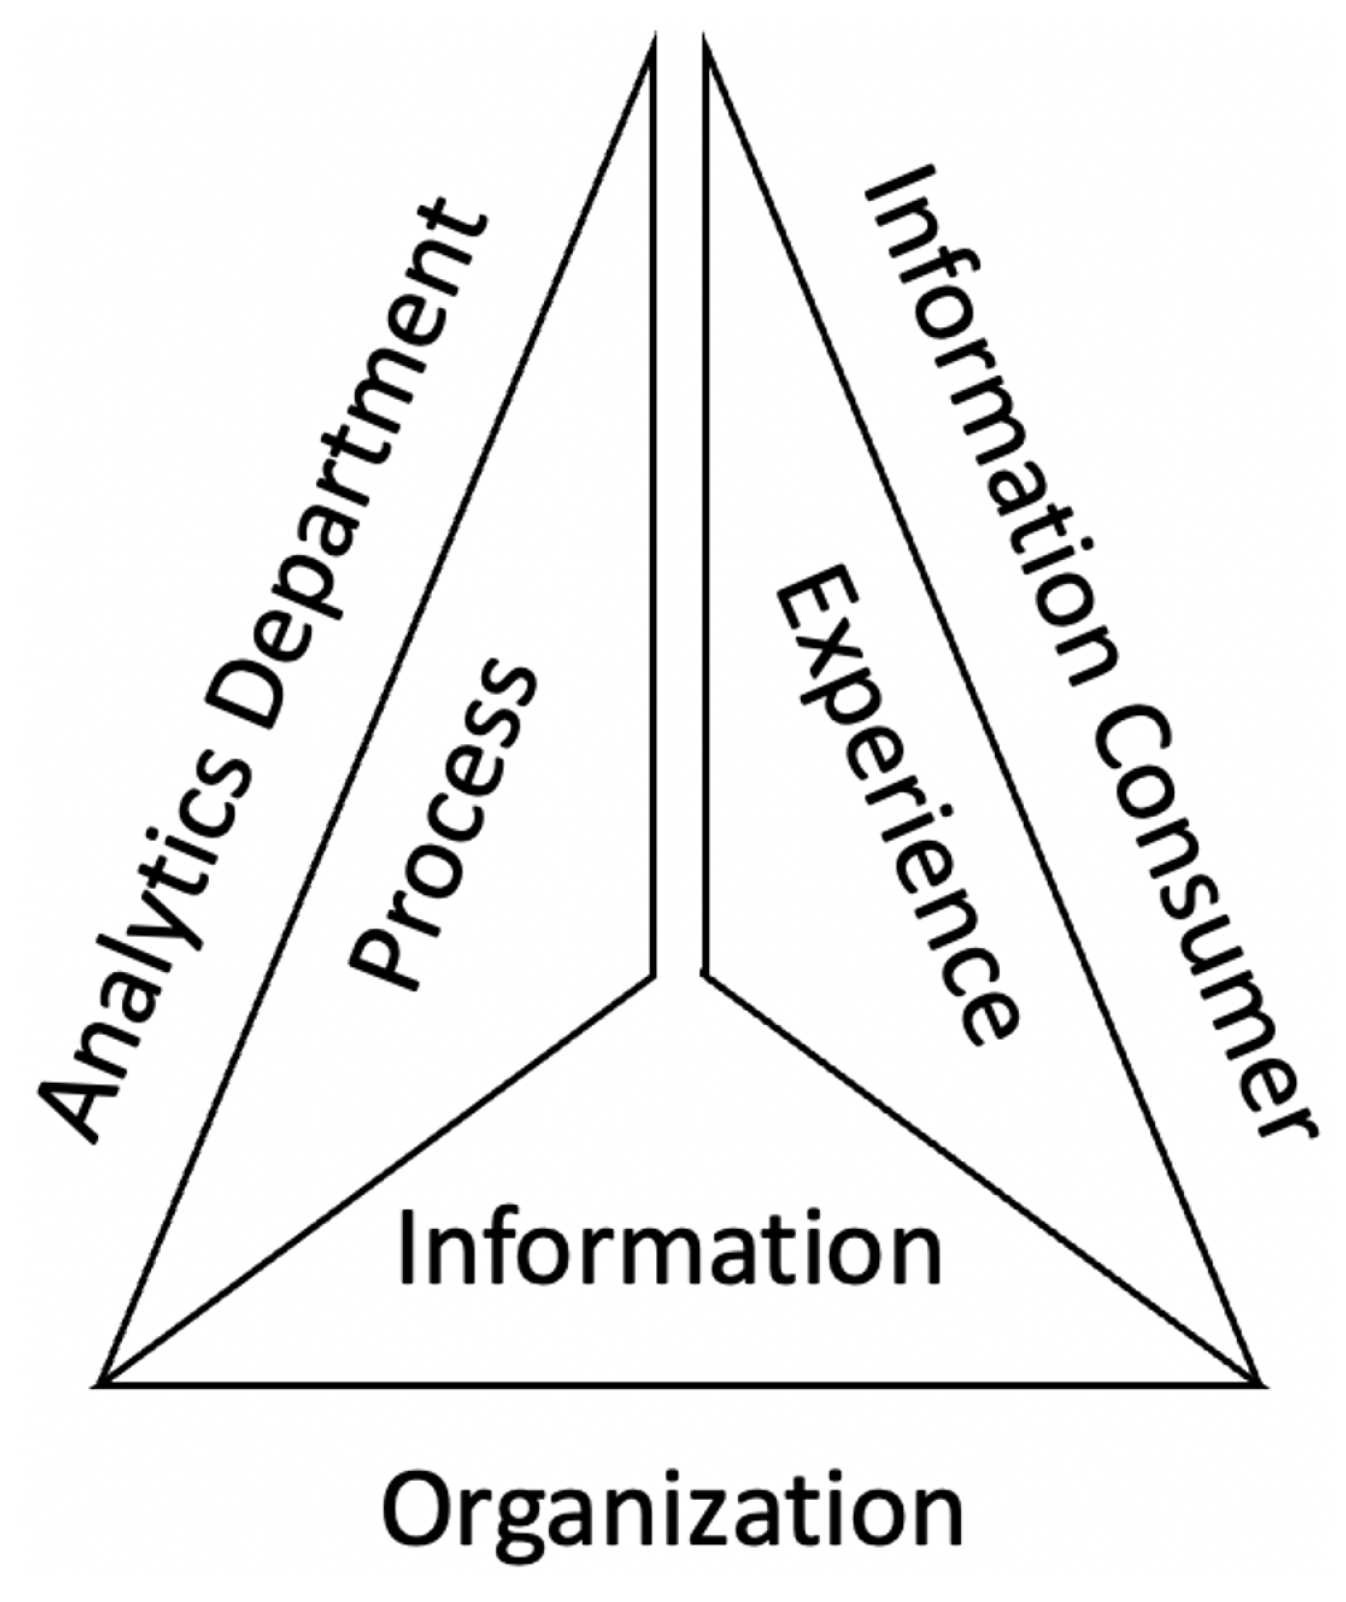
In the design thinking process, the “Ideate” stage is dedicated to the creative generation of ideas and solutions. The primary objective of this stage is to explore a wide variety of concepts and approaches to design a user-centered solution. In this work, we need to address the issues related to information management quality (IMQ) and information consumer experience (ICX) identified in the previous stages. In this context, we employ an analytical analysis that considers three dimensions, analogous to the Customer Experience (CX) in the operations of a company that produces and sells a product. From this perspective, the “information” within the organization is conceived as the equivalent of the “product” that a company offers. This viewpoint allows us to examine information management process in much the same way a company would evaluate the features of its product. In this manner, the process for generating the information is viewed as the production process of a company, considering the efficient generation and distribution of information as the manufacturing process. Finally, the Customer Experience (CX) is interpreted as the information consumer experience (ICX), similar to how customers acquire and use a product, with the ICX focusing on the utilization of information. This three-dimensional approach enables us to comprehensively model how information is produced, distributed, and consumed within an organizational environment as illustrated in
Figure 2.
Regarding the relationship between the perspectives of information and process, which are closely associated with the information management quality (IMQ) within the organization, the design of the proposed system aims to depict the process of information generation, processing, and dissemination within the organization. Additionally, it seeks to model the interaction between the analytics department and the rest of the organization. This interaction takes place in the system through external analysts who represent other departments in the organization, different from the analytics department. In this sense, the external analysts feed the analytics department with information associated with their own department, acting as a communication bridge for the flow of information in the organization, especially between the analytics department and the rest of the organization.
3.3.1. Information Resources Validation Process
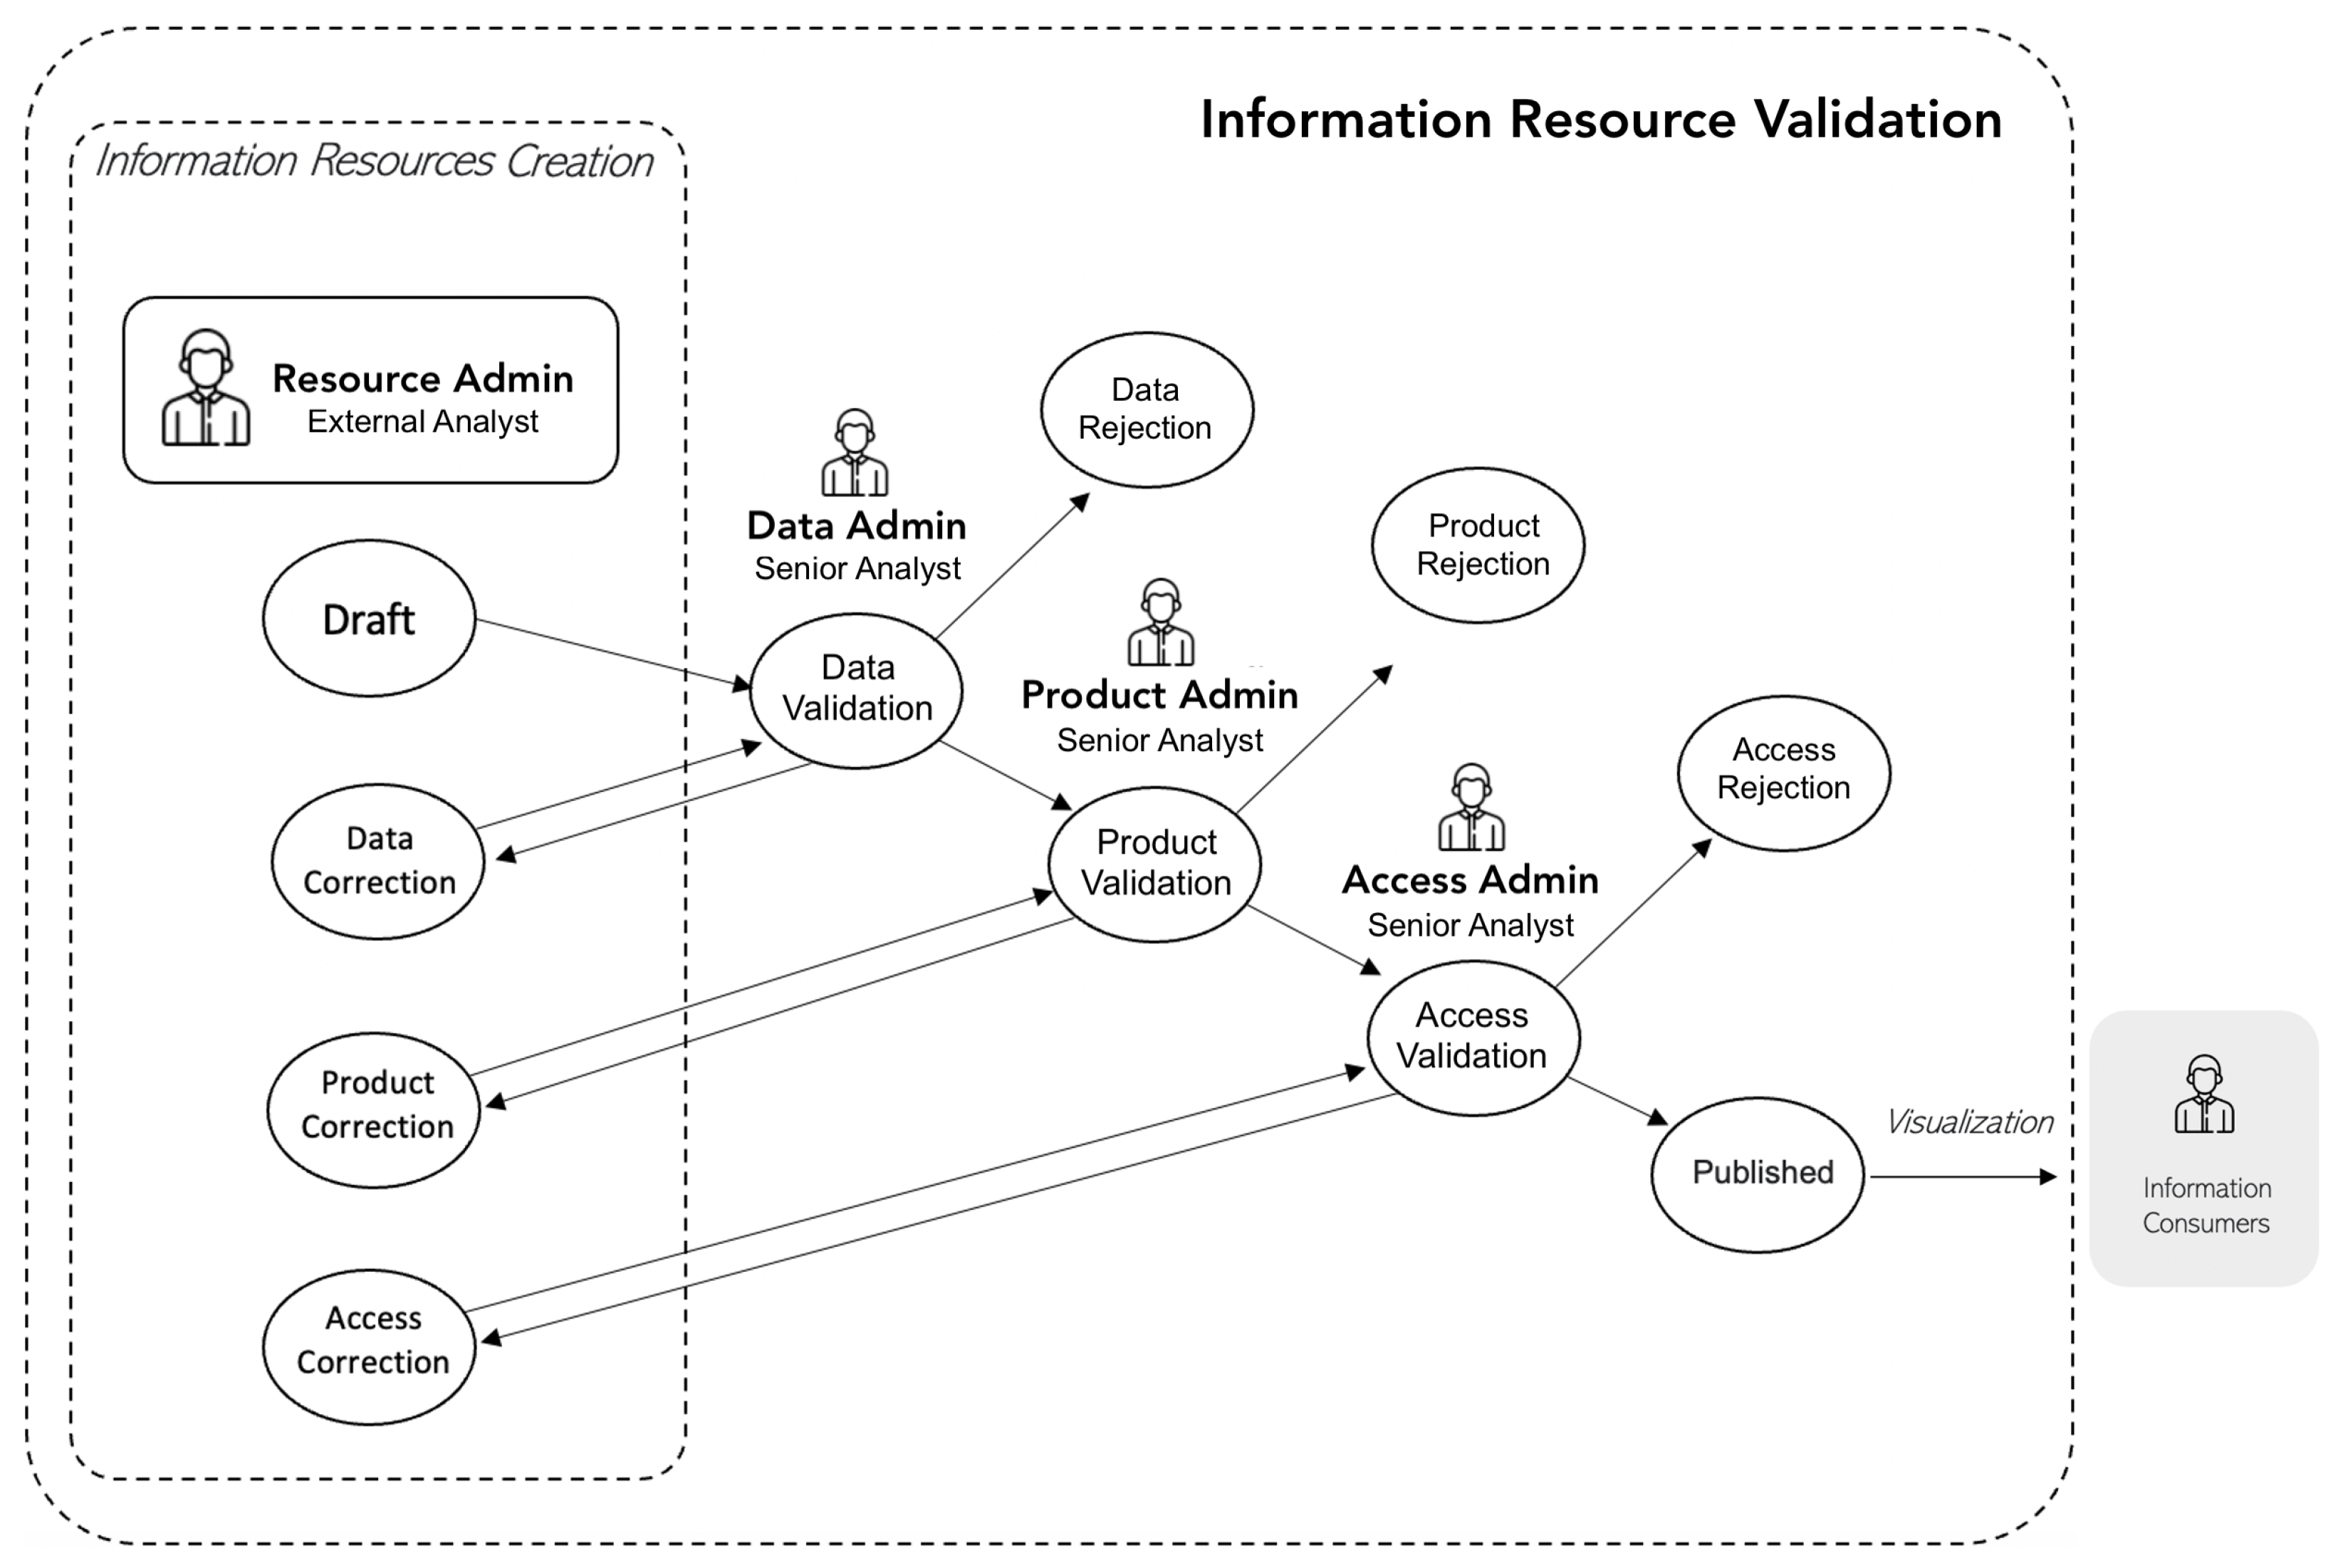
The information disseminated within the organization will be available in various formats, referred to as “information resources”. These information resources will primarily be created by external analysts, who will generate an information resource that can initially be regarded as a draft. This draft will progress through different validation stages to refine it into a final version of the resource as illustrated in
Figure 3.
In this regard, a draft can progress to the next stage, referred to as “Data Review”. During this stage, a senior analyst responsible for data review assesses whether the information resource complies with various data quality standards established by the organization, which are associated with the data source extraction and maintenance processes, to proceed to the next stage. If the resource does not meet any of the standards, it may be rejected, or the necessary corrections may be requested from the external analyst for a reevaluation. The subsequent stage is termed “Product Review”, in which a similar process to the previous stage is carried out. However, in this stage, the resource’s categorization is examined, representing a hierarchical structure for organizing resources based on departments, units, or other types of structures, which will be explained in more detail later on. The product review is conducted by a senior analyst who determines whether corrections are required, whether the resource is rejected, or whether it is approved to proceed to the next stage of “Access Review”. The final stage of this process is named “Access Review”. Its dynamics are akin to the previous stages, with the distinction that, in this stage, the Senior Analyst in charge must ensure that the resource is accessible to the relevant consumers or consumer groups in line with the content of the information resource. As with the previous stages, the senior analyst holds the authority to reject the resource, request corrections, or, as a final step, authorize its publication for availability to the rest of the organization or to specific information consumer groups.
In this information resources validation process, external analysts play a dual role within the system, acting not only as information consumers but also as resource administrators. In this regard, they have the ability to create, edit, search, and delete such resources. This duality of roles strengthens the system’s ability to ensure the quality and relevance of the information provided. It is important to note that although external analysts can manage information resources, the publication of these resources in the system is subject to validation by the senior analysts of the analytics department. On the other hand, it is relevant to mention that, although not explicitly visualized in the figure, senior analysts not only play a validation role but also have the capacity to create information resources. However, the resources they generate themselves must undergo the same validation process in order to guarantee the quality and integrity of the information provided.
As previously discussed, the analytics department acts as the information provider for consumers. Therefore, the proposed system delegates the administration to senior analysts, who will assume the responsibility of processing and publishing the information to the rest of the organization (information consumers). The proposed system was designed as a component of the official organizational platform, with the aim of maintaining familiarity in accessing information, as access was identified as a relevant factor for the consumption experience. Furthermore, the design of the system also aims to meet the information consumers’ needs and address the factors influencing their information consumer experience (ICX). This is accomplished through various features, including interaction with information in different formats, referred to as types of information resources. Additionally, it involves mechanisms for organizing these resources, known as categories, which facilitate information search and access. Below is a more detailed description of these characteristics.
3.3.2. Information Resources
We identified four types of information resources to include in the system: indicators, reports, databases, and general files. These four categories encompass all possible ways in which information may be requested from the analytics department. The indicators are generated directly within the platform, providing charts designed to offer quick and easily comprehensible answers to information consumers’ inquiries. The reports, on the other hand, represent an integration with the Tableau data visualization platform, which is already in use within the organization at the analytics department, and has been recognized as an intuitive data visualization tool for information consumers.
The database resource was designed as data tables to show large amounts of information to cover the provision of more extensive and detailed data to information consumers, allowing them to interact with these data via filtering, sorting and downloading subsets of the data. These interactions allow information consumers to use only data of their interest. Finally, for cases where the information request does not fit into any of the previous information resources, a fourth resource was established that allows the uploading of general files. It should be noted that all information resources interact in the system as different download options in different formats.
3.3.3. Categorization
For better visualization of the information resources, a set of categories and areas was established to distribute resource information among areas and departments of the organization. This structure will enable consumers from various areas and departments within the organization to directly access informational resources associated with their respective departments. Categorization will be managed by analytics department, who will have the capacity to manage the creation, editing, and deletion of these areas and categories, according to what best suits the needs of the organization and the received information requests. It is important to maintain a certain order in the structure of these categories and areas. In this sense, administrators are requested to avoid the indiscriminate generation of new categories and areas, and to focus on maintaining a coherent and manageable structure that facilitates the accessibility and understanding of resources for all users.
3.3.4. End Users
A management model was implemented for access to information resources, where each resource available in the system must be associated with an end user. These end users are defined as information consumers within the organization. At the organizational level, there are large groups of information consumers corresponding to undergraduate students, graduate students, academics, and administrative staff. While there are protected groups, such as the groups mentioned above, it is also possible to associate a specific member of the organization or create specific groups for information resources dissemination. In this way, an exclusive information resource can be associated with a particular group (e.g., finance department). In this regard, information consumers will be able to access the information resources that have been associated with them through the groups to which they belong. It is important to note that consumers access the system through the official portal of the organization, facilitating their access on a familiar platform.
3.4. Prototype
The prototype stage involves the implementation of the design ideas generated in the previous stage into prototypes or demo versions of the solution. In this manner, a beta version of the data management system was developed, which will be available to the analytics department and a subset of the organization’s information consumers from a specific department. This beta version of the system is accessible to the mentioned users during the testing phase, which is scheduled to conclude in December 2023. As a result, this study does not encompass the testing stage of the design thinking process. Regarding the “Prototype” stage, the information management system was constructed as a web application with a user interface based on the Angular Framework and a backend built on microservices using the Node.js framework. The system was hosted on the university’s official web platform, making it accessible to all information consumers within the organization. Below, there is a brief description of all user profiles that can access the system.
3.4.1. General Users
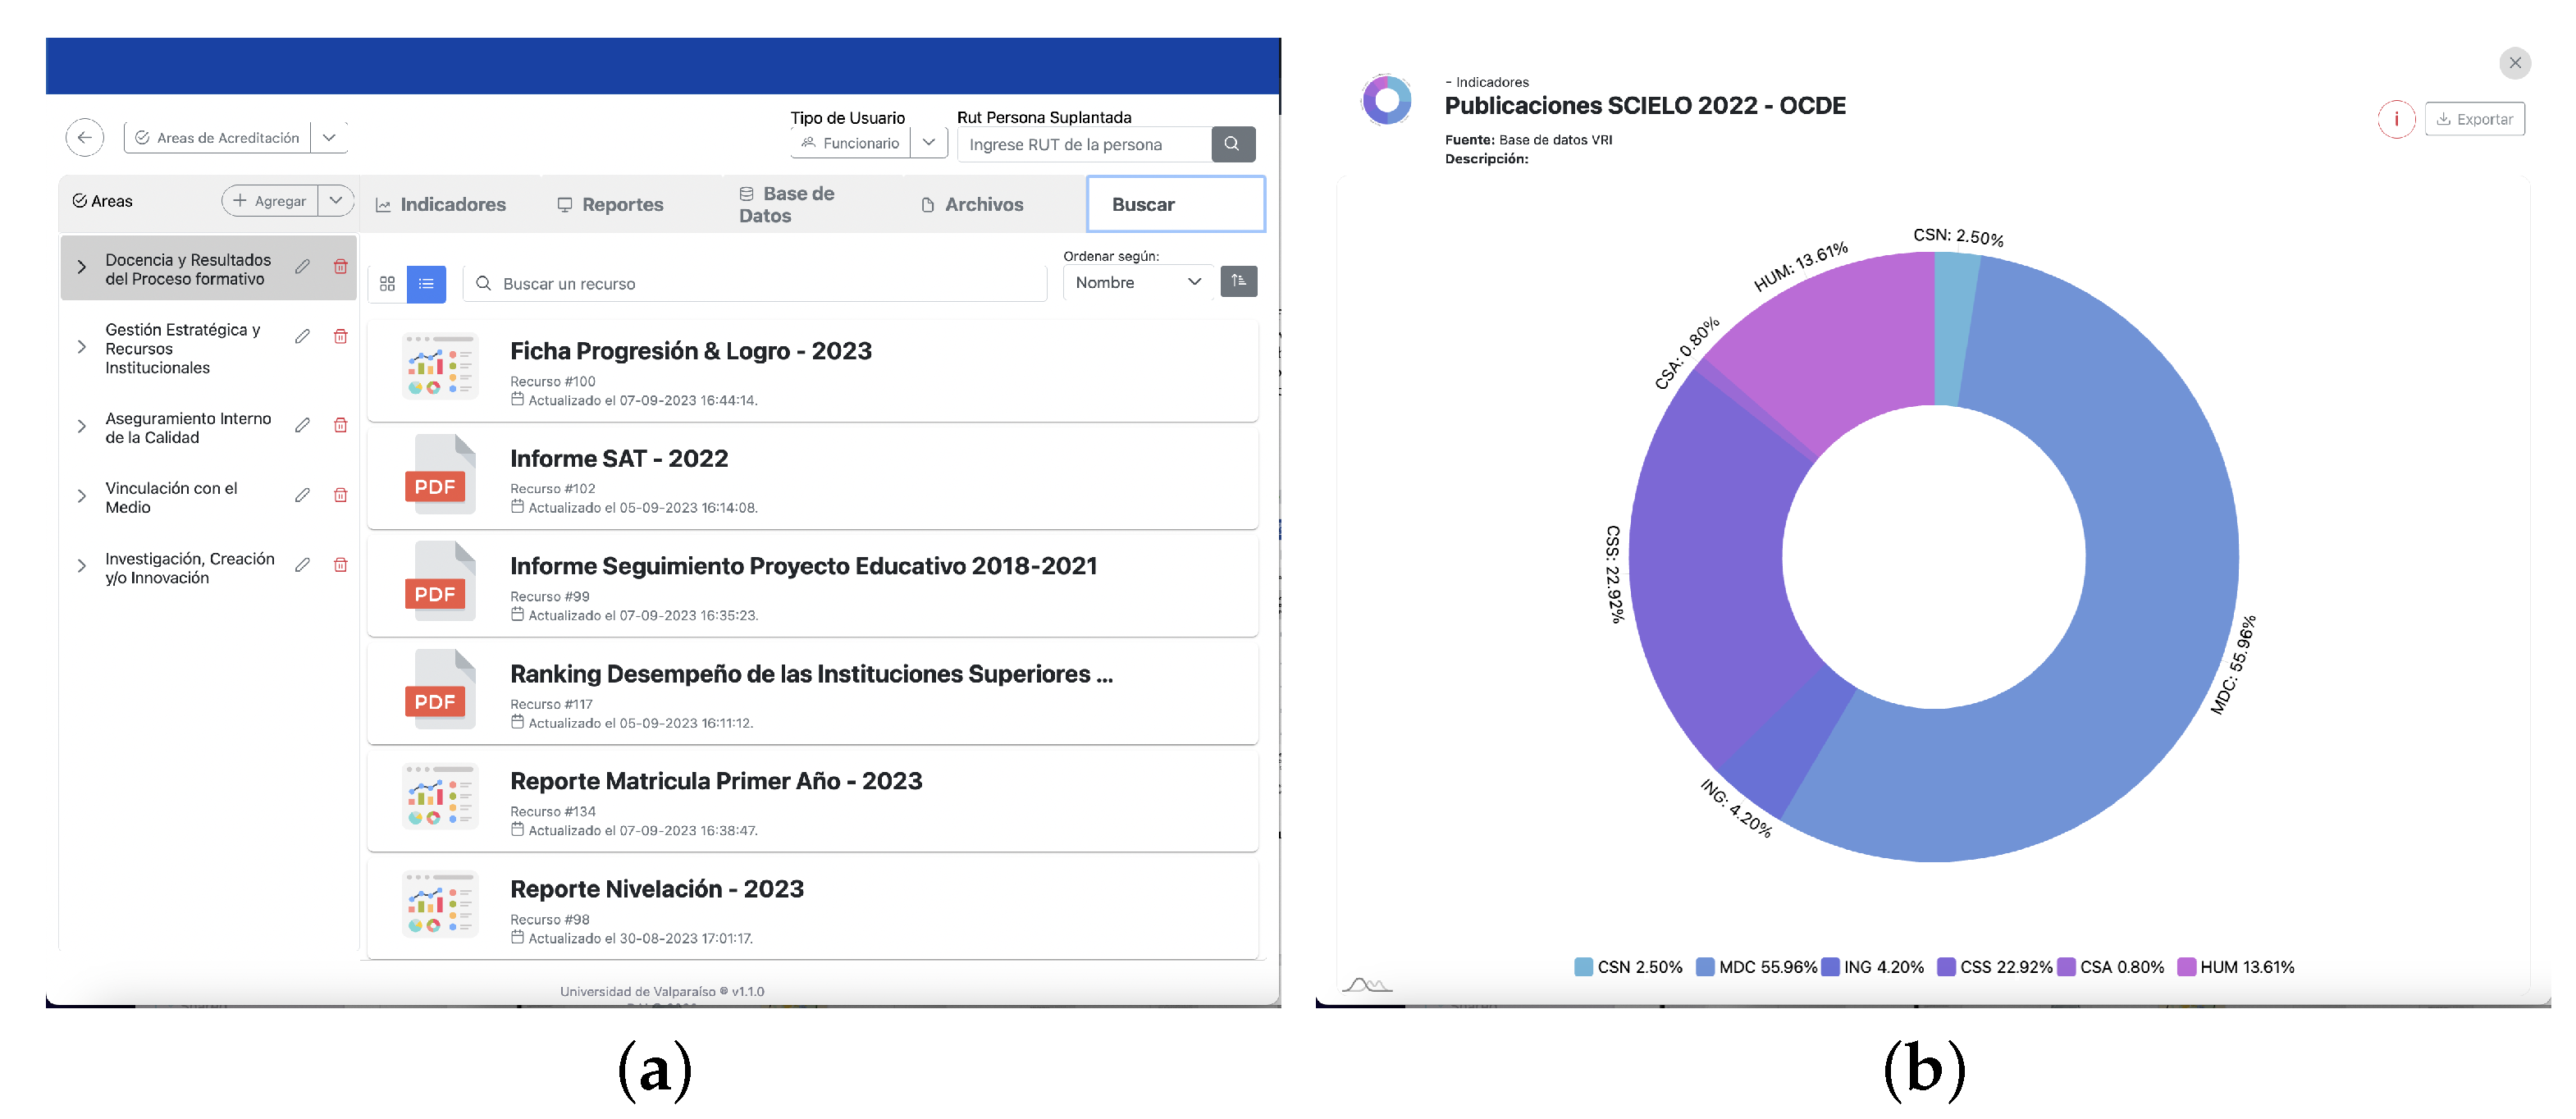
This user profile represents information consumers within the organization, who can belong to any department. These users have the ability to access, view, and download local copies of assigned information resources, either through their unique national identification (RUN) or as members of specific access groups. To accomplish this, users can access resources through the hierarchical characterization structure displayed in the left panel of the screen as presented in
Figure 4a. This hierarchical structure reflects the organization as a whole, including its various departments, allowing consumers to navigate and search for information resources related to specific components of the organization. It is worth noting that this hierarchy applies both to the central institutional management structure of the organization and to the different faculties, programs, or academic units that make up the Chilean University.
To examine the content of an information resource, the consumer must click on their choice of resource, which triggers full-screen viewing as illustrated in
Figure 4b. In this view, users can explore the resource’s content and access associated information, such as data source, categorization, and a brief description.
Furthermore, when a consumer views an information resource, they have the option to download a copy of the resource by selecting the button located in the upper right corner of the screen as shown in
Figure 4b. It is important to note that different types of information resources offer various download formats. While indicators and reports allow the downloading of raw data in CSV (Comma-Separated Values) format, they also offer the option to download a copy in PDF format. In the case of indicators, downloading as images in PNG, JPG, and SVG formats is also available. On the other hand, resources categorized as “Databases” can only be downloaded in CSV format, while resources in “File” format are downloaded in their original format.
Additionally, if an information consumer identifies irregularities in the presentation or content of a resource, they can report an issue using an incident form by clicking the button with the alert icon, located next to the resource download button, in the upper right corner of
Figure 4b. With these features, the system facilitates the interaction and participation of information consumers in the continuous improvement of the quality of information available in the system and throughout the organization.
3.4.2. Resource Administrator
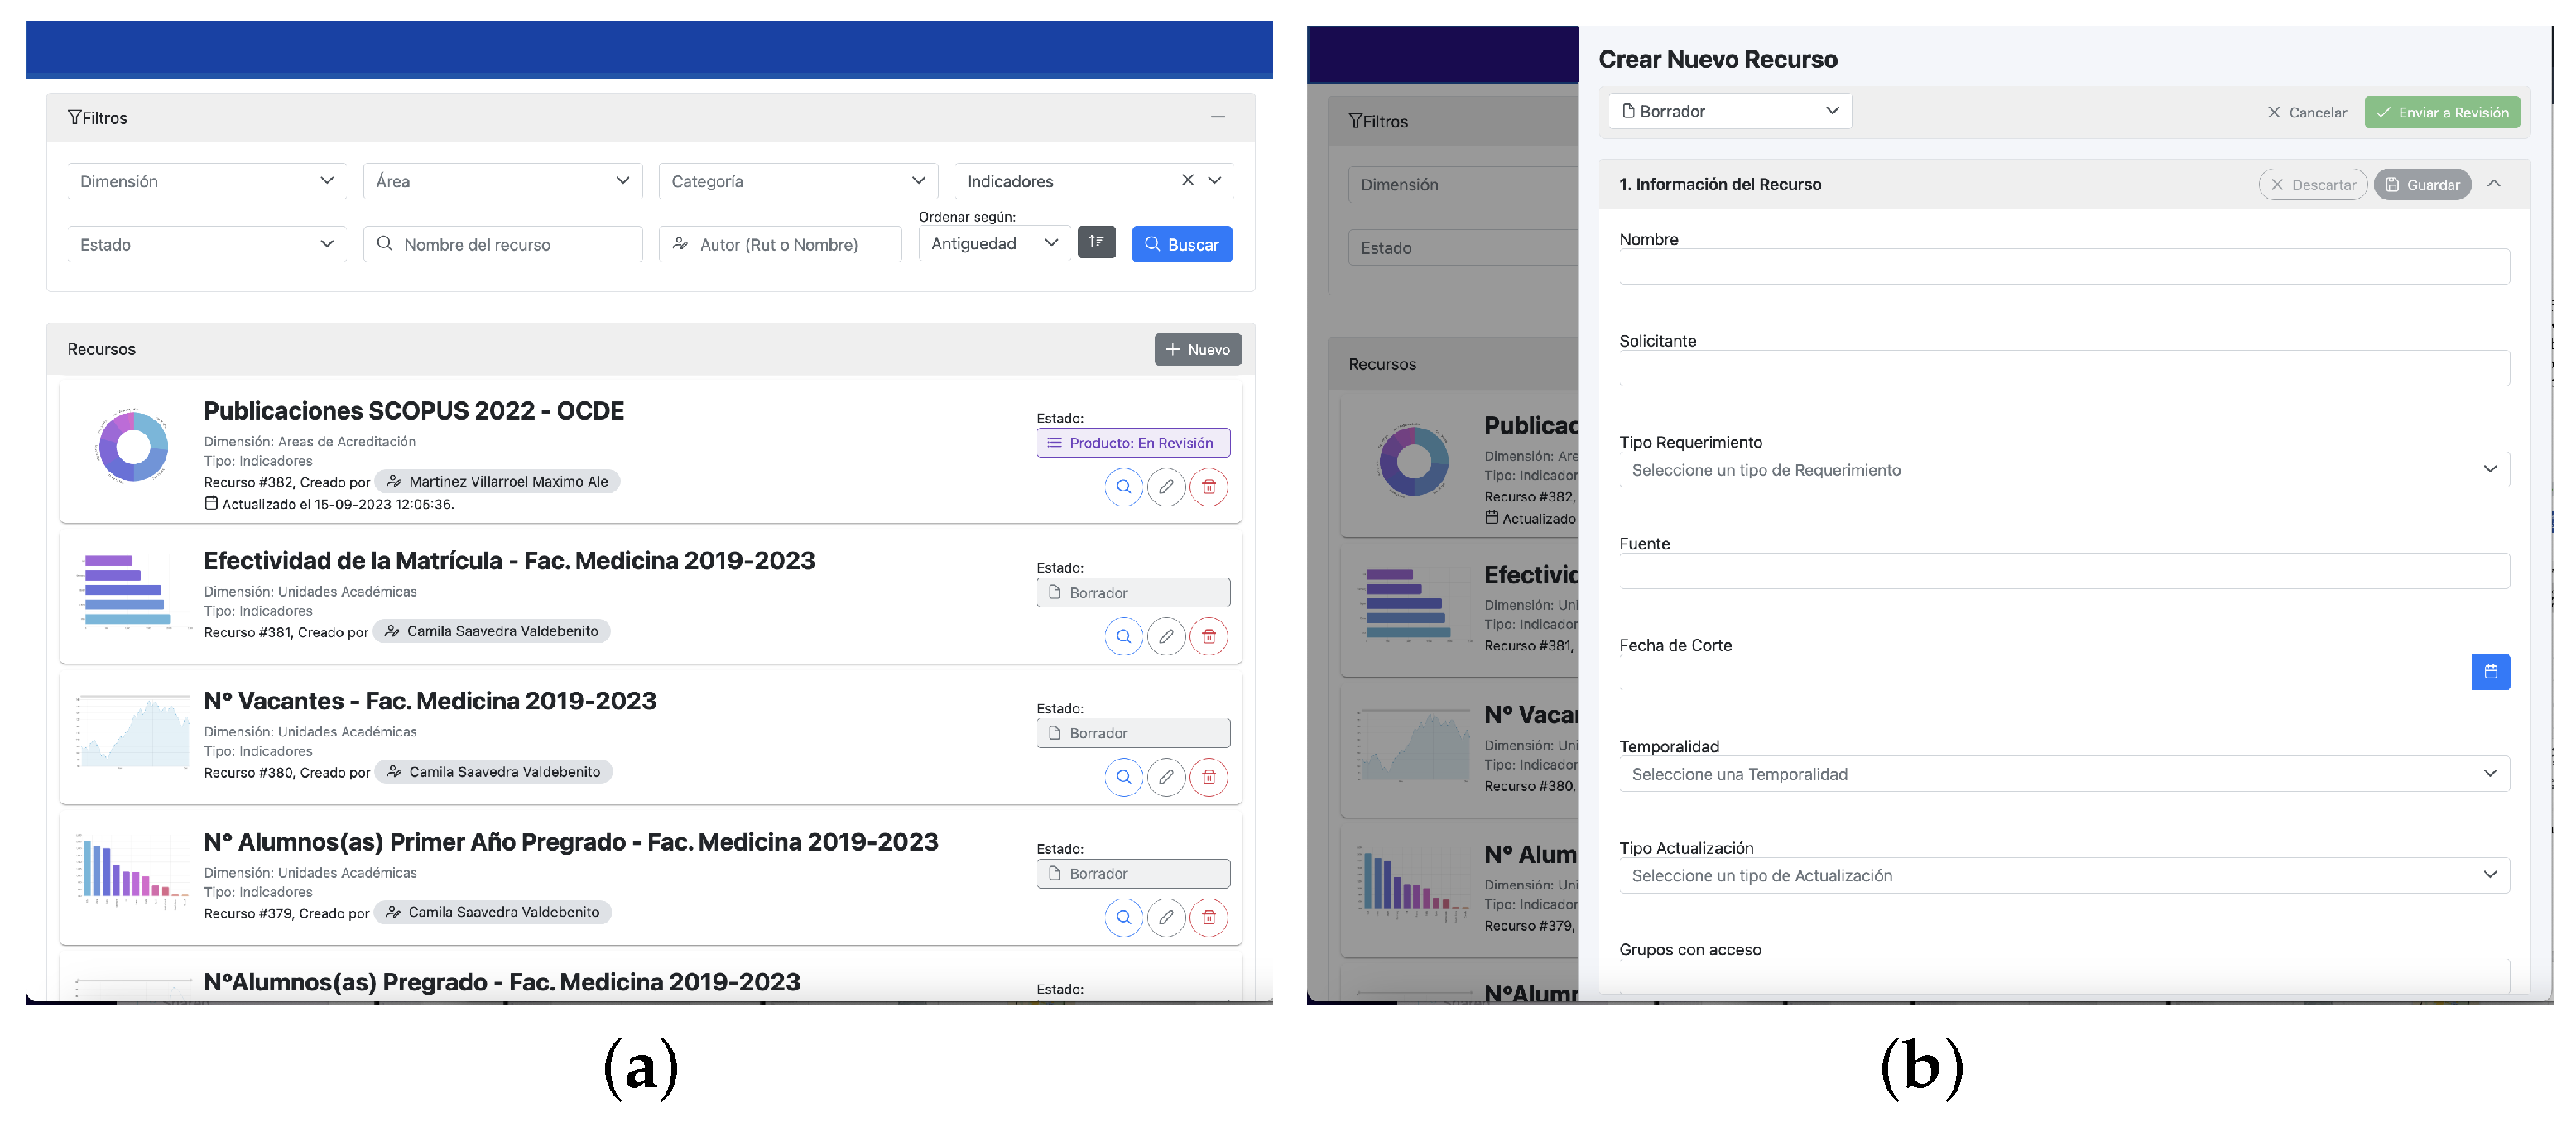
Users assigned to this user profile include both internal and external analysts, originating from various departments within the organization, and may also include senior analysts from the analytics department. The primary function of this profile revolves around the generation of information resources, marking the inception of the process outlined in the “Ideate” stage (refer to
Figure 3). To execute this task, resource administrators access the system, leading them to the information resource management view depicted in
Figure 5a. Within this interface, the user can review all generated resources, but their editing capability is restricted to information resources they have created themselves. They are not allowed to make modifications to resources generated by other administrators; only the viewing of these resources is permitted. Additionally, this view provides a filter panel that enables the categorization of information resources based on various criteria, such as categorization, the format of the information resource, the stage of the validation process it is in, the author (whether it is the same user or another resource administrator), and the name of the information resource. This filter panel is located at the top of the view as illustrated in
Figure 5a.
To create a new information resource, the resource administrator must click on the “Nuevo” button located in the upper right corner of the resource list as shown in
Figure 5a. Upon selecting this button, the information resource creation form is displayed as represented in
Figure 5b. In this form, the resource administrator must provide essential information about the new resource, including details such as the nature of the data it will contain, a name that identifies and describes it, the person or department requesting the resource, the data source, and access groups, among other data predefined by the analytics department to streamline its subsequent management. Once the form is completed, the resource administrator proceeds to create the new resource by selecting the “Save” button. This process assigns an initial “Draft” status to the resource, allowing for as many modifications as necessary. When a definitive version of the information resource is available, the resource administrator can submit their draft for review and subsequent processing within the information resource validation process by selecting the green “Submit for Review” button, located in the upper right corner of the view as shown in
Figure 5b. This action advances the resource to the “Data Validation” stage.
3.4.3. Data Administrator
Users falling under the “data administrator” user profile correspond to analysts within the analytics department. The primary responsibility of this profile is to carry out the validation of information resources that are in the “Data Validation” phase. To perform this task, data administrators access the system and go to the information resource management view as illustrated in
Figure 5a. In this interface, users can view all resources that have been created by resource administrators. However, they are only authorized to validate information resources that are in the "Data Validation" status. Resources in other stages of the process are only available for viewing. Additionally, in this view, they have the ability to apply filters to the information resources according to the criteria set in the upper panel of the view as indicated in
Figure 5a.
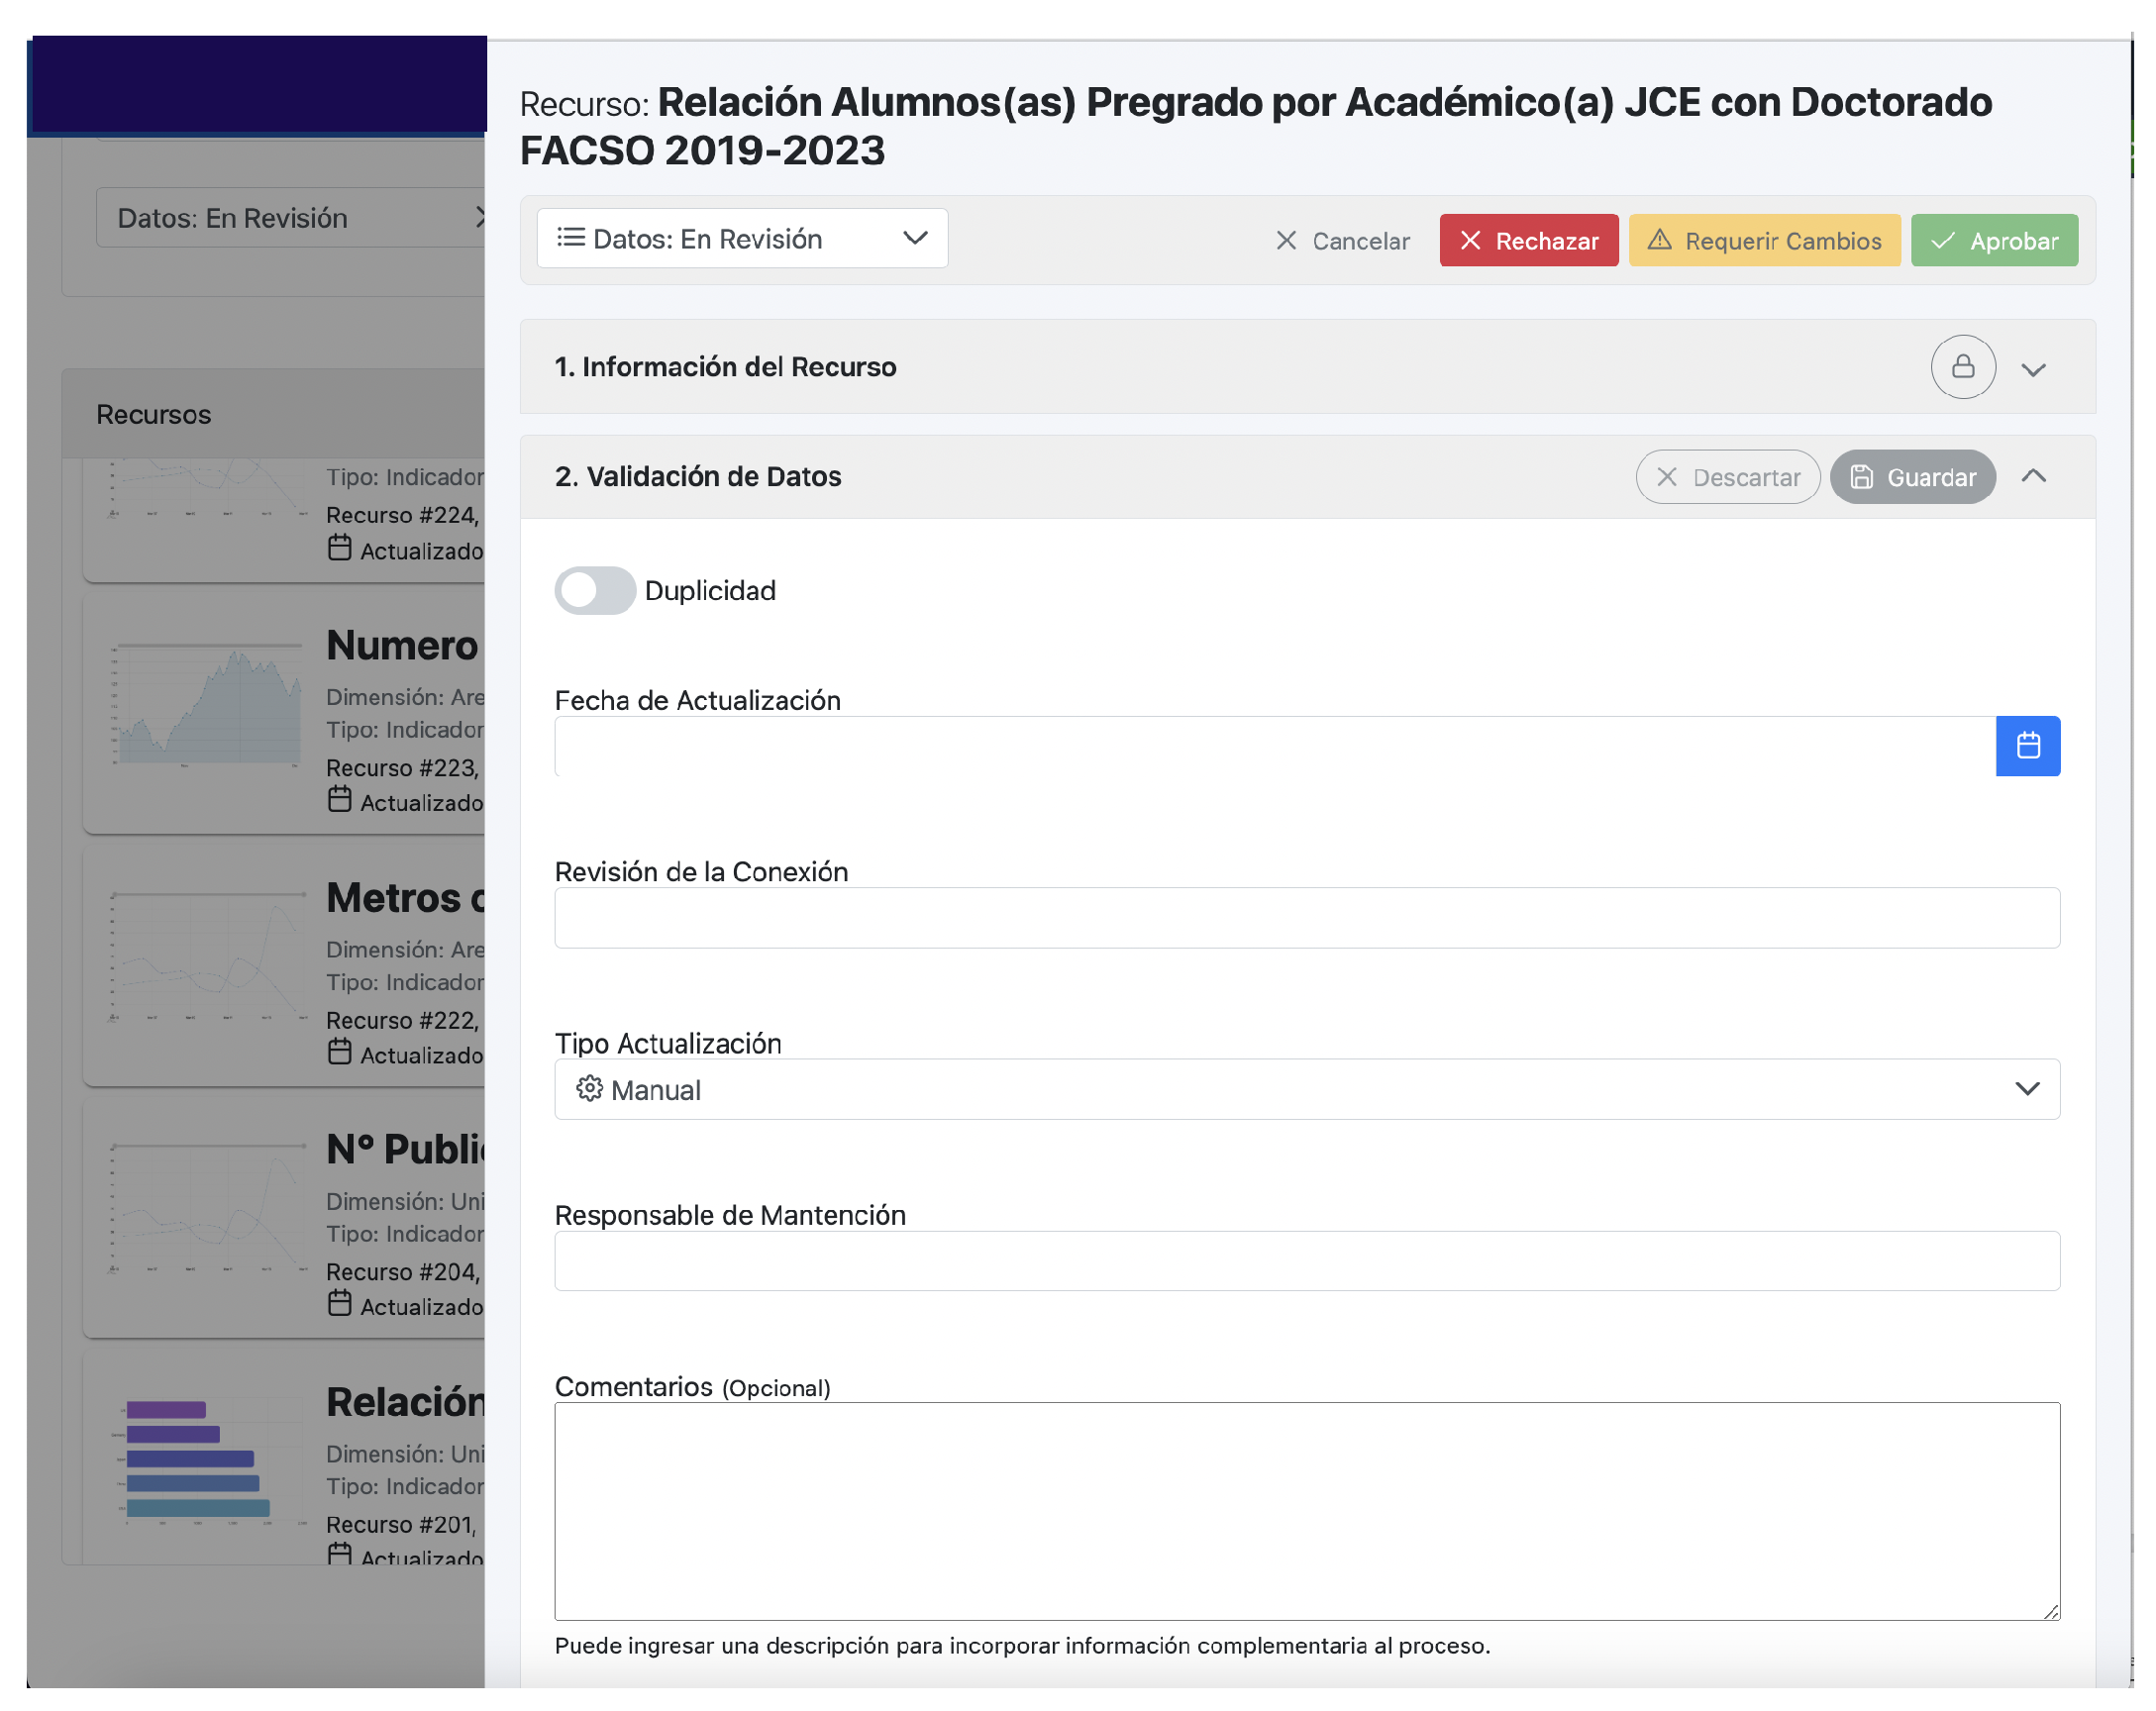
To carry out data validation for a new information resource, data administrators must click on the button with the pencil icon located on the right side of each of the resources listed in
Figure 5a. It is important to note that, in the case of data administrators, only information resources in the “Data Validation” status will have the edit button. Once this button is clicked, the resource editing form is displayed, as shown in
Figure 6. In this form, the data administrator must review the raw data contained in the resource and information related to the data source, data update frequency, among other aspects. If any anomalies are detected in the resource’s data or related information, the data administrator has the option to reject the resource or request changes from the resource administrator who created the resource. This can be achieved by selecting the “Reject” or “Request Changes” buttons, respectively. These buttons are located in the upper right corner of the view as shown in
Figure 6.
On the other hand, if the data administrator reviews an information resource and finds no irregularities, they can approve the resource by clicking the green “Approve” button, located in the upper right corner of the view as indicated in
Figure 6. By doing so, the resource advances to the “Product Validation” stage. Additionally, the data administrator can provide comments or additional relevant information according to their validation criteria in the editing form, regardless of whether they approve, reject, or request changes to the resource.
3.4.4. Product Administrator
Users assigned the “product administrator” user profile are analysts from the analytics department. The main task of this profile is to perform the validation of information resources in the “Product Validation” phase. To carry out this task, product administrators access the system and go to the information resource management view, as illustrated in
Figure 5a. In this interface, users can view all resources created by resource administrators. However, they are only allowed to validate information resources that are in the “Product: Validation” status. Resources in other stages of the process are accessible for viewing only. Additionally, in this view, product administrators also have the ability to filter information resources in the upper panel of the interface shown in
Figure 5a.
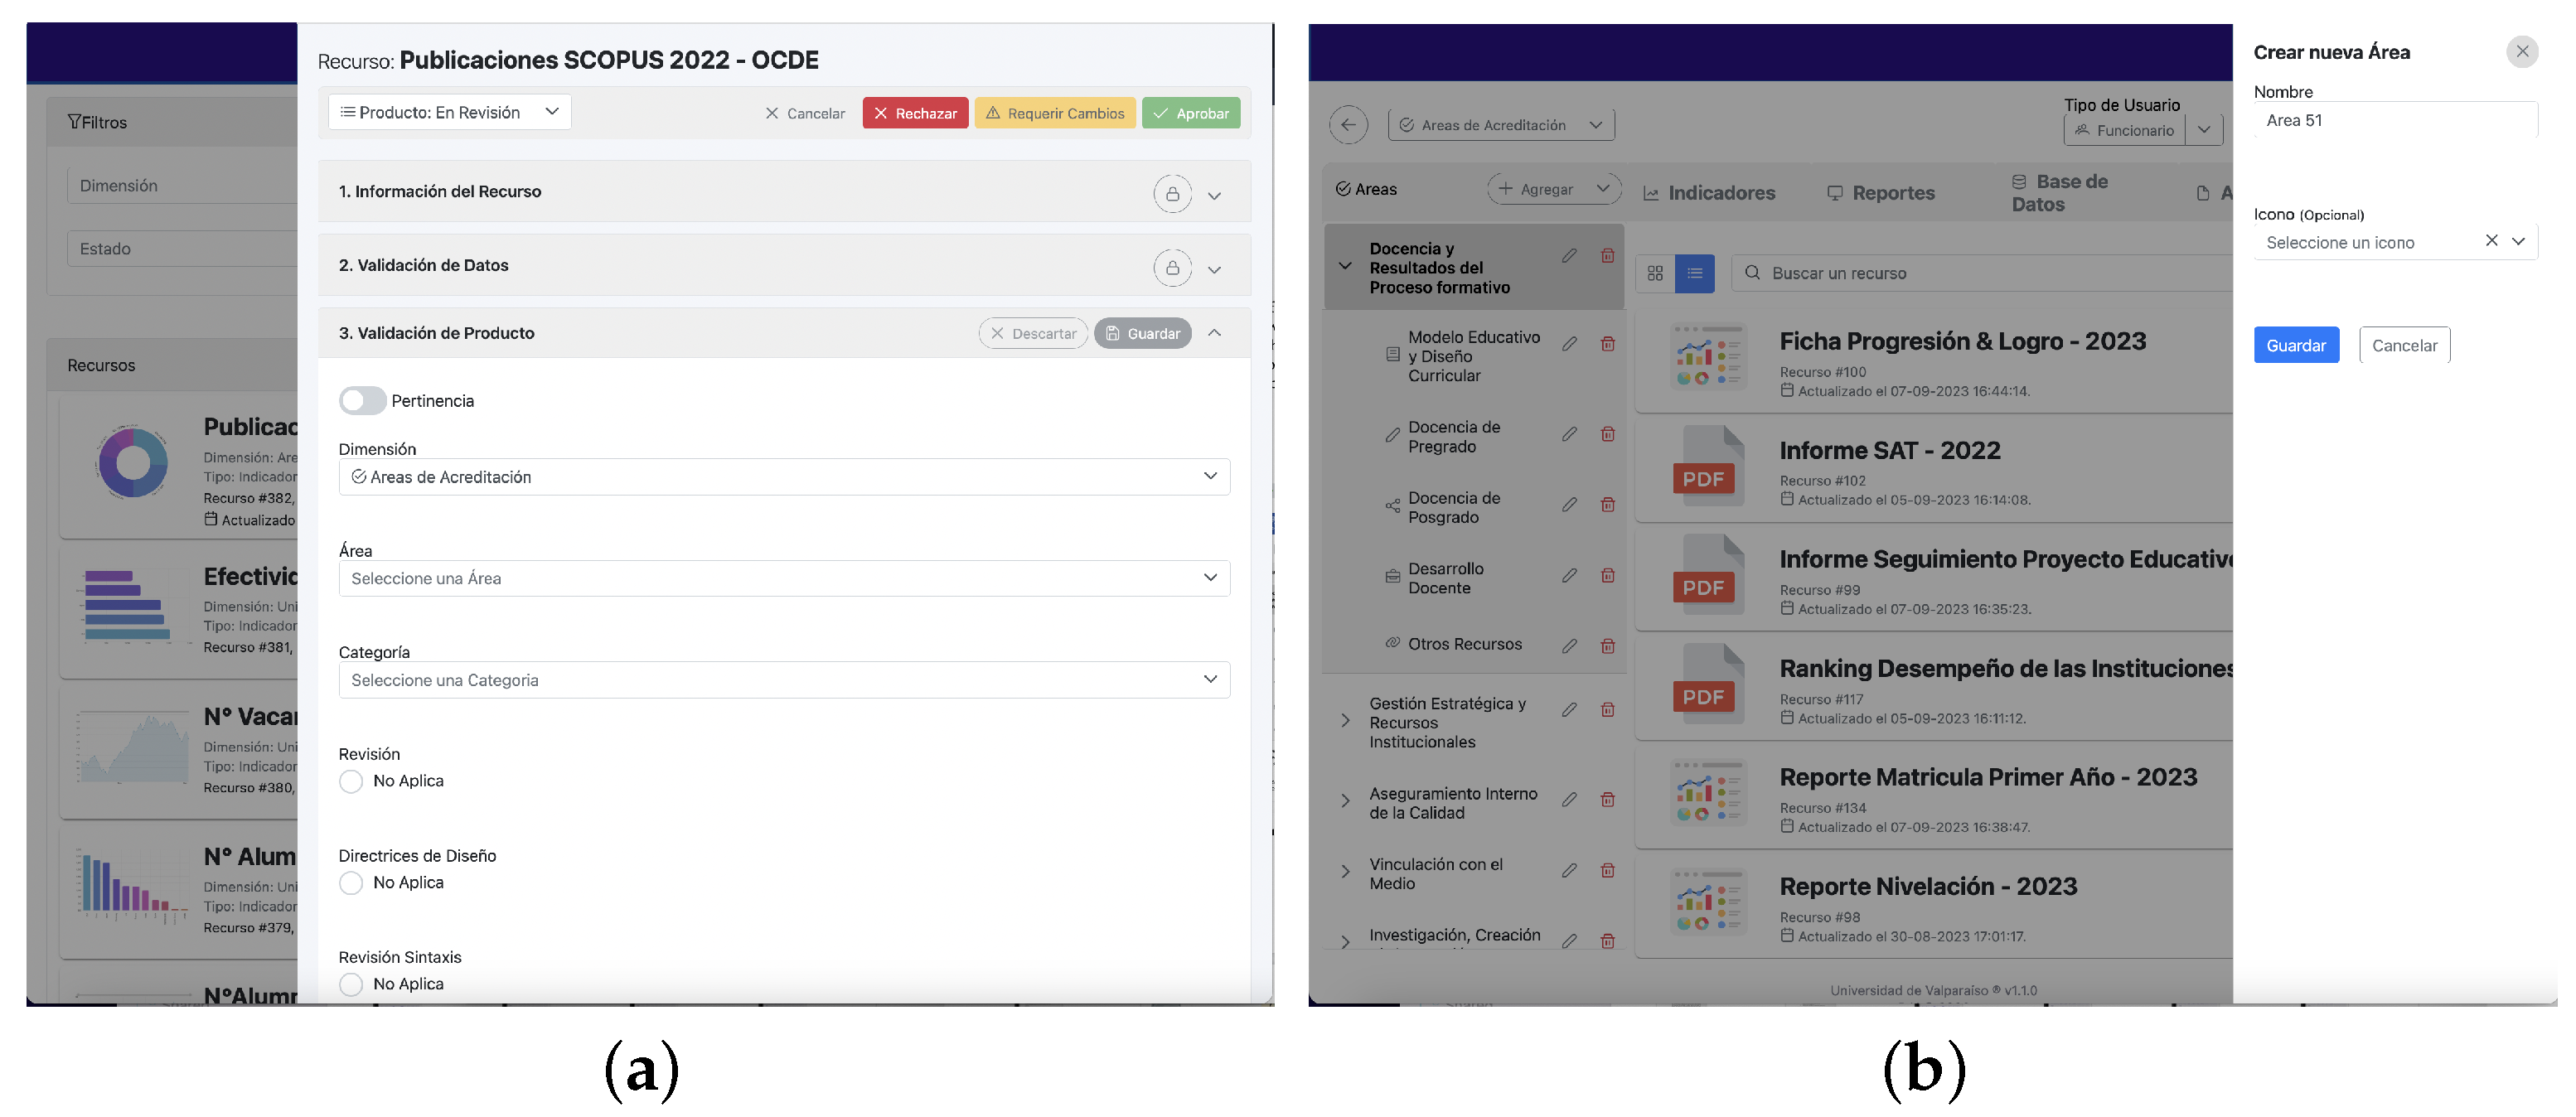
To perform product validation on an information resource, product administrators must click on the button with the pencil icon located on the right side of each of the listed resources in
Figure 5a. Then, the resource editing form is displayed as shown in
Figure 7a. In this form, the product administrator can review the information related to its categorization, as well as verifying that there are no resources with the same data in the system. If any anomalies are detected during their analysis, the data administrator has the option to reject the resource or request changes from the resource administrator who created the resource, which can be performed by selecting the “Reject” or “Request Changes” buttons, respectively. These buttons are located in the upper right corner of the view as shown in
Figure 7a. On the other hand, if the data administrator reviews an information resource and finds no irregularities, they can approve the resource by clicking the green “Approve” button, located in the upper right corner of the view as indicated in
Figure 6a. By doing so, the resource advances to the “Access Validation” stage. Additionally, the data administrator can register comments or additional relevant information according to their validation criteria in the editing form, regardless of whether they approve, reject, or request changes to the resource.
In addition to product validation, the product administrator profile also has the task of managing the categorization of information resources by creating and modifying the areas and categories available to group resources. This can be performed from the hierarchical characterization structure shown in the left panel of the view presented in both
Figure 4a and
Figure 7b. To add a new area or category, click the “Add” button located at the top of this panel, which will open the creation and editing form of areas and categories shown on the right side of the view in
Figure 7b. In this form, the product administrator must enter the name and optionally an icon for the area or category to be added or edited.
3.4.5. Access Administrator
Users assigned to the “access administrator” user profile are analysts from the analytics department. The main goal of access administrators is to ensure that information resources are viewed only by relevant information consumers. To achieve this, access administrators have two faculties in the system. First, they create and manage different access groups composed of information consumers from different parts of the organization. Second, they associate these access groups with information resources during the “Access Validation” stage of the information resource validation process.
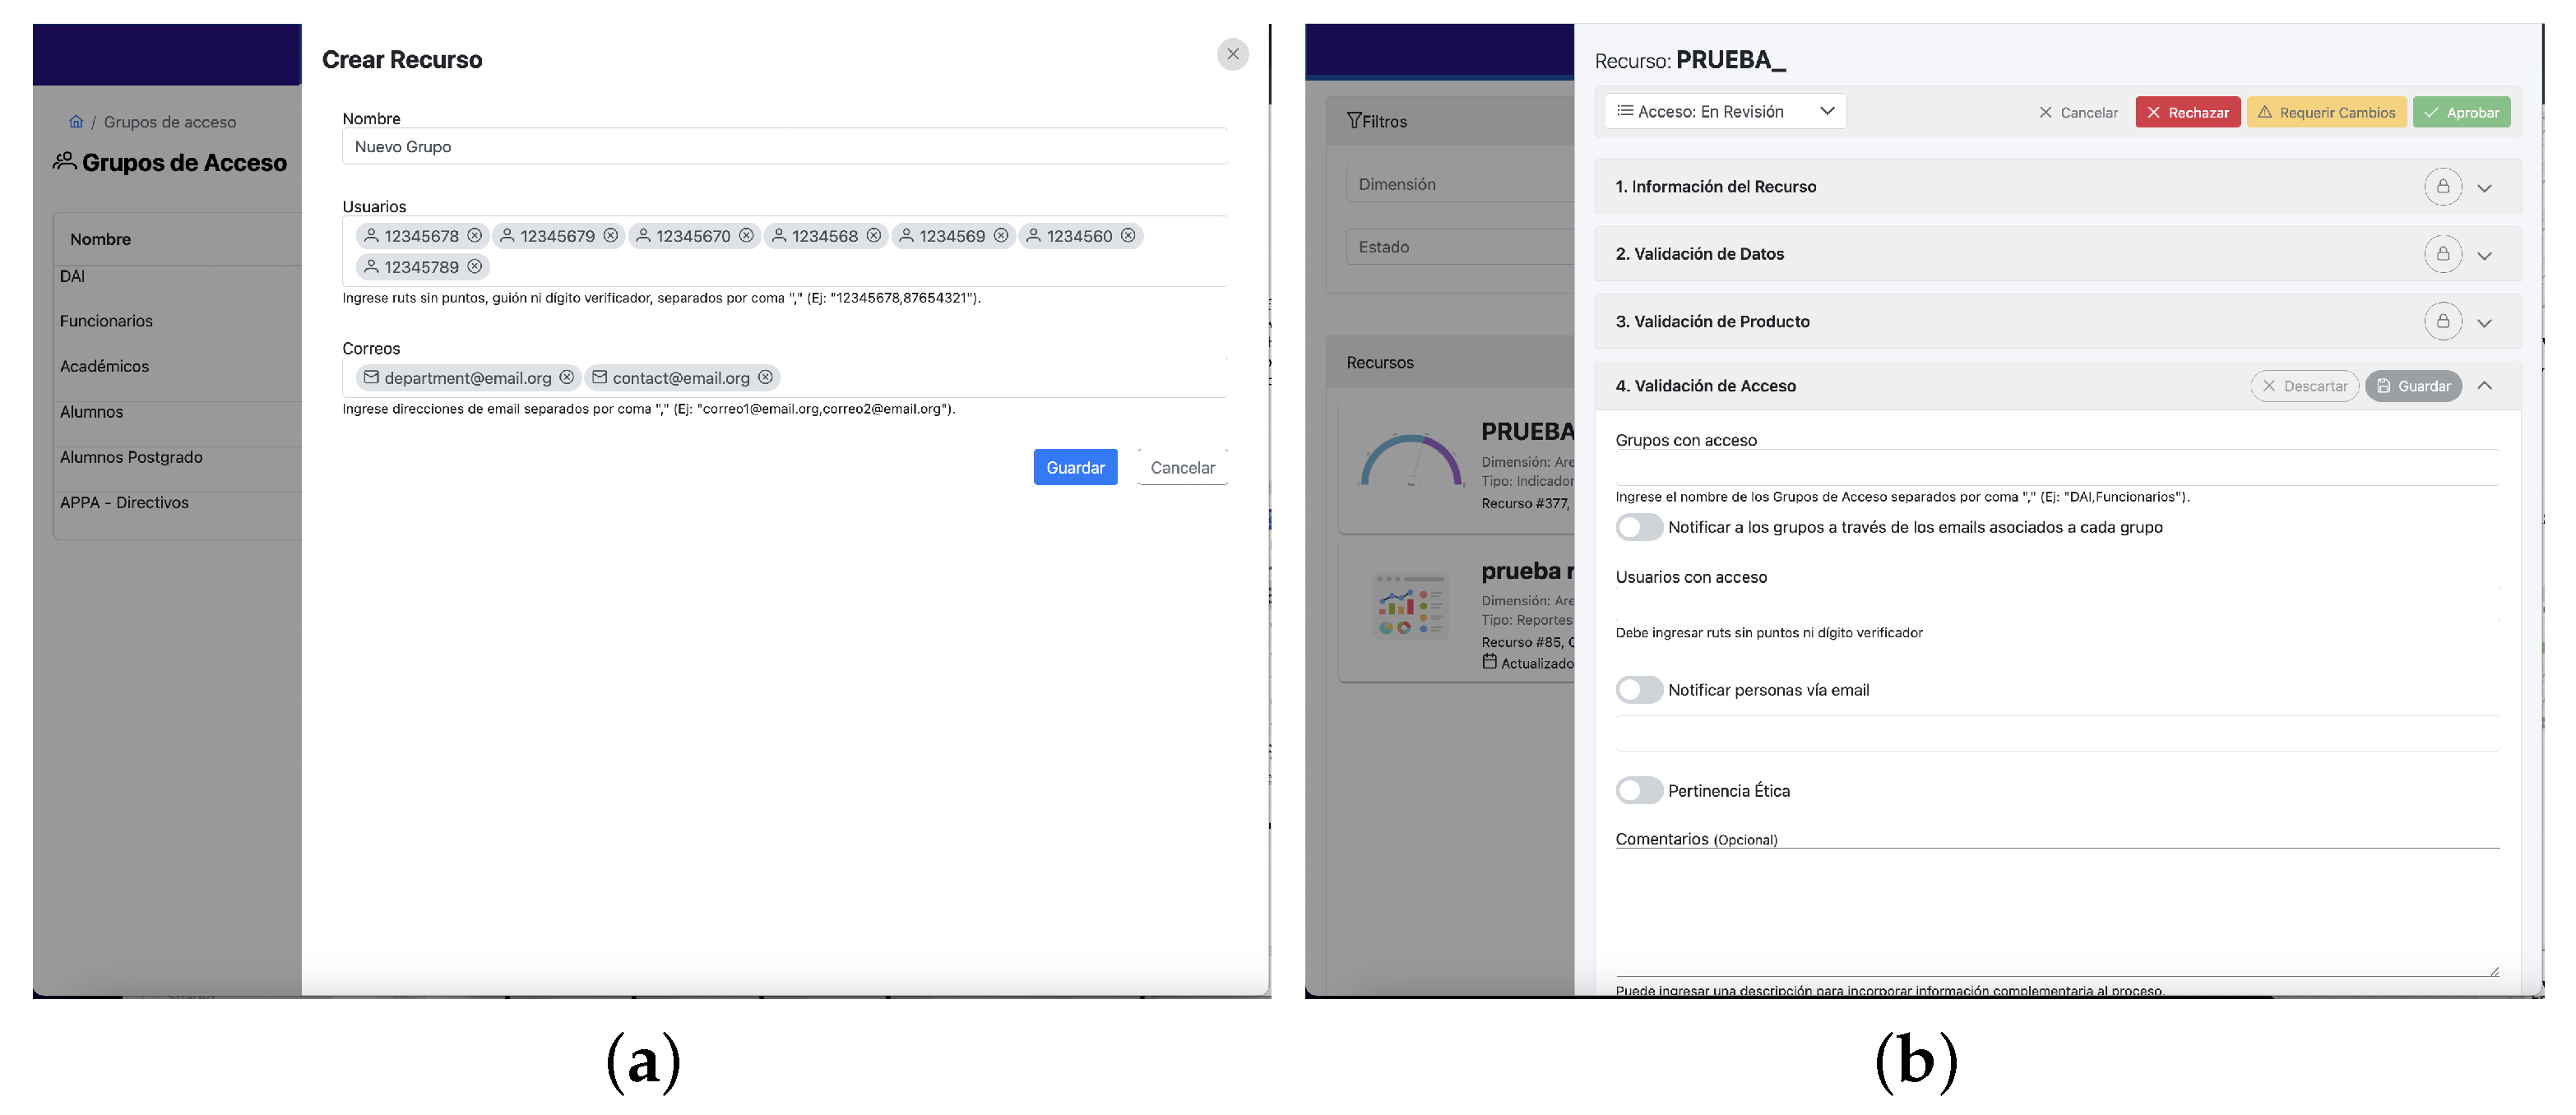
Regarding the management of access groups, this can be achieved from the access group management view shown in
Figure 8a. In this view, the access administrator can see the list of access groups created in the system, create, edit, and delete access groups. The creation and editing of access groups are performed using the form in
Figure 8a, where you must enter information associated with the access group: a name that describes and identifies the group, a list of National Identification Numbers (RUNs) to identify consumers belonging to the group, and a list of email addresses to which the system can automatically send notifications after the publication of a new resource of interest to the group.
On the other hand, the link between access groups and the information resources generated in the system is established during the “Access Validation” stage of the information resource validation process. This is performed in the information resource management view, presented in
Figure 5a. In this interface, access administrators can view all resources created by resource administrators. However, they are only allowed to validate information resources that are in the “Access: Validation” status. Resources in other stages of the process are accessible for viewing only. Additionally, in this view, access administrators also have the ability to filter information resources in the upper panel of the interface, as shown in
Figure 5a.
To perform an access validation on an information resource, access administrators must click on the pencil icon located on the right side of each of the listed resources, which opens the resource editing form as shown in
Figure 8b. In this form, the access administrator can review the information related to the access groups associated with the information resource. If any anomalies are detected during their analysis, the access administrator has the option to reject the resource or request changes from the resource administrator who created the resource by selecting the “Reject” or “Request Changes” buttons, respectively. These buttons are located in the upper right corner of the view as shown in
Figure 8b. Alternatively, they can approve the resource. The access administrator can also register comments or additional relevant information based on their validation criteria in the editing form, regardless of whether they approve, reject, or request changes to the resource.
3.4.6. General Administrator
This particular user profile enjoys unrestricted access to the full spectrum of functionalities encompassed by the other user profiles. It is vested with the comprehensive authority to administrate, govern, and curate all information resources within the system. This extends to the capacity to execute any kind of validation reviews among the information resource validation process, ensuring the integrity and accuracy of the data published for all information consumers within the organization. Furthermore, this profile is empowered with the responsibility of managing the overarching system settings, thereby orchestrating the fundamental parameters that govern the system’s operations and behaviors, among other settings.
4. Discussion
The primary objective of any information management system is to enhance the information management quality within the implementing organization. In the case of the system developed in this study, a secondary objective of equal importance is introduced, which aims to improve the information consumers’ experience. This objective is addressed through the fulfillment of organizational consumers’ needs, considering factors extracted from the literature that influence the information consumption experience.
In relation to factors such as information access, the system is integrated into the organization’s official web platform, constituting an additional application available to consumers for their daily tasks. Furthermore, the system’s deployment on the organization’s official platform enables swift access to information resources to acquire data promptly, while also promoting factors such as (F4) sociability and (F8) communication activity among consumers. This is achieved by creating spaces for centralized information visualization, sharing, and collaboration within the organization, thereby satisfying the needs for (N1) centralized information service and (N4) institutional information systems diffusion.
Conversely, the system is designed with a special emphasis on ensuring data quality published for information consumers through the validation process of information resources carried out by senior analysts in the analytics department. This validation process ensures a certain level of data quality and addresses factors related to the information consumer experience, such as (F2) accuracy, (F3) completeness, and (F12) trust.
Another feature provided by the system to enhance (F2) accuracy and (F3) completeness of information resources is error feedback. When a consumer identifies inconsistencies or issues in a specific information resource, the system allows the consumer to trigger an alert that is sent via email to the analyst who created the resource. Subsequently, the analyst can review and rectify the resource’s data, if necessary. This functionality also fosters (F5) staff responsibility among information consumers, as they inspect published information resources. It also encourages responsibility among analysts in the analytics department and external analysts, making them accountable for delivering quality data to the rest of the organization. Moreover, this mechanism of data quality issue alerts also serves to prevent any of these issues from inducing (F6) resistance behavior among information consumers towards the proposed system.
Another need satisfied by the proposed system is the requirement for a (N2) real-time information service. This is achieved through the report-type information resources, which consist of dashboards created in a Tableau Cloud server, one of the primary tools for developing information resources in the analytics department before the implementation of the proposed system. The dashboards crafted by senior analysts display real-time data extracted from the organization’s databases, managed by the IT services department. While these dashboards can be disseminated individually to information consumers via links generated by the organization’s Tableau Cloud server, the proposed system represents a centralized source from which information consumers can locate and view all reports and other information resources in a centralized system accessible to the entire organization.
5. Conclusions
The proposed information management system was conceived with a dual purpose. First and foremost, it aims to address existing issues in information management quality (IMQ) in the Chilean university. Secondly, it caters to the information consumption experience within the organization. Regarding IMQ, the system resolves an issue of information inconsistency, where certain data published by specific departments did not align with data published by the analytics department. This problem was identified during the application of document analysis and direct observation in the Empathize phase of the design thinking process. To address this issue, the proposed system establishes a unified channel for the publication of institutional data, under the supervision of senior analysts from the analytics department during the information resource validation process.
To fulfill the system’s second objective, which is meeting the needs of the organization’s information consumers, the implementation of the proposed system was carried out using an adapted design thinking process with an ICX emphasis. This ICX approach represents a novel tool to design information management tools for HCI or managerial researchers and practitioners, in order to fit the specific needs of the information consumers into the organizational context at the same time that it allows to address IMQ-related issues.
From a managerial perspective, the design and development of the proposed system allowed us to recognize the importance of information from different departments within the organization. Each department possesses specialized knowledge and specific data crucial for a comprehensive understanding of the organization. The interconnection and exchange of information between these departments enhance informed and strategic decision making, benefiting the overall functioning of the institution. The system facilitates this interconnection, as external analysts communicate with the rest of the organization through the system under the supervision of the analytics department.
The organization’s responsibility toward information is also emphasized. Proper information management is both an ethical and functional duty that the proposed system seeks to fulfill. This includes the collection, storage, processing, distribution, and protection of institutional data. In this regard, the organization acknowledges the significance of IMQ, as inadequate management can lead to ill-informed decisions, low-quality data, data inconsistency issues, security gaps, and a loss of trust among information consumers, among other problems. Hence, the validation process carried out by the analytics department is integrated into the system to safeguard information quality and integrity, implementing a process that ensures both the quality of published information and information availability to the entire organization.
Furthermore, it is essential to highlight the role played by the analytics department and its senior analysts, who transform data into useful and accessible information for information consumers. Similarly, external analysts from other departments within the organization provide an external perspective and a variety of skills, experiences, and data that can enhance the quality and usefulness of information in their respective departments. This information management process aims to provide a positive experience for information consumers. An efficient and well-designed information management system can facilitate information access, enhance data accuracy and timeliness, and enable quicker and more effective decision making. Additionally, a good user experience can improve satisfaction and confidence in the system, translating to effective use of the organization’s information and official channels.
It is important to mention that despite the results obtained in this study being only applicable to the analyzed Chilean university, the adaptation of design thinking with an ICX approach represents a replicable procedure and a contribution to information management in higher education institutions, as it not only enables efficient visualization and management of information for users at different hierarchical levels to make informed decisions but also allows for the restructuring of how the responsible units for system management work on a daily basis, thereby enhancing the efficiency and quality of the information provided. Furthermore, it could serve as a “best practice” that could be replicated by various educational institutions that need to handle a high demand for information from both internal and external users, as well as from government institutions that oversee their activities.
In terms of future work, this study can be complemented by incorporating the testing phase of the design thinking process, integrating the evaluation of Information Consumption Experience (ICX) as a tool to compare the ICX diagnosis in the organization conducted in previous work [
48]. To achieve this, the evaluation methods used in that work can be employed, or new evaluation tools or methodologies for ICX assessment from the literature can be explored. Through this evaluation, one could observe the difference in information consumers’ perception before and after the implementation of the proposed system.


 ,
, 


