Article

The Impact of Local Government Environmental Target Constraints on the Performance of Heavy Pollution Industries

1
Business School, Shandong Normal University, Jinan 250358, China
2
Economics School, Anhui University, Hefei 230601, China
*
Author to whom correspondence should be addressed.
Sustainability 2023, 15(22), 15997; https://doi.org/10.3390/su152215997
Submission received: 15 August 2023 / Revised: 9 November 2023 / Accepted: 14 November 2023 / Published: 16 November 2023

Abstract

:
The world is plagued by difficult problems such as ecological degradation and resource depletion. This study utilizes data from 664 Shanghai and Shenzhen A-share listed enterprises in the heavy pollution industry from 2007 to 2019; this paper constructs a two-way fixed effects panel model and a mediated effect model to test the relevant effects of local government environmental target constraints (LGETCs) on the performance of heavy pollution enterprises (HPEs). The main findings are as follows: First, LGETCs significantly inhibit the short-term performance of HPEs. Second, LGETCs have a heterogeneous impact on the short-term performance of HPEs based on regional, industry, and firm ownership differences. This sentence suggests that local environmental targets can exert a restraining effect on the short-term performance of heavily polluting companies by influencing factors such as financial constraints, agency costs, and levels of technological innovation. In this context, financial constraints and agency costs act as mediating factors, while corporate technological innovation and green technological innovation act as masking factors in this relationship. The sentence appears to suggest that local environmental targets can indirectly have a positive impact on the long-term performance of heavily polluting companies through innovative incentives. Furthermore, the research in this article provides theoretical support for local government efforts to address deteriorating ecological environments and expedite energy conservation and emission reduction in heavily polluting companies.

1. Introduction

The deterioration of the ecological environment and the depletion of resources are pressing issues that seriously afflict developing countries. According to the World Energy Statistics Yearbook (71st edition) published by British Petroleum (BP), global primary energy demand surged by 5.8% in 2021, causing the largest increase in history and even 1.3% higher than the pre-epidemic level in 2019, as the global COVID-19 pandemic eased and economic activity recovered. Economic growth is reliant on energy consumption; however, it brings about repercussions in the form of resource scarcity and environmental pollution. Increasing environmental pollution is responsible for the high incidence of various diseases in the population [1,2]. The World Health Organization (WTO) estimates that the majority of the global population resides in areas where air quality standards are significantly exceeded, leading to approximately 7 million premature deaths annually due to air pollution exposure. During the critical phase of post-pandemic economic recovery, pollution control remains essential, and how to reconcile environmental protection and economic development is a paramount challenge that nations worldwide cannot easily evade.
In the context of environmental pollution, the imperfect promotion and evaluation system for government officials has played a significant role. During the period of extensive economic development, local government officials were primarily evaluated based on economic performance, leading them to prioritize performance indicators over ecological concerns in their pursuit of promotions [3,4,5]. Faced with the growing severity of pollution issues and the perceived inaction of local government in environmental governance, the central government has begun incorporating environmental performance into the promotion assessment of officials. The promotion incentive policy aims to encourage officials to better balance economic development in their jurisdictions with environmentally sustainable governance [6]. As a result, the attention to environmental governance has increased, and with environmental performance integrated into the evaluation system, local officials have gradually started to shift their focus towards pollution control and emission reduction. However, despite these changes, the powerful economic gains associated with the heavy pollution industries remain a significant factor, contributing to the reluctance of local governments to fully commit to pollution control. These industries are integral to the country’s industrial and economic landscape and have a substantial impact on macroeconomic development.
On an annual basis, local government work reports establish environmental targets that guide the emphasis and direction of the government’s work throughout the year. These reports are made publicly available on the official websites of local governments, enhancing transparency and enabling public scrutiny, thereby acting as a form of public oversight. Furthermore, the local government’s setting of environmental targets creates a direct policy-driven and regulatory effect on the emissions of heavy polluting industries. Failure to comply with these targets can result in penalties and sanctions, creating a strong deterrent and environmental pressure. Local governments, based on the emission reduction objectives established in the government work reports, can employ various means, including policy, regulations, pressure, and market access, to compel companies to adopt cleaner production methods or undergo transformation and upgrades. This can promote energy efficiency and emission reductions, ultimately contributing to sustainable development and environmental goals. In summary, the pressures exerted by local governments’ environmental targets play a crucial role in motivating heavy polluting enterprises to transition, reduce pollution, and move away from short-term economic growth strategies. These pressures are channeled through a variety of internal and external mechanisms, and while they may encourage initial changes in behavior, the challenge of balancing environmental protection with economic interests remains a complex and ongoing issue. Despite the limited literature on this specific topic, it remains an important area of exploration and research.
This paper employs a two-way fixed effects model and selects a sample of Chinese listed companies in the heavy pollution industry in Shanghai and Shenzhen A-shares from 2007 to 2019 as the research sample to test the impact of LGETCs on the performance of HPEs and their mechanism. The innovations in this study include the following: (1) Regarding research perspectives, current research on the relationship between government environmental governance behavior and firm performance has mainly focused on environmental regulation policies [7,8,9], with little of the literature exploring the impact of LGETCs on the performance of HPEs from the perspective of government target accountability systems. In this study, we distinguish ourselves from previous research that has focused on micro-level investigations of environmental regulations affecting companies’ energy efficiency and emission reduction behaviors [8], as well as research on micro-level examinations of green technology innovation in businesses [10]. We also differentiate our work from prior macro-level environmental policy assessments that have concentrated on regional fossil fuel indicators [11] and boundary air pollution spillovers [12]. We take a unique perspective by considering local government reports that establish pollution reduction and energy consumption reduction targets as constraints on local environmental objectives. This perspective differs from the passive implementation of central macro-level environmental policies at the local level. Our study investigates the impact of local government self-regulation on the performance of heavily polluting enterprises from the viewpoint of environmental objectives. (2) In terms of mechanism testing, as policy effects are often a combination of positive and negative effects, this paper also focuses on the mediating effect of financing constraints, agency costs and the masking effect of innovation compensation to verify the “double-edged sword” effect of LGETCs. This paper also provides a contributory analysis of the impact mechanisms to further clarify the primary and secondary relationships of the impact mechanisms. (3) In terms of indicator construction, this study employs a text analysis approach to manually extract environmental governance objectives, such as pollution reduction and energy consumption reduction, from local government work reports. In addition to the expected targets for industrial pollutant emission reduction, this paper considers explicitly mentioned goals for reducing energy consumption as constraints on environmental objectives. It pays simultaneous attention to both the “energy-saving” and “emission reduction” aspects of environmental goal constraints.
The rest part of the paper is organized as follows: Section 2 includes the literature review and research hypotheses; Section 3 includes research design and data sources; Section 4 shows the empirical analysis; Section 5 demonstrates the mechanistic testing and further analysis; and conclusion and policy recommendations are given in Section 6.

2. Literature Review and Theoretical Hypotheses

2.1. Theoretical Review

The achievement of local governments’ publicly stated pollution reduction and energy consumption targets ultimately relies on the implementation by micro-level enterprises within their jurisdiction, with heavily polluting enterprises playing a pivotal role in meeting environmentally binding performance assessments. Following the “compliance cost hypothesis”, under the stringent environmental regulatory pressure imposed by the government, businesses are compelled to undertake pollution control measures. Particularly for pollution-intensive industries, the costs associated with environmental stewardship are relatively higher, inevitably squeezing out productive investments within the enterprise [13,14]. This implies that compliance with environmental targets by heavily polluting enterprises entails additional expenses, such as procuring environmental equipment, staff training, and equipment maintenance, resulting in a rapid escalation of the enterprise’s short-term production costs. Furthermore, decisionmakers within these enterprises may need to engage in clean technology research and development to enhance their production processes and reduce emissions to achieve the environmental objectives. Given the enterprises’ existing resource constraints in the short term, any decision in this regard would lead to changes in the enterprises’ current assets, thereby affecting their performance [15]. Particularly for pollution-intensive industries, the high costs associated with environmental stewardship further burden their production and operating expenses [16]. In the short term, the pressure of clean production and pollution control costs brought about by government environmental regulations severely narrows the profit margins of enterprises [17].
Based on the long-term perspective, actively fulfilling environmental responsibilities can enhance the reputation of heavily polluting enterprises, attracting investors and consumers and contributing to the long-term sustainable development of the enterprise. Actively adhering to government environmental governance decisions also benefits the enhancement of the market value of enterprises [18]. Furthermore, in some regions, compliance with environmental requirements is becoming a prerequisite for enterprises to enter the market. Under the influence of environmental constraints, heavily polluting enterprises may expand their consumer market by implementing energy-saving and emission reduction measures. The “Porter Hypothesis” suggests that reasonable environmental regulations can incentivize businesses to engage in technological innovation and transformation, offsetting the costs through innovative compensation effects and enhancing their competitiveness [19]. Ref. [20] based on the “Porter Hypothesis”, examined the connection between government environmental regulations and the innovation capabilities of listed companies and found that in regions with well-designed environmental policies, the innovation capabilities of companies in competitive industries were significantly improved. Under the environmental pressure of meeting environmental objectives, enterprises are stimulated to actively innovate, increasing investment in the development of clean technologies and services [21], thereby achieving a competitive advantage and high-quality development [22,23]. Innovation activities triggered by government environmental regulations typically have a lagged positive impact on economic benefits. Therefore, most of the cutting-edge literature suggests that government environmental governance decisions and the long-term performance of enterprises often exhibit a positive relationship [24,25,26,27]. Based on the above analysis, this paper proposes the following research hypothesis:
Hypothesis 1a: 
LGETCs inhibit the short-term performance of HPEs.
Hypothesis 1b: 
LGETCs promote the long-term performance of HPEs.
In the context of environmental protection, financial institutions are increasingly focusing on social and environmental responsibilities, leaning towards supporting enterprises that comply with sustainable development and environmental standards. Faced with local environmental targets leading to stricter pollution regulations, non-compliant businesses face substantial fines and legal liabilities, thereby increasing the investment risk for heavily polluting enterprises’ external stakeholders. When investment risks are higher, investors tend to charge a higher risk premium to the company. Financial institutions typically also focus on the financial health of the enterprises; environmental regulations can negatively impact a company’s financial situation, and environmental risks may lead to financial instability, thereby reducing the confidence financial institutions have in these companies. Companies subject to stringent environmental regulations, seeking bank loans, also need to pay higher interest rates [28]. Additionally, heavily polluting companies, aiming to achieve government environmental objectives, need to invest significant funds to upgrade technology and improve operations. These costs can impede a company’s cash flow, reducing short-term investment efficiency and subsequently affecting their own financing capabilities. The existence of financing constraints restrains a company’s growth, investment, and external economic activities, ultimately leading to a decline in the company’s performance [29]. Based on the above analysis, this paper puts forth the following research hypothesis:
Hypothesis 2: 
LGETCs further inhibit the short-term performance of HPEs by increasing corporate financing constraints.
In the face of uncertain external business environments, companies often incur higher non-productive expenses and tax burdens. The adverse effects of policy uncertainty on a company’s production and operations tend to be more pronounced [30]. According to the principal–agent theory, environmental uncertainty exacerbates the agency conflicts existing between shareholders and management [31]. Heavily polluting enterprises facing constraints from local government energy-saving and emission reduction targets present worrisome prospects. The information asymmetry in the principal–agent process facilitates management’s “self-dealing” behavior. Furthermore, management typically exhibits self-interest and short-sightedness, leading to behavior aimed at maximizing personal benefits through premature consumption when confronted with operational risks [32]. This behavior results in increased agency costs for the company. The rise in agency costs reflects inefficiencies in the internal principal–agent mechanism of the company. Shareholders fail to provide effective oversight of corporate executives, leading to a lack of motivation on the part of managers to maximize the company’s interests, which is detrimental to the company’s sound operation. Additionally, excessively high non-productive expenses, regarded as agency costs, can squeeze the share of productive investments within the company, potentially leading to a situation where the company faces “reduced investment levels and diminished operational efficiency”. Therefore, the elevated agency costs within a company do not bode well for achieving stable improvement in financial performance, making it challenging to realize the maximization of corporate value [33,34]. Based on the above analysis, this paper proposes the following research hypothesis:
Hypothesis 3: 
LGETCs raise the agency costs of HPEs and increase their operational burden, which is not conducive to the performance improvement of HPEs.
After facing significant pressure from the government’s energy-saving and emission reduction targets, heavily polluting companies are left with two options. In the short term, they can choose to drastically reduce their emissions to ensure their own survival. However, for long-term sustainability and growth, they can opt to develop clean technologies, upgrade their processes, and enhance resource utilization to address environmental governance pressures [23,35,36]. Reasonable environmental constraints imposed by the government can stimulate companies to invest in research and development, leading them to prefer low-energy, low-pollution, green, clean technologies during their production processes [36,37]. This, in turn, contributes to enhancing their technological innovation capabilities, particularly in the realm of green technology innovation. Leading scholars commonly assert that technological innovation has a substantial positive impact on a company’s performance. It can compensate for the various costs incurred by businesses due to compliance with environmental regulations, a phenomenon referred to as the “innovation compensation effect” [20,38]. Green technology innovation, in particular, serves as an effective means to simultaneously achieve pollution control, emission reduction, and economic benefits, facilitating companies in exploring a path of innovation-driven green sustainable development. Based on the above analysis, this paper proposes the following research hypothesis:
Hypothesis 4: 
The LGETCs are conducive to the improvement of the innovation level of the HPEs, which can mitigate the negative impact on the performance of the HPEs, and there is an innovation compensation effect.
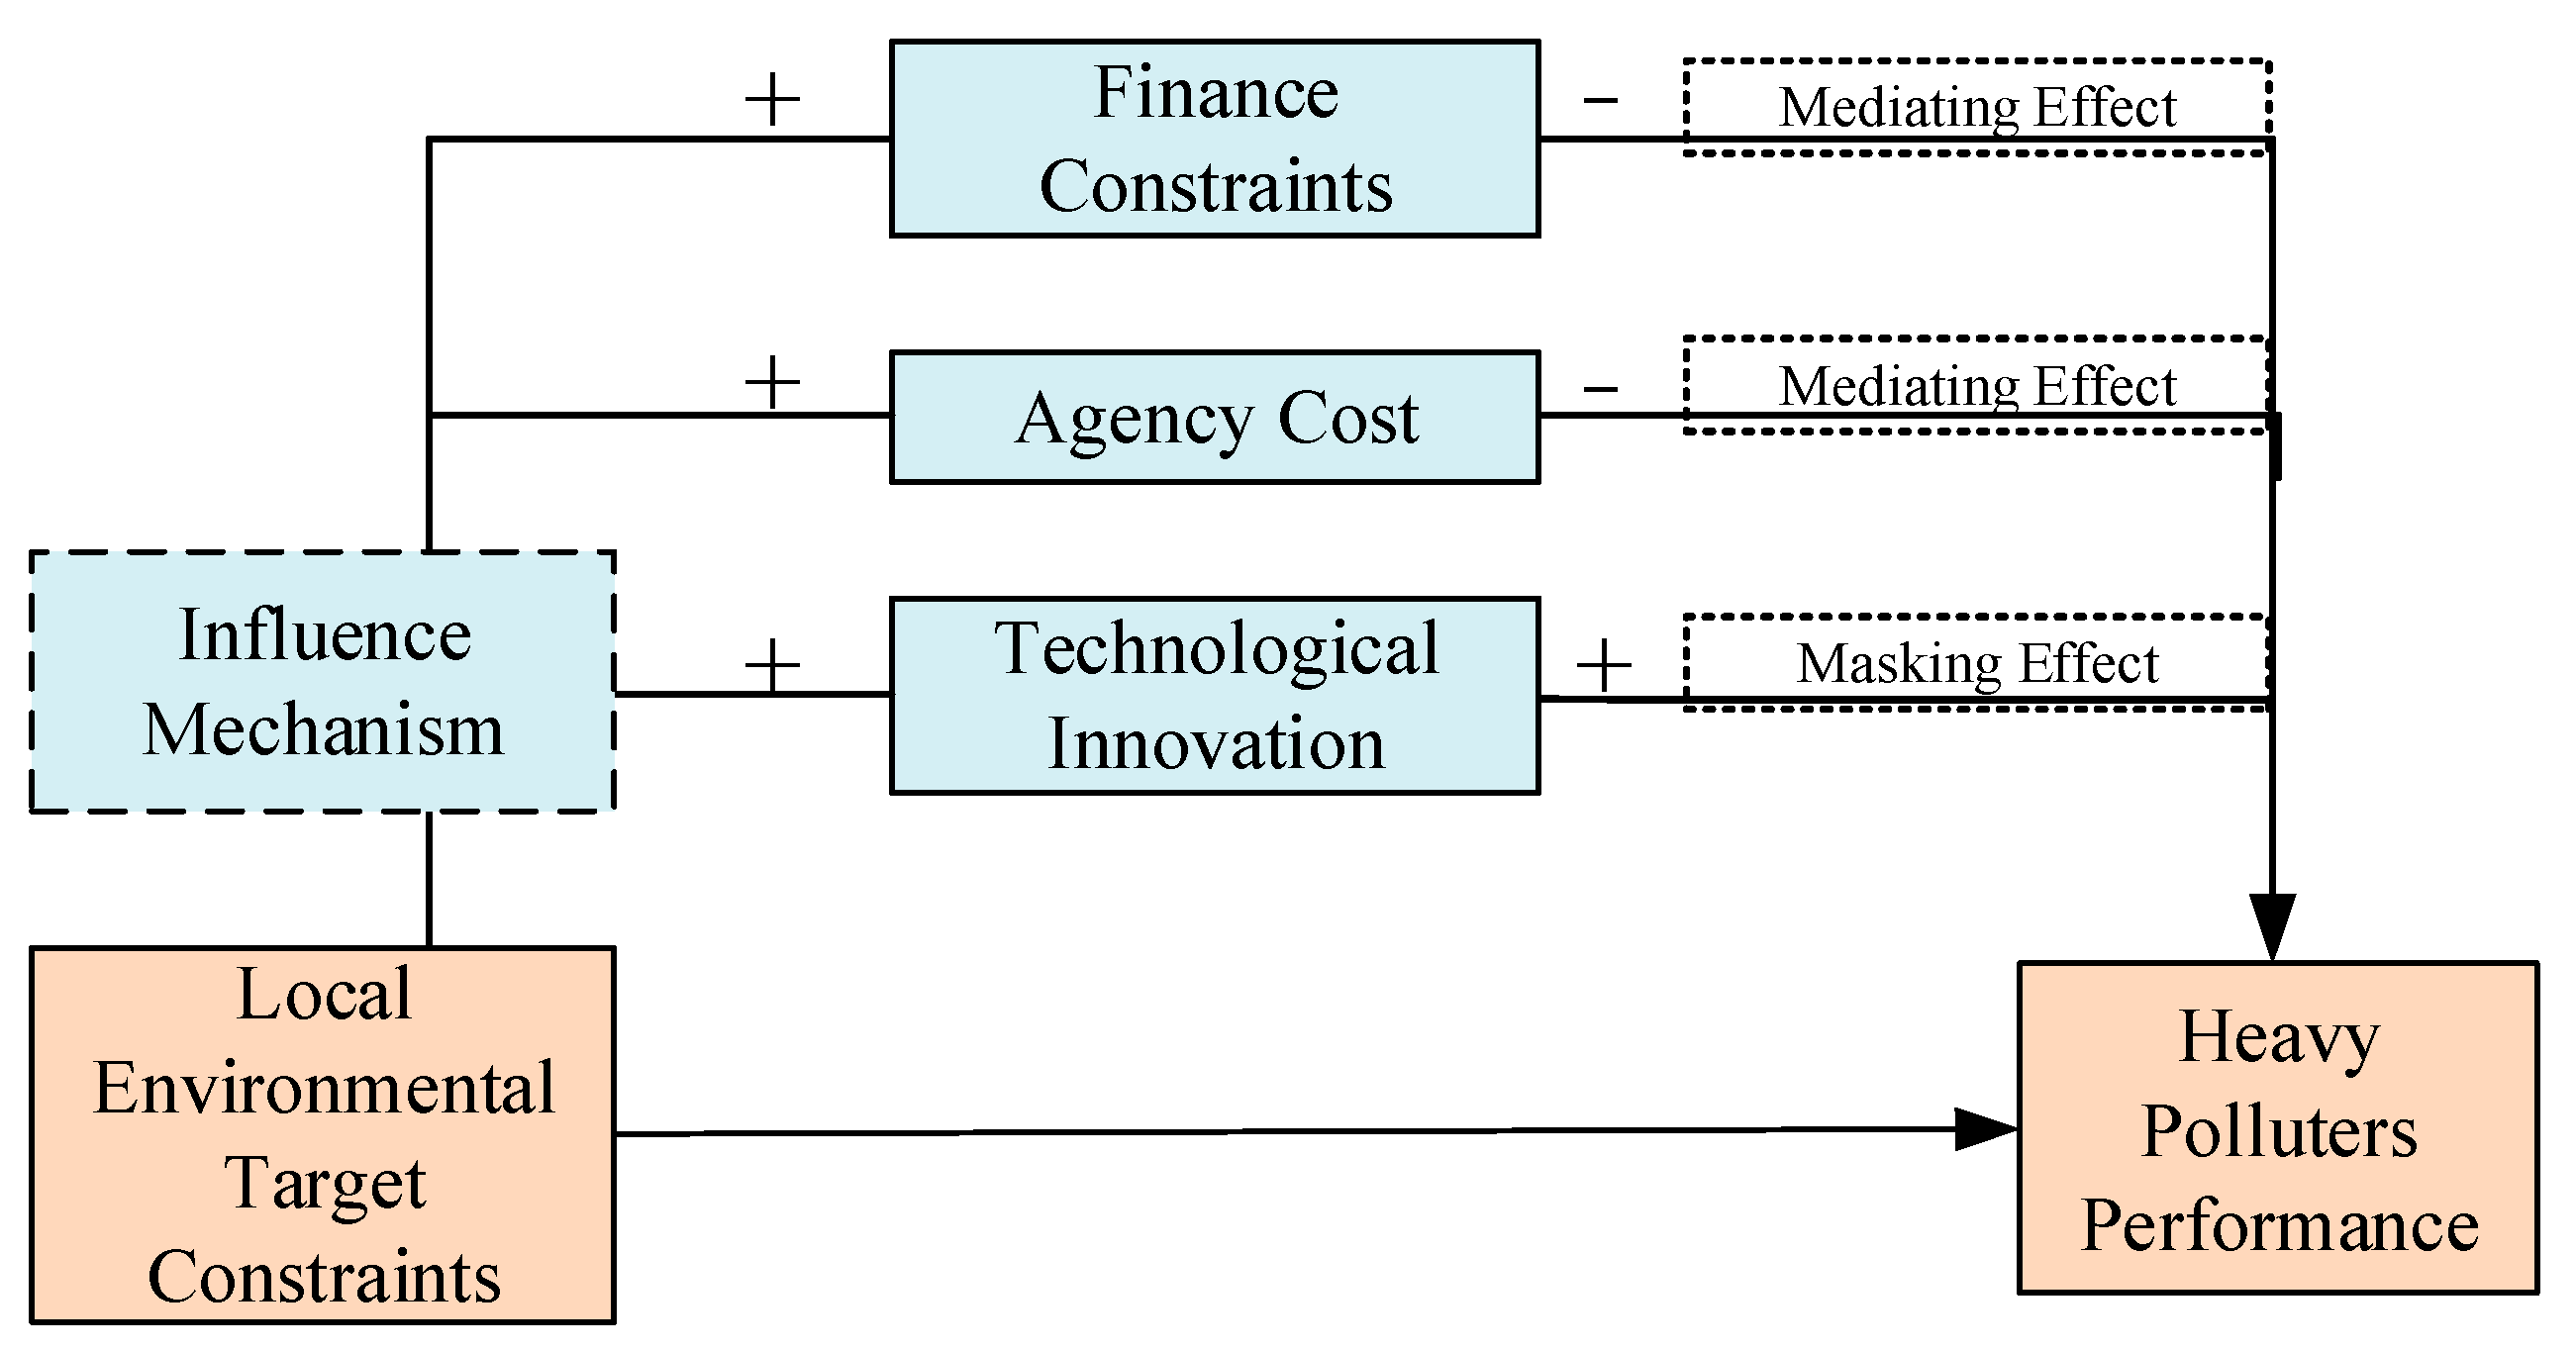
In summary, the hypotheses of this paper on the effect of LGETCs on the performance of HPEs and the mechanism of the effect are shown in Figure 1.

2.2. Review of Empirical Studies

The relevant literature in this regard can be categorized into two aspects. The first aspect examines the substantive impact of environmental targets on pollutant emissions, focusing on the changes in emissions of pollutants like sulfur dioxide at the macro-level, such as prefecture-level cities and counties. Ref. [39] analyzed government work reports from 230 Chinese cities for the years 2004–2013, and their findings suggest that environmental target constraints have a positive effect on local economic development, but this effect is influenced by officials’ proactiveness. Ref. [40] examined the influence of local governments’ environmental concerns on local atmospheric pollution by measuring economic growth constraints and environmental target constraints. They found that in regions without economic pressure, local governments can effectively achieve environmental target constraints, leading to a significant reduction in atmospheric pollution. Local governments tend to balance their governance efforts between economic and environmental aspects, and in the presence of economic growth pressure, environmental governance may be overlooked. Ref. [23] based on the economic growth goals of 257 prefecture-level cities in China, found that moderate goals effectively improve carbon emission performance, but overly ambitious goals may backfire. However, ref. [21] discovered that the negative impact of economic growth pressure on environmental pollution can be mitigated through the intensity of environmental regulations.
The second aspect of the literature focuses on the impact of external environmental regulatory pressure on a firm’s production and strategic decisions from the perspective of corporate decision-making behavior. Ref. [36] treat China’s environmental target constraints as an exogenous policy shock and examine their effects at the firm level. They find that, in the short term, environmental target constraint policies can effectively reduce emissions of atmospheric pollutants by firms but do not show effectiveness in promoting long-term emission reduction measures like green technology innovation. However, there are differing views on the impact of environmental regulation on firm innovation effects. Ref. [10] based on central vertical environmental monitoring policies, found that real-time environmental monitoring stations can promote green technology innovation by firms. Micro-level firms, as the primary contributors to societal production, are crucial for pollution control efforts, and the focus of environmental regulation on pollution control largely centers around encouraging firms to engage in the development of clean and green technologies. However, technological innovation comes with high costs, uncertainties, and associated risks, all of which have a direct connection to firm performance. Therefore, studying the impact of environmental target constraints on firm performance is of significant importance.
3. Research Design and Data Sources

3.1. Model Setting

Taking into consideration the potential presence of factors that may vary over time, such as market conditions and technological levels, as well as factors that may not change with time but instead evolve with industry characteristics, such as industry preferential policies and regulatory policies, and recognizing the possible existence of causal and reverse relationships between local environmental target constraints and the development of heavily polluting companies in the region, it is necessary to control for both the time and industry dimensions of the companies. To conduct a more comprehensive and accurate examination of the relationship between these factors, this study opted for a two-way fixed-effects model for empirical testing. To examine the impact of local environmental target constraints on the performance of heavily polluting enterprises, this study refers to the research design by [12] and constructs the econometric test model as follows:
P e r f o r m a n c e i t = α 0 + α i E n C o n i j t + α x X i t + θ t + μ z + ε i t
where i represents the listed company, j represents the region where the listed company is located, t represents the year, and z represents the industry to which the listed company belongs. The dependent variable is firm performance ( P e r f o r m a n c e ), using the return on total assets ( R O A i t ) and earnings per share ( E P S i t ) of firm i in year t , respectively, to represent the short-term performance and Tobin’s Q value ( T o b i n Q i t ) to represent the long-term performance; E n C o n i j t represents the LGETCs, which are the main independent variable in this paper, and if there is an environmental target constraint in year t for the government of region j where enterprise i is located, E n C o n i j t takes the value of 1, otherwise it takes the value of 0; α 0 is the constant term, α i is the coefficient of the main independent variable, α x is the coefficient of each control variable, X i t is the set of control variables, θ t is the year fixed effect, μ z is the industry fixed effect, and ε i t is the random error term of the econometric model.
Drawing on [41] research design ideas, this paper further designs a model for testing the impact mechanism of LGETCs affecting firm performance, as shown below:
M e d i t = α 0 + ω i E n C o n i j t + α x X i t + θ t + μ z + ε i t
P e r f o r m a n c e i t = α 0 + γ i E n C o n i j t + ρ i M e d i t + α x X i t + θ t + μ z + ε i t
where M e d i t denotes the influence mechanisms, mainly including financing constraints (FinCon), agency costs (Agent), technological innovation (Tech), and green technological innovation (Gtech). ω i denotes the coefficient of effect of LGETCs on the mechanism, γ i denotes the coefficient of effect of LGETCs on firm performance after adding the mechanism, ρ i denotes the coefficient of effect of the influencing mechanism on firm performance, and the rest of the variables are set in line with the baseline test model.

3.2. Indicator Construction

Firm performance ( P e r f o r m a n c e ): Currently, there are mainly two categories of measurement methods for firm performance in the literature. The first category includes financial performance indicators such as return on assets (ROA) and earnings per share (EPS). These indicators reflect a company’s overall input–output situation and profitability. The second category comprises performance indicators based on market performance, such as Tobin’s Q. Tobin’s Q is a measure of firm performance based on the market value of a company and reflects investors’ evaluation of various aspects of a company’s overall capabilities, including its operations and profitability. It is a metric that can capture a company’s long-term performance. The research design in this paper draws inspiration from [42,43]. We employ two performance indicators, namely, return on assets (ROA) and earnings per share (EPS), to empirically analyze firm performance. Additionally, we use Tobin’s Q value to assess long-term firm performance. We further delve into the impact of local environmental target constraints on the long-term performance of heavily polluting firms.
LGETC ( E n C o n i j t ): The level of environmental pollutant emissions serves as a visual indicator to gauge the extent of environmental pollution in a region, while the reduction in pollutants accurately reflects the effectiveness of environmental governance in that area. This study draws upon the research methodology of [40] and employs Python3.7 software to scrape the annual government work reports published on the official websites of various prefecture-level cities in China, using the largest search engine in China, Baidu. Subsequently, a text analysis approach is applied to filter the content of these local government work reports. Given that high pollution and high energy consumption are often closely intertwined at both regional and industrial levels, energy consumption indicators can substantially reflect the level of environmental pollution. However, certain indicators such as the number of days with good air quality, PM2.5 concentration, and CO2 emissions are influenced not only by industrial pollution sources but also by factors such as vehicle emissions, dust, and biomass burning. These indicators exert relatively weak direct constraints on the production and operations of heavily polluting enterprises. Therefore, this study does not take them into consideration. Based on the aforementioned analysis, this study focuses on local environmental constraints in the form of specific reduction targets for four major pollutants and regional energy consumption, as mentioned in the annual government work reports of prefecture-level city governments. If a city government specifies numerical targets related to the reduction in pollutants or energy consumption in its annual work report for a given year, the variable is assigned a value of 1. If there are no explicit numerical targets for the reduction of pollutants or energy consumption, the variable is assigned a value of 0.
Mechanism variables: (1) Corporate financing constraints (FinCon): This paper uses the more comprehensive KZ index [44] to measure corporate financing constraints, which uses five factors such as net operating cash flow, cash holdings, cash payout level, debt level, and growth as proxy variables to characterize financing constraints. (2) Agent costs (Agent): In this paper, agent costs are measured using the management expense ratio, following the research methodology outlined in [45]. A higher management expense ratio indicates a greater likelihood of management using their actions to appropriate corporate interests, leading to higher agent costs for the company. (3) Technological innovation (Tech) and green technological innovation (Gtech): This paper adopts the research methodology as referenced in [12] to measure the level of technological innovation in companies from an output perspective. Technological innovation (Tech) is quantified by the number of patents applied for by publicly traded companies. Green technological innovation (Gtech) is assessed by the number of green patent applications. In this paper, the patent application data of listed companies are obtained from the State Intellectual Property Office (SIPO). Based on the classification standard of Green List of International Patent Classification [46] published by the World Intellectual Property Organization (WIPO) and the patent data classification number of listed companies, the patent data of listed companies from SIPO are identified as “green patent” and the number is summed up to the parent company level of listed companies to obtain the green patent application data of listed companies.
Control variables: (1) Large-scale enterprises tend to exhibit stronger overall strength and have obvious advantages in terms of capital operation level, input–output efficiency and market share. This paper examines the size of enterprises in terms of both asset level and manpower level, measured in terms of total enterprise assets (Size_ass) and number of employees (Size_sta), respectively. (2) The age of a company (Age) reflects the life cycle in which it is operating. As a company matures, its competitive abilities and adaptability to the external environment generally improve. However, prolonged company age can also lead to stagnation, especially in heavy pollution industries, which may cause “path locking” effects and failure to innovate and adapt in a timely manner, to the detriment of the company’s performance. (3) Growth capability (Grow) is one of the most important factors for the sustainable development of an enterprise, and an enterprise with robust growth potential tends to possess strong market competitiveness. Relevant studies have shown that the ability to grow a company and its performance usually show a significant positive correlation, and it is one of the drivers of corporate performance improvement. (4) Ownership concentration (Own) examines the degree of centralization of corporate governance. An increase in ownership concentration indicates a rise in the voice of major shareholders within the company, which is conducive to effective supervision of corporate executives and promotes improved corporate performance. (5) The proportion of fixed assets (Fix) in a company reflects the rationality of its resource endowment structure. An excessively high proportion of fixed assets means that a large number of assets are in a frozen state and cannot participate flexibly and effectively in the enterprise asset operation process to create value, leading to a lower level of enterprise performance. (6) Board size (Board) is an important indicator of a firm’s assets and capabilities, and the ability of the board to perform an active governance function contributes to the performance of the firm. In order to minimize the estimation bias due to omission of variables, this paper controls for the above factors affecting corporate performance.
The main variables’ measurement throughout this paper and the results of the descriptive statistics are shown in Table 1.

3.3. Samples and Data Sources

During the Eleventh Five-Year Plan, the Chinese central government gradually began to emphasize the effectiveness of environmental governance in the promotion assessment system for cadres, and in 2007, the Ministry of Environmental Protection established regulations with provinces and municipalities to combat pollution and reduce emissions, urging local governments to pay attention to environmental governance, when environmental performance was formally included in the promotion assessment system for local officials. Since 2020, the COVID-19 pandemic has ravaged the world, causing difficulties in production and operation, with many SMEs struggling to survive or even shutting down. Therefore, this paper takes the formal incorporation of environmental performance into the officials’ assessment system as the starting point of the time window, while avoiding the estimation bias caused by the shock of the coronavirus pandemic, selects all A-share listed companies in Shanghai and Shenzhen in China’s heavy pollution industry from 2007 to 2019 as the research sample, and further treats the data as follows: (1) exclude the sample enterprises of ST and *ST; (2) exclude samples with abnormal financial indicators, e.g., total assets less than current assets, total assets less than fixed assets, fixed assets at zero, etc.; (3) exclude samples where the year of establishment or year of listing of the business is missing; and (4) Winsorize of the main continuous variables to the 1% and 99% quartiles. Finally, a total of 664 HPEs with 5710 observations were screened. The data on LGETCs in this paper were obtained from the government work report documents published on municipal government websites across China in previous years and were manually collated. Financial indicators and characteristic information at the enterprise level were obtained from the CSMAR database, and patent application data of listed companies were obtained from the State Intellectual Property Office of China.
Based on geographic coordinate data obtained through ArcGIS 10.2 software based on the registered address of the enterprise, a map of the distribution of heavy pollution listed enterprises in China was drawn up as shown in Figure 2, and it can be seen that the listed HPEs in China predominantly cluster in the central and eastern regions, among which the Yangtze River Delta region and the Pearl River Delta region have the highest concentration, while the western region and the northeast region have a lower concentration of listed HPEs.

4. Empirical Analysis

4.1. Baseline Results

According to the baseline test model (1), the test results of the impact of LGETCs (EnCon) on firm performance (ROA, EPS) are shown in Table 2. Columns (1) and (3) report the results of regressions of model (1) without controlling for the year fixed effect and industry fixed effects, and columns (2) and (4) report the results of regressions of model (1) after controlling for year fixed effects and industry fixed effects. It can be seen that after controlling for two-way year and industry fixed effects, the model exhibits an improved fit, but the primary independent variable, LGETC (EnCon), decreases in significance and correlation. In terms of the regression coefficients of the primary independent variables, the coefficients of the effect of LGETCs (EnCon) on return on total assets (ROA) are significantly negative at the 1% level and 5% level, respectively, and the coefficients of the effect on basic earnings per share (EPS) are both significantly negative at the 1% level.
The results in Table 2 show that there is a significant decrease in the performance of HPEs in areas with LGETCs in comparison to those without. LGETCs significantly inhibit the performance of HPEs. Possible explanations for this phenomenon include the fact that, on the one hand, most of the industrial pollutant reduction and energy consumption reduction targets outlined in the LGETCs need to be met at the micro-enterprise level, and enterprises will inevitably have to invest in environmental management to reduce pollutant emissions, as well as invest more in R&D with a view to reducing energy consumption and pollution per unit of output through technological upgrading [10]. On the other hand, environmental target constraints can reflect the intrinsic drive of local governments in environmental governance. They are willing to disclose environmental goals and accept public supervision [40]. Therefore, regions with such constraints invariably exhibit a higher level of environmental consciousness. Under stricter environmental regulations, heavily polluting companies will alter their production patterns from the “high-pollution, high-energy consumption” model. In the short term, given the predetermined resources of the companies, their productive investments are bound to decrease, which reduces their profit margins and results in the suppression of corporate performance.

4.2. Endogeneity Test

4.2.1. Propensity Score Matching

Due to data and selection bias issues, this study employs propensity score matching to control for differences in control variables between the experimental and control groups. In the matching process, this paper adopts both 1:5 nearest neighbor matching and kernel matching methods, ensuring that the control variables for the experimental and control groups are roughly similar. This is conducted to further mitigate sample selection bias issues, as elaborated in Table 3. The results indicate that, after minimizing sample selection bias interference as much as possible, the environmental targets imposed by local governments significantly inhibit the performance improvement of heavily polluting enterprises, thereby confirming the stability of the core conclusions of this paper.

4.2.2. Instrumental Variable Methods

The evaluation of the relationship between environmental target constraints and the performance of heavily polluting companies in this study may be subject to endogeneity issues. In regions with high concentrations of heavy pollution, the setting of environmental targets may exhibit reverse causality due to resource endowments. Furthermore, despite the study’s efforts to control for variables that have a significant impact on corporate performance, there is still the possibility of omitting certain unobservable factors such as corporate culture or reputation. To mitigate endogeneity bias, the study leverages data from the China Stock Market & Accounting Research (CSMAR) database, which includes environmental data, as well as financial statement notes that detail environmental investments and government subsidies. Following the research methodology of [47], the study selects the natural logarithm of the average amount of government environmental subsidies received by other companies in the same province as an instrumental variable (IV) for environmental target constraints (EnCon). On one hand, companies operating within the same province are likely to face similar market conditions, environmental policies, and government support, making interference with environmental target constraints positively correlated. Moreover, regional environmental target constraints are often determined based on reports from higher-level provincial governments, resulting in similar constraint intensities among areas within the same province. On the other hand, subsidies received by other companies in the same province are unlikely to directly impact the performance of the focal company. Taken together, the study concludes that this instrumental variable satisfies the conditions of relevance and exogeneity, thus providing a robust approach to address the issue of endogeneity in the evaluation of the relationship between environmental target constraints and corporate performance.
The results in Table 4 indicate that the first-stage F-statistic is 19.51, which exceeds the critical value of 10 commonly used as a threshold. Furthermore, both the Kleibergen–Paap rk LM test for weak instrument identification and the Cragg–Donald Wald F-statistic for weak instrument validity are greater than the critical value of 16.38 at the 10% weak instrument bias level according to the Stock–Yogo weak instrument threshold. This suggests the absence of weak instrument problems. In the first column (1), the first-stage regression results show that the coefficient estimate of the instrument variable (IV) is significantly positive at the 1% level. Looking at the regression results in the second column (2), the inhibitory effect of environmental target constraints on the performance of heavily polluting enterprises remains statistically significant. This indicates that after controlling for endogeneity bias using the instrument variable, the core conclusion remains valid.

4.3. Heterogeneity Analysis

4.3.1. Regional Heterogeneity

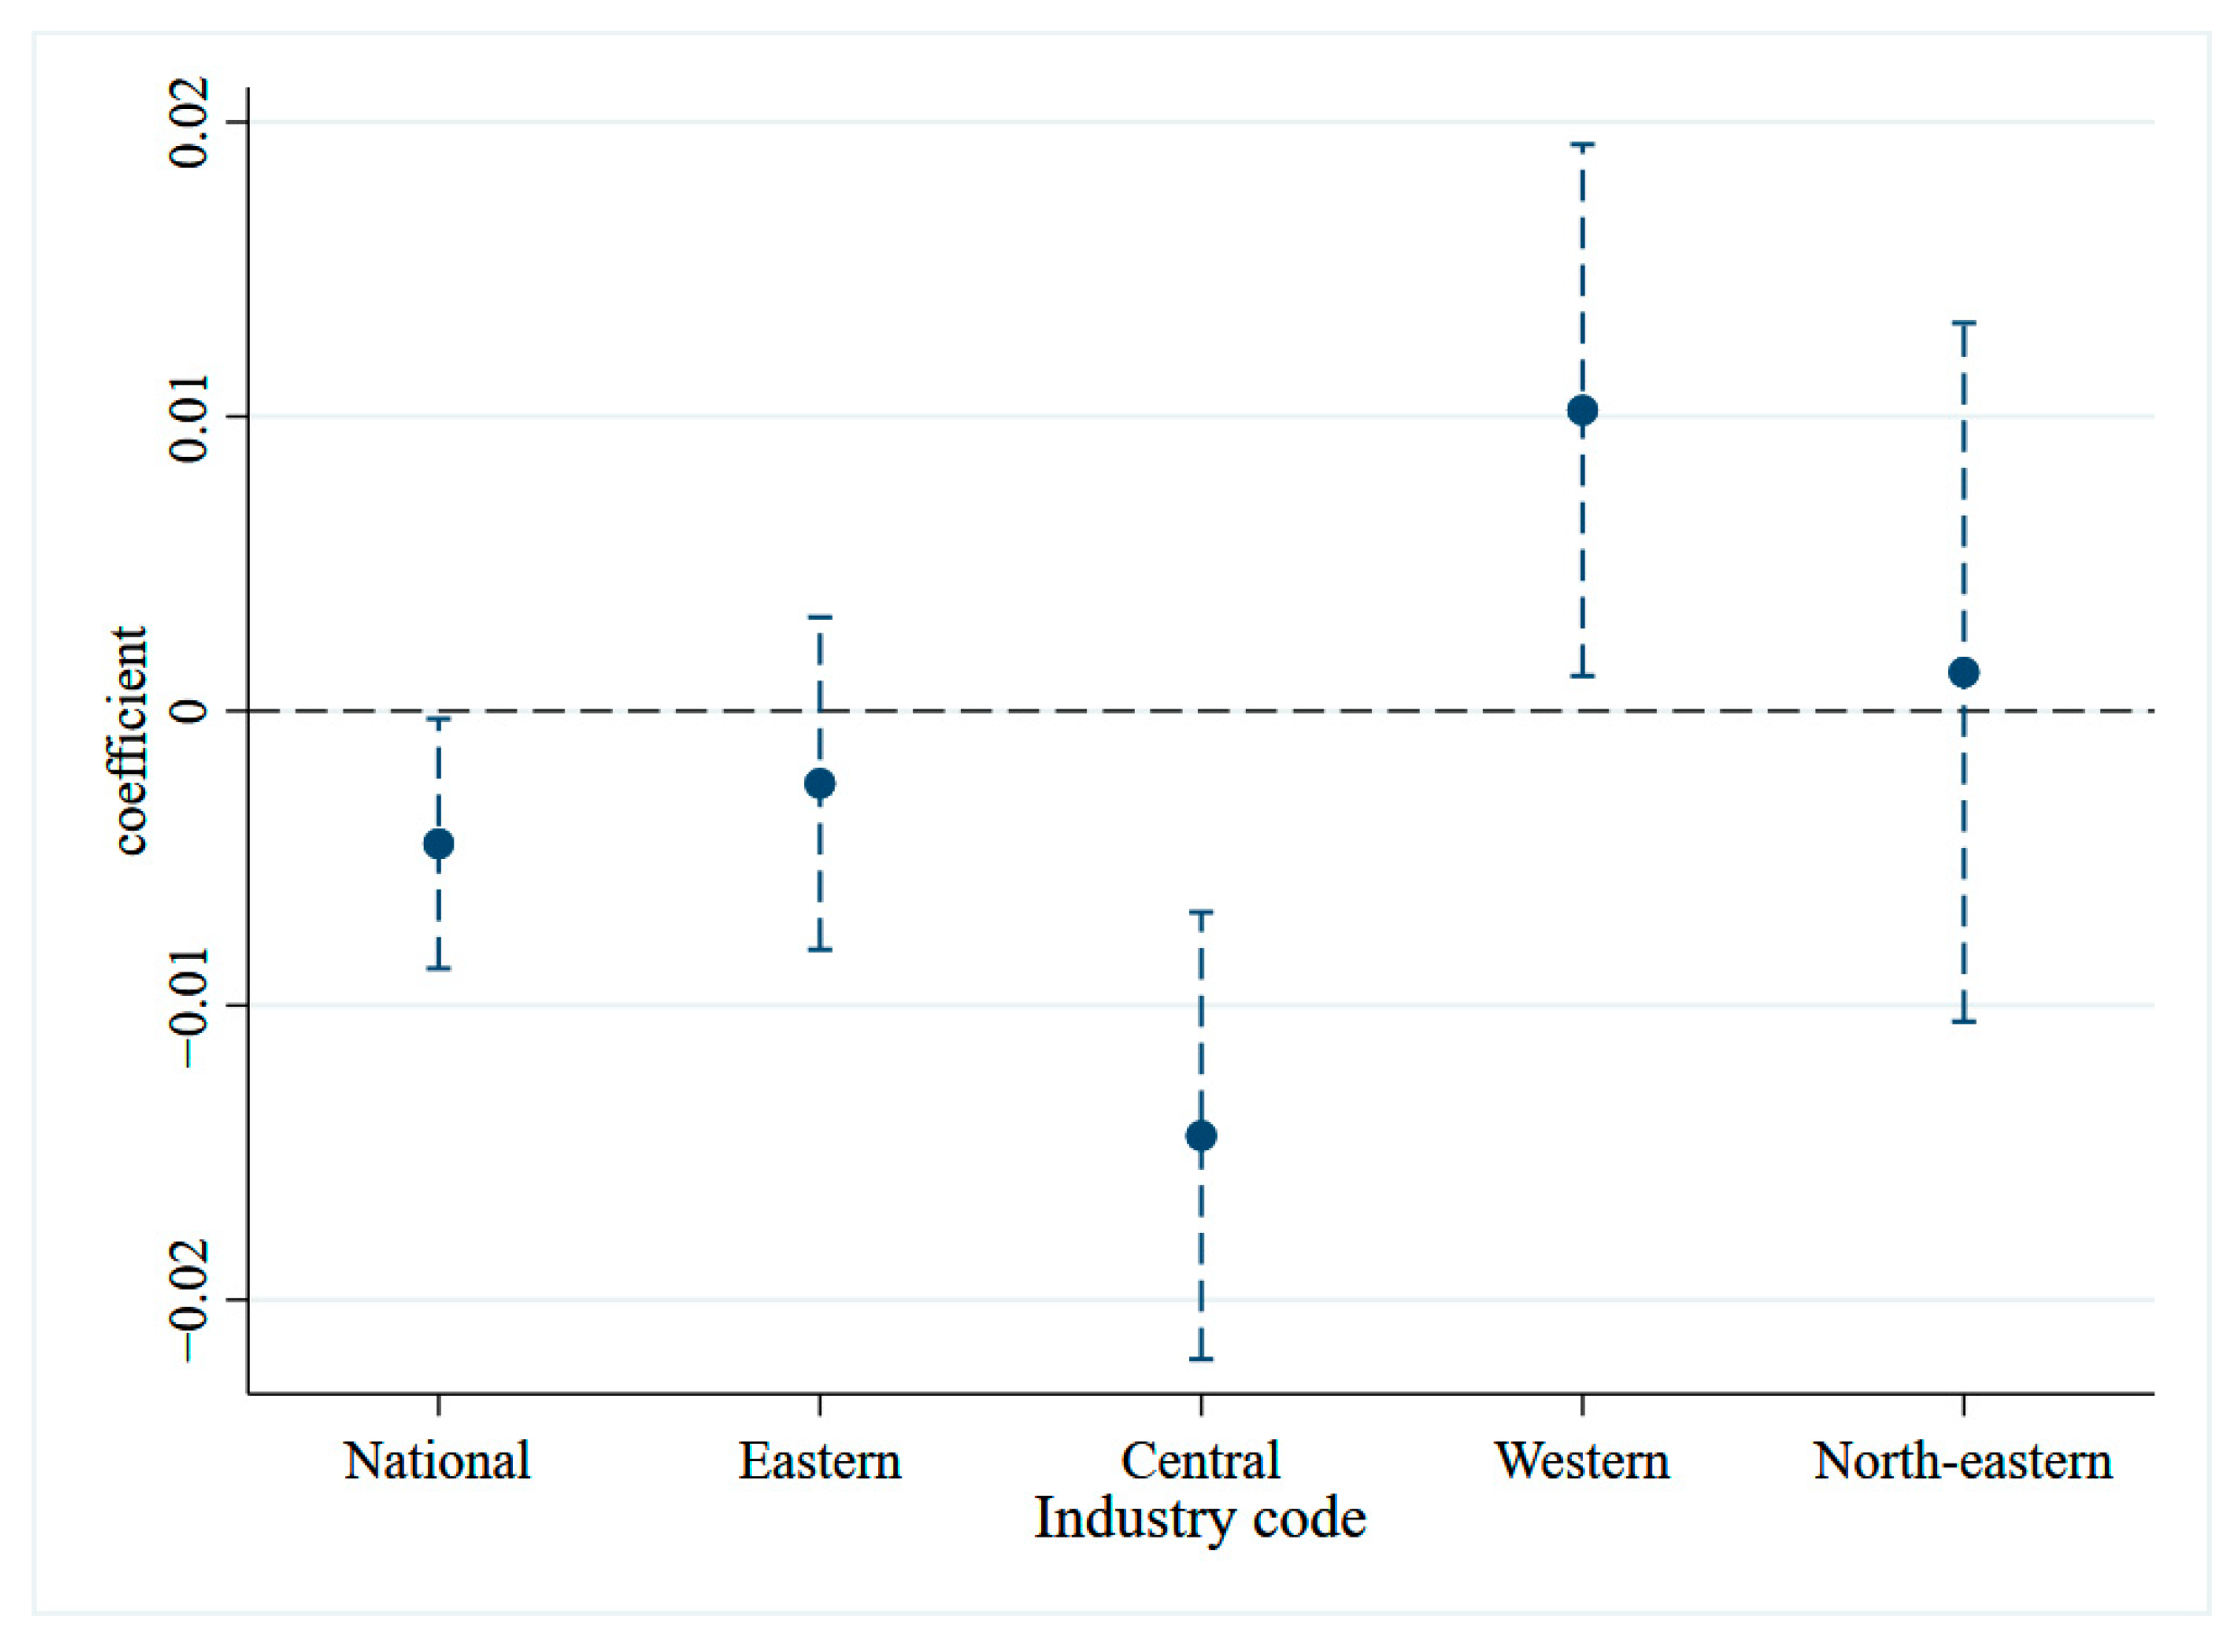
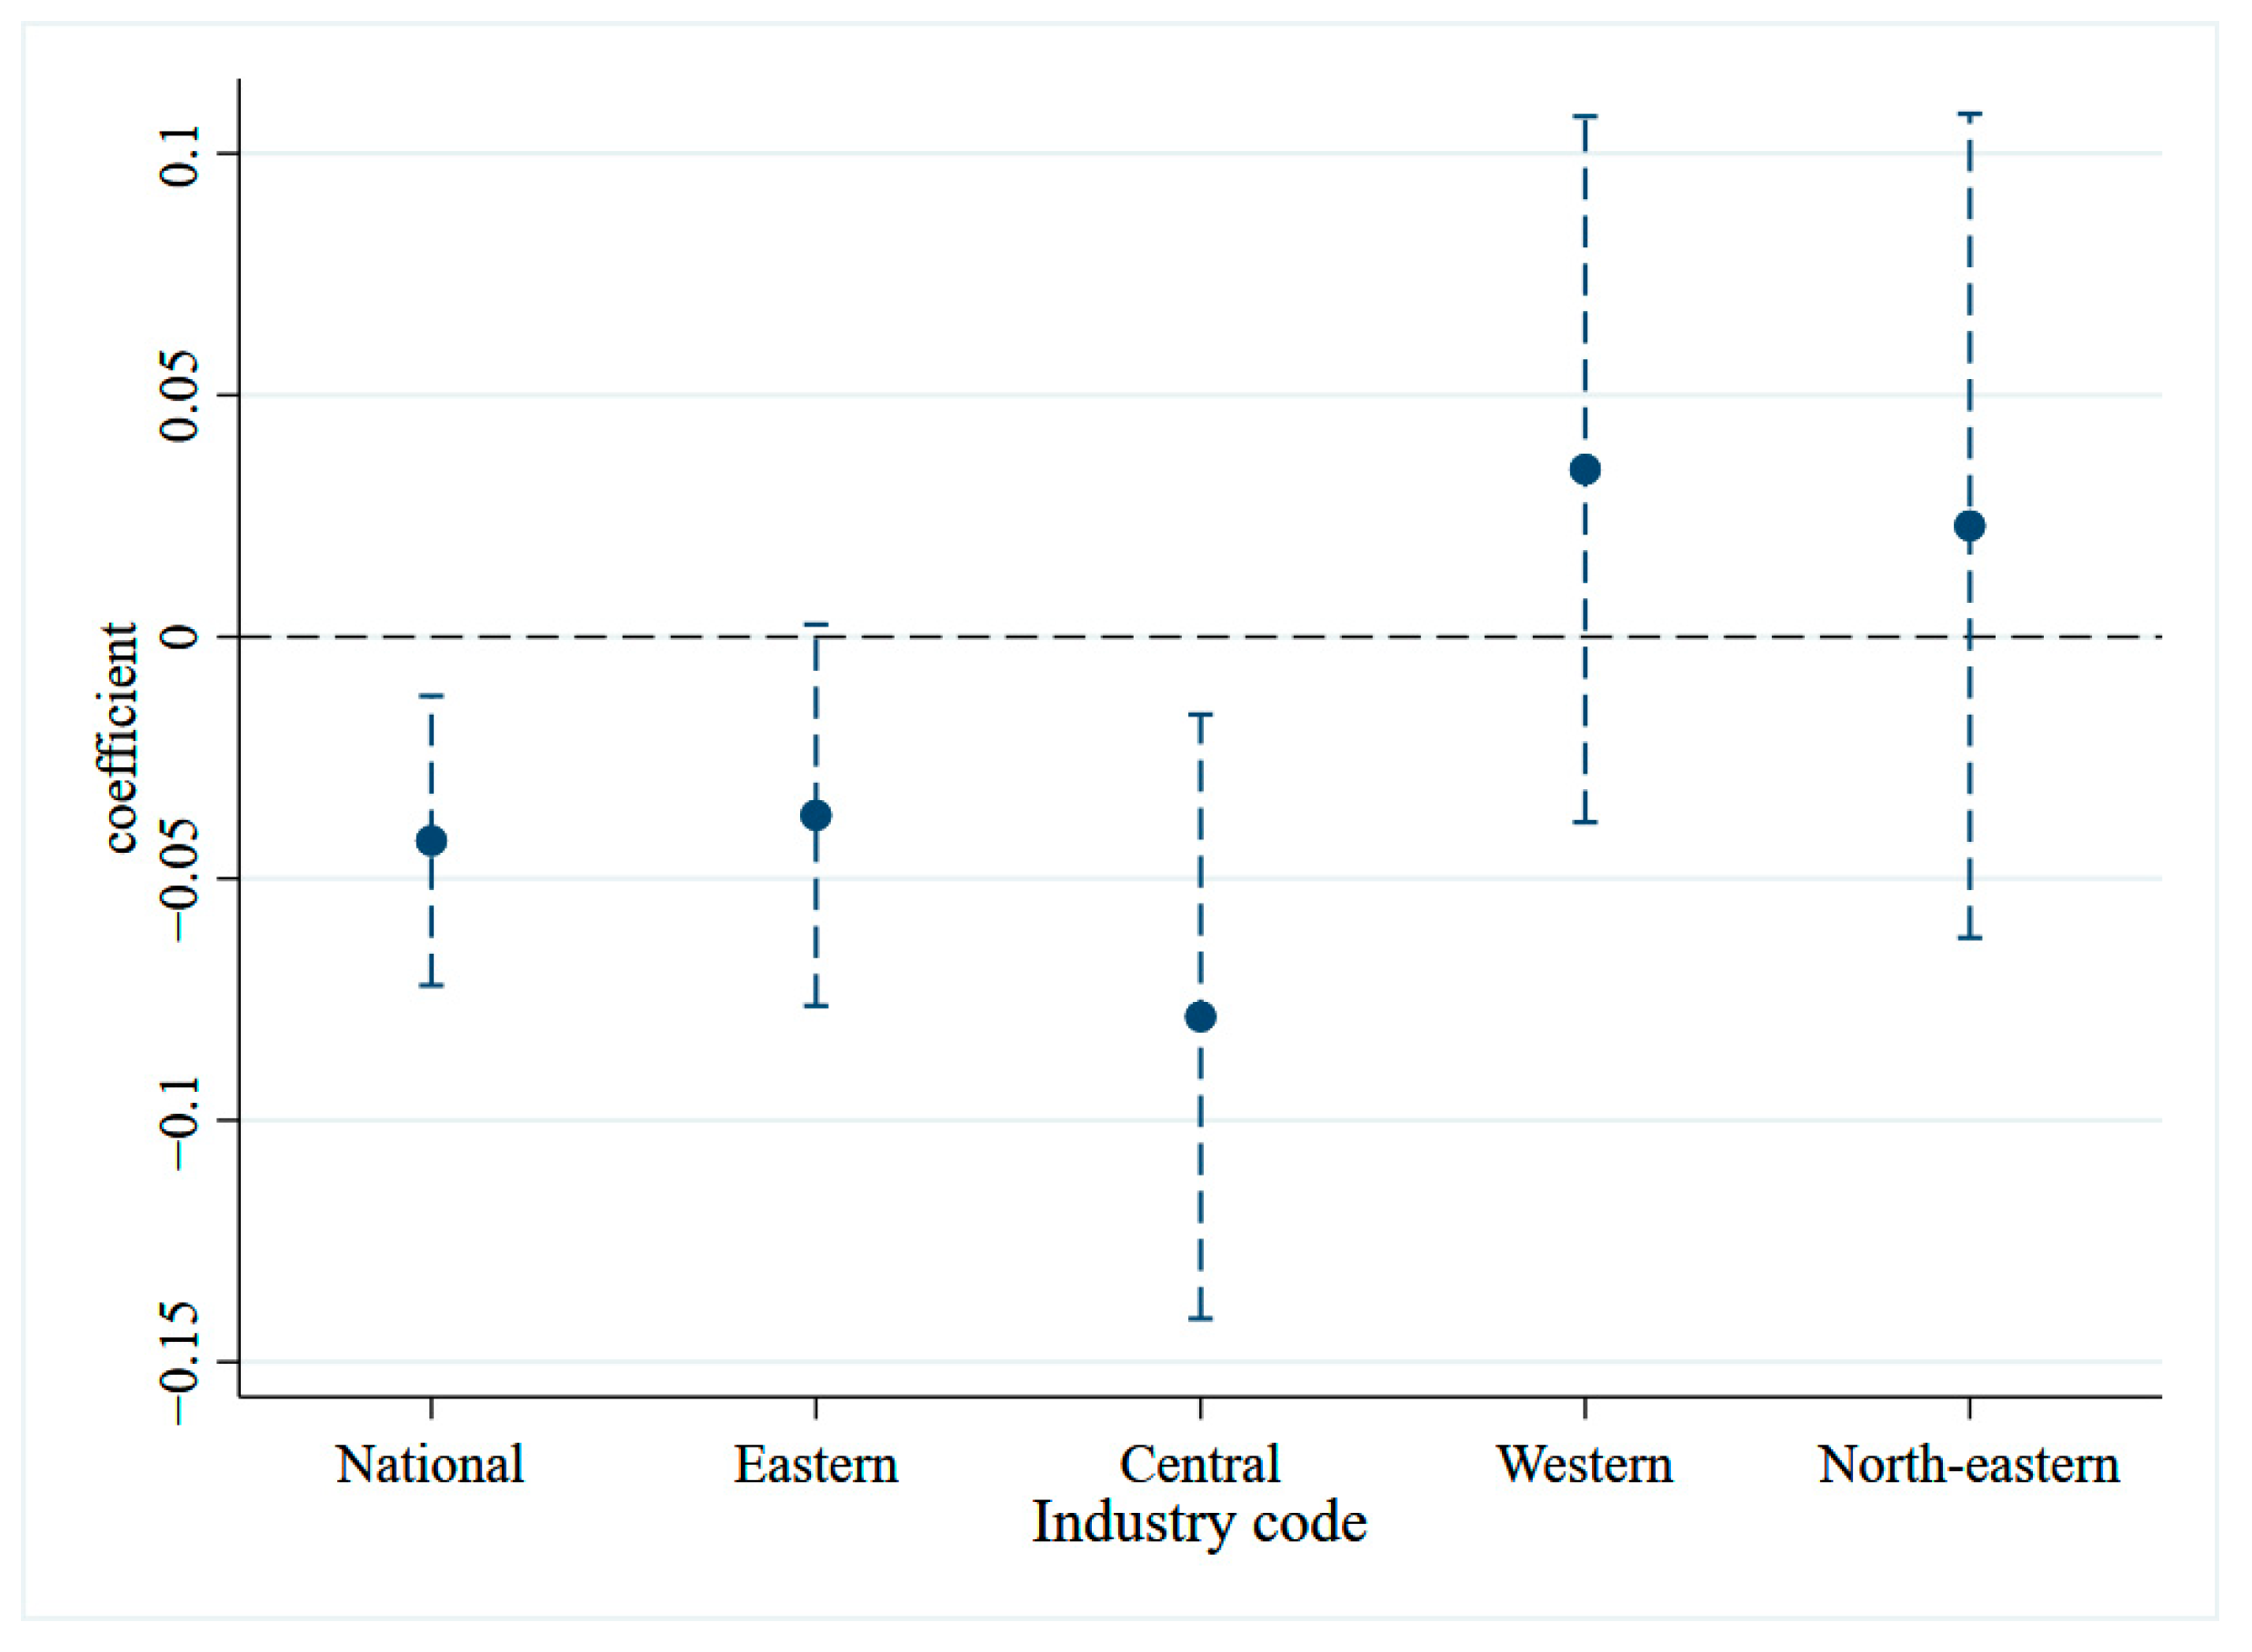
China, being a vast country, exhibits significant disparities in resource endowments, natural conditions, and levels of economic development across its regions [48]. In this section, the full sample is divided into four groups, namely, the eastern, central, western, and northeastern regions, according to the criteria of the National Bureau of Statistics of China for classifying economic zones, to investigate the varying effects of LGETCs (EnCon) on the performance of HPEs (ROA, EPS) in different regions, and the specific regression results are shown in Figure 3 and Figure 4. The results show that, in comparison to the full sample, the inhibiting effect of LGETCs on the performance of HPEs in the eastern region is notably weaker, the inhibiting effect on the performance of HPEs in the central region is significantly stronger, and the behavior of setting LGETCs in the western and northeastern regions can instead promote the performance of HPEs, but the positive effect of other indicators is not significant, except for the return on total assets (ROA) of enterprises in the western region. The possible reason for this is that the eastern region boasts a higher level of economic development, providing favorable conditions for technological innovation. The advantages of knowledge spillover, talent pool, and robust capital can help HPEs in the eastern region to transform and upgrade in a timely manner, and the negative impact of rising environmental protection and R&D costs is relatively small. In contrast, the central region has a high concentration of HPEs but lags in economic, technological, and human capital conditions, and it is burdened with heavy investment in R&D and environmental protection expenditure, resulting in poor enterprise performance due to crowded-out productive investments and noticeable transformation and upgrading challenges. The concentration of HPEs in the western and northeastern regions is significantly lower than in the eastern and central regions, and the environmental pollution and lack of resources are also relatively less severe. Moreover, the Western Development Strategy and the Strategy for Revitalizing the Old Industrial Bases in the Northeast Region has created favorable policy conditions for the economic and technological development of these regions. Thus, despite the presence of LGETCs, the performance of HPEs in the western and northeast region has not been significantly negatively affected.

4.3.2. Industrial Heterogeneity

In this paper, according to the national economic classification of industries code division standard, the definition of a heavy pollution industry contains 15 subdivided industry categories, and there are certain differences between industries in terms of resource dependence, level of technological development, production efficiency, and pollution level. To this end, this section further examines the effect of LGETCs on the performance of firms across diverse industries, and the regression results are shown in Figure 5 and Figure 6.
Figure analysis reveals substantial variations in the impact of LGETCs on the performance of HPEs across different industries. Firstly, the performance of firms in most industries under the LGETC was impaired, with the most pronounced negative effects observed in five sectors: coal mining and washing (B06), petroleum processing, coking and nuclear fuel processing (C25), chemical raw materials and chemical products manufacturing (C26), rubber and plastic products (C29), and non-ferrous metal smelting and rolling processing (C32). Secondly, the performance of firms within some industries has instead improved significantly, most notably in the leather, fur, feather and feather products, and footwear industry (C19), probably related to the relatively low intensity of pollution emissions in this industry among the heavy pollution industries, with little industry shock from LGETCs and, instead, generating incentives for innovation more conducive to industry development.

4.3.3. Ownership Heterogeneity

State-owned enterprises typically receive greater government support and oversight in comparison to foreign and private enterprises, which results in their active engagement in environmental governance initiatives in alignment with government policies [10]. However, the impact of LGETCs within SOEs remains ambiguous. On the one hand, government resource support benefits enterprise production and operations, leading to a positive impact on their overall performance. On the other hand, state-controlled enterprises proactively respond to the government’s initiatives for energy conservation and emission reduction by investing in environmental management, which will inevitably have a crowding-out effect on productive investment and ultimately inhibit overall corporate performance improvement. This section further divides the full sample into two groups, i.e., state-owned enterprises and non-state-owned enterprises, and tests whether LGETC has a heterogeneous effect on firm performance due to differences in firm ownership by means of subgroup regressions, as shown in Table 5.
The results in Table 3 show that the coefficients of the effect of LGETCs (EnCon) on the performance of SOEs (ROA, EPS) are all significantly negative at the 1% level. In contrast, there is no significant effect of the LGETCs (EnCon) within non-SOEs. The regression results show that state-owned enterprises bore the brunt of environmental management and energy conservation and emission reduction behaviors after the government introduced LGETCs, leading to a serious impact on production and operation activities within the enterprises and a significant decline in corporate performance.

4.4. Robustness Test

4.4.1. Exclusion Example

Due to the significant economic disparities in the Chinese region, the economies of the “Beijing–Tianjin–Hebei” and “Yangtze River Delta” metropolitan areas are robust, showcasing an economic level that surpasses other regions [12]. With Beijing, Tianjin, Shanghai, and Chongqing being directly administered municipalities, there are substantial differences in social, economic, environmental conditions, and policy implementation compared to other areas. Therefore, in this section, the samples of heavily polluting firms in these regions are excluded to prevent any interference with the benchmark regression results. The detailed results can be found in columns (1) and (2) of Table 6.

4.4.2. Controlling for Time Trends in Variables

In this paper, firm characteristic variables that may have an impact on firm performance are selected to control for factors that can lead to further variation in performance between firms over time, leading to estimation errors in the coefficient of LGETCs’ impact. To achieve this, this section controls for time trends in the factors influencing firm performance by constructing interaction terms between control variables and third-order polynomials of time trends, following the research design of [49].
P e r f o r m a n c e i t = α 0 + α i E n C o n i j t + α x X i t + α 1 X i t T + α 2 X i t T 2 + α 3 X i t T 3 + θ t + μ z + ε i t
The regression results of the robustness test based on model (4) are shown in columns (3) and (4) of Table 6. From the regression results, after controlling for the time trends of the variables, the coefficients of the effects of LGETCs (EnCon) on the performance of HPEs (ROA, EPS) are still significantly negative with significance levels of 1% and 5%, respectively, which are consistent with the findings of the baseline test, indicating that the findings of the baseline test in this paper are robust.

4.4.3. Excluding Related Policy Interference

There are additional potential factors to consider when evaluating the impact of LGETCs on HPEs’ performance, such as the impact of concurrent environmental regulations implemented by government agencies during the study period on the evaluation of this impact. In October 2011, China’s National Development and Reform Commission (NDRC) promulgated The Notice on the Pilot Project of Carbon Emissions Trading, stipulating that Beijing, Tianjin, Shanghai, Chongqing, Guangdong, and Hubei et al. are the pilot projects of carbon emissions trading. In 2013, all pilot provinces and cities commenced the carbon emissions trading pilot programs in an organized and structured manner. Enterprises involved in the carbon emission trading market can gain revenue by selling their excess carbon emission allowances in the market, thus motivating them to adopt energy-efficient practices and reduce emissions. In January 2014, the National Energy Administration released the official list of pilot cities for new energy demonstrations, which aims to promote sustainable urban development and the construction of a green ecological civilization. These pilot cities are transforming the economic growth paradigm from one that relies on “pollution for growth” to a model that emphasizes energy technology innovation and industrial structure upgrades. This transformation results in reduced energy consumption and industrial pollution emissions, albeit with some influence on the production and operations of HPEs within their jurisdictions, affecting their overall performance.
Therefore, in order to exclude other environmental policy effects from interfering and further test the impact of LGETCs on firm performance, the contents of this section control for the impact effects of the two policies mentioned above and carry out robustness tests, and the regression results are shown in columns (5) and (6) of Table 6. The regression results indicate that both the carbon emissions trading pilot policy (Policy1) and the new energy demonstration city policy (Policy2) have a positive impact on the short-term performance (ROA, EPS) of HPEs, which is strongly related to the market incentives of the carbon emissions pilot policy and the innovation incentives of the new energy demonstration city. After controlling for the above two environmental policy interaction terms, there is still a significant inhibiting effect of LGETCs (EnCon) on the performance of HPEs (ROA, EPS), which is also consistent with the findings of the baseline test, indicating that the findings of this paper are strongly robust.

5. Mechanism Test and Further Analysis

5.1. Mechanism Test

Based on the previous theoretical hypotheses, this section tests whether corporate financing constraints, agency costs, and innovation levels serve as mediating mechanisms through which LGETCs affect the performance of HPEs. The empirical test results for models (2) and (3) are presented in Table 7 and Table 8. Column (1) in Table 7 displays the regression results of LGETCs (EnCon) on the enterprise financing constraint (FinCon), and the coefficient of influence is significantly negative at the 5% level, suggesting that LGETCs have elevated the business risk of HPEs, resulting in increased financing constraints. Thus, these enterprises will face a serious “financing difficulty” problem. Column (2) presents the regression results of the LGETCs (EnCon) on the agency costs (Agent) of enterprises, with the coefficient of influence being significantly positive at the 1% level. The results indicate that the external environmental changes resulting from LGETCs have significantly increased the agency costs within the HPEs and increased the burden of production and operation of enterprises. The regression results of model (3) after adding the mechanism variables are presented in (3)–(6). It can be seen that the effect of corporate financing constraints (FinCon) on corporate performance (ROA, EPS) is significantly negative at the 1% level, and the effect of corporate agency costs (Agent) on corporate performance (ROA, EPS) is also significantly negative at the 1% level, indicating that corporate financing constraints and agency costs are not conducive to improving corporate productivity and have a significant inhibiting effect on corporate performance, i.e. LGETCs can negatively affect the performance of HPEs by increasing financing constraints and agency costs which play a mediating effect, verifying hypotheses H2 and H3 in this paper.
Columns (1) and (2) of Table 8 report the results of the mechanism test of LGETCs on firm performance with firm technological innovation (Tech) and green technological innovation (Gtech) as variables, which shows that the coefficient of effect is significantly negative at the 10% and 1% level, respectively, indicating that LGETCs can notably enhance the level of innovation of firms, especially the level of green technological innovation. The regression results of model (3) adding in technological innovation (Tech) and green technological innovation (Gtech) are presented in columns (3)–(6). The coefficients of innovation level are all significantly positive at the 1% level, which shows that the increase in the level of technological innovation and green technological innovation is conducive to promoting the performance of HPEs and can, to a certain extent, alleviate the negative impact of LGETCs on enterprise performance. The level of technological innovation and green technology innovation is reflected in the “masking effect”, verifying H4 of this paper. The impact coefficients of the main independent variables in columns (3)–(6) are significantly negative at the 5% and 1% levels, respectively, indicating that taking into account the level of innovation of enterprises, there is still a significant inhibiting effect of LGETCs on the performance of HPEs, i.e. the innovation compensation effect of HPEs is limited at this stage, and the benefits derived from them cannot fully offset the loss in output efficiency resulting from their environmental management and R&D investments.
The results of the mechanism tests in Table 7 and Table 8 demonstrate that the LGETCs have a “double-edged sword” effect on the performance of HPEs, and the policy effect is a combination of the “performance inhibiting effect” and the “innovation compensating effect”, with the negative inhibiting effect on enterprise performance dominating for the time being, but the “innovation compensating effect” is equally crucial and serves as the key driver for motivating HPEs to adopt clean production practices and expedite their transition to a greener approach.

5.2. Contribution Decomposition

To further clarify the weight of the contributions of the mechanisms of financing constraints (FinCon), agency costs (Agent), technological innovation (Tech), and green technological innovation (Gtech) in the process of LGETCs affecting the performance of HPEs in the previous section, this section draws on [41] research ideas to decompose the contributions of the above influencing mechanisms. In the mechanism test model, α i denotes the coefficient of effect of LGETCs on the performance of HPEs, ω i denotes the coefficient of effect of LGETCs on the influence mechanism, γ i denotes the coefficient of effect of LGETCs on the performance of HPEs after incorporating the influencing mechanism, and ρ i denotes the coefficient of effect of the mediating mechanism on the performance of firms. The study by [41] has demonstrated that the proportion of the effect explained by the impact mechanism (Med) is ω i ρ i / α i ; therefore, the results of the decomposition of the contribution of each impact mechanism are shown in Table 9.
The findings presented in Table 9 indicate that corporate financing constraints play a dominant role in mediating the impact of LGETCs on firm performance, accounting for approximately 46.2% of the total return on assets. Additionally, rising agency costs contribute around 31.9% to this mediating effect, resulting in a combined influence of these mechanisms at a significant 78.1%. The obstructive effect of corporate technological innovation in the process of LGETCs affecting corporate performance is 8.1% and the masking effect of green technological innovation is 5.7%, culminating in a total masking effect of merely 13.8%. Using basic earnings per share as the dependent variable to measure corporate performance, the results of the decomposition of the contribution of the impact mechanism are generally consistent. Specifically, the inhibiting effect of financing constraints on firm performance remains the most heavily weighted mediating effect, with a share of around 34.8%. The proportion of the mediating effect of agency costs is only 12.6% and the combined mediating effect of the two influencing mechanisms is 47.4%. In terms of masking effects, the share of technological innovation was 7.4% and the share of green technological innovation was 6.9%, for a total of 14.3%.
The decomposition of the impact mechanism reveals that the adverse effect of LGETCs on the performance of HPEs primarily stems from an increase in their financing constraints, and secondly, the escalation of agency costs also plays a significant role in hindering enterprise performance enhancement. Simultaneously, the masking effect of technological innovation and green technology innovation is weak, suggesting that the “innovation compensation effect” proposed by the Porter Hypothesis is not dominant in the issues studied in this paper and that the effect of LGETCs on HPEs’ performance is predominantly inhibitory.

5.3. Further Analysis

Referring to the existing literature, this paper examines the impact of LGETCs on the long-term performance of HPEs by measuring the long-term performance of firms using Tobin’s Q value and further examines the compensating effect of innovation capability in terms of long-term performance. The results of the test are presented in Table 10. The regression results in column (1) of Table 10 show that the coefficient of the effect of LGETCs on the long-term performance of enterprises is 0.0339, but it is statistically insignificant, indicating that there is no significant contribution of the LGETCs to the long-term performance of HPEs. This may be attributed to the fact that, unlike formal environmental regulation policies, environmental target constraints are less likely to exert sustained and effective environmental regulatory pressure on HPEs, resulting in a generally “short-sighted” approach to production and operations, lacking sufficient focus on long-term sustainability. Based on the above analysis, H1b is not verified and there is no significant effect of LGETCs on the long-term performance of HPEs.
The regression results in columns (2) and (3) of Table 8 indicate the presence of innovation incentives for LGETCs. The regression results in columns (4) and (5) further show that the coefficients of the effects of technological innovation (Tech) and green technological innovation (Gtech) on firms’ long-term performance (Tobin Q) are 0.0136 and 0.0773, respectively, which are significantly positive at the 10% and 1% levels, respectively, indicating that innovation incentives constrained by local environmental targets are beneficial to the long-term performance of firms and there is some innovation compensation effect. The above results suggest that, in terms of LGETCs, this government’s environmental governance behavior does not have a significant direct effect on the long-term performance of firms but can indirectly have a positive impact on the long-term performance of firms by increasing the level of innovation.

6. Conclusions and Policy Recommendation

6.1. Conclusions

This study selected Chinese A-share listed companies in heavily polluting industries from 2007 to 2019 as the research sample to empirically examine the impact of local environmental target constraints on the performance of these companies and their underlying mechanisms. The findings of this study are as follows: Firstly, local environmental target constraints have a short-term negative impact on the performance of heavily polluting companies. This impact is evident as these companies work towards meeting local environmental goals and achieving sustainable development objectives. However, due to the pivotal role of the industrial sector in macroeconomic performance, the effect of environmental target constraints on green governance in heavily polluting companies varies significantly depending on factors such as region, industry, and ownership structure. Secondly, the introduction of government environmental target constraints increases the emphasis placed on green governance at the local level, resulting in a sense of estrangement between social organizations and the heavily polluting industry. This, in turn, raises the financing constraints and operating costs for these companies. In response to these challenges and the need for survival, heavily polluting companies accelerate their efforts in technological advancement and green innovation, thereby improving their market competitiveness and mitigating the short-term negative effects of environmental target constraints on their performance [23]. However, it is important to note that the primary purpose of environmental target constraints and related regulations is to expedite the application of energy-saving and emission reduction technologies in heavily polluting companies, ultimately achieving green governance at the source. Consequently, this study found that, after environmental target constraints promote technological advancement and green innovation in heavily polluting companies, they no longer have a negative impact on the long-term performance of these companies. This suggests that local environmental target constraints can effectively address issues like high energy consumption and high emissions at their root, improving resource utilization efficiency, achieving regional environmental sustainability, driving high-quality economic development, and ultimately benefiting the well-being of local residents.
Due to challenges in standardization and the difficulty of data collection, our study has several limitations and potential avenues for further investigation. These primarily include the following two aspects: Firstly, the conceptual definition of local environmental targets in this paper encompasses energy consumption and various pollutants, with substantial regional variation in how pollution reduction targets and energy consumption reduction targets are formulated. For complex types of local environmental targets, we have not yet found an effective classification scheme. Further exploration of the heterogeneity in local environmental targets, such as their forms and stringency, can shed light on their regulatory effects. Given the high sensitivity of different stakeholder groups to policy documents, clarifying the regulatory impacts of different forms of environmental targets can help local governments more effectively use policy documents to guide environmental governance and economic development. Furthermore, insufficient micro-level pollution emission data matching for enterprises is another limitation. Our study sample consists of panel data from publicly traded companies in heavily polluting industries for the years 2007–2019. The most comprehensive source of micro-level pollution emission data for enterprises in China is the Industrial Enterprise Pollution Emission Database, which covers the years 1998–2014 and does not align well with the panel data used in this study. This limitation hinders our ability to thoroughly examine the effectiveness of local environmental target constraints on pollution reduction in publicly traded companies in heavily polluting industries and to extend and supplement existing research results. In the future, with data availability in mind, further research can explore the dynamic relationship between enterprise pollution reduction effectiveness and economic benefits.

6.2. Policy Recommendation

(1) Local governments should pay attention to the economic losses brought about by LGETCs on heavy pollution enterprises. For HPEs that follow the government’s environmental governance decisions and actively engage in energy conservation and emission reduction, the government should increase subsidies and facilitate financial market support to provide financial support to prevent enterprises from falling into operational difficulties to successfully transform and upgrade.
(2) On the one hand, as the degree of resource dependency, level of innovation, pollution emission intensity, and other specific attributes vary between different regions and industries, the government should take into account the current situation when setting environmental target constraints and adopt differentiated energy conservation and emission reduction targets. On the other hand, the government should help state-owned enterprises explore a transformation and upgrading path that places equal emphasis on the environment and the economy and form an effective leadership position among HPEs.
(3) China’s economy has transitioned to a stage of high-quality development, and environmental pollution and resource depletion are key issues limiting sustainable economic progress. Energy conservation and cleaner production are long-term requirements for enterprises operating in this new stage of economic development. To achieve good business performance under increasingly stringent environmental regulations to avoid becoming obsolete, HPEs need to actively invest in research and development, transformation and upgrading, and focus on the long-term sustainable economic benefits of their businesses.

Author Contributions

Conceptualization, L.Q.; Software, K.L.; Data curation, L.Q.; Writing—original draft, K.L.; Writing—review & editing, L.Q.; Visualization, K.L.; Supervision, H.X.; Funding acquisition, H.X. All authors have read and agreed to the published version of the manuscript.

Funding

This research received no external funding.

Institutional Review Board Statement

Not applicable.

Informed Consent Statement

Not applicable.

Data Availability Statement

Data are contained within the article.

Conflicts of Interest

The authors declare no conflict of interest.

References

  1. Chang, T.; Graff Zivin, J.; Gross, T.; Neidell, M. Particulate Pollution and The Productivity of Pear Packers. Am. Econ. J. Econ. Policy 2016, 8, 141–169. [Google Scholar] [CrossRef]
  2. Zhao, X.C.; Jiang, M.; Zhang, W. The Impact of Environmental Pollution and Economic Growth on Public Health: Evidence from China. Front. Public Health 2022, 10, 861157. [Google Scholar] [CrossRef]
  3. Wu, J.; Deng, Y.; Huang, J.; Morck, R.; Yeung, B. Incentives and Outcomes: China’s Environmental Policy; National Bureau of Economic Research: Cambridge, MA, USA, 2013. [Google Scholar]
  4. Jia, R.; Nie, H. Decentralization, Collusion, and Coal Mine Deaths. Rev. Econ. Stat. 2017, 99, 105–118. [Google Scholar] [CrossRef]
  5. Chen, Z.; Kahn, M.E.; Liu, Y.; Wang, Z. The Consequences of Spatially Differentiated Water Pollution Regulation in China. J. Environ. Econ. Manag. 2018, 88, 468–485. [Google Scholar] [CrossRef]
  6. Li, H.; Zhou, L.A. Political Turnover and Economic Performance: The Incentive Role of Personnel Control in China. J. Public Econ. 2005, 89, 1743–1762. [Google Scholar] [CrossRef]
  7. Shapiro, J.S.; Walker, R. Why is Pollution from US Manufacturing Declining? The Roles of Environmental Regulation, Productivity, and Trade. Am. Econ. Rev. 2018, 108, 3814–3854. [Google Scholar] [CrossRef]
  8. Fan, H.; Zivin, J.S.G.; Kou, Z.; Liu, X.; Wang, H. Going Green in China: Firms’ Responses to Stricter Environmental Regulations; National Bureau of Economic Research: Cambridge, MA, USA, 2019. [Google Scholar]
  9. Greenstone, M.; He, G.; Jia, R.; Liu, T. Can Technology Solve the Principal-Agent Problem? Evidence From China’s War on Air Pollution. Am. Econ. Rev. Insights 2022, 4, 54–70. [Google Scholar] [CrossRef]
  10. Du, L.; Lin, W.; Du, J.; Jin, M.; Fan, M. Can Vertical Environmental Regulation Induce Enterprise Green Innovation? A New Perspective from Automatic Air Quality Monitoring Station in China. J. Environ. Manag. 2022, 317, 115349. [Google Scholar] [CrossRef] [PubMed]
  11. Xu, H.; Liu, B.; Qiu, L.; Liu, X.; Lin, W.; Liu, B. Does The New Energy Demonstration Cities Construction Reduce CO2 Emission? Evidence From a Quasi-Natural Experiment in China. Environ. Sci. Pollut. Res. 2022, 29, 50408–50426. [Google Scholar] [CrossRef]
  12. Lin, W.; Lin, K.; Du, L.; Du, J. Can Regional Joint Prevention and Control of Atmospheric Reduce Border Pollution? Evidence From China’s 12th Five-Year Plan on Air Pollution. J. Environ. Manag. 2023, 342, 118342. [Google Scholar] [CrossRef]
  13. Antoine, D.; Misato, S. The Impacts of Environmental Regulations on Competitiveness. Rev. Environ. Econ. Policy 2017, 11, 183–206. [Google Scholar]
  14. Tobias, S.; Woerter, M.; Arvanitis, S.; Peneder, M.; Rammer, C. How Different Policy Instruments Affect Green Product Innovation: A Differentiated Perspective. Energy Policy 2018, 114, 245–261. [Google Scholar]
  15. Habib, A.; Bhuiyan MB, U. Determinants of Monetary Penalties for Environmental Violations. Bus. Strategy Environ. 2017, 26, 754–775. [Google Scholar] [CrossRef]
  16. Gray, W.B.; Shadbegian, R.J. Plant Vintage, Technology, and Environmental Regulation. J. Environ. Econ. Manag. 2003, 46, 384–402. [Google Scholar] [CrossRef]
  17. Rothwell, R. Successful Industrial Innovation: Critical Factors for the 1990s. R&D Manag. 1992, 22, 221–240. [Google Scholar]
  18. Kumar, S.; Dua, P. Environmental Management Practices and Financial Performance: Evidence from Large Listed Indian Enterprises. J. Environ. Plan. Manag. 2022, 65, 37–61. [Google Scholar] [CrossRef]
  19. Porter, M.E.; Linde CV, D. Toward A New Conception of The Environment-Competitiveness Relationship. J. Econ. Perspect. 1995, 9, 97–118. [Google Scholar] [CrossRef]
  20. Zhuge, L.; Freeman, R.B.; Higgins, M.T. Regulation and Innovation: Examining Outcomes in Chinese Pollution Control Policy Areas. Econ. Model. 2020, 89, 19–31. [Google Scholar] [CrossRef]
  21. Nie, C.; Luo, W.; Feng, Y.; Chen, Z. The Impact of Economic Growth Target Constraints on Environmental Pollution: Evidence from China. Int. J. Environ. Res. Public Health 2023, 20, 2831. [Google Scholar] [CrossRef]
  22. Cui, J.; Zhang, J.; Yang, Z. Carbon Pricing Induces Innovation: Evidence from China’s Regional Carbon Market Pilots. AEA Pap. Proc. 2018, 108, 453–457. [Google Scholar] [CrossRef]
  23. Chen, M.; Zhang, J.; Xu, Z.; Hu, X.; Hu, D.; Yang, G. Does the setting of local government economic growth targets promote or hinder urban carbon emission performance? Evidence from China. Environ. Sci. Pollut. Res. 2023. [Google Scholar] [CrossRef]
  24. Huang, J.W.; Li, Y.H. Green Innovation and Performance: The View Of Organizational Capability and Social Reciprocity. J. Bus. Ethics 2017, 145, 309–324. [Google Scholar] [CrossRef]
  25. Tang, M.; Walsh, G.; Lerner, D.; Fitza, M.A.; Li, Q. Green Innovation, Managerial Concern and Firm Performance: An Empirical Study. Bus. Strategy Environ. 2018, 27, 39–51. [Google Scholar] [CrossRef]
  26. Huang, Z.; Liao, G.; Li, Z. Loaning Scale and Government Subsidy for Promoting Green Innovation. Technol. Forecast. Soc. Change 2019, 144, 148–156. [Google Scholar] [CrossRef]
  27. Rehman, S.U.; Kraus, S.; Shah, S.A.; Khanin, D.; Mahto, R.V. Analyzing the Relationship Between Green Innovation and Environmental Performance in Large Manufacturing Firms. Technol. Forecast. Soc. Change 2021, 163, 120481. [Google Scholar] [CrossRef]
  28. Fard, A.; Javadi, S.; Kim, I. Environmental Regulation and The Cost of Bank Loans: International Evidence. J. Financ. Stab. 2020, 51, 100797. [Google Scholar] [CrossRef]
  29. Desai, M.A.; Foley, C.F.; Forbes, K.J. Financial Constraints and Growth: Multinational and Local Firm Responses to Currency Depreciations. Rev. Financ. Stud. 2008, 21, 2857–2888. [Google Scholar] [CrossRef]
  30. Pástor, Ľ.; Veronesi, P. Political uncertainty and risk premia. J. Financ. Econ. 2013, 110, 520–545. [Google Scholar] [CrossRef]
  31. Kaplan, S.N.; Minton, B.A. How Has CEO Turnover Changed? Int. Rev. Financ. 2012, 12, 57–87. [Google Scholar] [CrossRef]
  32. John, K.; Litov, L.; Yeung, B. Corporate Governance and Risk-Taking. J. Financ. 2008, 63, 1679–1728. [Google Scholar] [CrossRef]
  33. Yow, S.; Sherris, M. Enterprise Risk Management, Insurer Value Maximisation, and Market Frictions. ASTIN Bull. J. Int. Actuar. Assoc. 2008, 38, 293–339. [Google Scholar] [CrossRef]
  34. Songini, L.; Gnan, L. Family Involvement and Agency Cost Control Mechanisms in Family Small and Medium-Sized Enterprises. J. Small Bus. Manag. 2015, 53, 748–779. [Google Scholar] [CrossRef]
  35. Liu, M.D.; Tan, R.P.; Zhang, B. The Costs of “Blue Sky”: Environmental Regulation, Technology Upgrading, and Labor Demand in China. J. Dev. Econ. 2021, 150, 102610. [Google Scholar] [CrossRef]
  36. Du, W.; Li, M. Opening the black box of environmental governance: Environmental target constraints and industrial firm pollution reduction. Energy 2023, 283, 129156. [Google Scholar] [CrossRef]
  37. Kneller, R.; Manderson, E. Environmental Regulations and Innovation Activity in UK Manufacturing Industries. Resour. Energy Econ. 2012, 34, 211–235. [Google Scholar] [CrossRef]
  38. Ramanathan, R.; He, Q.L.; Black, A.; Ghobadian, A.; Gallear, D. Environmental Regulations, Innovation and Firm Performance: A Revisit of The Porter Hypothesis. J. Clean. Prod. 2017, 155, 79–92. [Google Scholar] [CrossRef]
  39. Fu, Y.; Zhuang, H.; Zhang, X. Do environmental target constraints of local government affect high-quality economic development? Evidence from China. Environ. Sci. Pollut. Res. 2023, 30, 56620–56640. [Google Scholar] [CrossRef] [PubMed]
  40. Lin, K.; Shi, Y.; Xu, H. Can Grassroots Governments’ Environmental Attention Effectively Improve Air Pollution? Empirical Evidence from Satellite Remote Sensing Technology. Sustainability 2023, 15, 15309. [Google Scholar] [CrossRef]
  41. Gelbach, J.B. When Do Covariates Matter? And Which Ones and How Much? J. Labor Econ. 2016, 34, 509–543. [Google Scholar] [CrossRef]
  42. Anderson, R.C.; Reeb, D.M. Founding-Family Ownership and Firm Performance: Evidence from the S&P 500. J. Financ. 2003, 58, 1301–1328. [Google Scholar]
  43. Fang, V.W.; Noe, T.H.; Tice, S. Stock Market Liquidity and Firm Value. J. Financ. Econ. 2009, 94, 150–169. [Google Scholar] [CrossRef]
  44. Kaplan, S.N.; Zingales, L. Do Investment-Cash Flow Sensitivities Provide Useful Measures of Financing Constraints? Q. J. Econ. 1997, 112, 169–215. [Google Scholar] [CrossRef]
  45. Singh, M.; Davidson IW, N. Agency costs, ownership structure and corporate governance mechanisms. J. Bank. Financ. 2003, 27, 793–816. [Google Scholar] [CrossRef]
  46. IPC Green Inventory; WIPO: Geneva, Switzerland, 2010; Available online: https://www.wipo.int/classifications/ipc/green-inventory/home (accessed on 15 August 2023).
  47. Kim, E.H.; Lu, Y. CEO Ownership, External Governance, and Risk-Taking. J. Financ. Econ. 2011, 102, 272–292. [Google Scholar] [CrossRef]
  48. Li, G.; Guo, F.; Di, D. Regional Competition, Environmental Decentralization, And Target Selection of Local Governments. Sci. Total Environ. 2021, 755, 142536. [Google Scholar] [CrossRef]
  49. Angrist, J.D.; Pischke, J.S. Mostly Harmless Econometrics: An Empiricist’s Companion; Princeton University Press: Princeton, NJ, USA, 2009; pp. 12–31. [Google Scholar]
Figure 1. Influencing mechanisms.
Sustainability 15 15997 g001
Figure 2. Map of the distribution of HPEs in China.
Sustainability 15 15997 g002
Figure 3. Coefficient of effect by region (ROA).
Sustainability 15 15997 g003
Figure 4. Coefficient of effect by region (EPS).
Sustainability 15 15997 g004
Figure 5. Coefficient of effect by industry (ROA).
Sustainability 15 15997 g005
Figure 6. Coefficient of effect by industry (EPS).
Sustainability 15 15997 g006
Table 1. Main variables’ measurement and descriptive statistics.
VariableSignalMeasurementObsMeanS.D.MinMax
LGETCEnCon1 if there is an environmental target constraint, 0 otherwise57100.3610.48001
Return on total assetsROANet profit/Total assets at the end of the year57100.0310.060−0.2450.201
Basic earnings per shareEPSNet profit of ordinary shares/Weighted average number of ordinary shares at the end of the year57100.2840.496−1.3182.110
Tobin’s Q valueTobin QMarket value/Total assets at the end of the year57101.7961.0400.8586.704
Size (total asset)Size_assLog(Total assets at the end of the year)571013.2271.38110.53317.119
Size (manpower)Size_staLog(Number of employees at the end of the year)57107.9991.2574.92711.085
AgeAgeLog(Sample year − Registration year + 1)57102.8132.8131.7923.434
Growth capabilityGrow(Operating income at the end of the year − Operating income at the end of the previous year)/Operating income at the end of the previous year57100.1660.166−0.5202.727
Ownership concentrationOwnNumber of shares held by the largest shareholder/Total number of shares at the end of the year571036.64515.7009.08378.366
The proportion of fixed assetsFixFixed assets/Total assets at the end of the year57100.3580.3580.0290.793
Board sizeBoardLog(Number of directors at the end of the year)57102.2910.1891.7922.773
Financial ConstraintFinConKZ Index57100.6821.611−4.4744.980
Agent costAgentOverheads/Operating income at the end of the year57100.0700.0550.0070.376
Technology innovationTechLog(Number of patent applications + 1)57101.2871.47805.841
Green technology innovationGtechLog(Number of green patent applications + 1)57100.3310.72403.555
Table 2. Baseline regression results.
(1)(2)(3)(4)
ROAROAEPSEPS
EnCon−0.0070 ***−0.0045 **−0.0514 ***−0.0422 ***
(0.0017)(0.0021)(0.0137)(0.0158)
Size_ass0.0024 ***0.0055 ***0.0573 ***0.0922 ***
(0.0009)(0.0013)(0.0076)(0.0093)
Size_sta−0.0001−0.0029 **0.0239 ***−0.0071
(0.0010)(0.0013)(0.0080)(0.0093)
Age−0.0111 ***−0.0125 ***−0.1121 ***−0.1080 ***
(0.0025)(0.0028)(0.0205)(0.0214)
Grow0.0319 ***0.0297 ***0.2669 ***0.2477 ***
(0.0018)(0.0024)(0.0150)(0.0187)
Own0.0002 ***0.0002 ***0.00050.0012 ***
(0.0001)(0.0001)(0.0004)(0.0004)
Fix−0.0446 ***−0.0373 ***−0.3004 ***−0.2639 ***
(0.0047)(0.0057)(0.0378)(0.0419)
Board0.0087 **0.0126 ***0.03810.0519
(0.0044)(0.0047)(0.0355)(0.0369)
Year effect NoYESNoYES
Industry effect NoYESNoYES
cons0.0179−0.0102−0.3730 ***−0.6707 ***
(0.0124)(0.0149)(0.1006)(0.1148)
N5710571057105710
R20.0770.1170.1050.168
Note: **, *** denote significance at the 5%, and 1% levels, respectively, and the values in parentheses are robust standard errors of clustering in the city–time dimension.
Table 3. Propensity score matching.
The Nearest Neighbor MatchingThe Nuclear Matching
(1)(2)(3)(4)
ROAEPSROAEPS
EnCon−0.0052 **−0.0461 **−0.0045 **−0.0420 **
(0.0021)(0.0161)(0.0021)(0.0158)
Control variables YESYESYESYES
Year effect YESYESYESYES
Industry effect YESYESYESYES
cons−0.0095−0.6368 ***−0.0100−0.6681 ***
(0.0155)(0.1225)(0.0149)(0.1148)
N5022502257085708
R20.1240.1730.1170.167
Note: **, *** denote significance at the 5%, and 1% levels, respectively, and the values in parentheses are robust standard errors of clustering in the city–time dimension.
Table 4. Instrumental variable estimation.
(1)(2)(3)
EnConROAEPS
IV0.0107 ***
(0.0024)
EnCon −0.066 *−0.471 *
(0.038)(0.286)
Control variables YESYESYES
Year effect YESYESYES
Industry effect YESYESYES
N563056305630
R2 −0.067−0.035
First stage F value19.51
Kleibergen-Paap rk LM Test 19.511 ***
(0.000)
Cragg-Donald Wald F Statistics 19.509
Note: *, *** denote significance at the 10%, and 1% levels, respectively, and the values in parentheses are robust standard errors of clustering in the city–time dimension.
Table 5. Heterogeneity test of enterprises’ ownership.
SOEsNon-SOEs
(1)(2)(3)(4)
ROAEPSROAEPS
EnCon−0.0060 **−0.0530 ***−0.0001−0.0169
(0.0024)(0.0201)(0.0037)(0.0250)
Control variables YESYESYESYES
Year effect YESYESYESYES
Industry effect YESYESYESYES
cons−0.0826 ***−0.8896 ***0.0042−0.9023 ***
(0.0215)(0.1677)(0.0239)(0.1706)
N3178317825322532
R20.1530.2120.1070.165
Note: **, *** denote significance at the 5%, and 1% levels, respectively, and the values in parentheses are robust standard errors of clustering in the city–time dimension.
Table 6. Results of robustness test.
Exclusion SampleControlling for Time Trends in VariablesExcluding Related Policy Interference
(1)(2)(3)(4)(5)(6)
ROAEPSROAEPSROAEPS
EnCon−0.0076 ***−0.0555 ***−0.0045 **−0.0436 ***−0.0052 **−0.0461 ***
(0.0024)(0.0185)(0.0021)(0.0157)(0.0021)(0.0160)
Control variables YESYESYESYESYESYES
Control variables × T YESYES
Control variables × T2 YESYES
Control variables × T3 YESYES
Policy1 0.00330.0516 **
(0.0027)(0.0229)
Policy2 0.0051 **0.0311 *
(0.0022)(0.0171)
Year effect YESYESYESYESYESYES
Industry effect YESYESYESYESYESYES
cons−0.0028−0.6981 ***−0.0138−0.7077 ***−0.0116−0.6857 ***
(0.0163)(0.1265)(0.0153)(0.1174)(0.0149)(0.1151)
N501550155710571057105710
R20.1220.1700.1300.1850.1180.170
Note: *, **, *** denote significance at the 10%, 5%, and 1% levels, respectively, and the values in parentheses are robust standard errors of clustering in the city–time dimension.
Table 7. Test results of financing constraints and agency costs.
(1)(2)(3)(4)(5)(6)
FinConAgentROAEPSROAEPS
EnCon0.1025 *0.0066 ***−0.0024−0.0275 **−0.0031−0.0368 **
(0.0536)(0.0018)(0.0017)(0.0129)(0.0021)(0.0158)
FinCon −0.0203 ***−0.1430 ***
(0.0006)(0.0042)
Agent −0.2177 ***−0.8039 ***
(0.0252)(0.1340)
Control variables YESYESYESYESYESYES
Year effect YESYESYESYESYESYES
Industry effect YESYESYESYESYESYES
cons−0.47910.2845 ***−0.0200−0.7392 ***0.0517 ***−0.4420 ***
(0.3750)(0.0128)(0.0125)(0.1003)(0.0154)(0.1191)
N571057105710571057105710
R20.1370.2870.3740.3550.1460.174
Note: *, **, *** denote significance at the 10%, 5%, and 1% levels, respectively, and the values in parentheses are robust standard errors of clustering in the city–time dimension.
Table 8. Test results of the innovation level.
(1)(2)(3)(4)(5)(6)
TechGtechROAEPSROAEPS
EnCon0.0827 *0.0697 ***−0.0049 **−0.0453 ***−0.0048 **−0.0451 ***
(0.0455)(0.0248)(0.0021)(0.0157)(0.0021)(0.0159)
Tech 0.0044 ***0.0379 ***
(0.0005)(0.0049)
Gtech 0.0037 ***0.0417 ***
(0.0011)(0.0110)
Control variables YESYESYESYESYESYES
Year effect YESYESYESYESYESYES
Industry effect YESYESYESYESYESYES
cons0.4836−1.3194 ***−0.0123−0.6890 ***−0.0054−0.6156 ***
(0.3430)(0.1954)(0.0149)(0.1139)(0.0149)(0.1141)
N571057105710571057105710
R20.2470.1770.1260.1780.1190.171
Note: *, **, *** denote significance at the 10%, 5%, and 1% levels, respectively, and the values in parentheses are robust standard errors of clustering in the city–time dimension.
Table 9. Results of the decomposition of the contribution of impact mechanisms.
PerformanceMed ω i ρ i α i RatioSummary
ROAFinCon0.1025 **−0.0203 ***−0.0045 **0.462Mediating effect: 0.781
Agent0.0066 ***−0.2177 ***−0.0045 **0.319
Tech0.0827 *0.0044 ***−0.0045 **0.081Masking effect: 0.138
Gtech0.0697 ***0.0037 ***−0.0045 **0.057
EPSFinCon0.1025 **−0.1430 ***−0.0422 ***0.348Mediating effect: 0.474
Agent0.0066 ***−0.8039 ***−0.0422 ***0.126
Tech0.0827 *0.0379 ***−0.0422 ***0.074Masking effect: 0.143
Gtech0.0697 ***0.0417 ***−0.0422 ***0.069
Note: *, **, *** denote significance at the 10%, 5%, and 1% levels, respectively, and the values in parentheses are robust standard errors of clustering in the city–time dimension.
Table 10. Long-term performance effects.
(1)(2)(3)(4)(5)
Tobin QTechGtechTobin QTobin Q
EnCon0.03390.0827 *0.0697 ***0.03280.0285
(0.0299)(0.0455)(0.0248)(0.0297)(0.0294)
Tech 0.0136 *
(0.0079)
Gtech 0.0773 ***
(0.0140)
Control variables YESYESYESYESYES
Year effect YESYESYESYESYES
Industry effect YESYESYESYESYES
cons6.3962 ***0.4836−1.3194 ***6.3896 ***6.4981 ***
(0.2416)(0.3430)(0.1954)(0.2413)(0.2387)
N57105710571057105710
R20.4230.2470.1770.4230.425
Note: *, *** denote significance at the 10%, and 1% levels, respectively, and the values in parentheses are robust standard errors of clustering in the city–time dimension.
Disclaimer/Publisher’s Note: The statements, opinions and data contained in all publications are solely those of the individual author(s) and contributor(s) and not of MDPI and/or the editor(s). MDPI and/or the editor(s) disclaim responsibility for any injury to people or property resulting from any ideas, methods, instructions or products referred to in the content.