
Techno-Economic Analysis of Redox-Flow and Lithium-Iron-Phosphate Battery Storages at Different Imbalance Settlement Intervals


Abstract
:1. Introduction
2. Review of the Literature
Imbalance Settlement
3. Methodology
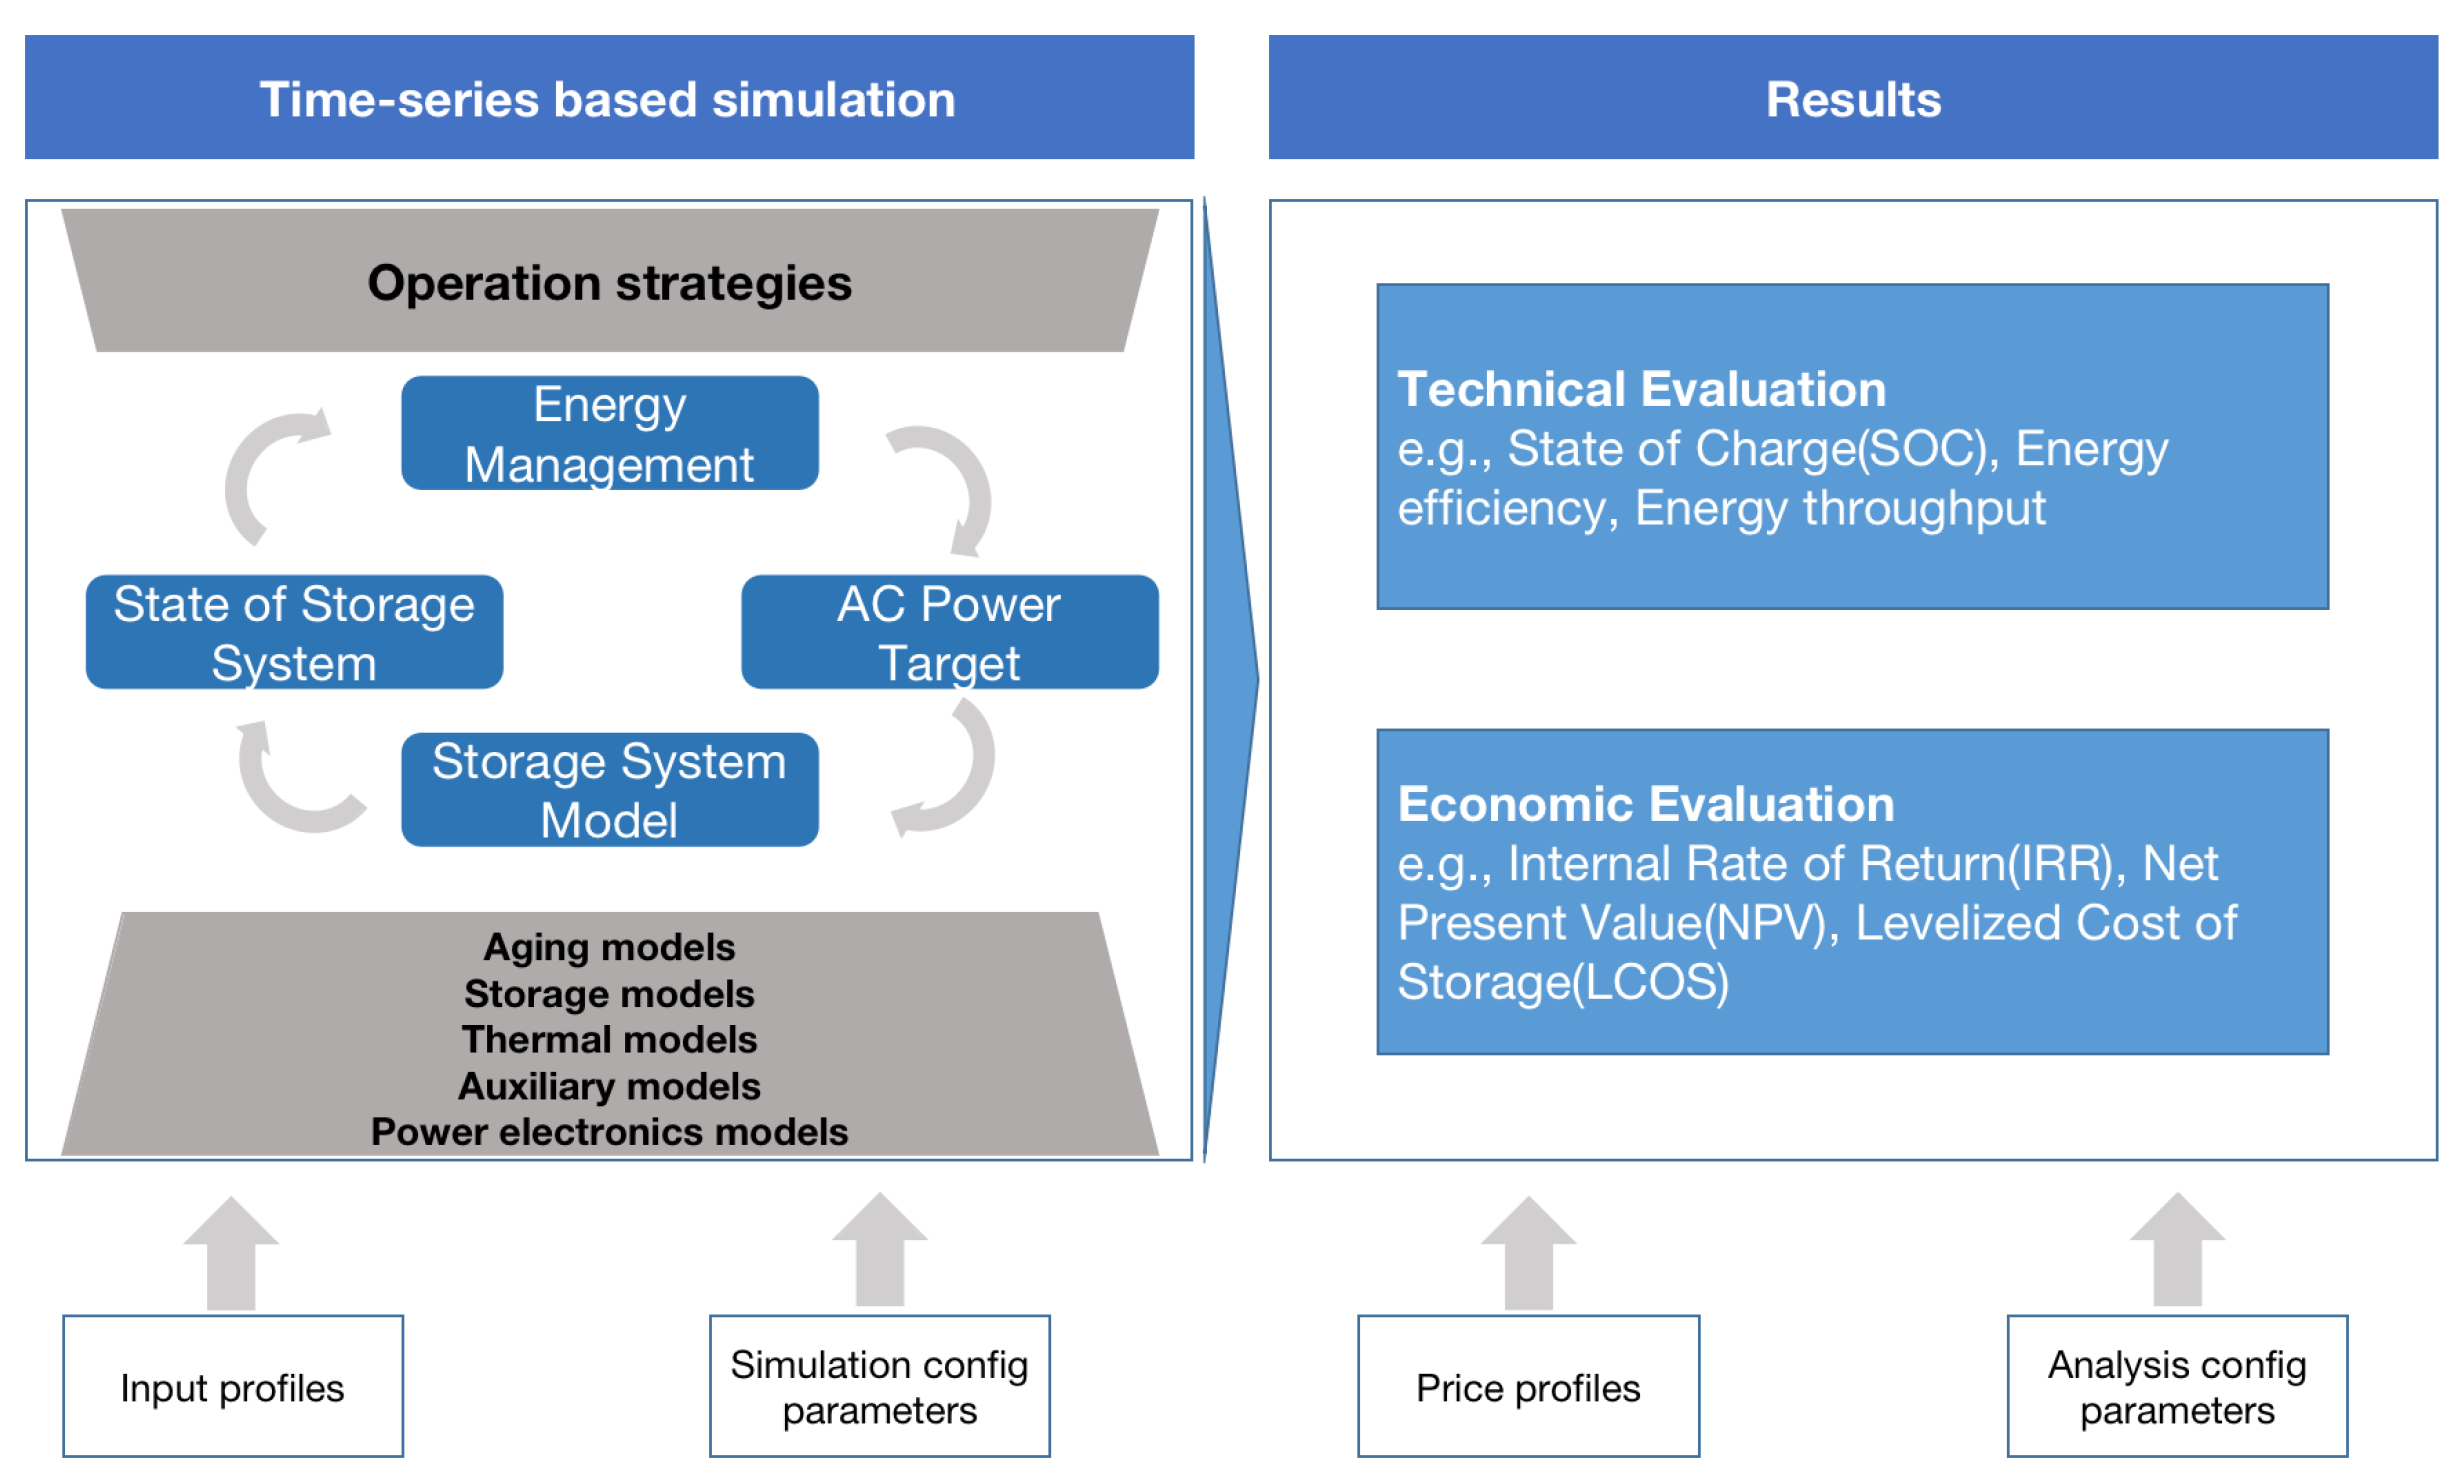
3.1. Description of the Simulation Framework for the Battery Models
3.2. Battery Technology Selection
3.2.1. Lithium-Iron Battery
3.2.2. Redox-Flow Battery
3.3. Description of the Data Sources and Variables Used in the Analysis
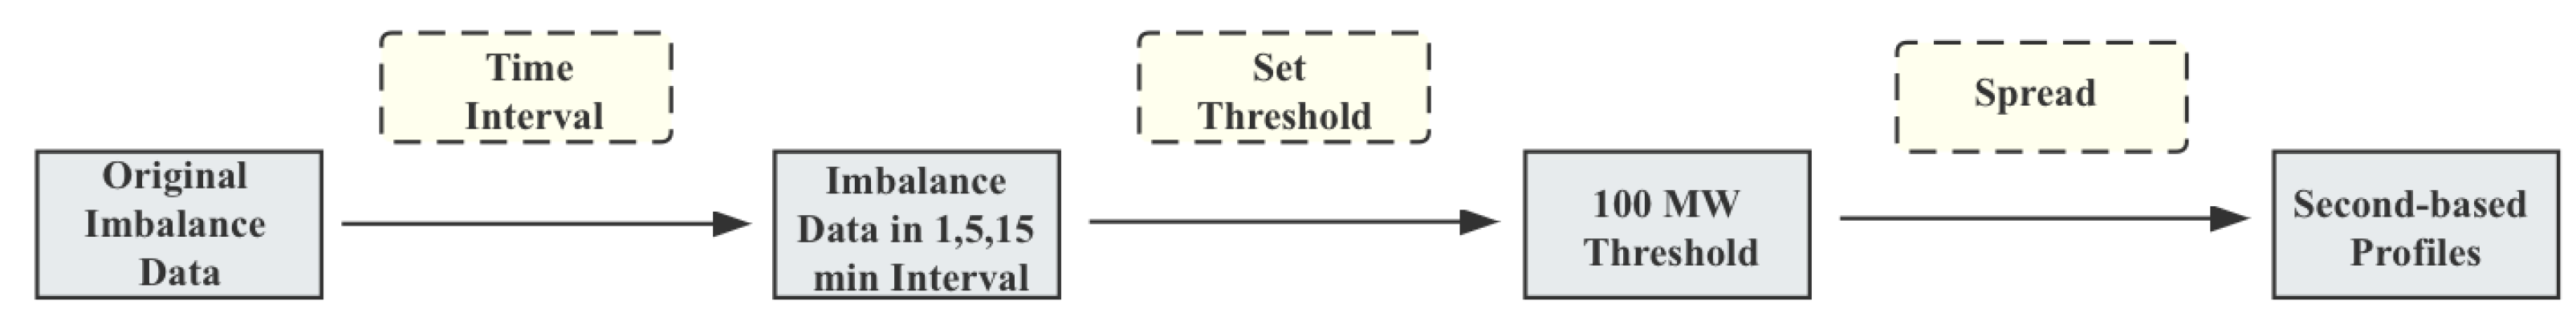
3.3.1. Data Preprocessing
3.3.2. Variables Used in the Analysis
3.4. Description of the Performance Metrics for Comparing the Batteries in Different Market Intervals
3.4.1. Technical Performance Metrics
- a.
- Energy Efficiency (%):This metric quantifies the ratio of energy output to energy input of the storage system, usually expressed as a percentage. It evaluates the system’s ability to convert input energy into usable electrical energy while accounting for losses during charge–discharge cycles;
- b.
- Mean State of Charge (SOC in %): This represents the average charge level in the battery system over a defined time frame, expressed as a percentage of the battery’s total capacity. It offers insights into the average utilization of the battery.
- c.
- Number of Sign Changes (per day): This count reflects the frequency with which the battery system alternates between charging and discharging modes daily. It is indicative of the system’s operational dynamism.
- d.
- Degradation (%): This metric denotes the decline in storage capacity over time, typically presented as a percentage. It is a critical factor for assessing the battery system’s durability and performance deterioration.
- e.
- Energy Throughput (MWh): This measures the total volume of energy processed through the battery system during its lifetime. It is pivotal for evaluating the system’s operational intensity and workload.
- f.
- Equivalent Full Cycles (cycles): This metric refers to the count of complete charge–discharge cycles that the battery system is capable of performing, normalized to its total capacity. It aids in comparing the cycling endurance of various battery technologies.
- g.
- Average Length of Resting Times (minutes): This metric computes the average duration between charge and discharge cycles when the battery is in a dormant state. It provides insights into the system’s operational pattern and standby efficiency.
- h.
- Fulfillment Factor (%): This factor denotes the ratio of actual output power to the target power, expressed as a percentage. It serves as an indicator of the system’s reliability and its proficiency in meeting energy demands.
3.4.2. Economic Performance Metrics
- a.
- Net Present Value (NPV in €): The NPV is a sophisticated economic valuation method that entails discounting the sum of all future cash flows, both inflow and outflow, emanating from the project, using a predetermined discount rate. The NPV is given by Equation (3):
- b.
- Internal Rate of Return (IRR in %): The IRR represents the rate at which a project becomes profitable. It is a measure of the real return generated by the project’s cash flows, and it is considered a wise investment if the IRR is higher than the hurdle rate. The IRR is calculated using Equation (4):
- c.
- Profitability Index (PI): The PI is the ratio of discounted benefits to discounted costs. It is a useful tool for ranking projects, with a PI of 1.0 being the theoretical minimum. The PI is shown in Equation (5):
- d.
- Return on Investment (ROI): The ROI is a metric used to evaluate the profitability of an investment or to compare the profitability of different investments. It is calculated as shown in Equation (6):
- e.
- Levelized Cost of Storage (LCOS in €/MWh): LCOS measures the discounted cost per unit of discharged power, taking into account all technical and financial factors. It is analogous to LCOE for generation technologies and is calculated using Equation (7):
3.5. Description of the Battery Models Used in the Study
4. Results and Discussions
4.1. Technical Results
4.2. Comparative Analysis of LFP and RFB Batteries
- (i)
- Energy Efficiency and State of Charge: Energy efficiency in the LFP batteries remained consistently high across the intervals, with values of 91.94%, 92.02%, and 92.27% for 1 min, 5 min, and 15 min intervals, respectively (Figure 5). This marginal increase suggests that LFP batteries maintain their efficiency even with less frequent cycling. The RFB batteries exhibited a slight decrease in efficiency, from 78.83% at the 1 min interval to 78.77% at the 15 min interval. The SOC mean for both battery types increased with the interval length, indicating a more balanced state of charge during longer intervals, with LFP showing a notable increase, from 51.1% to 52.93%.
- (ii)
- Cycling Frequency and Resting Times: The number of changes of signs per day, indicative of cycling frequency, decreased for both LFP and RFB as the interval lengthened (Figure 5). This reduction was more pronounced in the LFP batteries, suggesting a more significant impact of interval length on their cycling behavior. Correspondingly, the average length of resting times increased with the interval for both battery types, with the RFB batteries showing longer resting times overall, increasing from 70.24 min to 96.04 min (Figure 6). This could be advantageous for RFBs, as prolonged resting times may contribute to reduced wear and extended battery life.
- (iii)
- Degradation and Energy Throughput: Annual degradation, a critical factor in battery life expectancy, was significantly lower in the RFB batteries across all intervals, maintaining a consistent rate of 0.2% (Figure 5). Despite higher energy throughput in the LFP batteries, their higher annual degradation rates, ranging from 1.69% to 1.874%, may lead to shorter lifespans. The annual energy throughput and equivalent full cycles decreased with increasing interval length for both battery types, indicating a trade-off between cycling frequency and throughput.
- (iv)
- Fulfillment Factor: The average fulfillment factor increased with the interval length for both the LFP and the RFB batteries (Figure 5). This suggests that both battery types became more efficient at responding to system imbalance changes during longer intervals, with LFP showing a notable increase, from 93.35% to 96.91%.
- (v)
- Interval- and Chemistry-Wise Comparison: At the shortest interval, the LFP batteries outperformed the RFBs in energy throughput and equivalent full cycles, indicating a robust response to rapid grid fluctuations. However, the RFBs exhibited lower degradation rate, which could be beneficial for long-term applications. As the interval increased, the differences in energy throughput between the LFP and RFB batteries narrowed (Figure 7). At the longest interval, the LFP batteries continued to show higher energy throughput and equivalent cycles, but the gap between the two battery types diminished further. The SOC mean and fulfillment factor for the LFPs peaked at this interval, reflecting an optimal balance between cycling and efficiency.
- (vi)
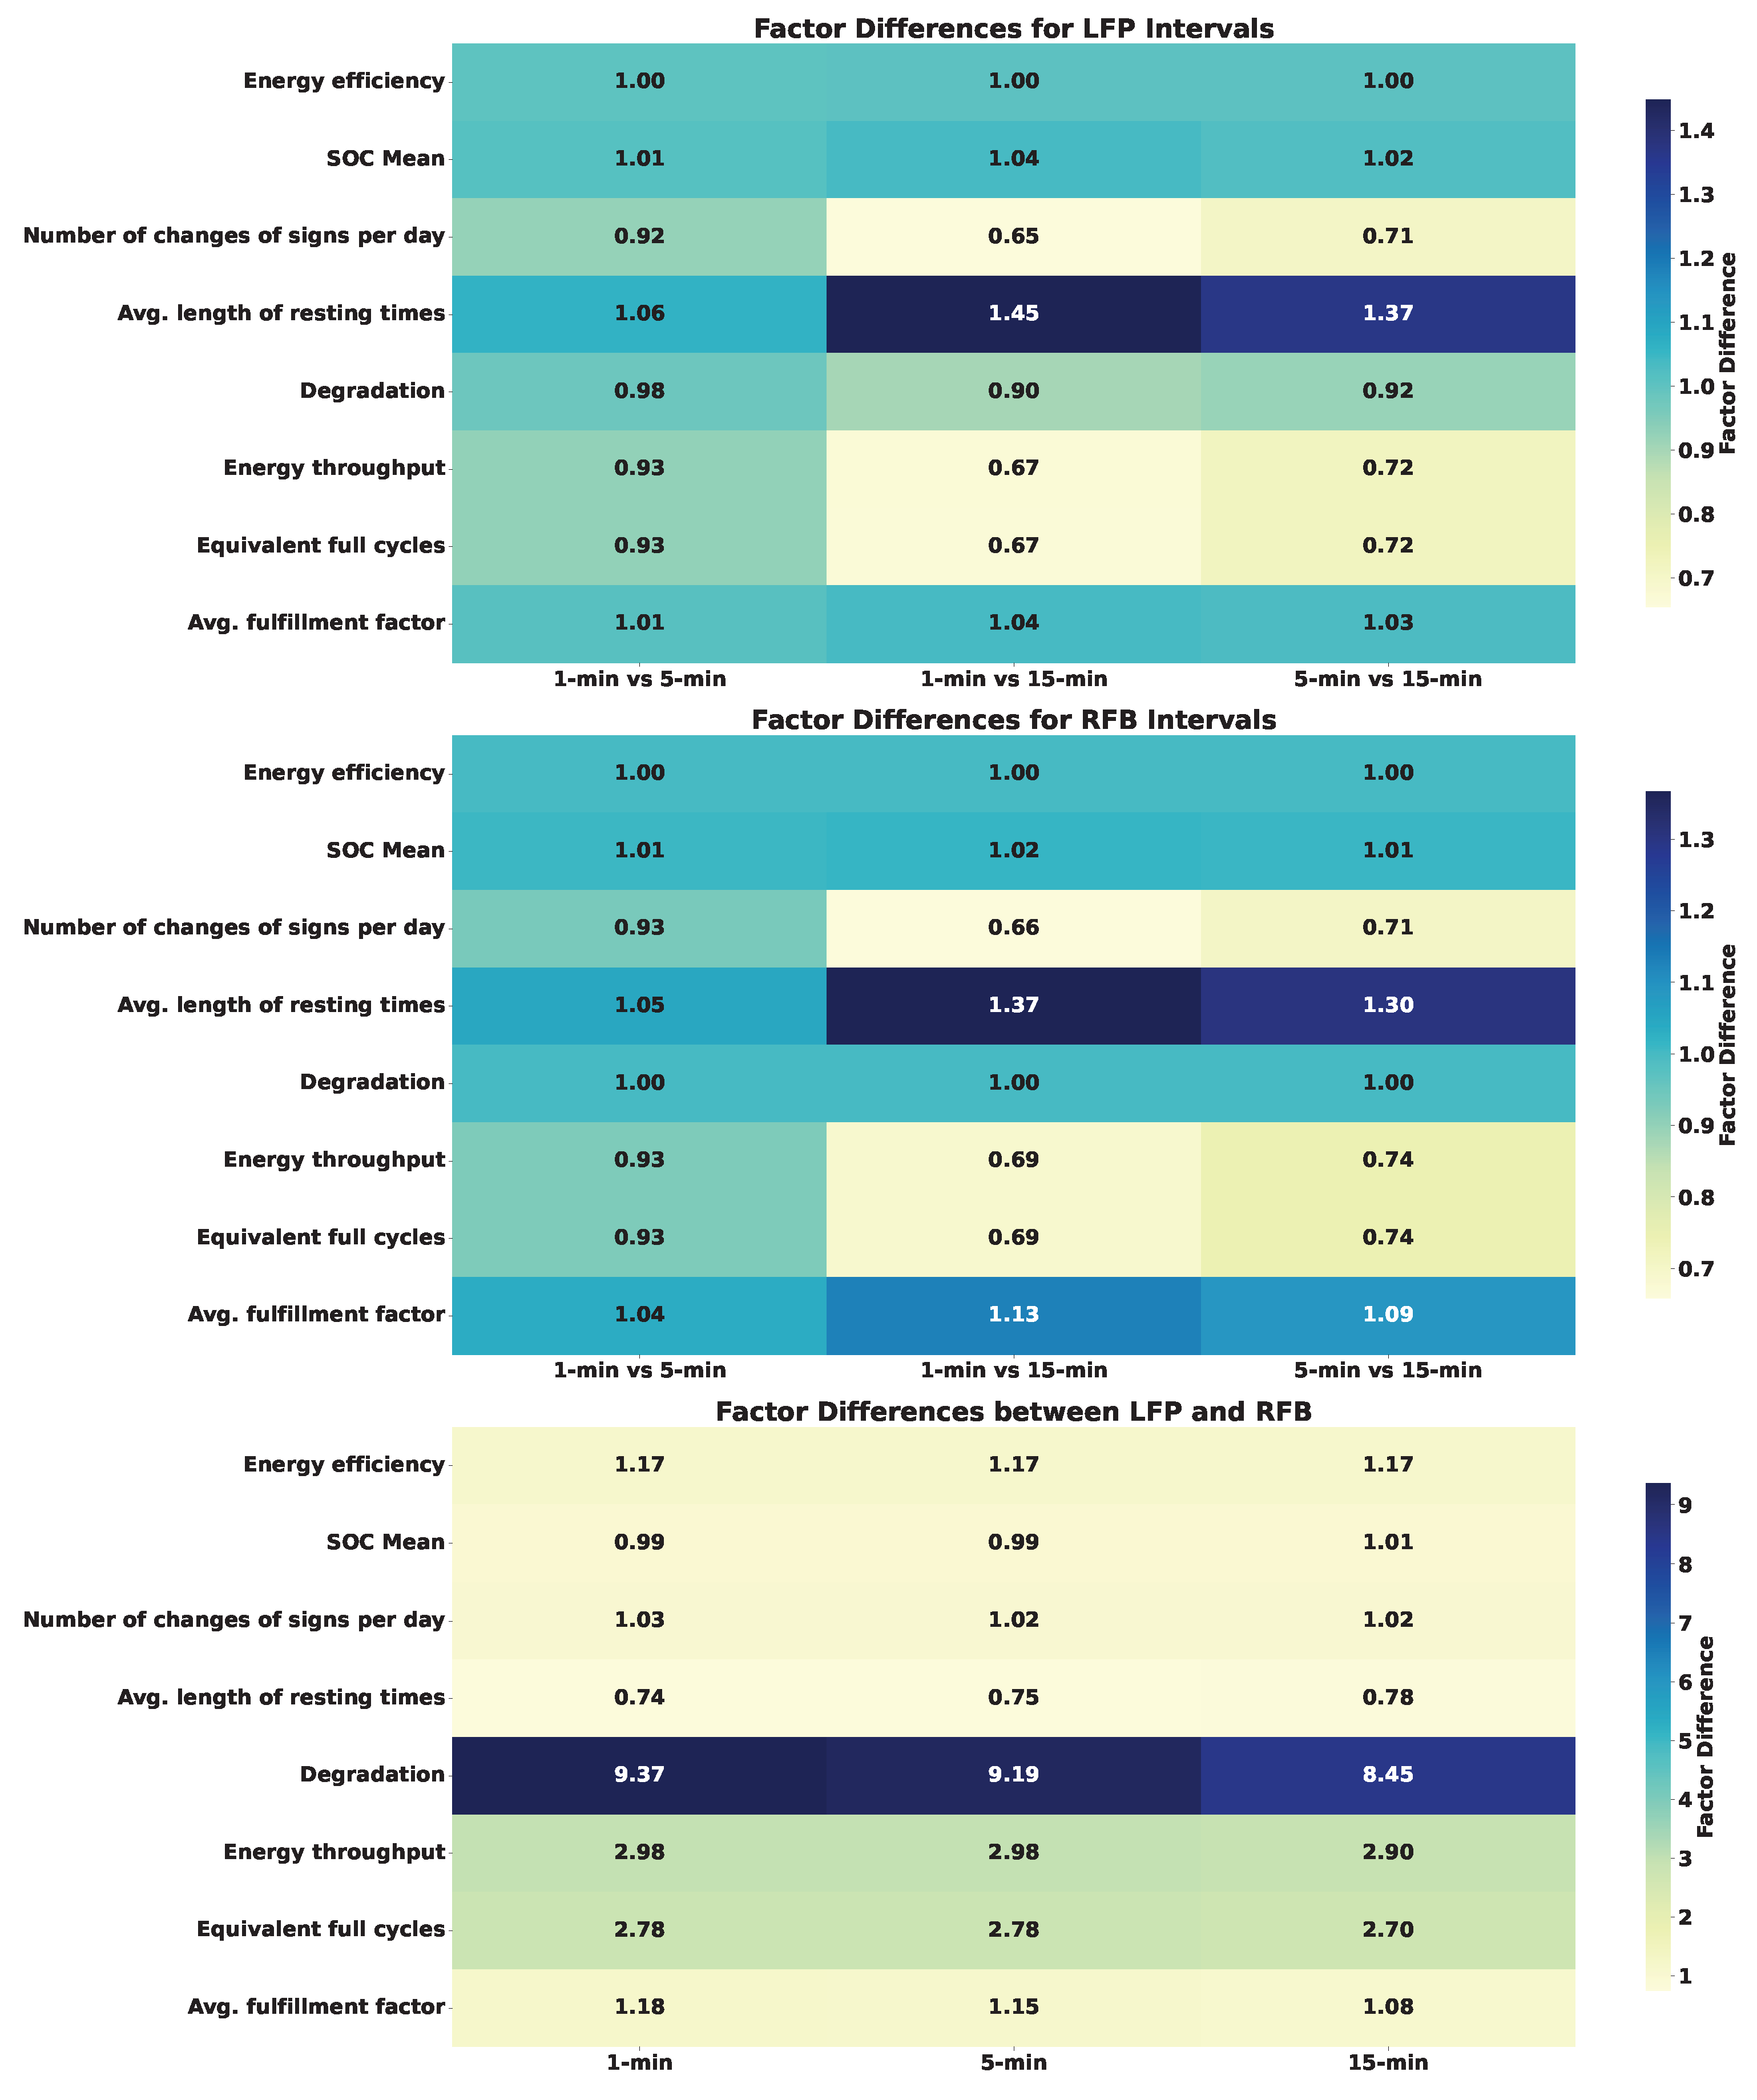
- Overall Insights and Heatmap Visualization: The LFP batteries demonstrated higher energy throughput and cycling rates, making them well-suited to applications requiring rapid response and high power output. Conversely, the RFB batteries, with their lower degradation rates and longer resting times, could be more suitable for applications prioritizing longevity and stability over immediate power delivery. The heatmap visualization in Figure 6 clarifies the factor differences between the LFP and RFB batteries across the three intervals. For the LFP batteries, the factor difference between the 1 min and 5 min intervals was minimal across most metrics, suggesting that LFP batteries respond similarly to short-term cycling changes. However, the factor difference between the 1 min and 15 min intervals was more pronounced, particularly in the `Number of changes of signs per day’ and `Equivalent full cycles’ metrics, highlighting the impact of longer intervals on cycling frequency and throughput. The RFB batteries showed a consistent factor difference across intervals, with a notable increase in ’Average length of resting times’ from the 5 min to the 15 min interval. This suggests that RFB batteries benefit from longer resting periods, which could contribute to their lower degradation rates. When comparing LFP and RFB directly, the heatmap revealed that the LFP batteries had a higher factor difference in `Energy throughput’ and `Equivalent full cycles’ at shorter intervals. This reinforces the notion that LFP batteries are more adept at handling frequent cycling and delivering high power. By contrast, the RFB batteries exhibited a higher factor difference in `Degradation’ and `Average length of resting times’, emphasizing their stability and potential for longer service life.
4.3. Economic Results
- (i)
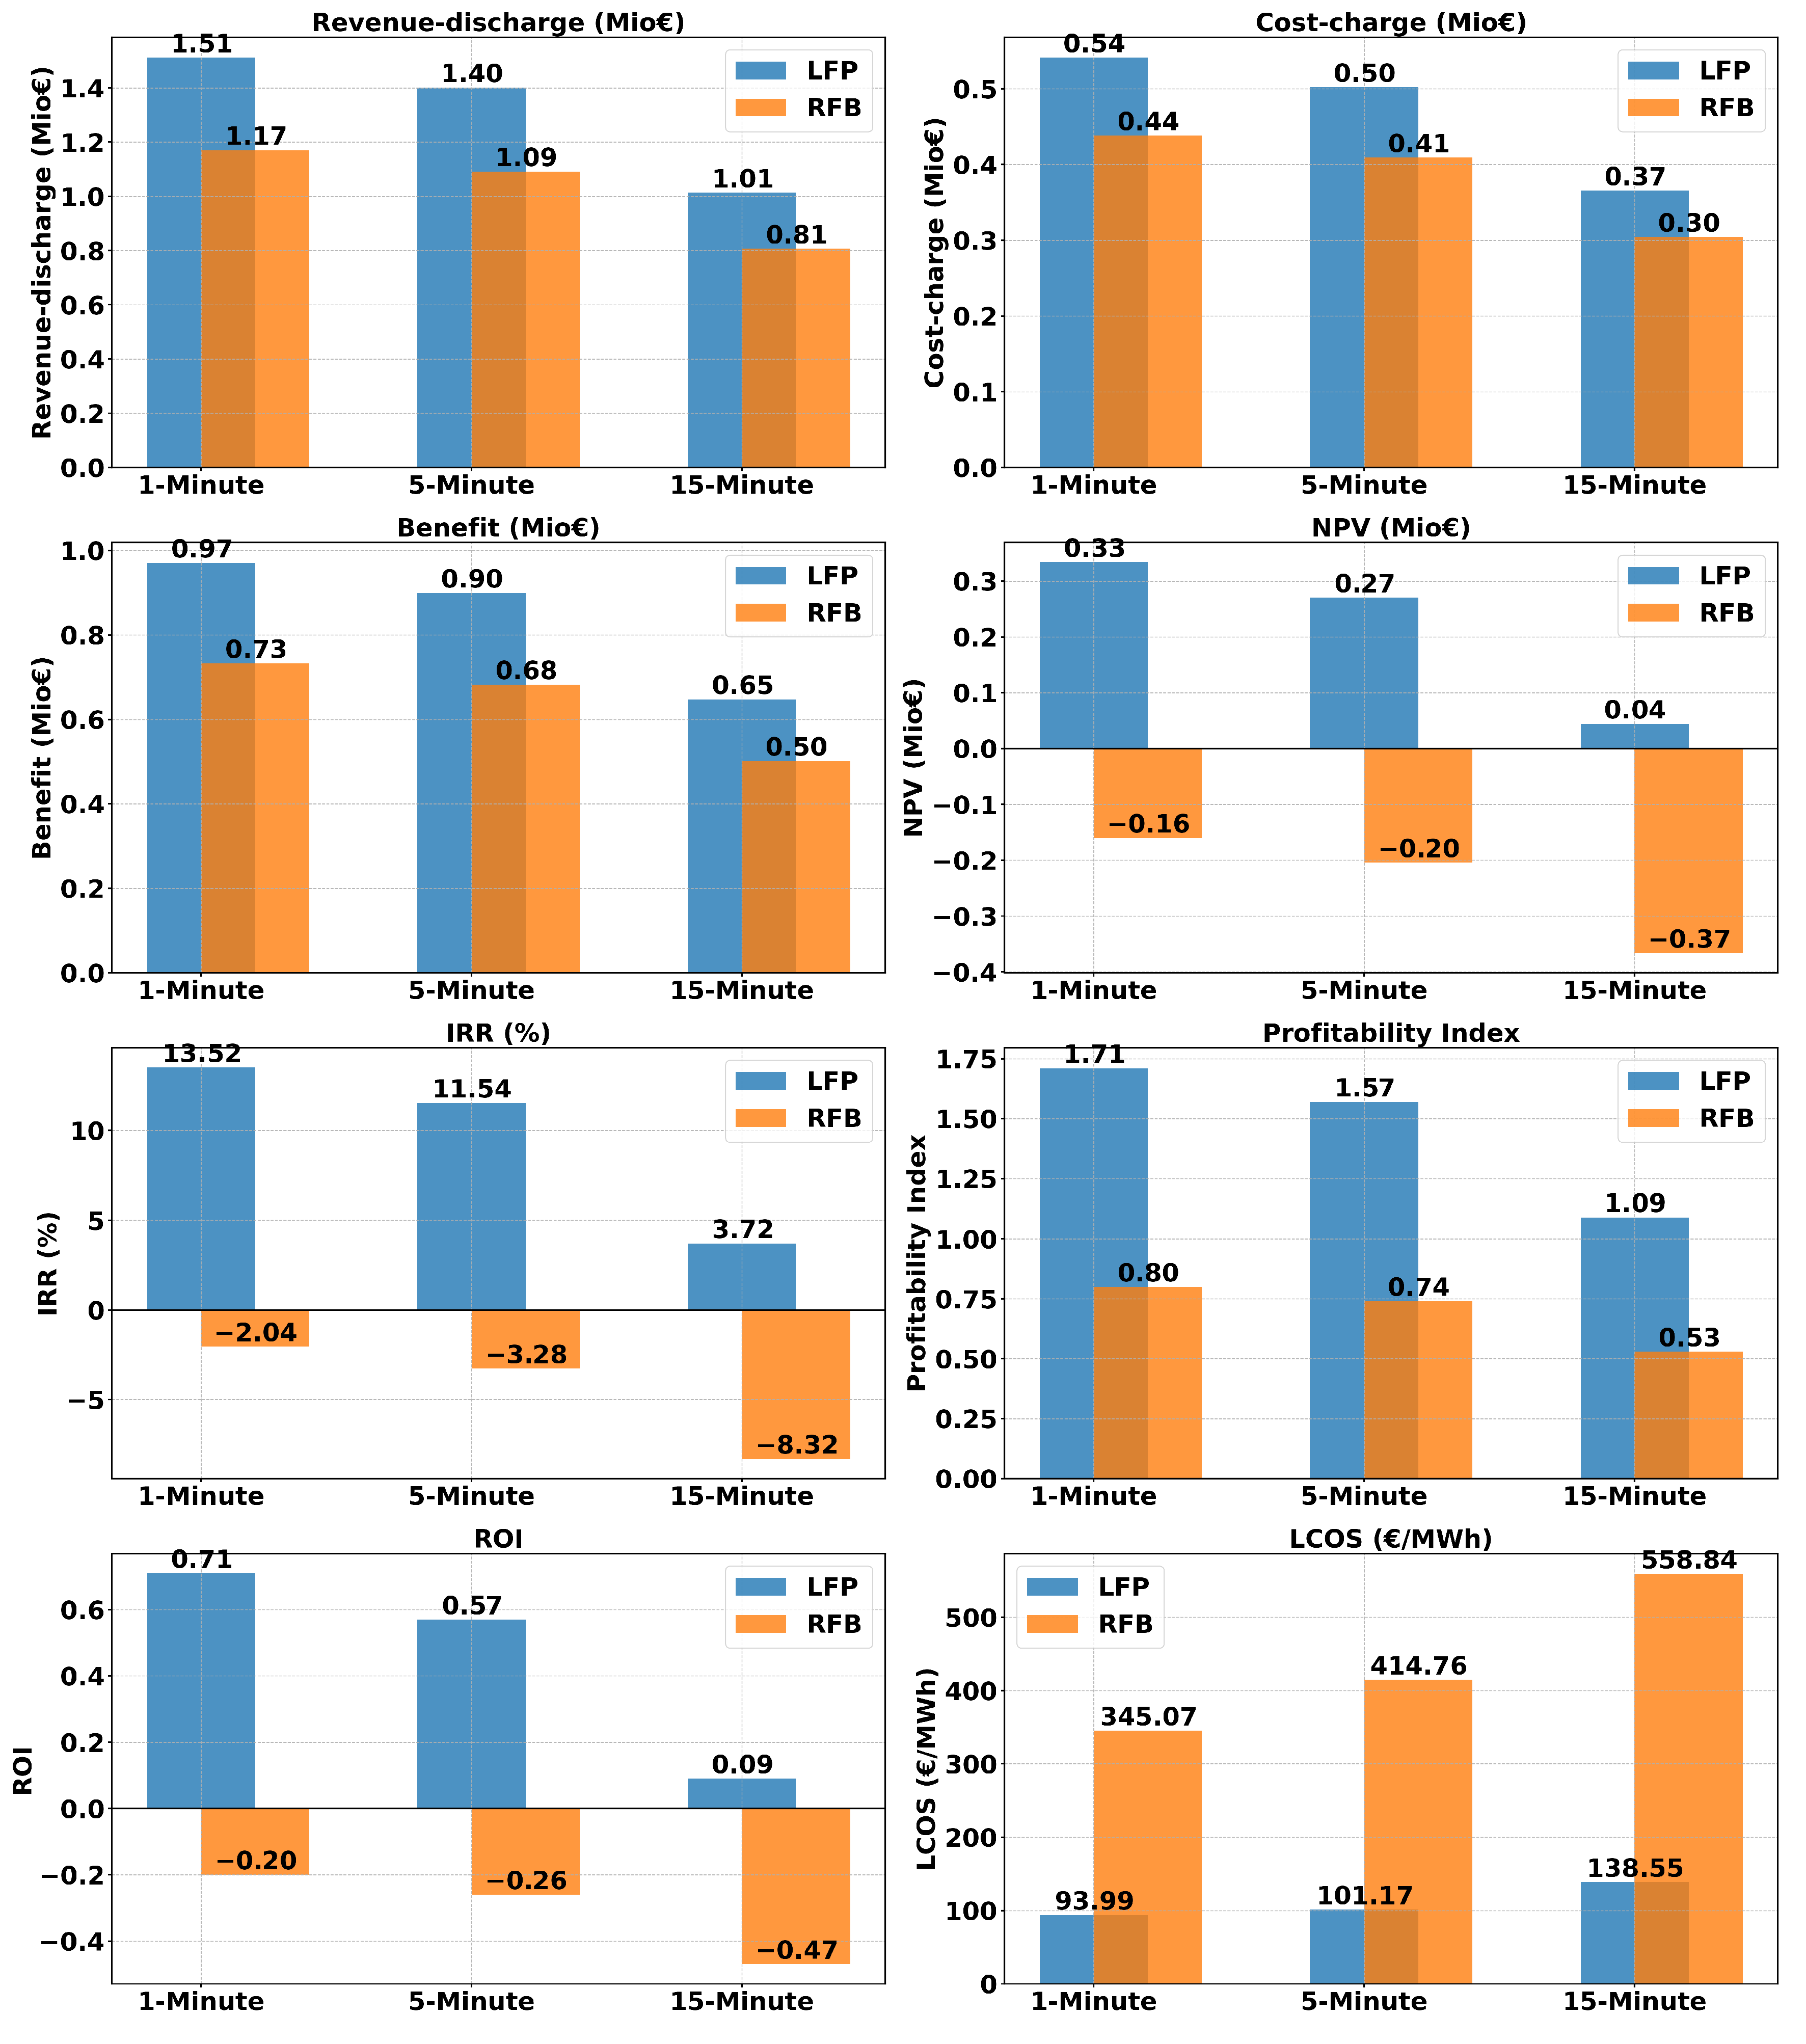
- Revenue, Cost, and Benefit Analysis: As illustrated in Figure 8, the LFP batteries consistently outperformed RFB, in terms of revenue, cost, and benefit across all market intervals. Notably, in the 1 min interval, LFP demonstrated a considerable economic advantage, with a revenue of €1.51 million compared to €1.17 million for RFB.
- (ii)
- Investment Viability Metrics: Figure 8 also describes the NPV and IRR for both battery types. The LFP batteries exhibited a positive NPV in all intervals, peaking at €334,043.2 in the 1 min interval. Conversely, the RFB batteries showed negative NPV values, suggesting unfavorable investment prospects.
- (iii)
- Profitability index and ROI: The Profitability Index and Return on Investment for LFP were positive across all intervals, with a peak ROI of 0.71 in the 1 min interval. By contrast, RFB manifested negative ROI values, indicating a less favorable economic outcome.
- (iv)
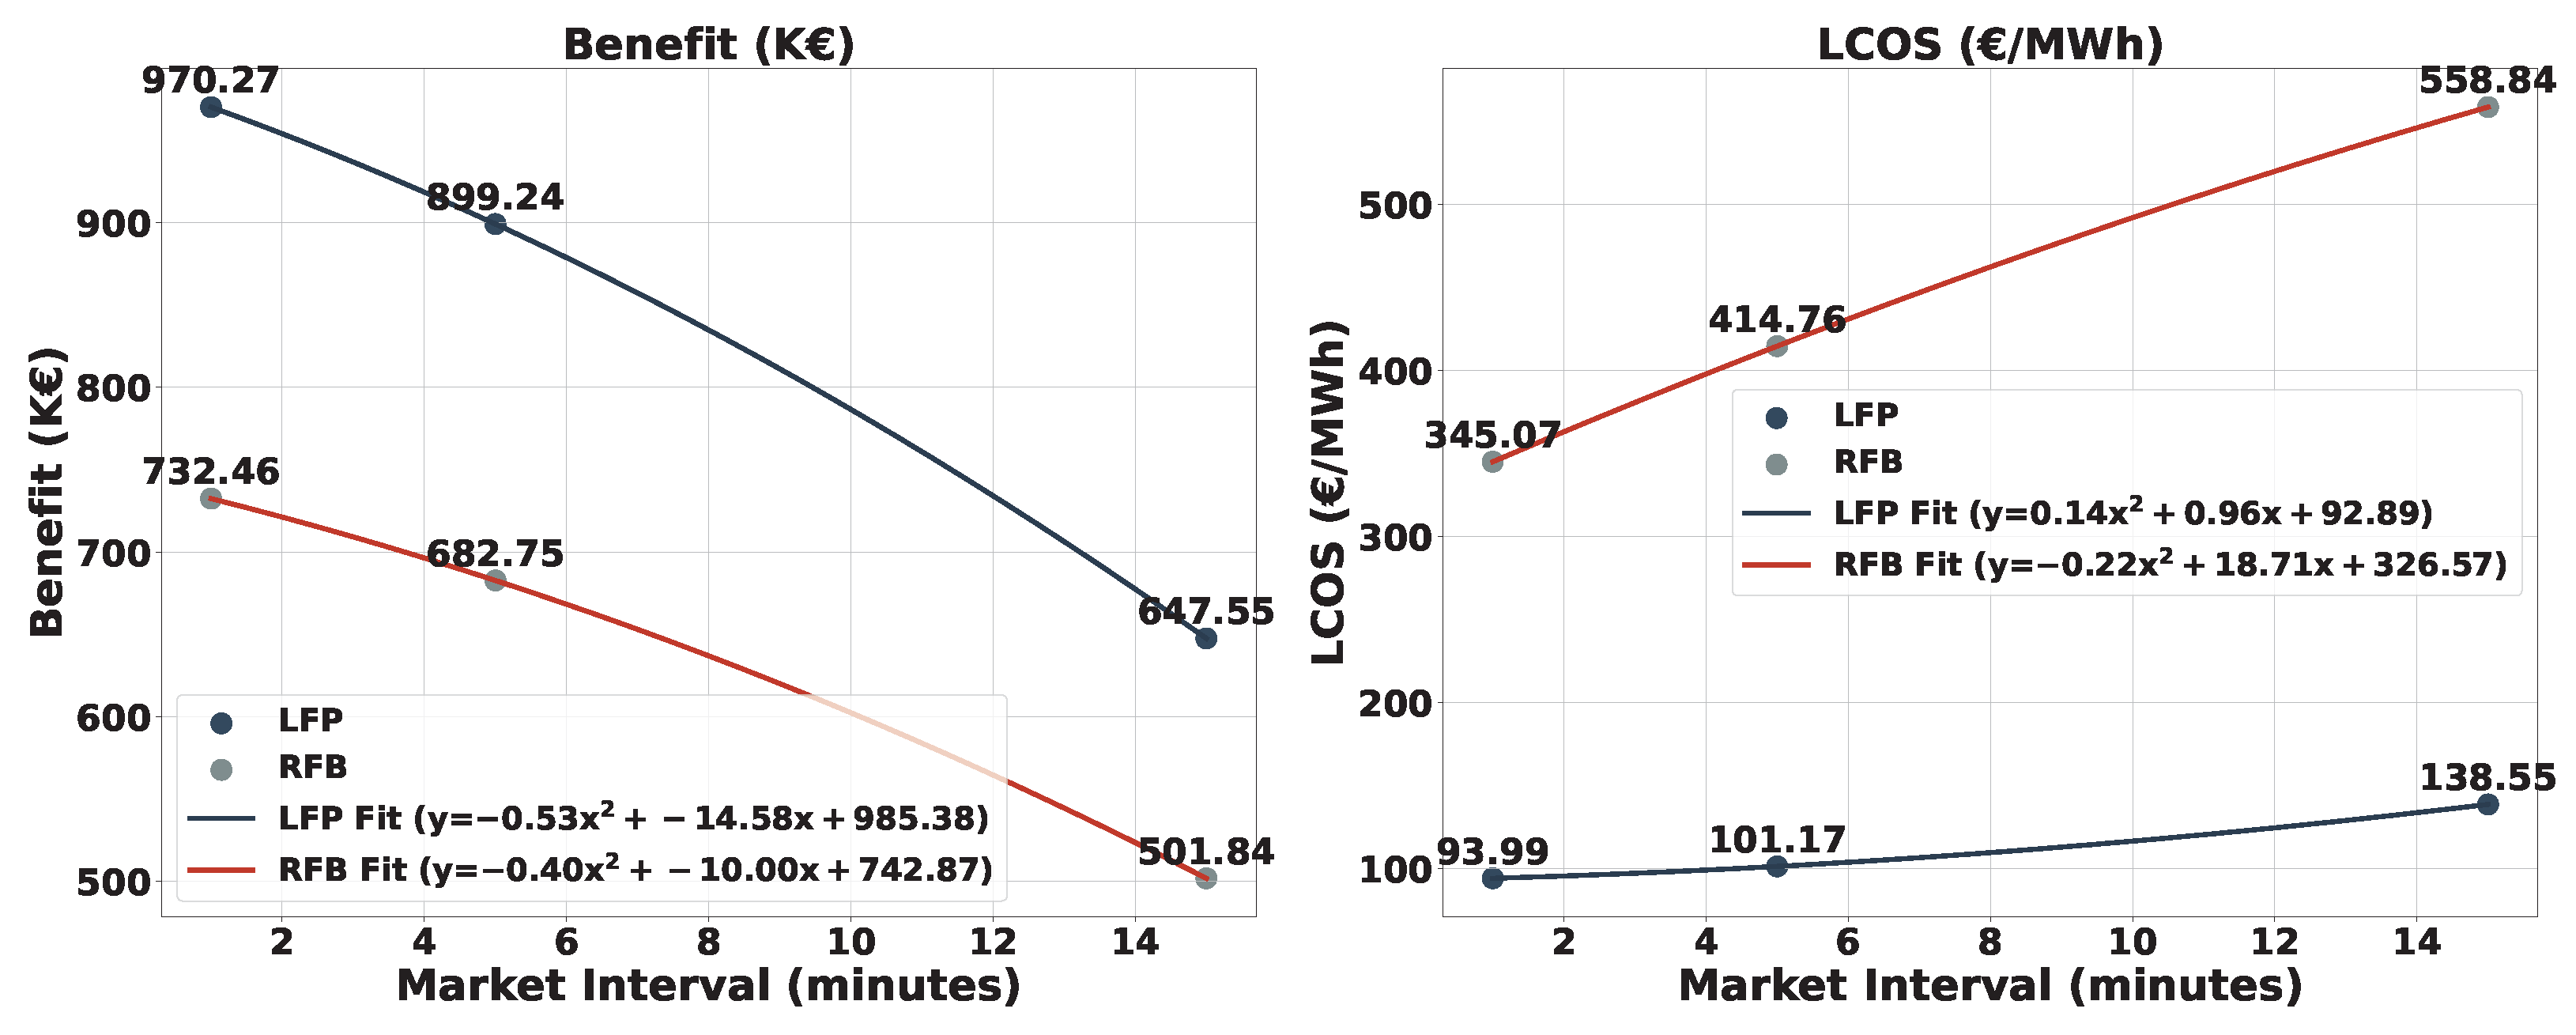
- Levelized Cost of Storage: LFP maintained a lower LCOS across all intervals, signifying cost effectiveness. In the 1 min interval, the LCOS for LFP was €93.99/MWh compared to €345.07/MWh for RFB.
- (v)
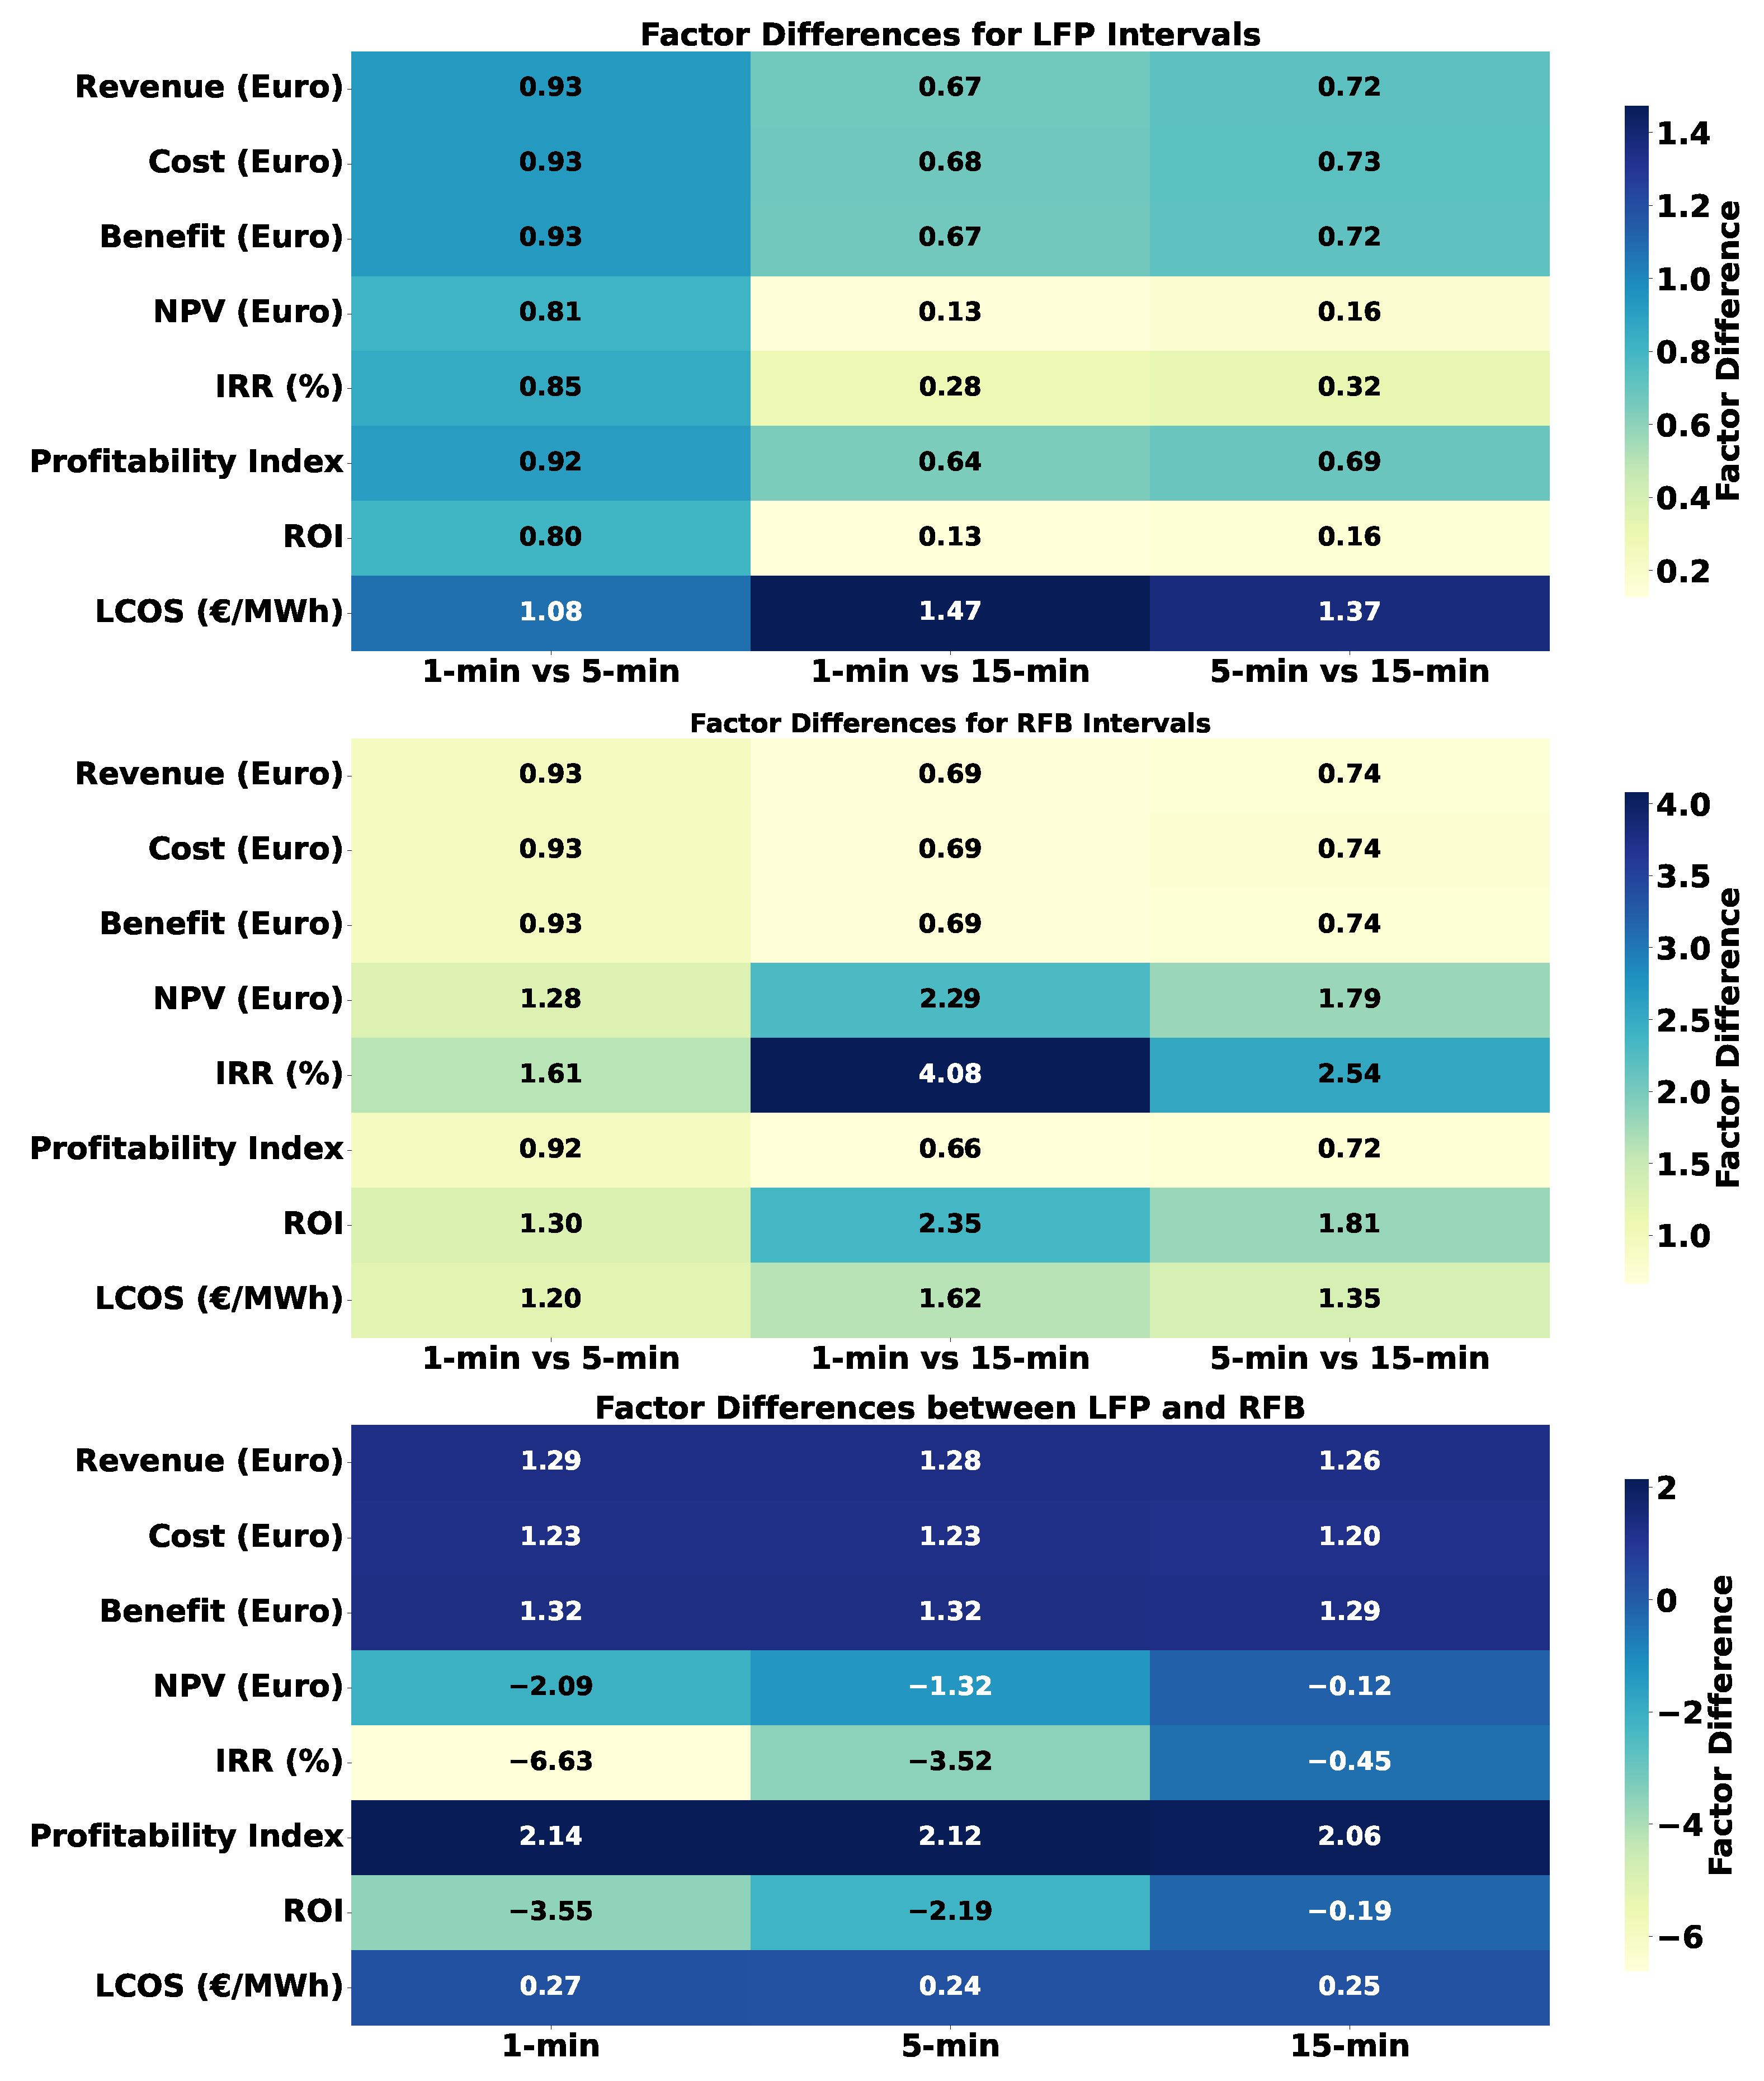
- Factor Difference Analysis: The heatmap presented in Figure 9 highlights the factor differences between the two battery technologies across different intervals. LFP demonstrated a more stable economic performance relative to RFB.
- (vi)
- Trend Analysis of Benefit and LCOS (Figure 10): The polynomial trend lines exhibited a decrease in benefits and an increase in LCOS as the interval lengthened for both battery types. Specifically, the polynomial fit for LFP was given by and for RFB by , where and were the respective coefficients derived from the polynomial fit. These trends underscore the economic challenges posed by RFB, particularly in longer market intervals.
4.4. LFP–RFB Techno-Economic Analysis Summary
5. Conclusions
Author Contributions
Funding
Data Availability Statement
Conflicts of Interest
Abbreviations
| DRES | Distributed Renewable Energy Sources |
| BRP | Balance Responsible Party |
| BESS | Battery Energy Storage System |
| LFP | Lithium-Iron-Phosphate Battery |
| RFB | Redox-Flow Battery |
| FCR | Frequency Containment Reserve |
| M5BAT | Modular Multi-Megawatt Multi-Technology Medium-Voltage Battery Energy Storage System |
| DoF | Degree of Freedom |
| TSO | Transmission System Operator |
| PCR | Primary Control Reserve |
| EPEX | European Power Exchange |
| CESA | Continental Europe Synchronous Area |
| SOC | State of Charge |
| NPV | Net Present Value |
| MIP | Marginal price for upward regulation |
| MDP | Marginal price for downward regulation |
| ECM | Equivalent Circuit Model |
| BMS | Battery Management System |
| CF | Cash Flow |
| IRR | Internal Rate of Return |
| PI | Profitability Index |
| ROI | Return on Investment |
| LCOS | Levelized Cost of Storage |
| LCOE | Levelized Cost of Electricity |
References
- Balancing Energy. Available online: https://www.50hertz.com/en/Market/Balancingenergy (accessed on 9 February 2023).
- Veen, R.A.C.v.; Hakvoort, R.A. The electricity balancing market: Exploring the design challenge. Util. Policy 2016, 12, 186–194. [Google Scholar] [CrossRef]
- European Internal Energy Market. Available online: https://www.50hertz.com/en/Market/Europeaninternalenergymarket (accessed on 9 February 2023).
- The Balancing Energy Market Has Started. Available online: https://www.smard.de/page/en/topic-article/205458/196374 (accessed on 5 March 2023).
- Hannan, M.A.; Wali, S.B.; Ker, P.J.; Rahman, M.S.A.; Mansor, M.; Ramachandaramurthy, V.K.; Muttaqi, K.M.; Mahlia, T.M.I.; Dong, Z.Y. Battery energy-storage system: A review of technologies, optimization objectives, constraints, approaches, and outstanding issues. J. Energy Storage 2021, 10, 103023. [Google Scholar] [CrossRef]
- Thien, T.; Schweer, D.; vom Stein, D.; Moser, A.; Sauer, D.U. Real-world operating strategy and sensitivity analysis of frequency containment reserve provision with battery energy storage systems in the german market. J. Energy Storage 2017, 10, 143–163. [Google Scholar] [CrossRef]
- Divshali, P.H.; Evens, C. Optimum Operation of Battery Storage System in Frequency Containment Reserves Markets. IEEE Trans. Smart Grid 2020, 11, 4906–4915. [Google Scholar] [CrossRef]
- Zeh, A.; Müller, M.; Naumann, M.; Hesse, H.; Jossen, A.; Witzmann, R. Fundamentals of Using Battery Energy Storage Systems to Provide Primary Control Reserves in Germany. Batteries 2016, 2, 29. [Google Scholar] [CrossRef]
- Groza, E.; Kiene, S.; Linkevics, O.; Gicevskis, K. Modelling of Battery Energy Storage System Providing FCR in Baltic Power System after Synchronization with the Continental Synchronous Area. Energies 2022, 15, 3977. [Google Scholar] [CrossRef]
- Chasparis, G.; Pichler, M.; Natschlager, T. A Demand-Response Framework in Balance Groups through Direct Battery-Storage Control. In Proceedings of the 2019 18th European Control Conference (ECC), Naples, Italy, 25–28 June 2019; pp. 1392–1397. [Google Scholar] [CrossRef]
- Koltermann, L.; Jacqué, K.; Figgener, J.; Zurmühlen, S.; Sauer, D.U. Balancing group deviation & balancing energy costs due to the provision of frequency containment reserve with a battery storage system in Germany. Electr. Power Energy Syst. 2022, 142, 108327. [Google Scholar]
- Myovela, R.; Kato, T. Coordinated Control of Air-conditioning Load and Battery Energy Storage System for Improving Electricity Supply-demand Balancing. In Proceedings of the 2022 IEEE PES Innovative Smart Grid Technologies—Asia (ISGT Asia), Singapore, 21–24 November 2022; pp. 235–239. [Google Scholar] [CrossRef]
- Zakeri, B.; Syri, S.; Wagner, F. Economics of energy storage in the German electricity and reserve markets. In Proceedings of the 2017 14th International Conference on the European Energy Market (EEM), Dresden, Germany, 6–9 June 2017; pp. 1–6. [Google Scholar] [CrossRef]
- Zakeri, B.; Syri, S. Economy of electricity storage in the Nordic electricity market: The case for Finland. In Proceedings of the 11th International Conference on the European Energy Market (EEM14), Krakow, Poland, 28–30 May 2014; pp. 1–6. [Google Scholar] [CrossRef]
- Lackner, C.; Nguven, T.; Byrne, R.H.; Wiegandt, F. Energy Storage Participation in the German Secondary Regulation Market. In Proceedings of the 2018 IEEE/PES Transmission and Distribution Conference and Exposition (T&D), Denver, CO, USA, 16–19 April 2018; pp. 1–9. [Google Scholar] [CrossRef]
- Haupt, L.M. Centralised Battery Flexibility Assessment for Imbalance Management in Spain Considering Li-Ion Degradation Mechanism. Master’s Thesis, Escola Tècnica Superior d’Enginyeria Industrial de Barcelona, Universitat Politècnica de Catalunya, Barcelona, Spain, 2018. [Google Scholar] [CrossRef]
- Wirtz, N.; Monti, A. Battery Storage Utilization for Cost and Imbalance Reduction in a Balancing Group. In Proceedings of the 2018 IEEE PES Innovative Smart Grid Technologies Conference Europe (ISGT-Europe), Sarajevo, Bosnia and Herzegovina, 21–25 October 2018; pp. 1–6. [Google Scholar] [CrossRef]
- Poplavskaya, K.; Lago, J.; Strömer, S.; de Vries, L. Making the most of short-term flexibility in the balancing market: Opportunities and challenges of voluntary bids in the new balancing market design. Energy Policy 2021, 11, 112522. [Google Scholar] [CrossRef]
- Mazzi, N.; Pinson, P. 10–Wind power in electricity markets and the value of forecasting. In Renewable Energy Forecastinge; Kariniotakis, G., Ed.; Woodhead Publishing series in Energy: Sawston, UK, 2017; pp. 259–278. [Google Scholar]
- Tariffs for Maintaining and Restoring the Residual Balance of Individual Access Responsible Parties1. Available online: https://www.elia.be/-/media/project/elia/elia-site/customers/tarrifs-and-invoicing/tariffs-and-invoicing/en/grille-tarifaire-desequilibre-2022-en-v20220214s.pdf (accessed on 13 March 2023).
- aFRR Product Design Note. Available online: https://www.elia.be/-/media/project/elia/elia-site/electricity-market-and-system---document-library/balancing---balancing-services-and-bsp/2018/2018-design-note-afrr.pdf (accessed on 13 March 2023).
- Koch, C.; Hirth, L. Short-term electricity trading for system balancing: An empirical analysis of the role of intraday trading in balancing Germany’s electricity system. Renew. Sustain. Energy Rev. 2021, 10, 109275. [Google Scholar] [CrossRef]
- Keeping the Balance. Available online: https://www.elia.be/en/electricity-market-and-system/system-services/keeping-the-balance (accessed on 3 March 2023).
- Koch, C. Intraday imbalance optimization: Incentives and impact of strategic intraday bidding behavior. Energy Syst. 2022, 5, 81, 409–435. [Google Scholar] [CrossRef]
- Clò, S.; Fumagalli, E. The effect of price regulation on energy imbalances: A Difference in Differences design. Energy Econ. 2019, 6, 754–764. [Google Scholar] [CrossRef]
- Koch, C.; Maskos, P. Passive balancing through intraday trading. whether interactions between short-term trading and balancing stabilize Germany’s electricity system. Energy Econ. Policy 2020, 10, 101–112. [Google Scholar] [CrossRef]
- Möller, M.; Kucevic, D.; Collath, N.; Parlikar, A.; Dotzauer, P.; Tepe, B.; Englberger, S.; Jossen, A.; Hesse, H. SimSES: A holistic simulation framework for modeling and analyzing stationary energy storage systems. J. Energy Storage 2022, 05, 103743. [Google Scholar] [CrossRef]
- Energy Activated Volumes and Prices. Available online: https://www.elia.be/en/grid-data/balancing/energy-activated-volumes-and-prices-1-min?csrt=6416723377057158927 (accessed on 13 March 2023).
- Pape, C.; Hagemann, S.; Weber, C. Are fundamentals enough? Explaining price variations in the German day-ahead and intraday power market. Energy Econ. 2016, 2, 376–387. [Google Scholar] [CrossRef]
- Tsiropoulos, I.; Tarvydas, D.; Lebedeva, N. Li-ion batteries for mobility and stationary storage applications—Scenarios for costs and market growth. JRC Sci. Policy Rep. 2018, 19–20. [Google Scholar] [CrossRef]


| 1 min | 5 min | 15 min | |
|---|---|---|---|
| Ave. Pos. Price [€/MWh] | −0.3696 | 0.1984 | 6.3029 |
| Ave. Neg. Price [€/MWh] | 60.2994 | 60.3929 | 56.0886 |
| Storage Technology | Power/kW | Capacity/kWh | EPR/h | Specific Cost/EUR/kWh | System Cost/EUR |
|---|---|---|---|---|---|
| LFP | 1000 | 1000 | 1 | 473 | 473,000 |
| RFB | 1000 | 1000 | 1 | 786 | 786,000 |
Disclaimer/Publisher’s Note: The statements, opinions and data contained in all publications are solely those of the individual author(s) and contributor(s) and not of MDPI and/or the editor(s). MDPI and/or the editor(s) disclaim responsibility for any injury to people or property resulting from any ideas, methods, instructions or products referred to in the content. |
© 2023 by the authors. Licensee MDPI, Basel, Switzerland. This article is an open access article distributed under the terms and conditions of the Creative Commons Attribution (CC BY) license (https://creativecommons.org/licenses/by/4.0/).
Share and Cite
Ezennaya, S.O.; Yuan, Z.; Kowal, J. Techno-Economic Analysis of Redox-Flow and Lithium-Iron-Phosphate Battery Storages at Different Imbalance Settlement Intervals. Sustainability 2023, 15, 15942. https://doi.org/10.3390/su152215942
Ezennaya SO, Yuan Z, Kowal J. Techno-Economic Analysis of Redox-Flow and Lithium-Iron-Phosphate Battery Storages at Different Imbalance Settlement Intervals. Sustainability. 2023; 15(22):15942. https://doi.org/10.3390/su152215942
Chicago/Turabian StyleEzennaya, Samuel O., Ziliao Yuan, and Julia Kowal. 2023. "Techno-Economic Analysis of Redox-Flow and Lithium-Iron-Phosphate Battery Storages at Different Imbalance Settlement Intervals" Sustainability 15, no. 22: 15942. https://doi.org/10.3390/su152215942
APA StyleEzennaya, S. O., Yuan, Z., & Kowal, J. (2023). Techno-Economic Analysis of Redox-Flow and Lithium-Iron-Phosphate Battery Storages at Different Imbalance Settlement Intervals. Sustainability, 15(22), 15942. https://doi.org/10.3390/su152215942