Article

Techno-Economic Analysis of Redox-Flow and Lithium-Iron-Phosphate Battery Storages at Different Imbalance Settlement Intervals

Department of Electrical Energy Storage Technology (EET), Institute of Energy and Automation, Technical University Berlin, Einsteinufer 11, 10587 Berlin, Germany
*
Author to whom correspondence should be addressed.
Sustainability 2023, 15(22), 15942; https://doi.org/10.3390/su152215942
Submission received: 15 October 2023 / Revised: 8 November 2023 / Accepted: 10 November 2023 / Published: 14 November 2023
(This article belongs to the Section Energy Sustainability)

Abstract

:
The proliferation of renewable energy sources has presented challenges for Balancing Responsible Parties (BRPs) in accurately forecasting production and consumption. This issue is being addressed through the emergence of the balancing markets, which aims to maintain real-time equilibrium between production and consumption across various imbalance settlement intervals. This study conducted a techno-economic analysis of Lithium-Iron-Phosphate (LFP) and Redox-Flow Batteries (RFB) utilized in grid balancing management, with a focus on a 100 MW threshold deviation in 1 min, 5 min, and 15 min settlement intervals. Imbalance data, encompassing both imbalance volumes and prices, sourced from the Belgian Transmission System Operator (TSO)—Elia—over a three-year period from September 2019 to September 2022, formed the basis of this investigation. The analysis underscored the significant influence of factors, such as imbalance volume, price dynamics, and market settlement intervals on the technical and financial feasibility of Battery Energy Storage Systems (BESSs) within the context of balancing management. Notably, the technical and economic results of LFP and RFB exhibited comparable tendencies across the different market settlement intervals, providing valuable insights into potential developments about how trends will evolve in other settlement intervals.

1. Introduction

At all times within the grid, the quantity of electricity produced and consumed should be equal. This calls for a precise consumption forecast, so that the anticipated production closely matches the actual consumption [1]. Imbalance in the grid happens as a result of inaccurate production or consumption forecast. With the increase in the amount of Distributed Renewable Energy Sources (DRES), added to the challenges following its forecasting, which results in compromising of the power quality, there is a need for storage devices to help in balancing the grid. The BRP is accountable for making sure that consumption and production in its balancing group are equal. Ancillary services must be enabled in the event of an imbalance, and the corresponding BRP will incur financial penalties for the deviation [2]. Otherwise, frequency deviations will emerge and may destabilize the system [3], potentially leading to power outages or system collapse. The process of regulating production and consumption of electrical energy in real time is referred to in this paper as reactive balancing. In order to ensure that there is adequate power supply to fulfill demand at all times, there is a need for the grid to be balanced in real time. Reactive balancing could ensure the stability of the electricity grid and avoid blackouts.
For batteries, when an imbalance in the electricity grid occurs as a result of consumption being lower than the electricity generated, the battery storage charges, to maintain the stability of the system. On the other hand, if the imbalance results from the consumption being higher, the battery storage discharges into the grid, to maintain stability. The prequalified suppliers can offer positive or negative balancing energy in the grid area, which is necessary for these processes [4]. A BESS can play an important role in reactive balancing by providing energy and further ensuring the stability of the electricity grid [5] because of its fast response time. In the electricity market, an imbalance settlement can be made with every 5 min, 15 min, 30 min, and even 60 min resolution, according to the needs and regulations of a region. Settlements are made within each settlement period, which is the length of time during which power is traded [5]. Due to changes in technology, market structure, and regulatory environment, the settlement times for the electricity market have evolved over time.
In recent times, settlement times on electricity markets are being considered for trading and settlement on a per-minute basis. For policymakers, energy experts, and academics, understanding the technical and economic potential of BESSs for these settlement periods is essential, to design and implement efficient energy policies, create innovative energy technologies, and foresee future trends [5]. This study contributes to this understanding by providing insights into the efficiency and effectiveness of 1, 5, and 15 min market intervals in the balancing market, highlighting suitable market settlement intervals for each of the two battery technologies considered. Moreover, it delves into the strengths and weaknesses of both LFP and RFB technologies when employed for reactive energy balancing. The findings of this research not only fill a crucial gap in the current literature by presenting a novel investigation into the feasibility of BESSs in these rapidly evolving market conditions, but also lay a foundation for future research in the energy storage domain.

2. Review of the Literature

While the imbalance management and frequency control reserve are important components of a stable and secure power system, BESSs with a capacity of several megawatts have been put into operation, due to falling battery prices and rising competition. There is a growing body of literature that investigates BESSs providing flexibility for frequency control and system imbalance management.
Thien et al. [6] presented a sensitivity analysis of several parameters in a Frequency Containment Reserve (FCR) application. This research buildt a model of the Modular Multi-Megawatt Multi-Technology Medium-Voltage Battery Energy Storage System (M5BAT) BESS, which included an energy management system for distributing load among the battery strings and a number of battery technologies. Measured frequency data simulations of FCR operation were provided. The operating plan created took into account the Degree of Freedom (DoF) and FCR needs of the TSO and was entirely suitable to the German FCR market. They explored how compliance with the FCR requirements, the quantity of corrective measures, the resultant energy throughput, state of energy distributions, and cycle numbers were affected by the lead time and the duration of the corrective measures, the energy management system, and the FCR requirements. The outcomes show that by changing the conditions, the overall advantages of FCR service with a BESS might be increased with a 30 min criterion.
Hasanpor et al. [7] focused on the battery storage systems online control approach and bidding strategy for the FCR market. To recover the SOC in accordance with the new legislation and optimize the battery storage system profit using the lifecycle model of the battery storage system, this research compared and suggested several control strategies and examined the behavior of a sizable battery storage system unit installed in the Helsinki region by simulating the suggested methods over measured frequency and market data. The result demonstrated that a BESS providing FCR regulation in Finland has a payback period that is greater than six years, despite the battery life in this application being only about eight years. In addition, the suggested approach can be applied to other frequency markets in various nations or used for impending flexibility goods by altering the values of the model’s parameters.
Zeh et al. [8] accomplished the sizing optimization of a BESS providing Primary Control Reserves (PCR) in Germany and made a control method recommendation that considered the specifications of the German market. To enable a realistic profitability calculation, the storage cost was also evaluated, together with battery aging simulations for various aging parameter ranges. Lithium iron technology was presumptuously the foundation of the PCR BESS. The simulation was done based on grid frequency data from 2012, 2013, and 2014. The average price for PCR power from 2014 PCR pricing data and the average electricity price in 2014 from the EPEX intraday stock in a 30 min criterion and a 15 min criterion were used in the economic evaluation of costs and energy prices for PCR power and battery cell aging. The calendric aging, cyclic aging, the income from running a PCR storage system from the PCR power supplied, and the outcomes of the simulation to complete the study were the specific trading price and the amount of energy sold on the intraday market.
Groza et al. [9] presented a case study of FCR arrangements with a BESS. The case study’s objective was to assess the technical viability of implementing FCR in Latvian power systems, following the synchronization of the Baltic power systems with the Continental Europe Synchronous Area (CESA). And the authors created an algorithm and mathematical model to mimic the dynamics of the BESS capacity and its SOC. The modeling was done using historical frequency information from the French and Latvian power systems. At 1 min intervals, the frequency measurements were summarized. The generated simulation results were applied to a different model, to assess the economic viability of the BESS for FCR. The quantity of FCR supplied by the BESS, the amount of electricity needed for the scheduled market transactions to renew the SOC, the dynamics of battery SOC and power, and the predicted amount of electricity needed to recharge the battery at the end of its life cycle were all shown in the results. The researchers calculated the net present value (NPV), the internal rate of return (IRR), and the discounted payback period of the BESS project, in order to evaluate its economic effectiveness. The annual revenue from the supply of FCR service as well as additional charges for SOC renewal in the intraday market via planned transactions were also taken into consideration by the researchers.
Chasparis, Pichler, and Natschläger [10] addressed the critical role of battery storage systems within the Austrian liberalized electricity market’s Balance Group (BG) organization. In their comprehensive study, they explored an optimization framework designed to enhance the energy management capabilities of BGs by harnessing the potential of direct battery storage control. This framework served to integrate consumer battery systems into the larger grid infrastructure, creating a more responsive and efficient energy landscape by optimizing battery activation within set time intervals. Furthermore, the model underscored the importance of addressing both technological constraints and consumer disutility, aiming to align individual incentives with broader grid requirements. The implications of this study for demand response optimization underscored a transformative approach to energy distribution and consumption, paving the way for more adaptive and resilient electricity markets.
Similarly, Koltermann et al. [11] explored the implications of providing FCR through battery storage systems, particularly focusing on balancing group deviation and associated energy costs in Germany. Their study revealed that the deployment of FCR can indeed lead to energetic imbalances within a balancing group, yet such actions may simultaneously generate a cost-related benefit for the balancing group manager. Through comprehensive simulation models, validated with field data from a 6 MW battery storage system, the authors demonstrated that the regulatory framework provides degrees of freedom that allow for additional charging or discharging of energy, which in turn can yield notable profits. Their findings underscored the potential economic benefits of providing FCR and suggested that such services contribute positively to the balance sheets of balancing groups, offering a new perspective on the role of battery storage systems in energy markets.
Myovela’s and Kato’s [12] research focused on developing a coordinated control strategy that allows HVAC systems to operate within comfortable temperature ranges while simultaneously utilizing a BESS to balance the electricity supply and demand. The study outlined a model where HVAC operational adjustments are made based on predicted demand errors and a BESS is charged or discharged to offset these discrepancies, thereby minimizing grid imbalances. Through simulation results, the research demonstrated that the proposed method could eliminate an average load imbalance of 6.6%, which was a significant improvement over HVAC curtailment alone, which only managed a reduction to 5.4%.
Furthermore, Zakeri et al. [13] critically examined the economic viability of electrical energy storage technologies, such as pumped-hydro storage, compressed-air energy storage, and various battery types, including NaS, lead–acid, and Li-ion, within the German day-ahead and reserve markets. Utilizing a robust mixed-integer optimization model, their research revealed that, while price arbitrage could offset up to 25% of the life cycle costs of electrical energy storage, only certain technologies, like PHS, might see a return on investment when also considering revenue from reserve markets. Their analysis, spanning from 2010 to 2015, underscored the lack of a clear trend in potential revenues, indicating a high dependency on short-term price volatility rather than consistent market growth or decline. For battery technologies, the cost barriers remained significant; even with potential revenue from reserve markets, high-cost batteries still struggle to reach profitability, based on 2016 cost data. However, they posited that low-cost batteries with longer discharge times may approach a breakeven point when combining benefits from energy and reserve markets.
In the context of the Nordic electricity market, Zakeri and Syri [14] delved into a comprehensive analysis based on historical pricing data from 2009 to 2013. Their research, which focused on a range of Electrical Energy Storage (EES) systems, revealed that while pumped-hydro storage yields the most favorable benefit-to-cost ratio, particularly in the balancing market, no single EES system is inherently profitable purely through intraday price arbitrage. The study underscored the sensitivity of compressed-air energy storage profitability to fluctuating gas prices and highlighted the equivalence of marginal production costs between advanced lead–acid batteries and sodium–sulfur batteries when accounting for efficiency and replacement cycles. They examined optimal sizes for EES technologies, concluding that larger storage capacities do not necessarily equate to increased financial returns for arbitrage. Additionally, the research acknowledged the potential for additional revenues from ancillary services, such as frequency-controlled reserves, though these did not offset the costs sufficiently to ensure profitability under current market conditions. This intricate analysis laid bare the intricate dynamics at play within Finland’s unique energy market and the challenges posed for EES systems in achieving economic sustainability.
The operational feasibility and economic viability of BESSs within the German secondary frequency regulation market were explored by Lackner et al. [15]. By simulating the participation of a 48 MWh BESS, their study presented a nuanced exploration of the revenue prospects from market involvement, focusing on the potential shifts in energy storage’s role against the backdrop of increasing renewable penetration. Their findings underscored BESSs’ potential to alleviate grid fluctuations without significantly impacting the market dynamics, due to their relatively low market share. While the simulation acknowledged the complexity of the market and operational nuances, such as varying bid prices for normal and high tariffs, it streamlined these elements, to focus on the core potential revenue streams from capacity and energy compensation. The assumptions served as a critical baseline for the simulation, shaping the insights into BESSs’ efficacy in positive and negative secondary regulation service roles. This research extended the current understanding of ESS economics and operation in de-regulated power systems and suggested potential areas for future inquiry.
Haupt [16] offered an in-depth analysis of centralized battery flexibility for imbalance management in Spain’s electricity market, considering the degradation mechanisms of lithium-ion batteries. The research conducted a robust simulation, using 2017 market and imbalance data, employing a piecewise linear cost function to closely mimic the battery’s degradation process. Haupt’s findings indicated that, while integrating degradation into operational decisions can extend battery life and enhance economic outcomes, the overall business case for leveraging centralized lithium-ion battery flexibility for imbalance management did not meet the threshold for investment breakeven in the Spanish context. Haupt’s conclusions advocated for future research to delve into more comprehensive battery dispatch optimization strategies, encompassing not just cycle-based but also calendar-based degradation, and to test the algorithm in other, potentially more lucrative markets.
Lastly, Wirtz’s and Monti’s [17] research was on the strategic utilization of BESS within balancing groups, reflecting on the trade-offs between cost reduction and energy imbalance mitigation. They determined a theoretical optimum for the utilization of BESSs, varying strategies between prioritizing cost reduction and energy imbalance mitigation. A critical takeaway from their findings was the realization that the effectiveness of BESSs is constrained by various operational strategies and their corresponding outcomes on the energy market and grid stability. The strategic manipulation of battery scheduling, particularly in markets with fluctuating energy prices, like Germany’s, could pose challenges from a transmission system operator’s perspective, due to the potential instabilities from unscheduled imbalances.
While existing studies have underscored the significance of frequency data in the operational simulation of BESSs, for effective frequency control, a comprehensive understanding of BESSs’ role in grid balancing requires an analysis that transcends frequency considerations. Moreover, some other works that are related to system imbalance have focused on understanding the strategic operational and economic aspects of BESSs in balancing markets. Factors such as imbalance volume, pricing dynamics, and settlement intervals could be critical in assessing the feasibility and economic performance of BESS metrics that include the levelized cost of storage, the net present value, the internal rate of return, and the return on investment. To date, the literature has largely overlooked the granular impact of market settlement intervals on the feasibility of BESSs.
In bridging this knowledge gap, our investigation embarked on a refined examination of BESSs across varying market settlement intervals: 1, 5, and 15 min. This analysis not only delved into the operational implications of these intervals on battery degradation but also evaluated the economic ramifications underpinning the deployment strategies of BESSs. Our research thus unveiled a layered perspective on BESS operations, paving the way for optimization frameworks that holistically consider a spectrum of market-driven and technical factors. With the proximity of market-clearing prices to real-time system operations, our findings facilitate a more agile response to renewable fluctuations, optimizing the management of TSO’s portfolios. Therefore, our research contributes a distinctive and actionable framework to the discourse, providing pivotal insights for stakeholders and informing policy direction within the energy sector.

Imbalance Settlement

Balancing markets play a pivotal role in stabilizing the electric system. Even though they operate as short-term electricity markets, they are intricately connected to other markets. These connections influence the bidding strategies of BRPs by presenting them with avenues to market their flexibility. Participants unsuccessful or absent from prior balancing capacity markets can engage in the balancing market, either voluntarily or as “second-chance” bidders [18]. Given the necessity for production and consumption to be in equilibrium for the effective functioning of electric power networks, the role of the balancing market becomes indispensable [19].
Conventional producers usually enter the market for balancing products to supply regulating power in both upward (increasing production) and downward (decreasing production) directions. Stochastic producers, on the other hand, use this stage to rectify deviations from the stipulated schedule. These deviations are priced variably, based on the market’s imbalance pricing system [19]. An imbalance associated with a BRP is denoted with a plus or minus sign, which indicates whether the tariff applied is for purchasing or selling. An over-injection by a BRP results in a positive imbalance, which attracts a feed-in tariff. Conversely, an under-injection leads to a negative imbalance, incurring a loss-making tariff [20]. The imbalance price is derived from the marginal prices for upward (MIP) and downward (MDP) regulations [21]. The MIP for a specific interval is the highest unit price across all upward activations, while the MDP is the minimum among all downward activations [21]. The balancing energy’s imbalance settlement adopts a pay-as-cleared approach, whereby the imbalance volume is forecast in advance, and the price is determined at market clearance, allowing customers to decide on charging or discharging based on the given signal.
In the electric market, terms such as “final positions” represent actual consumption/generation quantities, while “imbalances” denote deviations between these positions and schedules. The imbalance settlement intervals or periods, depicted in Figure 1, are currently set at 5, 15, 30, and 60 min in many European countries [22].
The 1 min interval is not currently used in any large-scale electricity markets, but there has been discussion about its potential benefits and drawbacks. It can deliver more precise price signals than other interval settlements, which could encourage the adoption of renewable energy sources and encourage more energy-efficient use. It enables customers to react to price changes more quickly and to adapt their energy usage accordingly. The 5 min interval is currently adopted in Australia, India, and some other countries. It motivates generators to distribute energy effectively, cutting down on waste and expense. It facilitates the integration of renewable energy sources by delivering precise price signals that take into account current supply and demand. The availability of 15 min contracts on the Belgian, Dutch, German, and Swiss markets, among others, allows for great flexibility in managing the daily ramping impacts of renewable generation and helps maintain a stable market. By allowing for precise demand and supply predictions, 15 min intervals can also aid in efficient grid balancing, enabling effective use of energy resources, which can lower the cost of electricity overall. However, it might not give consumers enough specificity to encourage them to utilize electricity during off-peak hours. Switzerland, the United Kingdom, and France all provide 30 min contracts. It is a straightforward, tried-and-true system that is simple to use, and it offers an excellent blend of intricacy and granularity. Compared to shorter settlements, it necessitates less frequent market administration and monitoring. But with some types of energy resources, such as batteries or other quick-response technology, it might not deliver precise enough price indications. In some Scandinavian countries and in Brazil, the 60 min interval is currently used. It can be simpler and less expensive to implement than shorter settlement times, which can further save on administrative and regulatory expenses for market operators. However, as prices are adjusted less frequently to reflect changes in supply and demand, it can lead to less efficient use of energy resources and might not deliver precise enough pricing signals to encourage investment in these resources, making it less effective at integrating renewable energy sources.
In Belgium, a single pricing mechanism is applied for settling energy imbalances [23]. In this pricing mechanism, the price that BRPs pay to support the system balance is the same as that paid by BRPs whose imbalance position is the opposite of that [24], and the imbalance price is based on the sign of the market imbalance. A negative sign denotes a short market, which is characterized by the predominance of specific, negative imbalances. The maximum difference between the price on the day ahead (DA) market and the upward price on the balancing market is the imbalance price in this instance. The imbalance price is the difference between the DA price and the downward price on the balancing market at the minimum, when the sign is positive (long market, brought on by a preponderance of individual positive imbalances) [25]. According to the BRP, being under-supplied results in a minimal penalty in the event of a system shortage but an incentive in the event that the system balance is over-supplied. It can be advantageous to take a sell position and settle for the imbalance price if the current intraday market price is higher than the expected imbalance price (and vice versa). It is not permissible to take an intentional imbalance position [24]. Empirical studies, however, show that at least some market players respond to imbalance pricing expectations [26]. For this action to stabilize the system, it needs a price that is adequate for the imbalance. If the system balance is positive, the imbalance price must be more than the intraday market price, and if the system balance is negative, it must be lower than the intraday price [24].

3. Methodology

3.1. Description of the Simulation Framework for the Battery Models

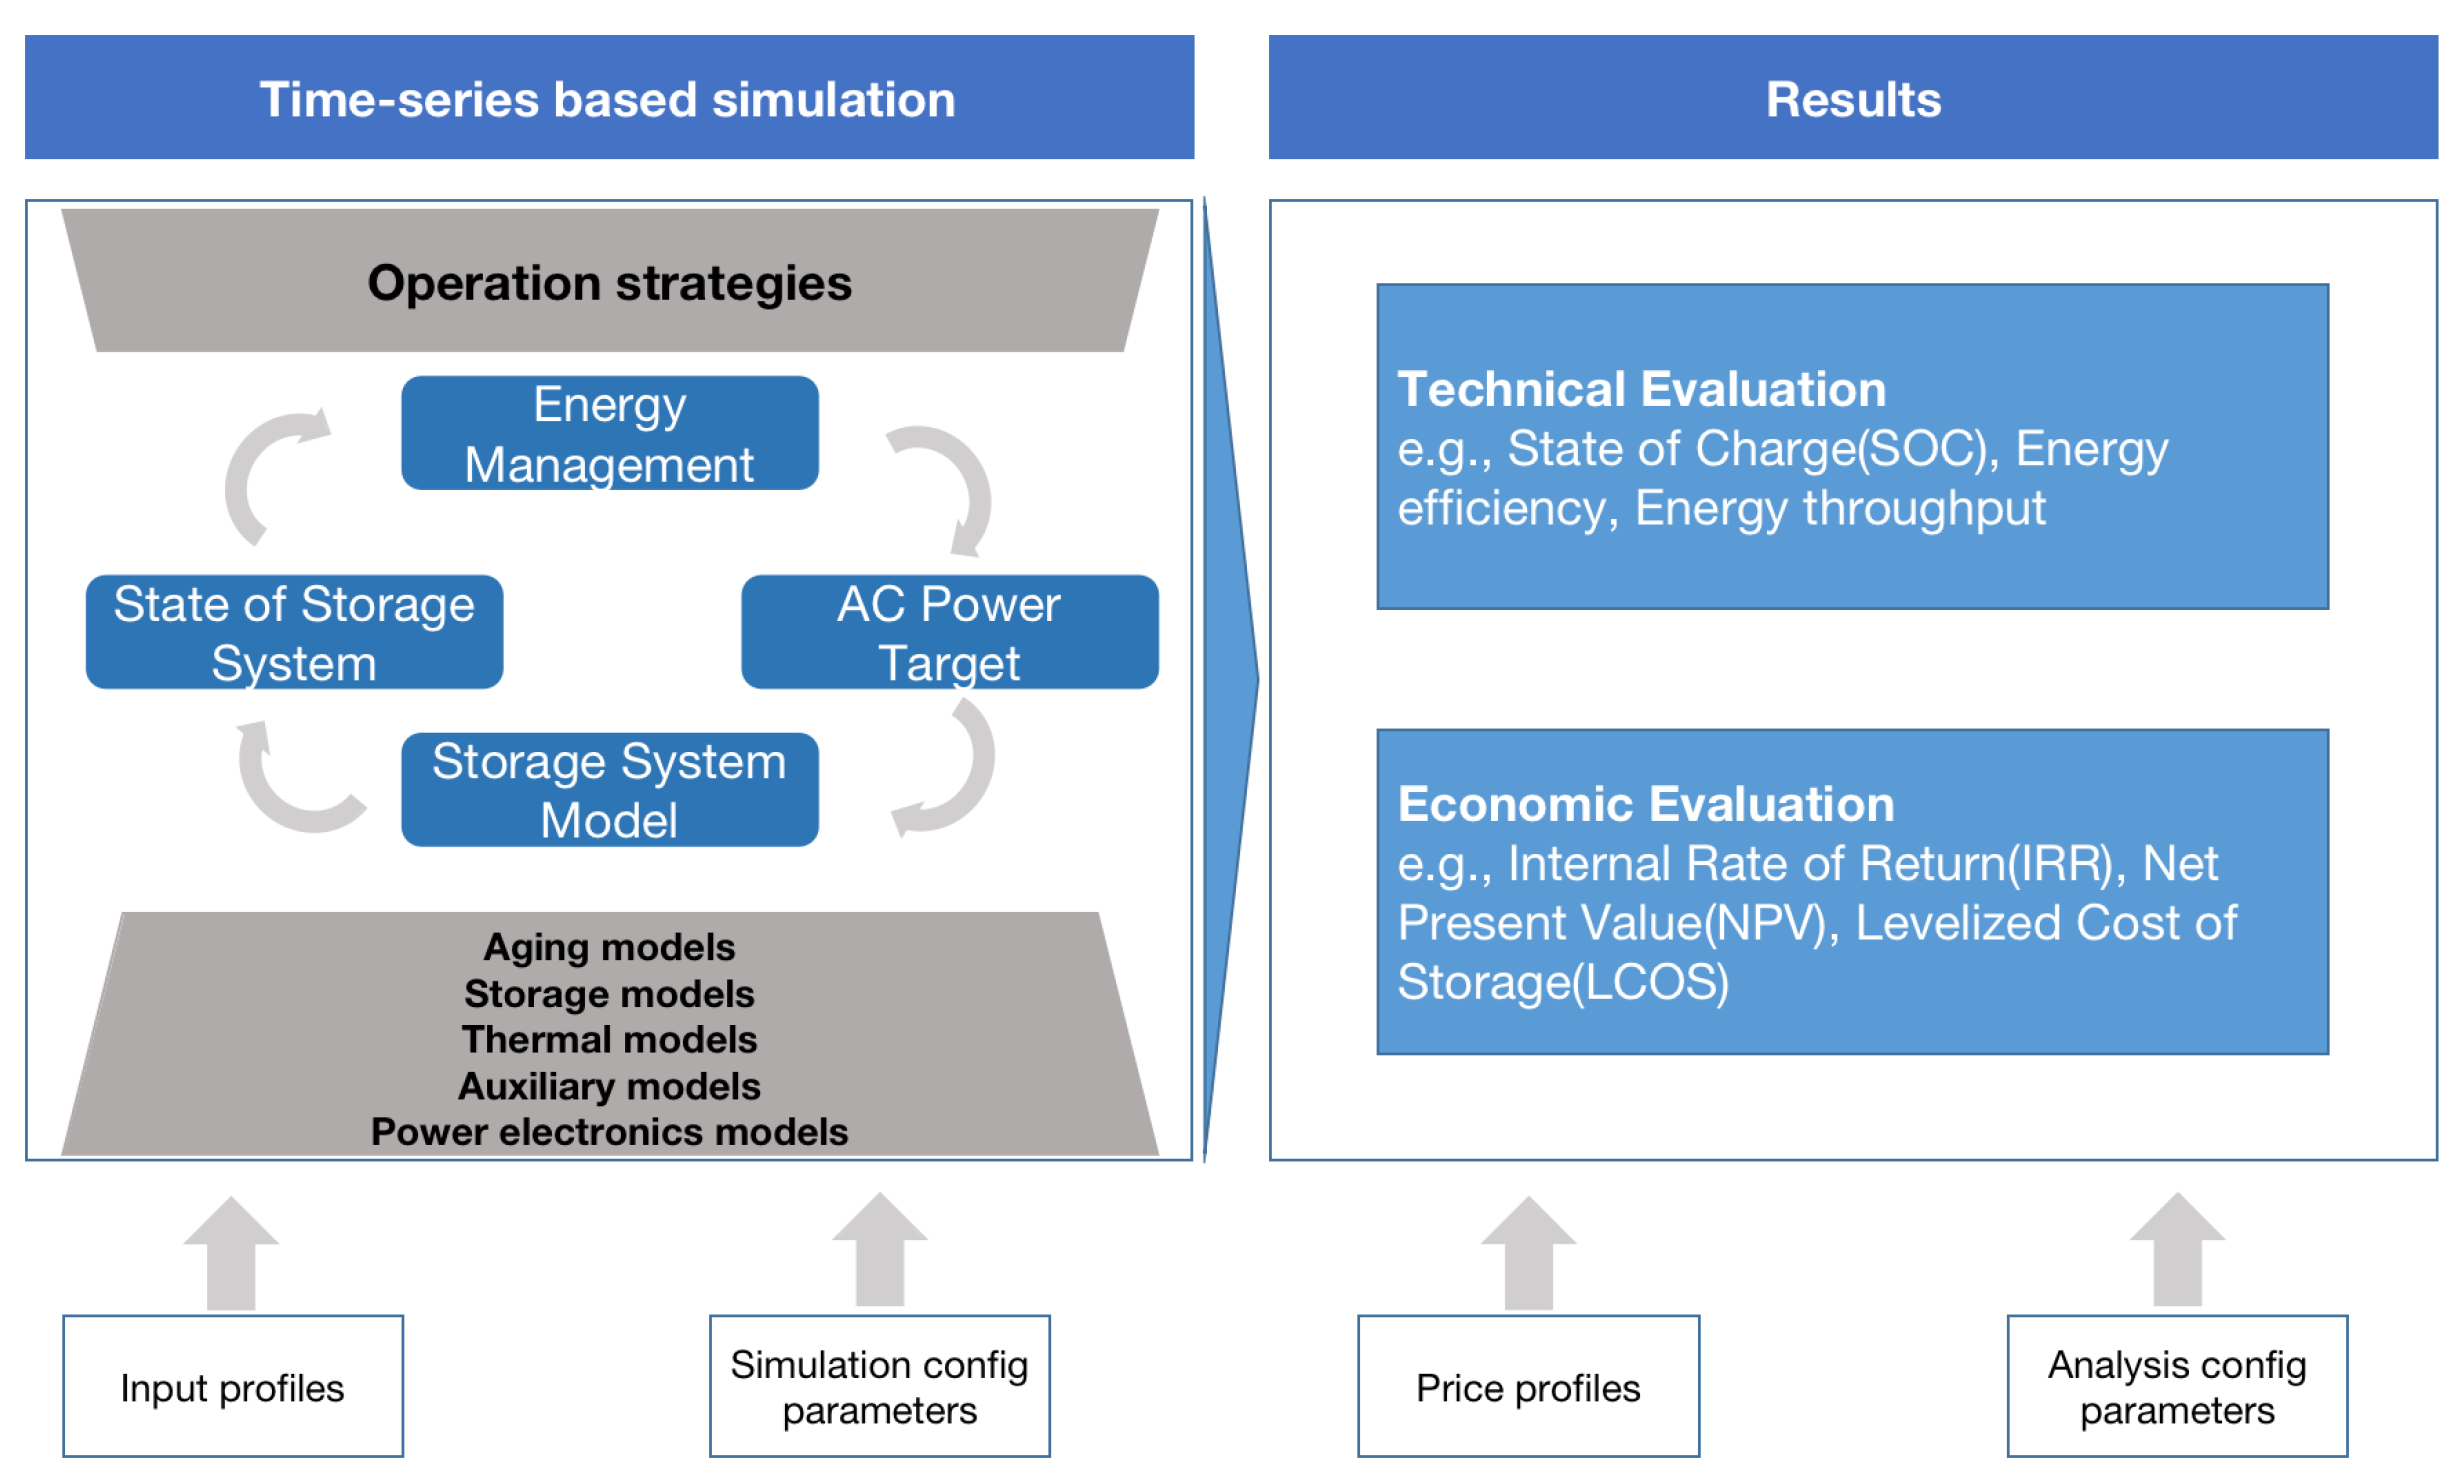
Simulation of Stationary Energy Storage Systems (SimSES), an open-sourced framework, was modified and used in this study, considering the wide range of available battery technologies used in grid applications [27]. Figure 2 shows an illustration of the simulation and analysis models for SimSES. It provides a variety of topologies, system elements, and storage technologies embedded in an energy storage application in a modular way.
For specific use in system imbalance management and application, SimSES is modified to accept system imbalance volume and imbalance price, both for charging the battery during system long and discharging during system short.

3.2. Battery Technology Selection

3.2.1. Lithium-Iron Battery

As SimSES offers varieties of cell-specific degradation models as a single-cell Equivalent Circuit Model (ECM) to represent electrical activity [27], LFP behavior modeling was used, due to its obvious advantages in grid applications. The electrical behavior of a cell type that provides terminal voltage according to operational input data was described, using the ECM. The Battery Management System (BMS) kept track of the current values and the cell operation circumstances. The parameters of the LFP battery model were as described in [27].

3.2.2. Redox-Flow Battery

The RFB model was also selected from the SimSES library. It consisted of the electrolyte system, the control system, the ECM, the degradation model and pumps, and the pump control algorithm. The RFB model also incorporated a capacity degradation model that accounted for capacity losses brought on by hydrogen evolution [27]. The parameters of the RFB model were as described in [27].

3.3. Description of the Data Sources and Variables Used in the Analysis

The imbalance data consisting of the imbalance volumes and imbalance prices per minute from September 2019 to September 2022 were obtained from Elia, detailing the strategic reserve energy and the balancing energy, both of which were activated, to make sure that the control region was adequately supplied [28].

3.3.1. Data Preprocessing

Before simulation, the obtained imbalance data were preprocessed in the format that matched the research purpose. Figure 3 illustrates the preprocessing flow chart of the imbalance data. SimSES then used time series regression to extrapolate the input data during simulation. The price clearance was taken at three intervals: 1 min, 5 min, and 15 min.
The preprocessing steps of the imbalance data were as follows:
To evaluate the advantages of the battery system across three distinct intervals, price settlements were conducted at the conclusion of each interval period. The challenge lay in forecasting the optimal threshold and settlement intervals that would maximize the benefits for the battery storage, especially in determining the type of storage most appropriate for addressing system imbalances. This complexity underscored the importance of conducting a profitability analysis. It was essential for the storage system to initiate charging or discharging at the start of each interval and to undergo settlement at the interval’s end.
Furthermore, a 100 MW threshold for the imbalance volume was set, to trigger the charge or discharge when the imbalance deviation reached 100 MW in either direction (positive or negative). As soon as the power at the point of common coupling was above the specified threshold, the additionally required power was provided by the BESS [1]. For the time the imbalance volumes did not meet the threshold, the imbalance volumes and the respective imbalance prices were both set to 0 by the controller. The preprocessed interval-based imbalance data at the given threshold were transformed into profiles with a resolution of one second. This was to ensure that the profiles were able to capture the aging mechanism in SimSES. Positive imbalances resulted in costs (sometimes revenue during negative pricing), while negative imbalances generated revenue. To obtain an approximate view of the three cases, the mean values of the imbalance prices for positive and negative imbalance volumes are shown in Table 1.
The potential average price for charging and discharging of the BESS over a 3-year period can be seen in Table 1. The table appears to indicate that a 5 min interval gives a better discharging revenue indication while the 1 min interval gives a better charging cost indication. In reality, a number of variables, including the availability of reserves, the cost of fuel, the carbon cost, and the system’s overall level of demand, can affect the imbalance prices [29]. However, the imbalance price for negative imbalance volumes is generally more likely to be positive, as this gives producers or consumers the necessary motivation to activate their BESS, to make up for the shortage in energy delivery.

3.3.2. Variables Used in the Analysis

Due to a wide range of technology costs, as well as different system sizes and designs, it is difficult to calculate the energy-specific costs for a BESS. Tsiropoulos et al. [30] used the energy–power ratio (EPR) as an indicator, to distinguish between power and energy system design. System cost curves based on the EPR were assumed for the LFP and RFB systems in the case study, and the prices and ratios provided are represented by regression curves in Equations (1) and (2) [27]:
c L F P = 80 · l n ( E P R ) + 473
c R F B = 208 · l n ( E P R ) + 786 ,
where c is the energy specific costs for LFP and RFB, respectively. The simulation parameters are shown in Figure 4 and in Table 2.

3.4. Description of the Performance Metrics for Comparing the Batteries in Different Market Intervals

3.4.1. Technical Performance Metrics

To evaluate the results and to make a comparison between each time interval and the two battery technologies, several key performance metrics for technical and economic outputs were examined. The technical performance metrics were determined at the system and storage technology level in the SimSES’ Technical Assessment section. The relevant metrics were exported at the conclusion of the analysis, depending on the storage technology selected [27]. The technical evaluation’s metric on the technologies are listed as follows:
a.
Energy Efficiency (%):
This metric quantifies the ratio of energy output to energy input of the storage system, usually expressed as a percentage. It evaluates the system’s ability to convert input energy into usable electrical energy while accounting for losses during charge–discharge cycles;
b.
Mean State of Charge (SOC in %): This represents the average charge level in the battery system over a defined time frame, expressed as a percentage of the battery’s total capacity. It offers insights into the average utilization of the battery.
c.
Number of Sign Changes (per day): This count reflects the frequency with which the battery system alternates between charging and discharging modes daily. It is indicative of the system’s operational dynamism.
d.
Degradation (%): This metric denotes the decline in storage capacity over time, typically presented as a percentage. It is a critical factor for assessing the battery system’s durability and performance deterioration.
e.
Energy Throughput (MWh): This measures the total volume of energy processed through the battery system during its lifetime. It is pivotal for evaluating the system’s operational intensity and workload.
f.
Equivalent Full Cycles (cycles): This metric refers to the count of complete charge–discharge cycles that the battery system is capable of performing, normalized to its total capacity. It aids in comparing the cycling endurance of various battery technologies.
g.
Average Length of Resting Times (minutes): This metric computes the average duration between charge and discharge cycles when the battery is in a dormant state. It provides insights into the system’s operational pattern and standby efficiency.
h.
Fulfillment Factor (%): This factor denotes the ratio of actual output power to the target power, expressed as a percentage. It serves as an indicator of the system’s reliability and its proficiency in meeting energy demands.

3.4.2. Economic Performance Metrics

a.
Net Present Value (NPV in €): The NPV is a sophisticated economic valuation method that entails discounting the sum of all future cash flows, both inflow and outflow, emanating from the project, using a predetermined discount rate. The NPV is given by Equation (3):
N P V = I n v e s t m e n t c o s t + n = 1 N F u t u r e c a s h f l o w n ( 1 + D i s c o u n t r a t e ) n .
n and N, respectively, stand for the current and overall project years [27].
b.
Internal Rate of Return (IRR in %): The IRR represents the rate at which a project becomes profitable. It is a measure of the real return generated by the project’s cash flows, and it is considered a wise investment if the IRR is higher than the hurdle rate. The IRR is calculated using Equation (4):
n = 0 N F u t u r e c a s h f l o w n ( 1 + I n t e r n a l R a t e o f R e t u r n ) n = 0 .
c.
Profitability Index (PI): The PI is the ratio of discounted benefits to discounted costs. It is a useful tool for ranking projects, with a PI of 1.0 being the theoretical minimum. The PI is shown in Equation (5):
P r o f i t a b i l i t y i n d e x = n = 0 N F u t u r e c a s h f l o w n I n v e s t m e n t c o s t .
d.
Return on Investment (ROI): The ROI is a metric used to evaluate the profitability of an investment or to compare the profitability of different investments. It is calculated as shown in Equation (6):
R e t u r n o n I n v e s t m e n t = N e t p r o f i t I n v e s t m e n t c o s t .
e.
Levelized Cost of Storage (LCOS in €/MWh): LCOS measures the discounted cost per unit of discharged power, taking into account all technical and financial factors. It is analogous to LCOE for generation technologies and is calculated using Equation (7):
L e v e l i z e d C o s t o f S t o r a g e = I n v e s t m e n t c o s t D i s c h a r g e d e l e c t r i c a l e n e r g y .

3.5. Description of the Battery Models Used in the Study

The formulated problem aimed to investigate the technical and economic results of BESSs, in terms of flexibility in managing imbalance, adherence to technical battery constraints, and compliance with electricity market regulations. Battery degradation and real world imbalance data were taken into account. The assumed project lifetime for the systems was ten years. The parameters of both the technologies were as listed in Table 2 and Figure 4. The imbalance data, encompassing both imbalance volumes and imbalance prices, was provided in CSV spreadsheet format and served as parameterized inputs for the analysis. These data were read and processed by SimSES, to conduct the comprehensive analysis.

4. Results and Discussions

4.1. Technical Results

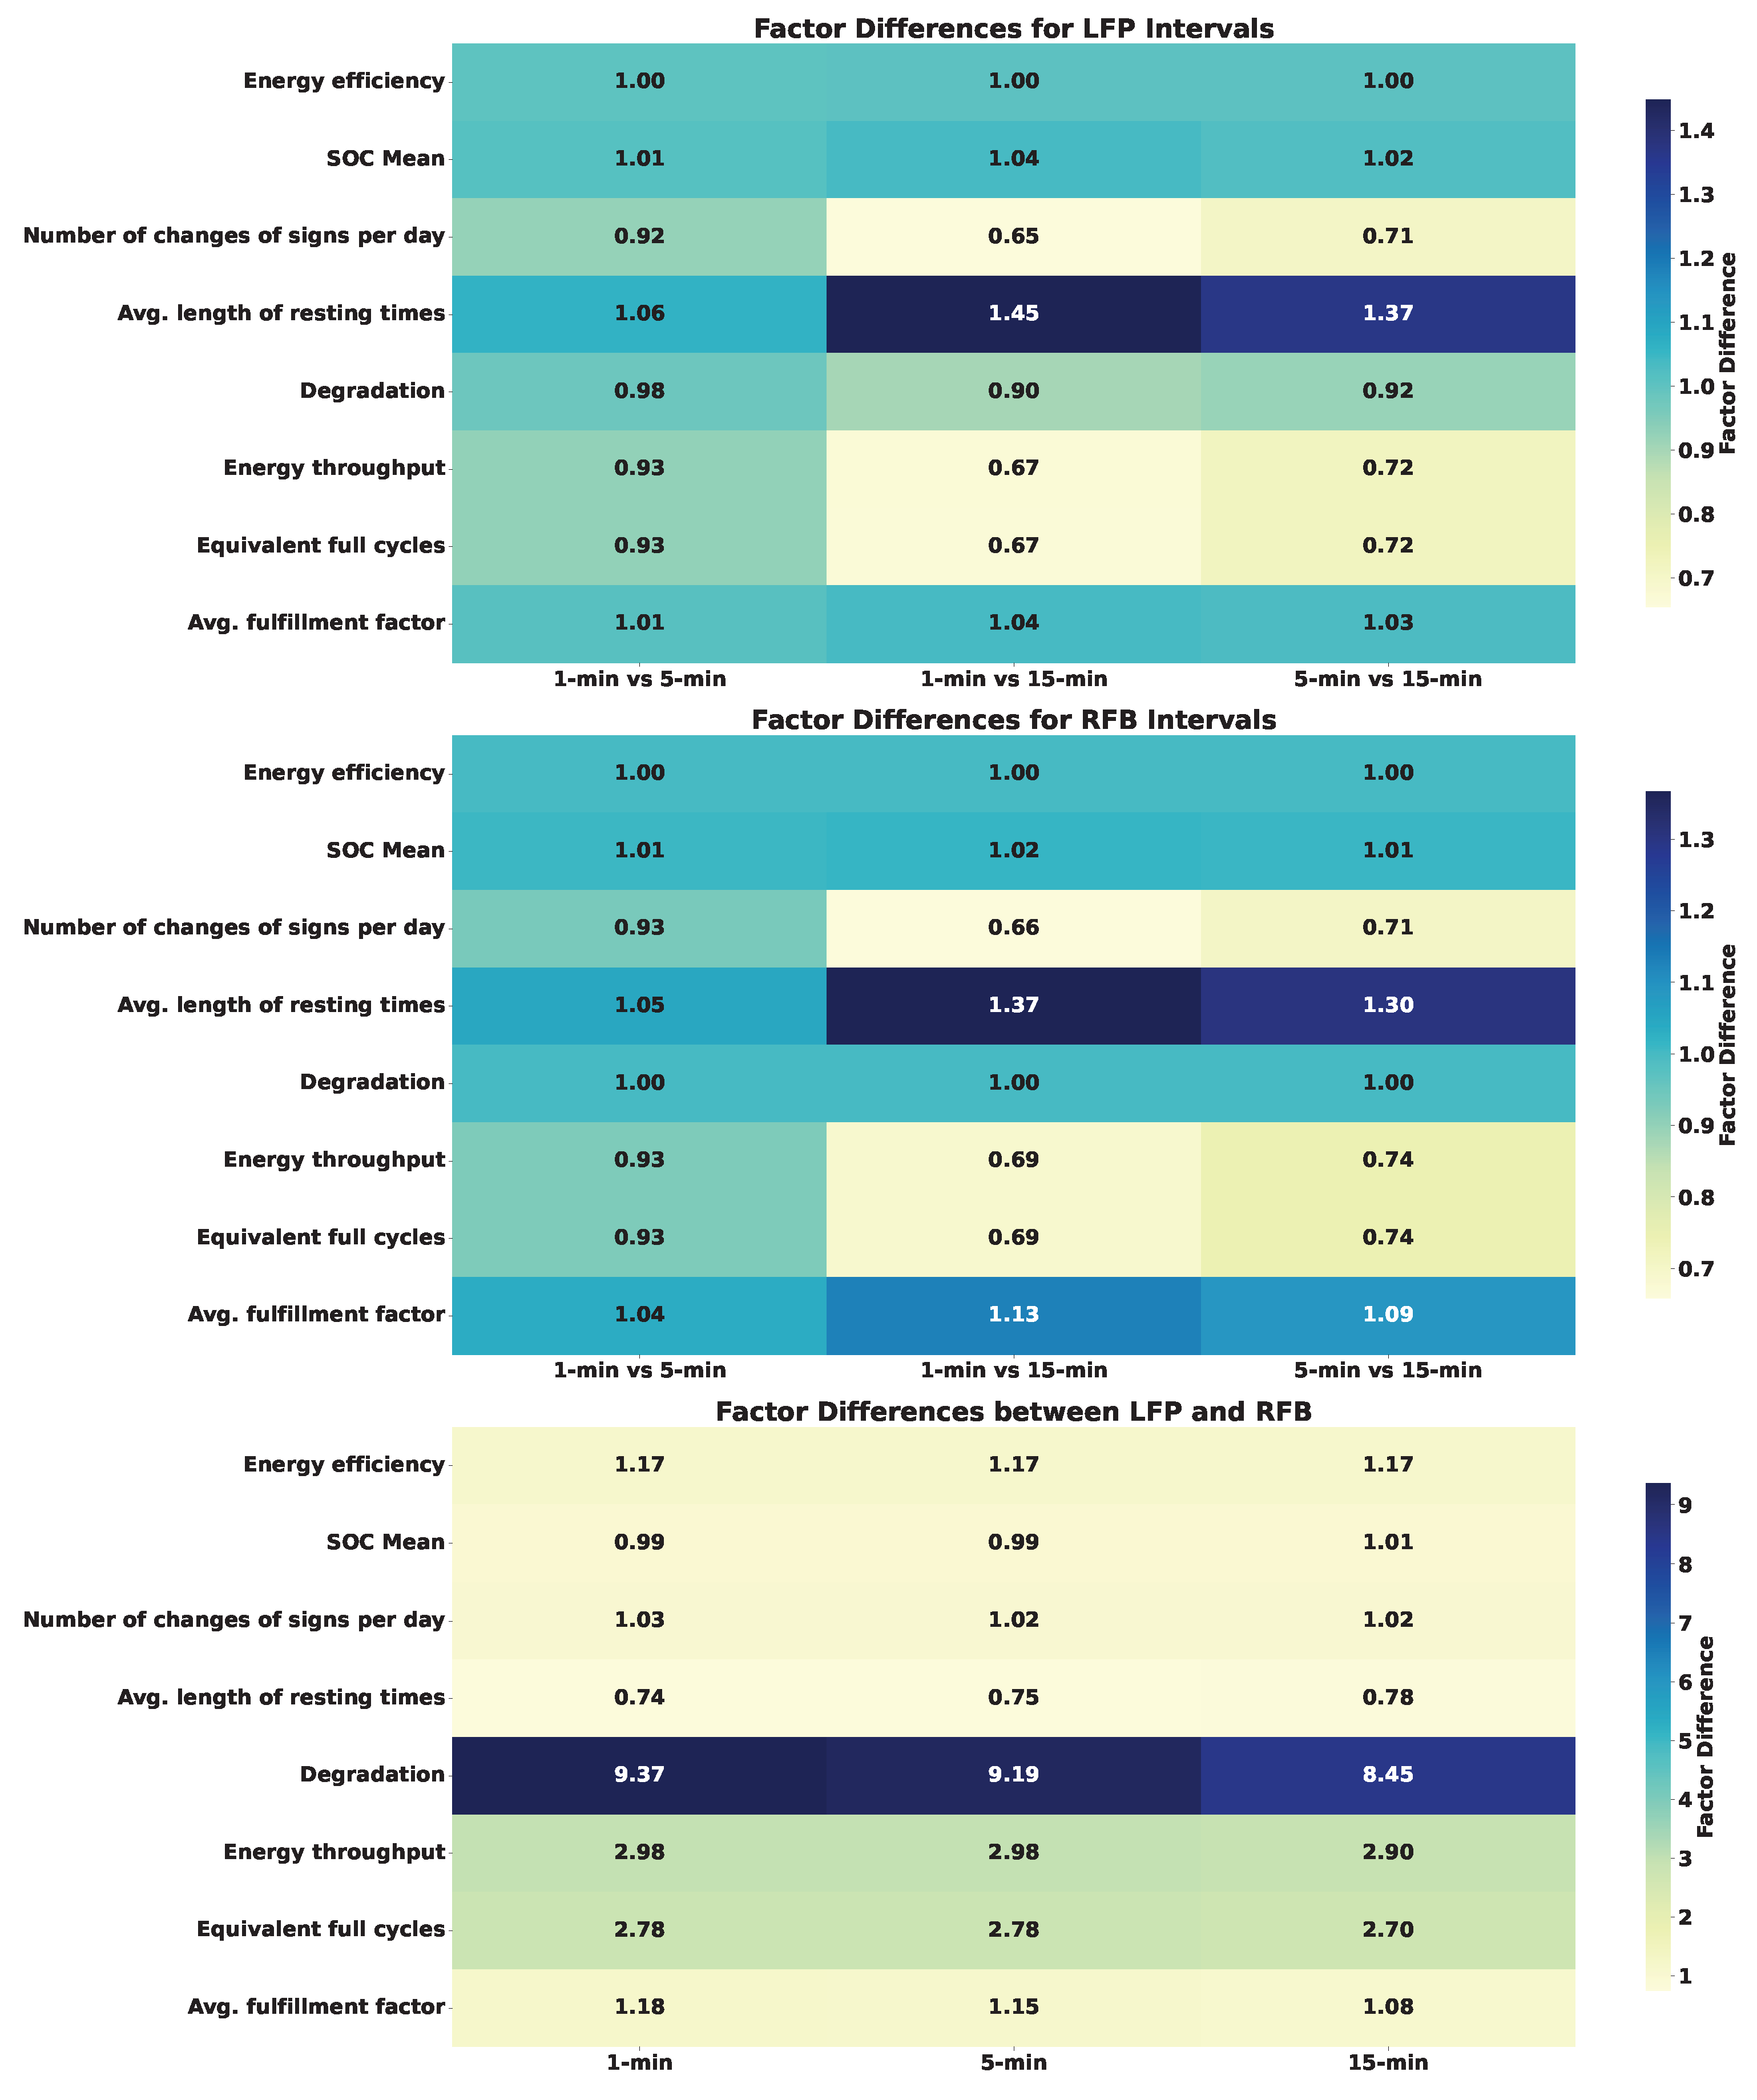
The results presented in this study draw a comprehensive comparison between Lithium-Iron-Phosphate (LFP) and Redox-Flow Batteries (RFB), based on their performance metrics across three different intervals after 10 years: 1 min, 5 min, and 15 min. The combined bar plots (Figure 5) provide a clear representation of this comparative performance while the heatmap (Figure 6) represents the comparative performance in terms of factor difference.

4.2. Comparative Analysis of LFP and RFB Batteries

(i)
Energy Efficiency and State of Charge: Energy efficiency in the LFP batteries remained consistently high across the intervals, with values of 91.94%, 92.02%, and 92.27% for 1 min, 5 min, and 15 min intervals, respectively (Figure 5). This marginal increase suggests that LFP batteries maintain their efficiency even with less frequent cycling. The RFB batteries exhibited a slight decrease in efficiency, from 78.83% at the 1 min interval to 78.77% at the 15 min interval. The SOC mean for both battery types increased with the interval length, indicating a more balanced state of charge during longer intervals, with LFP showing a notable increase, from 51.1% to 52.93%.
(ii)
Cycling Frequency and Resting Times: The number of changes of signs per day, indicative of cycling frequency, decreased for both LFP and RFB as the interval lengthened (Figure 5). This reduction was more pronounced in the LFP batteries, suggesting a more significant impact of interval length on their cycling behavior. Correspondingly, the average length of resting times increased with the interval for both battery types, with the RFB batteries showing longer resting times overall, increasing from 70.24 min to 96.04 min (Figure 6). This could be advantageous for RFBs, as prolonged resting times may contribute to reduced wear and extended battery life.
(iii)
Degradation and Energy Throughput: Annual degradation, a critical factor in battery life expectancy, was significantly lower in the RFB batteries across all intervals, maintaining a consistent rate of 0.2% (Figure 5). Despite higher energy throughput in the LFP batteries, their higher annual degradation rates, ranging from 1.69% to 1.874%, may lead to shorter lifespans. The annual energy throughput and equivalent full cycles decreased with increasing interval length for both battery types, indicating a trade-off between cycling frequency and throughput.
(iv)
Fulfillment Factor: The average fulfillment factor increased with the interval length for both the LFP and the RFB batteries (Figure 5). This suggests that both battery types became more efficient at responding to system imbalance changes during longer intervals, with LFP showing a notable increase, from 93.35% to 96.91%.
(v)
Interval- and Chemistry-Wise Comparison: At the shortest interval, the LFP batteries outperformed the RFBs in energy throughput and equivalent full cycles, indicating a robust response to rapid grid fluctuations. However, the RFBs exhibited lower degradation rate, which could be beneficial for long-term applications. As the interval increased, the differences in energy throughput between the LFP and RFB batteries narrowed (Figure 7). At the longest interval, the LFP batteries continued to show higher energy throughput and equivalent cycles, but the gap between the two battery types diminished further. The SOC mean and fulfillment factor for the LFPs peaked at this interval, reflecting an optimal balance between cycling and efficiency.
(vi)
Overall Insights and Heatmap Visualization: The LFP batteries demonstrated higher energy throughput and cycling rates, making them well-suited to applications requiring rapid response and high power output. Conversely, the RFB batteries, with their lower degradation rates and longer resting times, could be more suitable for applications prioritizing longevity and stability over immediate power delivery. The heatmap visualization in Figure 6 clarifies the factor differences between the LFP and RFB batteries across the three intervals. For the LFP batteries, the factor difference between the 1 min and 5 min intervals was minimal across most metrics, suggesting that LFP batteries respond similarly to short-term cycling changes. However, the factor difference between the 1 min and 15 min intervals was more pronounced, particularly in the `Number of changes of signs per day’ and `Equivalent full cycles’ metrics, highlighting the impact of longer intervals on cycling frequency and throughput. The RFB batteries showed a consistent factor difference across intervals, with a notable increase in ’Average length of resting times’ from the 5 min to the 15 min interval. This suggests that RFB batteries benefit from longer resting periods, which could contribute to their lower degradation rates. When comparing LFP and RFB directly, the heatmap revealed that the LFP batteries had a higher factor difference in `Energy throughput’ and `Equivalent full cycles’ at shorter intervals. This reinforces the notion that LFP batteries are more adept at handling frequent cycling and delivering high power. By contrast, the RFB batteries exhibited a higher factor difference in `Degradation’ and `Average length of resting times’, emphasizing their stability and potential for longer service life.
The trends illustrated in Figure 7 further underscore the distinct downward trajectory for both Annual Equivalent Full Cycles and Annual Energy Throughput as the market interval increased, a pattern consistent for both the LFP and the RFB batteries. These observed trends suggest that both battery types experience less frequent charging and discharging cycles as the settlement interval increases, which could lead to reduced strain on the batteries and potentially longer lifespans for the storage systems.

4.3. Economic Results

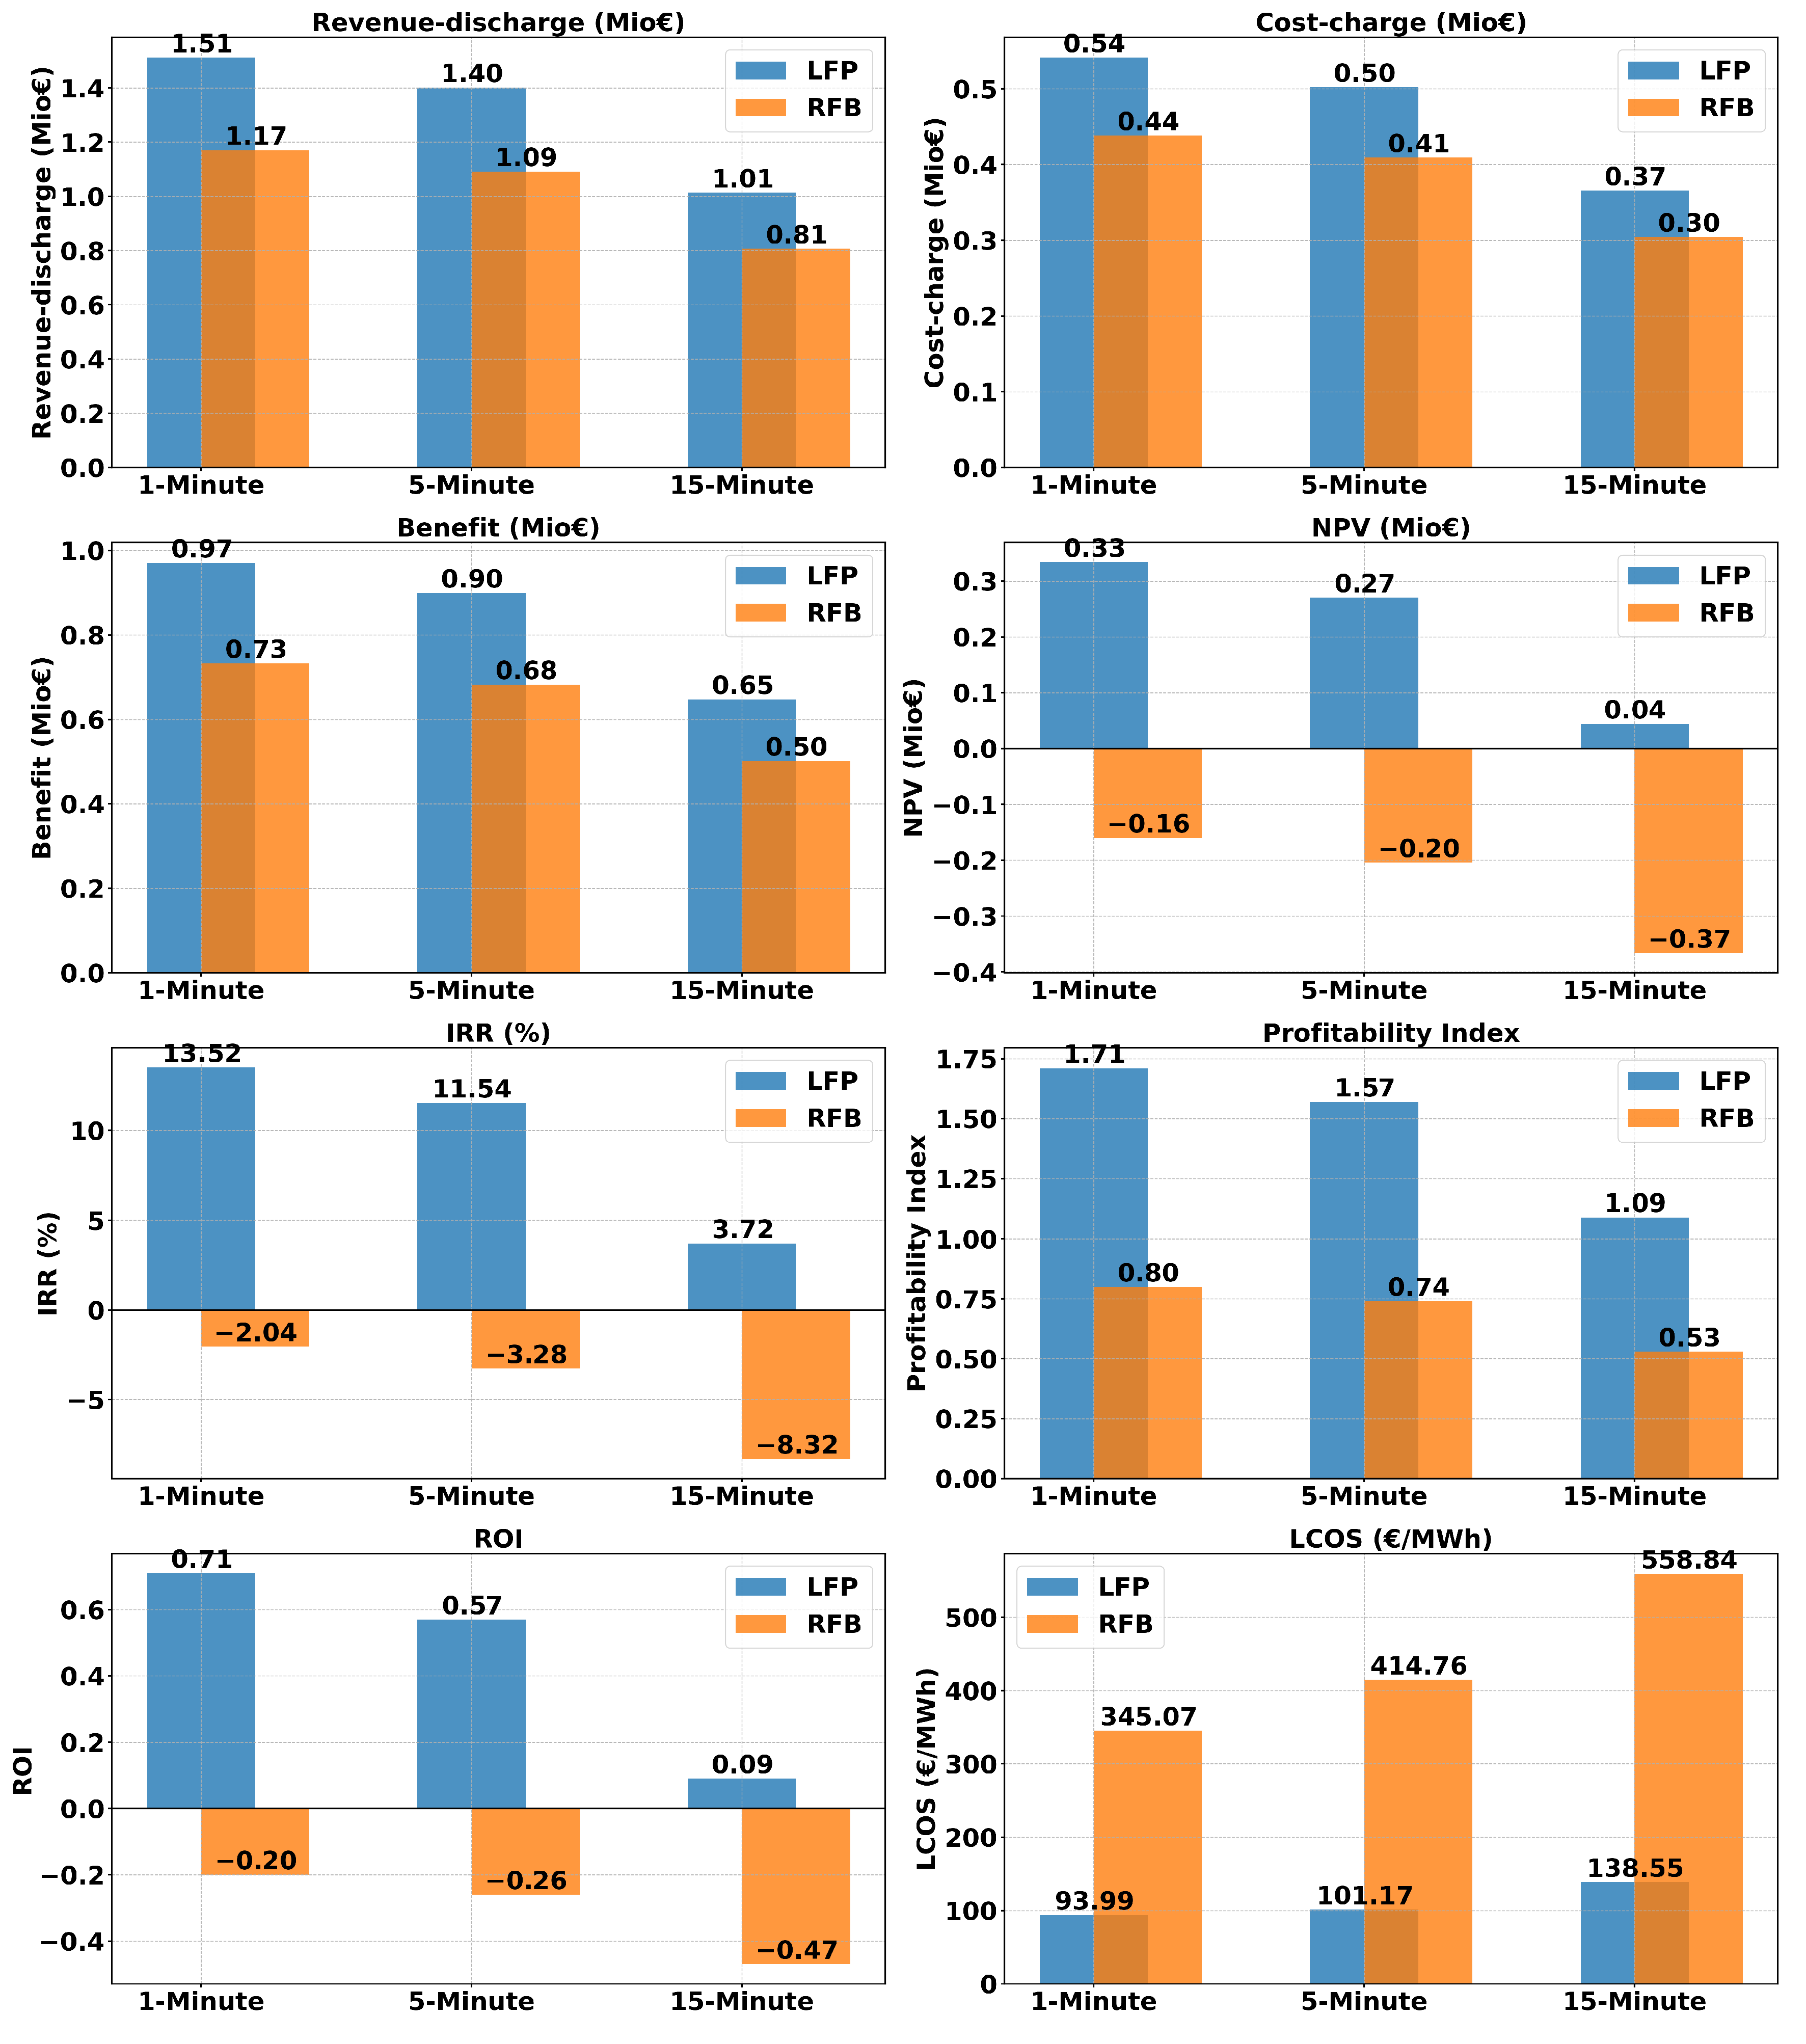
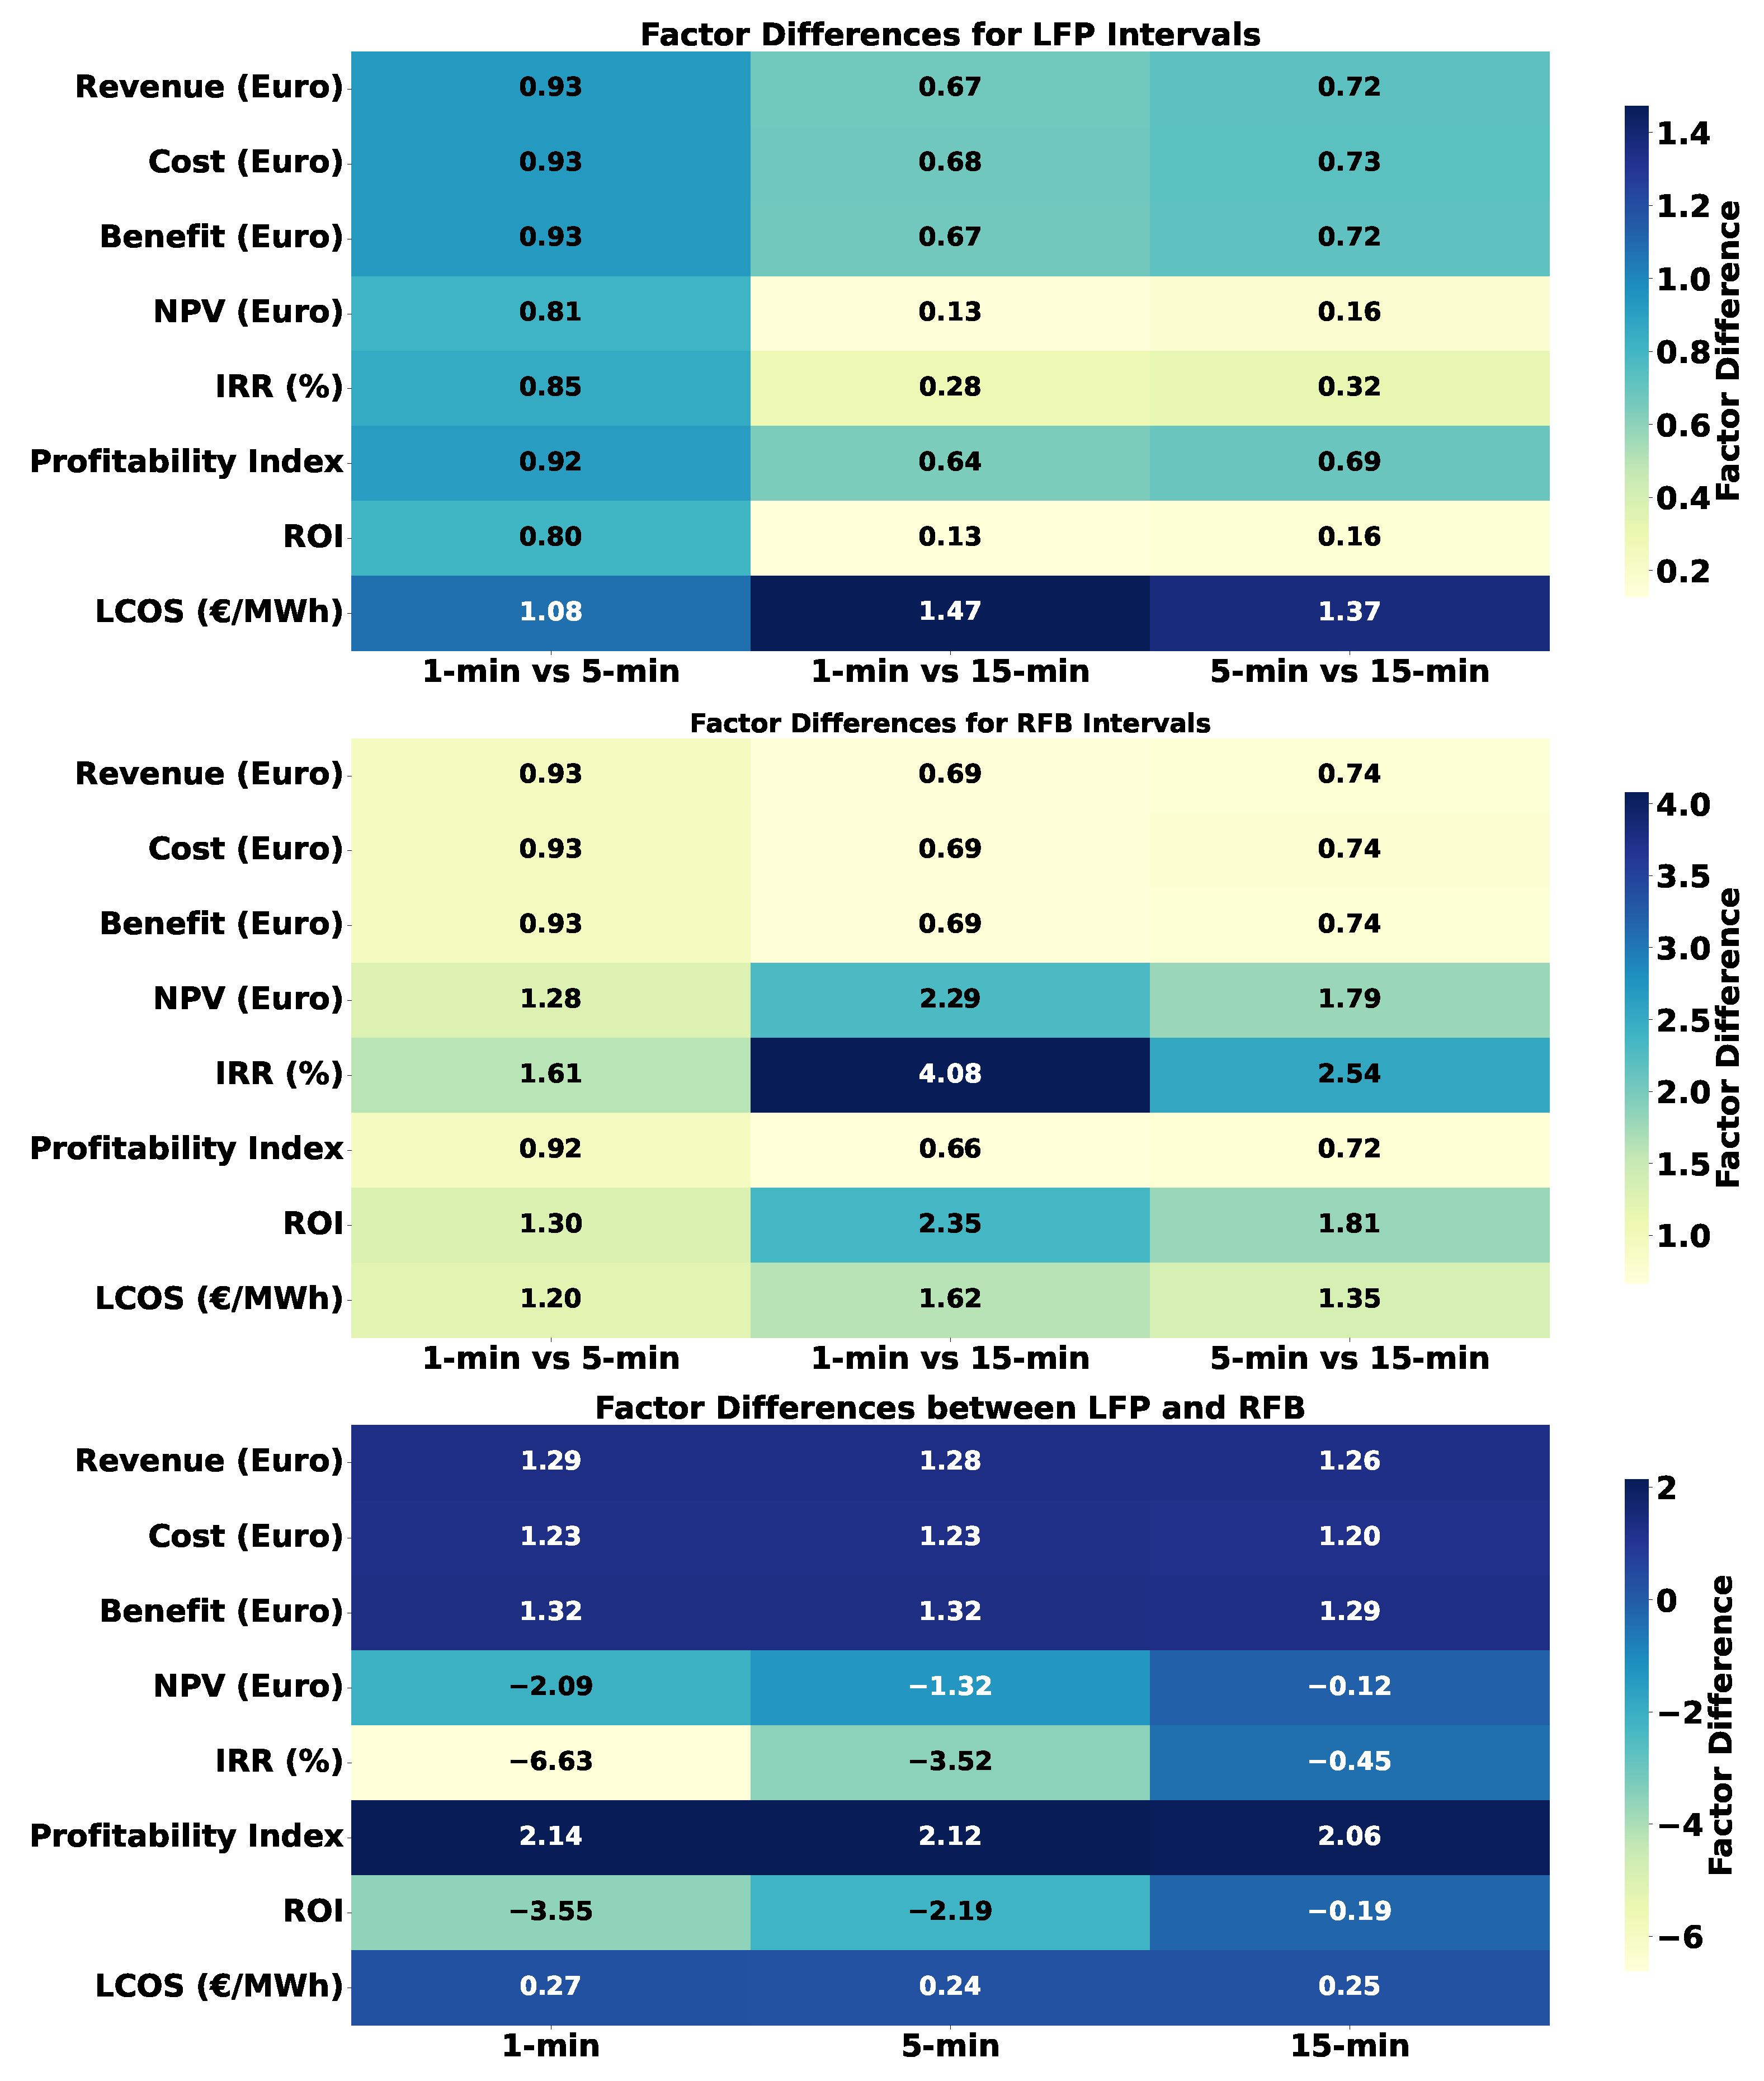
The economic assessment conducted over a 10-year horizon revealed distinct trends and variances between LFP and RFB across the three market intervals of 1 min, 5 min, and 15 min. The economic performance and factor difference analysis are visually depicted in Figure 8 and Figure 9, respectively.
(i)
Revenue, Cost, and Benefit Analysis: As illustrated in Figure 8, the LFP batteries consistently outperformed RFB, in terms of revenue, cost, and benefit across all market intervals. Notably, in the 1 min interval, LFP demonstrated a considerable economic advantage, with a revenue of €1.51 million compared to €1.17 million for RFB.
(ii)
Investment Viability Metrics: Figure 8 also describes the NPV and IRR for both battery types. The LFP batteries exhibited a positive NPV in all intervals, peaking at €334,043.2 in the 1 min interval. Conversely, the RFB batteries showed negative NPV values, suggesting unfavorable investment prospects.
(iii)
Profitability index and ROI: The Profitability Index and Return on Investment for LFP were positive across all intervals, with a peak ROI of 0.71 in the 1 min interval. By contrast, RFB manifested negative ROI values, indicating a less favorable economic outcome.
(iv)
Levelized Cost of Storage: LFP maintained a lower LCOS across all intervals, signifying cost effectiveness. In the 1 min interval, the LCOS for LFP was €93.99/MWh compared to €345.07/MWh for RFB.
(v)
Factor Difference Analysis: The heatmap presented in Figure 9 highlights the factor differences between the two battery technologies across different intervals. LFP demonstrated a more stable economic performance relative to RFB.
(vi)
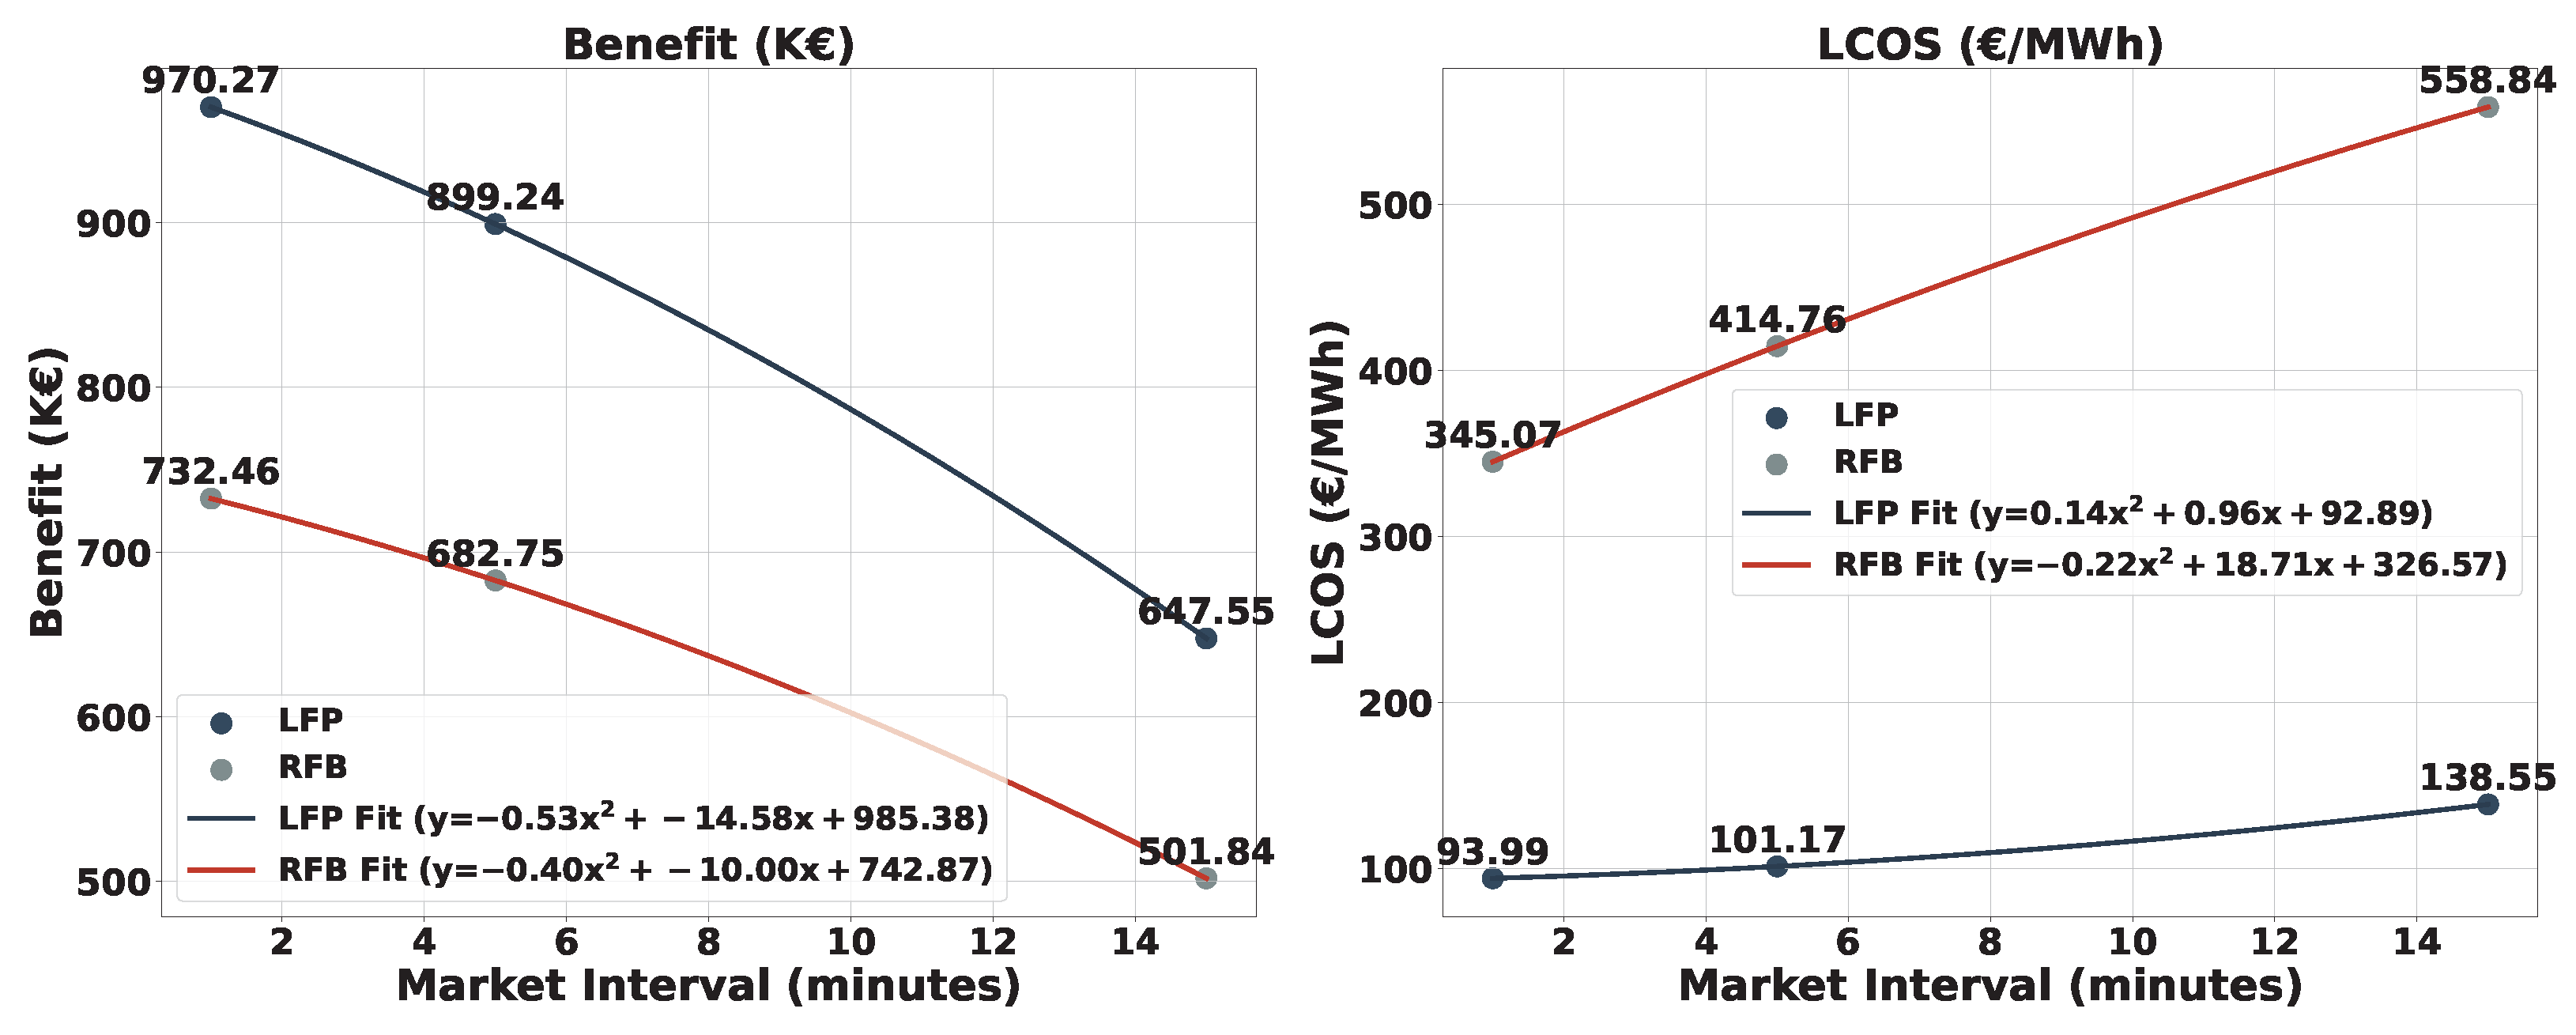
Trend Analysis of Benefit and LCOS (Figure 10): The polynomial trend lines exhibited a decrease in benefits and an increase in LCOS as the interval lengthened for both battery types. Specifically, the polynomial fit for LFP was given by y LFP = a LFP x 2 + b LFP x + c LFP and for RFB by y RFB = a RFB x 2 + b RFB x + c RFB , where a LFP , b LFP , c LFP , a RFB , b RFB , and c RFB were the respective coefficients derived from the polynomial fit. These trends underscore the economic challenges posed by RFB, particularly in longer market intervals.
The economic analysis provides a comprehensive view of the comparative advantages and challenges associated with LFP and RFB technologies. LFP batteries emerge as a more economically viable and cost-effective solution for grid balancing management, particularly in shorter market intervals. Conversely, RFBs face economic hurdles, as evidenced by their negative NPV and ROI values, especially in longer intervals. This study’s insights are crucial for stakeholders, when making informed decisions regarding battery storage technology selections for electricity market balancing.

4.4. LFP–RFB Techno-Economic Analysis Summary

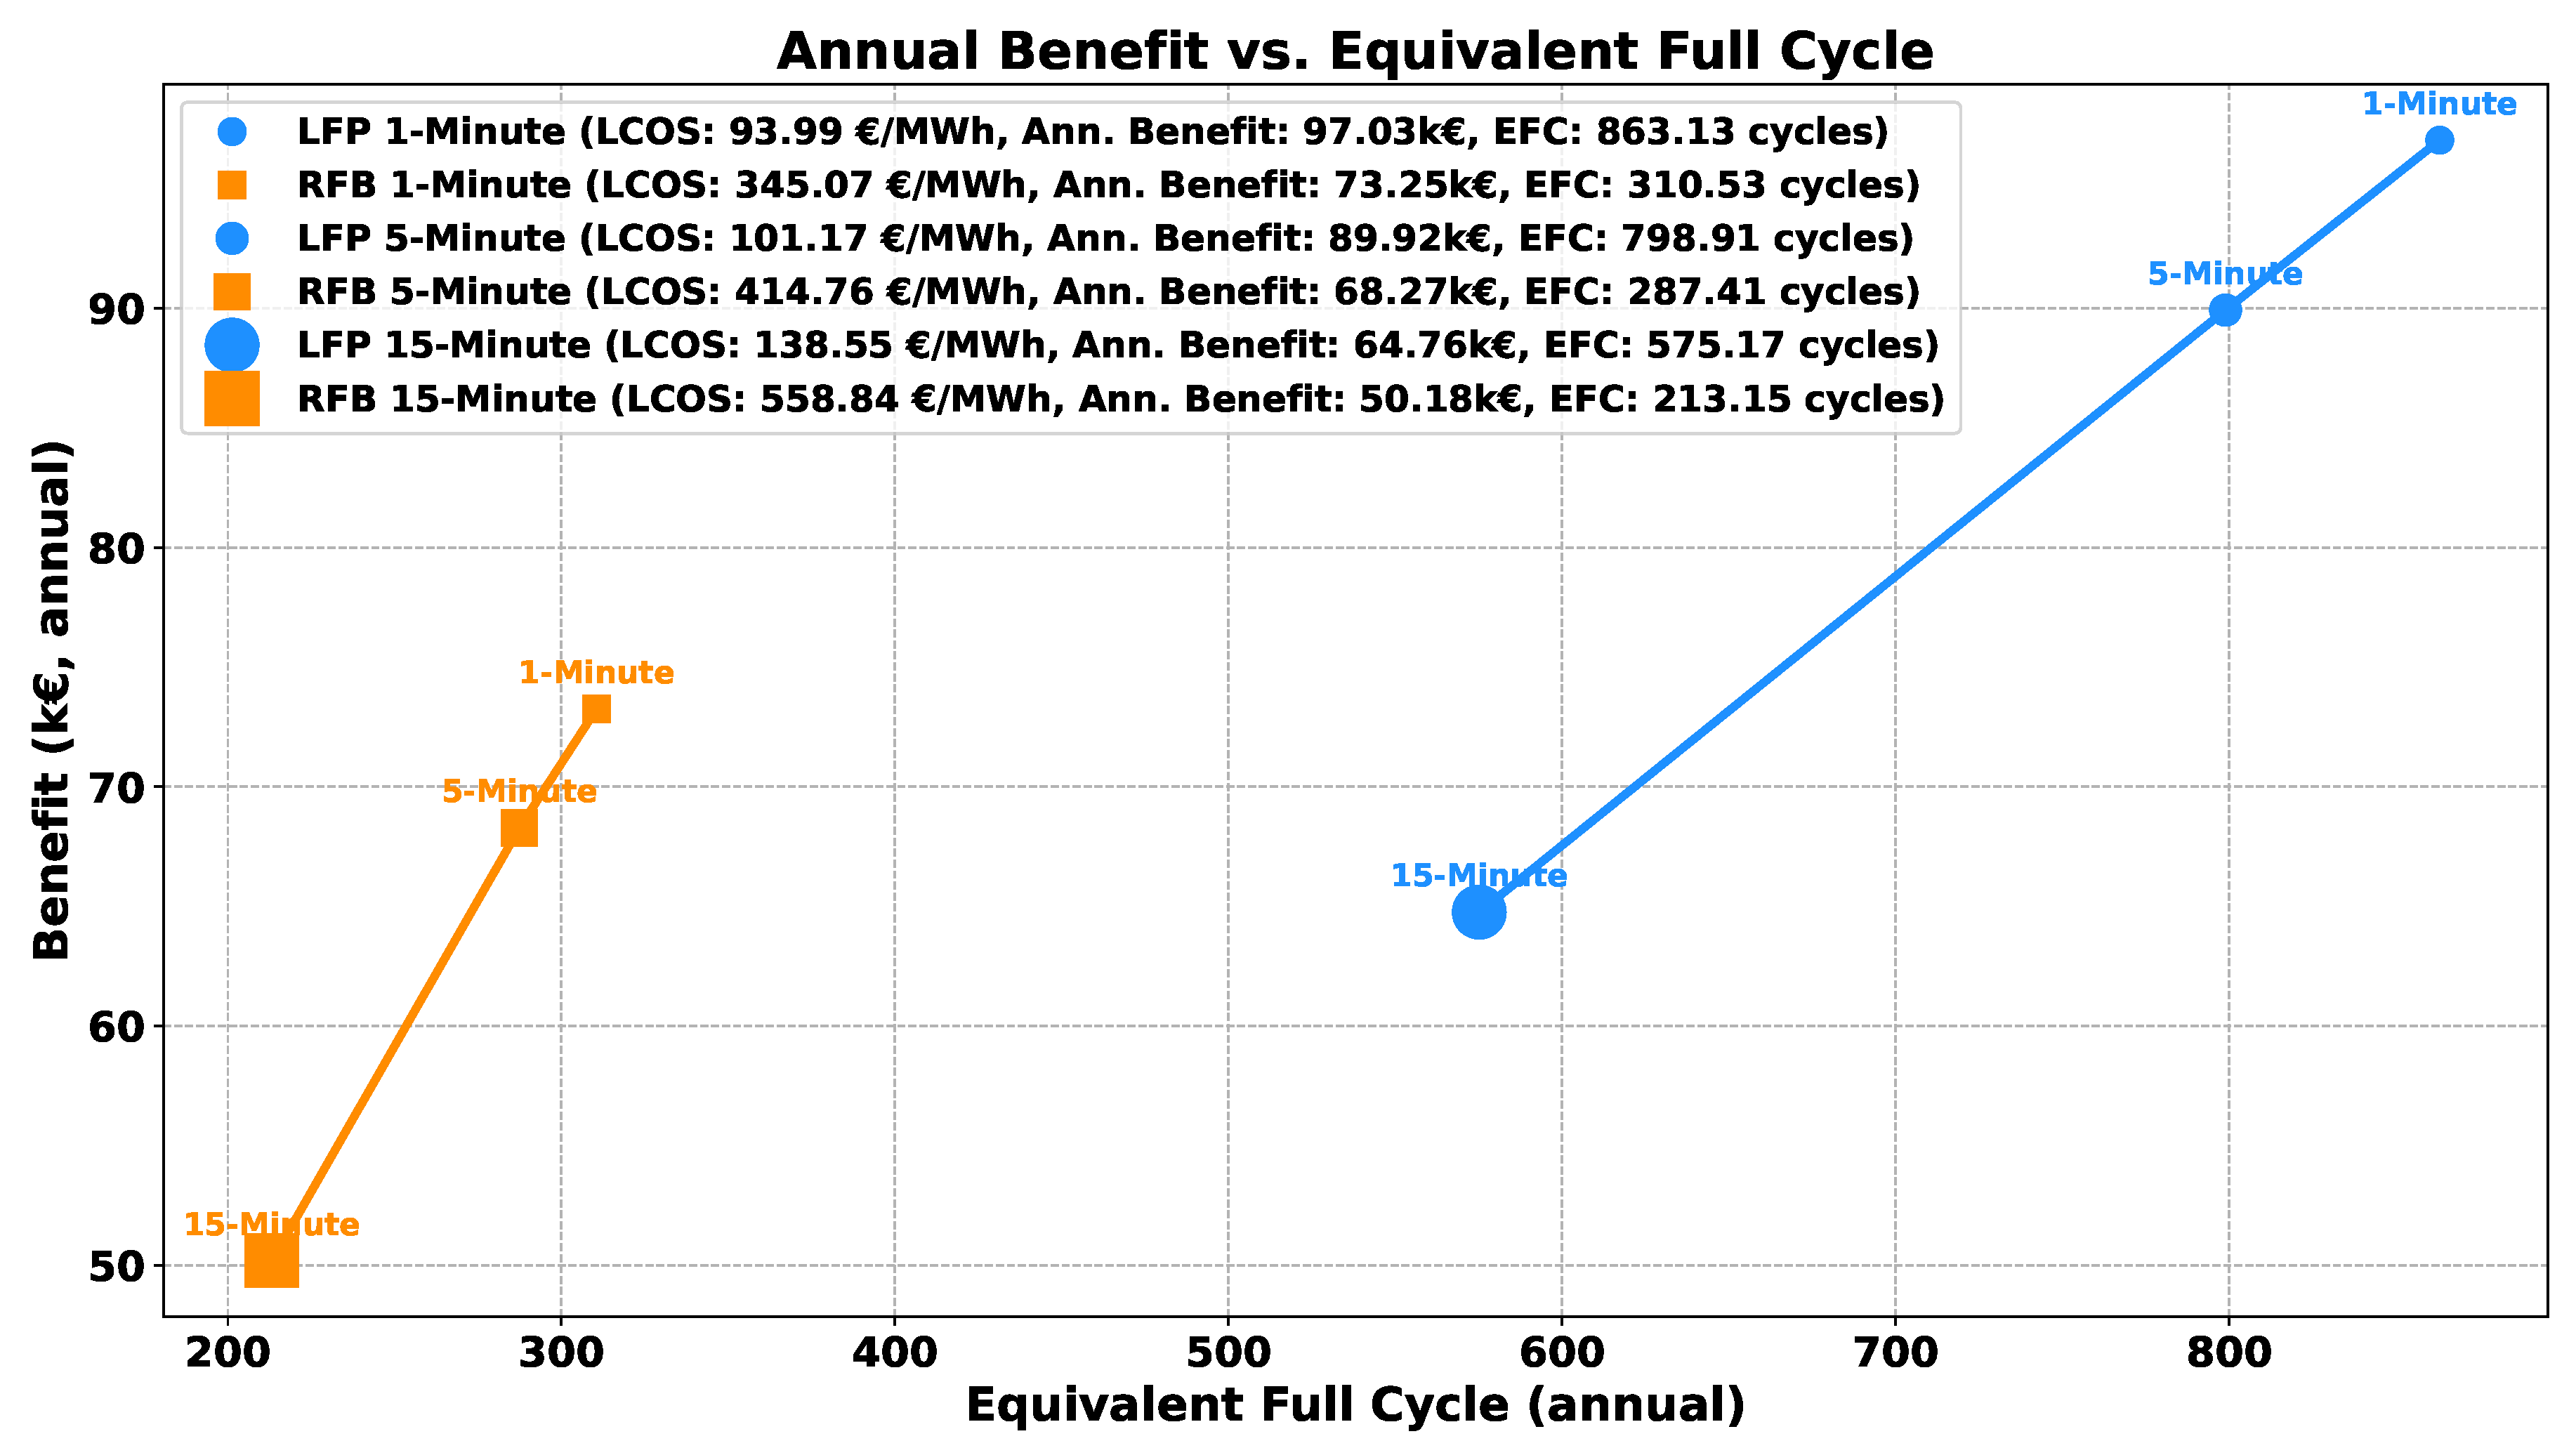
Both LFP and RFB have similar tendencies with respect to economic metrics as interval changes. These metrics decrease with the growth of the interval length, except LCOS, which is positively correlated to the increasing of the market interval. The shorter the market interval, the more changes of signs and equivalent full cycles per day, and also the more energy that flows through the battery, and the more the battery discharges, as shown in Figure 11. Under the same cost and revenue unit price, the overall benefit is greater, as shown in Figure 12. From these trends, it can be inferred that in longer market intervals, LCOS may be higher and the benefit of NPV, IRR, PI, and ROI may be lower.
Overall, while LFP batteries may be more suited to scenarios demanding higher energy throughput and frequent charge–discharge cycles, RFB batteries could be a better fit for applications that require longer battery lifetimes and stability over extended periods. While LFP batteries appear to be more economically viable, especially in shorter market intervals, RFB batteries might pose certain economic challenges that need to be addressed, especially in longer settlement intervals.

5. Conclusions

In this study, we utilized imbalance volumes and prices to analyze the effectiveness of LFP and RFB batteries in reactive energy balancing. Our evaluations spanned 1 min, 5 min, and 15 min settlement intervals, focusing on 100MW power threshold deviations. The results revealed that LFP technology, particularly within the 1 min interval, offers significant operational and economic advantages. Our approach, which used a 3-year system imbalance dataset for simulations, has proven to be robust. Both the LFP and RFB batteries displayed consistent trends across the different market intervals. Such consistency reinforces the reliability of our technical and economic findings. Among the various metrics assessed, including energy throughput, NPV, ROI, PI, IRR, and LCOS, LFP consistently outperformed RFB across all intervals. An added contribution of this research is the provision of battery energy profiles for both LFP and RFB over the three intervals assessed, which are available at https://depositonce.tu-berlin.de/items/85a56aac-1154-40ec-b447-819498aa1a45. These profiles could serve as valuable references for future studies focusing on the Belgian balancing market.
Looking forward, potential areas of exploration include refining the imbalance data by accounting for both price and volume at varied thresholds. The objective would be to prolong operational lifespan while maintaining profitability. Moreover, our future work aims to investigate opportunities in the intraday market, explore day-ahead stacking, and understand the impact of integrating PV behind the meter. These investigations will further elucidate the potential of BESSs for enhancing grid balancing, both technically and economically.

Author Contributions

Conceptualization, S.O.E.; methodology, S.O.E. and Z.Y.; software, Z.Y.; validation, S.O.E., Z.Y. and J.K.; formal analysis, S.O.E. and Z.Y.; investigation, S.O.E.; resources, S.O.E., Z.Y. and J.K.; data curation, Z.Y.; writing—original draft preparation, S.O.E. and Z.Y.; writing—review and editing, S.O.E. and J.K.; visualization, S.O.E. and Z.Y.; supervision, J.K.; project administration, S.O.E. and J.K. All authors have read and agreed to the published version of the manuscript.

Funding

This research received no external funding.

Data Availability Statement

The data used in this study are available at: 1. system imbalance data, preprocessed imbalance data, and SOC, SOH, and capacity profiles for the 1, 5, and 15 min market resolutions for both Lithium-Iron-Phosphate and Redox-Flow batteries: https://depositonce.tu-berlin.de/items/85a56aac-1154-40ec-b447-819498aa1a45; 2. battery data were used as provided after ref. [27].

Conflicts of Interest

The authors declare no conflict of interest.

Abbreviations

DRESDistributed Renewable Energy Sources
BRPBalance Responsible Party
BESSBattery Energy Storage System
LFPLithium-Iron-Phosphate Battery
RFBRedox-Flow Battery
FCRFrequency Containment Reserve
M5BATModular Multi-Megawatt Multi-Technology Medium-Voltage Battery Energy Storage System
DoFDegree of Freedom
TSOTransmission System Operator
PCRPrimary Control Reserve
EPEXEuropean Power Exchange
CESAContinental Europe Synchronous Area
SOCState of Charge
NPVNet Present Value
MIPMarginal price for upward regulation
MDPMarginal price for downward regulation
ECMEquivalent Circuit Model
BMSBattery Management System
CFCash Flow
IRRInternal Rate of Return
PIProfitability Index
ROIReturn on Investment
LCOSLevelized Cost of Storage
LCOELevelized Cost of Electricity

References

  1. Balancing Energy. Available online: https://www.50hertz.com/en/Market/Balancingenergy (accessed on 9 February 2023).
  2. Veen, R.A.C.v.; Hakvoort, R.A. The electricity balancing market: Exploring the design challenge. Util. Policy 2016, 12, 186–194. [Google Scholar] [CrossRef]
  3. European Internal Energy Market. Available online: https://www.50hertz.com/en/Market/Europeaninternalenergymarket (accessed on 9 February 2023).
  4. The Balancing Energy Market Has Started. Available online: https://www.smard.de/page/en/topic-article/205458/196374 (accessed on 5 March 2023).
  5. Hannan, M.A.; Wali, S.B.; Ker, P.J.; Rahman, M.S.A.; Mansor, M.; Ramachandaramurthy, V.K.; Muttaqi, K.M.; Mahlia, T.M.I.; Dong, Z.Y. Battery energy-storage system: A review of technologies, optimization objectives, constraints, approaches, and outstanding issues. J. Energy Storage 2021, 10, 103023. [Google Scholar] [CrossRef]
  6. Thien, T.; Schweer, D.; vom Stein, D.; Moser, A.; Sauer, D.U. Real-world operating strategy and sensitivity analysis of frequency containment reserve provision with battery energy storage systems in the german market. J. Energy Storage 2017, 10, 143–163. [Google Scholar] [CrossRef]
  7. Divshali, P.H.; Evens, C. Optimum Operation of Battery Storage System in Frequency Containment Reserves Markets. IEEE Trans. Smart Grid 2020, 11, 4906–4915. [Google Scholar] [CrossRef]
  8. Zeh, A.; Müller, M.; Naumann, M.; Hesse, H.; Jossen, A.; Witzmann, R. Fundamentals of Using Battery Energy Storage Systems to Provide Primary Control Reserves in Germany. Batteries 2016, 2, 29. [Google Scholar] [CrossRef]
  9. Groza, E.; Kiene, S.; Linkevics, O.; Gicevskis, K. Modelling of Battery Energy Storage System Providing FCR in Baltic Power System after Synchronization with the Continental Synchronous Area. Energies 2022, 15, 3977. [Google Scholar] [CrossRef]
  10. Chasparis, G.; Pichler, M.; Natschlager, T. A Demand-Response Framework in Balance Groups through Direct Battery-Storage Control. In Proceedings of the 2019 18th European Control Conference (ECC), Naples, Italy, 25–28 June 2019; pp. 1392–1397. [Google Scholar] [CrossRef]
  11. Koltermann, L.; Jacqué, K.; Figgener, J.; Zurmühlen, S.; Sauer, D.U. Balancing group deviation & balancing energy costs due to the provision of frequency containment reserve with a battery storage system in Germany. Electr. Power Energy Syst. 2022, 142, 108327. [Google Scholar]
  12. Myovela, R.; Kato, T. Coordinated Control of Air-conditioning Load and Battery Energy Storage System for Improving Electricity Supply-demand Balancing. In Proceedings of the 2022 IEEE PES Innovative Smart Grid Technologies—Asia (ISGT Asia), Singapore, 21–24 November 2022; pp. 235–239. [Google Scholar] [CrossRef]
  13. Zakeri, B.; Syri, S.; Wagner, F. Economics of energy storage in the German electricity and reserve markets. In Proceedings of the 2017 14th International Conference on the European Energy Market (EEM), Dresden, Germany, 6–9 June 2017; pp. 1–6. [Google Scholar] [CrossRef]
  14. Zakeri, B.; Syri, S. Economy of electricity storage in the Nordic electricity market: The case for Finland. In Proceedings of the 11th International Conference on the European Energy Market (EEM14), Krakow, Poland, 28–30 May 2014; pp. 1–6. [Google Scholar] [CrossRef]
  15. Lackner, C.; Nguven, T.; Byrne, R.H.; Wiegandt, F. Energy Storage Participation in the German Secondary Regulation Market. In Proceedings of the 2018 IEEE/PES Transmission and Distribution Conference and Exposition (T&D), Denver, CO, USA, 16–19 April 2018; pp. 1–9. [Google Scholar] [CrossRef]
  16. Haupt, L.M. Centralised Battery Flexibility Assessment for Imbalance Management in Spain Considering Li-Ion Degradation Mechanism. Master’s Thesis, Escola Tècnica Superior d’Enginyeria Industrial de Barcelona, Universitat Politècnica de Catalunya, Barcelona, Spain, 2018. [Google Scholar] [CrossRef]
  17. Wirtz, N.; Monti, A. Battery Storage Utilization for Cost and Imbalance Reduction in a Balancing Group. In Proceedings of the 2018 IEEE PES Innovative Smart Grid Technologies Conference Europe (ISGT-Europe), Sarajevo, Bosnia and Herzegovina, 21–25 October 2018; pp. 1–6. [Google Scholar] [CrossRef]
  18. Poplavskaya, K.; Lago, J.; Strömer, S.; de Vries, L. Making the most of short-term flexibility in the balancing market: Opportunities and challenges of voluntary bids in the new balancing market design. Energy Policy 2021, 11, 112522. [Google Scholar] [CrossRef]
  19. Mazzi, N.; Pinson, P. 10–Wind power in electricity markets and the value of forecasting. In Renewable Energy Forecastinge; Kariniotakis, G., Ed.; Woodhead Publishing series in Energy: Sawston, UK, 2017; pp. 259–278. [Google Scholar]
  20. Tariffs for Maintaining and Restoring the Residual Balance of Individual Access Responsible Parties1. Available online: https://www.elia.be/-/media/project/elia/elia-site/customers/tarrifs-and-invoicing/tariffs-and-invoicing/en/grille-tarifaire-desequilibre-2022-en-v20220214s.pdf (accessed on 13 March 2023).
  21. aFRR Product Design Note. Available online: https://www.elia.be/-/media/project/elia/elia-site/electricity-market-and-system---document-library/balancing---balancing-services-and-bsp/2018/2018-design-note-afrr.pdf (accessed on 13 March 2023).
  22. Koch, C.; Hirth, L. Short-term electricity trading for system balancing: An empirical analysis of the role of intraday trading in balancing Germany’s electricity system. Renew. Sustain. Energy Rev. 2021, 10, 109275. [Google Scholar] [CrossRef]
  23. Keeping the Balance. Available online: https://www.elia.be/en/electricity-market-and-system/system-services/keeping-the-balance (accessed on 3 March 2023).
  24. Koch, C. Intraday imbalance optimization: Incentives and impact of strategic intraday bidding behavior. Energy Syst. 2022, 5, 81, 409–435. [Google Scholar] [CrossRef]
  25. Clò, S.; Fumagalli, E. The effect of price regulation on energy imbalances: A Difference in Differences design. Energy Econ. 2019, 6, 754–764. [Google Scholar] [CrossRef]
  26. Koch, C.; Maskos, P. Passive balancing through intraday trading. whether interactions between short-term trading and balancing stabilize Germany’s electricity system. Energy Econ. Policy 2020, 10, 101–112. [Google Scholar] [CrossRef]
  27. Möller, M.; Kucevic, D.; Collath, N.; Parlikar, A.; Dotzauer, P.; Tepe, B.; Englberger, S.; Jossen, A.; Hesse, H. SimSES: A holistic simulation framework for modeling and analyzing stationary energy storage systems. J. Energy Storage 2022, 05, 103743. [Google Scholar] [CrossRef]
  28. Energy Activated Volumes and Prices. Available online: https://www.elia.be/en/grid-data/balancing/energy-activated-volumes-and-prices-1-min?csrt=6416723377057158927 (accessed on 13 March 2023).
  29. Pape, C.; Hagemann, S.; Weber, C. Are fundamentals enough? Explaining price variations in the German day-ahead and intraday power market. Energy Econ. 2016, 2, 376–387. [Google Scholar] [CrossRef]
  30. Tsiropoulos, I.; Tarvydas, D.; Lebedeva, N. Li-ion batteries for mobility and stationary storage applications—Scenarios for costs and market growth. JRC Sci. Policy Rep. 2018, 19–20. [Google Scholar] [CrossRef]
Figure 1. Overview of the market framework.
Sustainability 15 15942 g001
Figure 2. An illustration of simulation and analysis models for SimSES—redrawn after ref [27].
Sustainability 15 15942 g002
Figure 3. Preprocessing flow chart of the imbalance data.
Sustainability 15 15942 g003
Figure 4. Model overview.
Sustainability 15 15942 g004
Figure 5. Comparative performance of the LFP and RFB batteries across three different intervals.
Sustainability 15 15942 g005
Figure 6. Heatmap showcasing the differences in the performance metrics of the LFP and RFB batteries.
Sustainability 15 15942 g006
Figure 7. Trend of energy throughput and equivalent full cycles per year of LFP and RFB.
Sustainability 15 15942 g007
Figure 8. Comparative economic performance of LFP and RFB batteries across three different intervals.
Sustainability 15 15942 g008
Figure 9. Heatmap showcasing the differences in economic metrics of LFP and RFB batteries.
Sustainability 15 15942 g009
Figure 10. Trend of benefit and LCOS of LFP across intervals.
Sustainability 15 15942 g010
Figure 11. LFP and RFB performance comparison of three market intervals.
Sustainability 15 15942 g011
Figure 12. Benefit vs. Equivalent full cycle for LFP and RFB.
Sustainability 15 15942 g012
Table 1. Average Imbalance Prices.
1 min5 min15 min
Ave. Pos. Price [€/MWh]−0.36960.19846.3029
Ave. Neg. Price [€/MWh]60.299460.392956.0886
Table 2. Simulation parameters.
Storage TechnologyPower/kWCapacity/kWhEPR/hSpecific Cost/EUR/kWhSystem Cost/EUR
LFP100010001473473,000
RFB100010001786786,000
Disclaimer/Publisher’s Note: The statements, opinions and data contained in all publications are solely those of the individual author(s) and contributor(s) and not of MDPI and/or the editor(s). MDPI and/or the editor(s) disclaim responsibility for any injury to people or property resulting from any ideas, methods, instructions or products referred to in the content.